using the idb analyzer v - european commission using the idb analyzer v andrés sandoval-hernández...
TRANSCRIPT

1
Using the IDB Analyzer V
Andrés Sandoval-Hernández – IEA DPC
Workshop on using PISA, PIAAC, TIMSS & PIRLS, TALIS datasets
Ispra, Italy- June 24-27, 2014
Note: These slides were prepared as part of the IEA training portfolio with the collaboration of IEA staff and resource persons.

2
Table of contents
• Evaluating statistical significance of mean differences with TIMSS
• Evaluating statistical significance of mean differences between countries with PISA

3
Mean Differences (TIMSS)
Is there a significant difference in mathematics
achievement for students from schools with
different emphasis on academic success?

4
What Do we Need to Do?
• Merge the data set for TIMSS 2011 by choosing the school and student background questionnaire and the selected countries
• Countries in the merged data file:
– Austria
– Denmark
– Netherlands
– Slovak Republic
– Spain
• Open Analysis Module

5
• Analysis File: C:\EU_Workshop\Work\TIMSS_Merged.sav
• Analysis Type: TIMSS (Using Student Weights)
• Statistic Type: Regression
• Create Contrast: Yes
• Contrast Type: Dummy Codding
• Number of Categories: 3
• Grouping variables: IDCNTRY
• Dependent variables: ASMMAT01-05
• Independent variables: ACDGEAS
• Weighting variable: TOTWGT
Analysis: Mean Differences (TIMSS)

6
SPSS: Run the analysis

7
Analysis : Results
In the NETHERLANDS, there are significant differences between students coming from schools with high and medium emphasis on academic success in comparison with schools with very high emphasis on academic success

8
Table of contents
• Evaluating statistical significance of mean differences with TIMSS
• Evaluating statistical significance of mean differences between countries with PISA

9
Mean Comparison between countries (PISA)
Is there a significant difference in the average
sense of belonging to school across countries?

10
What Do we Need to Do?
• Start the IDB Analyzer Analysis module using PISA 2012 merged data
• Countries have been merged in the data file:
– Austria
– Denmark
– Netherlands
– Slovak Republic
– Spain

11
Analysis: Mean Comparison between Countries (PISA)
•Analysis File: C:\EU_Workshop\Work\PISA_Merged.sav •Analysis Type: PISA Age 15 (Using Teacher Weights) •Statistic Type: Percentages and Means •Grouping Variable: CNT •Analysis Variable: BELONG •Weighting variable: W_FSTUWT

12
SPSS: Run the analysis

13
Country Analysis Variable N of
Cases
Sum of
Weight Variable
Sum of
Weight Variable
(s.e)
Percent Percent
(s.e) Mean
Mean
(s.e)
Standard
Deviation
Standard
Deviation
(s.e)
Austria BELONG 3,127 53,829 1,100.77 10.75 0.22 0.55 0.03 1.12 0.02
Denmark BELONG 4,789 41,930 1,290.80 8.37 0.25 -0.05 0.02 0.95 0.02
Spain BELONG 16,538 243,456 2,814.81 48.62 0.56 0.41 0.02 1.08 0.01
Netherlands BELONG 2,855 126,038 4,154.47 25.17 0.64 -0.03 0.02 0.84 0.02
Slovak Republic BELONG 3,052 35,450 1,072.05 7.08 0.21 -0.31 0.02 0.85 0.02
International Average BELONG - - - 20.00 0.19 0.11 0.01 0.97 0.01
Open the Excel file created by SPSS
Columns of interests: Country, Mean, Mean (s.e)

14
Using the standard error
• 95% Confidence interval for an estamated t:
• Standard error for the difference between countries A & B:
• Calculating the T-value for the difference between countries A & B:
s.e.(t)t;s.e.(t)t 22c.i. %95
22 ).(.).(.).(. BABA testesttes
)1,0().(.
Nttes
tt
BA
BA
15
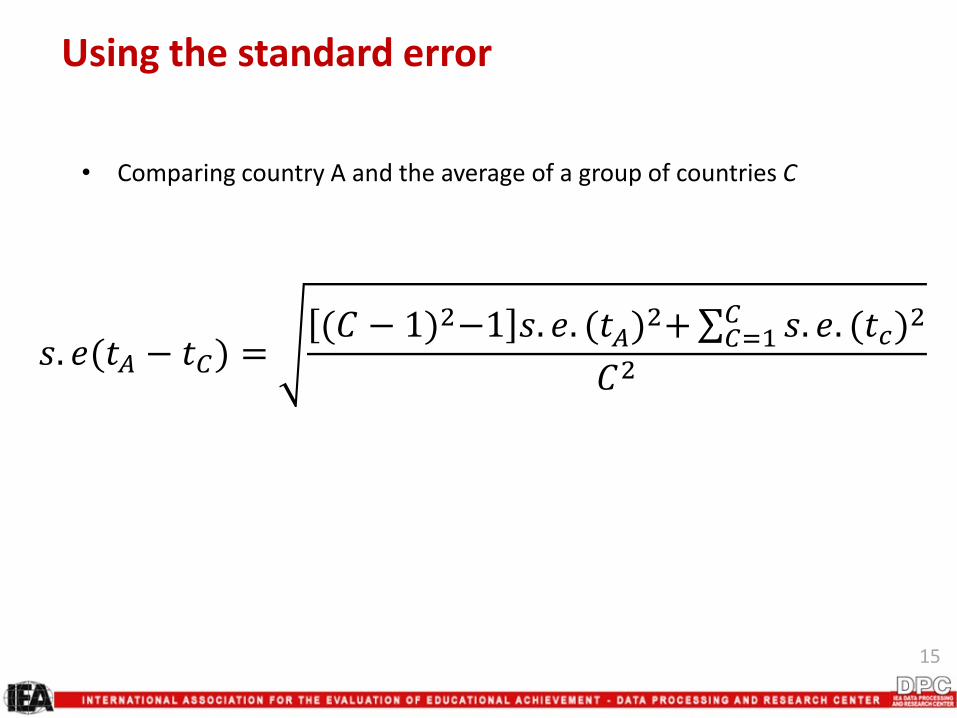
Using the standard error
• Comparing country A and the average of a group of countries C
𝑠. 𝑒(𝑡𝐴 − 𝑡𝐶) =(𝐶 − 1)2−1 𝑠. 𝑒. (𝑡𝐴)
2+ 𝑠. 𝑒. (𝑡𝑐)2𝐶
𝐶=1
𝐶2
16
Any Questions?
Thank you for your attention!