using the excel xp tagset and dde to create at-a-glance...
TRANSCRIPT

1
Paper RV-011
Using the Excel XP tagset and DDE to create At-A-Glance Summary Spreadsheets—Compiled, Written, and Formatted with one SAS® click!
Christine R. Kraft, The University of Alabama, Tuscaloosa, AL
ABSTRACT Using the Excel XP tagset is a quick and clean method for creating Excel spreadsheets with multiple tabs, various numbers of tables per tab, and formatting specific to individual sheets or cells. When an At-A-Glance summary page is needed in addition to these detailed views, it would be convenient to be able to simply copy and format some of the tables from various tabs into an appropriately-sized summary page. When a task such as this is repeated on a frequent basis and the created sheet has a relatively-fixed format, it makes sense to include this summary sheet creation into the SAS® program. In this paper, we will show how to make use of the EXCELXP tagset and its many options to create formatted tables in Excel. We will then show how to use Dynamic Data Exchange (DDE) to assemble a summary sheet for an At-A-Glance look at the detailed tables.
INTRODUCTION The Excel XP tagset allows us to output results from SAS and to format Excel spreadsheets during SAS run time. This translates to a reduction in formatting errors, a reduction in work time when used on a continued basis, and an increase in productivity. Adding DDE to the program can complete the report by allowing us to copy and paste from one sheet to another, format individual cells, add formulas to tables, and do almost anything that can be done in Excel from SAS. In this way, we can move towards producing a publishable report with one SAS click!
Figure 1: At-A-Glance Summary Sheet

2
Figure 1 is an example of an at-a-glance summary page created from several tables in the workbook using the Excel XP tagset and DDE. To begin, we will discuss the Excel XP tagset and its many options. Often, publishable reports can be made solely using this tagset without any additional manual interaction. However, when an at-a-glance summary page is also desired, we can use DDE to accomplish tasks from SAS during run time which otherwise might have to be done manually. We will begin by discussing the Excel XP tagset, then discuss DDE, and finish with an example of the capabilities of SAS using both.
SETTINGS In this paper, we use Base SAS 9.1.3, Microsoft® Office Excel® 2007, and the ExcelXP tagset version 1.86. The current, as well as previous, versions of the ExcelXP tagset are available for download from the SAS Knowledge Base website located at: http://support.sas.com/rnd/base/ods/odsmarkup. The tagset is created using PROC TEMPLATE and is shown in Figure 2 as it appears on the SAS website. Note that no knowledge of PROC TEMPLATE is required to update or use the ExcelXP tagset. The process for updating the ExcelXP tagset is simply to copy and paste the code into a blank SAS editor, or save the code as a SAS file, and submit the code. This will create or update the ExcelXP tagset. When used, the ExcelXP tagset will write a note in the SAS log indicating the current version number. The note is also shown in Figure 2.
Figure 2: ExcelXP tagset SAS code
ODS AND SAS OPTIONS We can use the ExcelXP tagset simply to export the results of our PROC PRINT, PROC TABULATE, or PROC REPORT without using any options. However, this would be doing the ExcelXP tagset and ourselves a great injustice because the ExcelXP tagset has so many useful options that can save us time and make our documents look much cleaner. To see what kind of output we would get using none of the tagset’s options, Example 1 shows the output

3
from running the given code. The first figure in Example 1 shows the default settings of the ExcelXP tagset, including the default style, the default title settings, and the default sheet naming conventions. That is, the default style is the gray background and the blue column headings. The default title settings place the titles and footnotes in the header and footer, respectively, which cannot be seen in the normal view of Excel. The default sheet name is “Table n – Data Set Set Name,” as shown in Example 1.
Example 1: Output using ExcelXP tagset with no options—using the default style and the printer style. The other Figure in Example 1 shows the same output with a different background and font styles. Although not an ExcelXP option, the ODS option STYLE can be used with the ExcelXP tagset. Styles can be customized or created using PROC TEMPLATE, but SAS has many styles built-in for use. To see the names of the built-in styles, type “odstemplates” into the dialog box in the upper left corner of SAS. Click on Sashelp.Tmplmst and then double click on Styles. The contents of Styles will display. See Figure 3. Double clicking any of the style names will load the Template browser. Unfortunately, it will not give you a preview of the style. To see examples of the styles, use them as in Example 1, replacing default with any other style name.
Other useful SAS options when using the ExcelXP tagset for outputting into Excel are those which set the margins and paper size in Excel. These options are intuitively named and straight-forward to use. RIGHTMARGIN, LEFTMARGIN, TOPMARGIN, and BOTTOMMARGIN set the right, left, top and bottom margins respectively using inches by default. Centimeters can also be used. See the following code. The PAPERSIZE option can also be used. The default is letter; legal can be specified. Alternately, width and height values can be submitted in inches (default) or centimeters. See the following code. options RightMargin = .5in LeftMargin = 1.25cm Papersize = legal;
ods tagsets.excelxp
style = default style = printer file ="c:\example1.xls";
proc print data = sashelp.shoes label noobs ; var subsidiary product sales inventory returns; title1 'Detailed Listing of Shoe Sales '; run ; ods tagsets.excelxp close;

4
Figure 3: Built-in SAS Styles
We can also use STYLE options within PROCs to output data in a certain format to Excel. For example, in order to center the row headings in a PROC TABULATE, we may write the following code:
proc tabulate data=sashelp.shoes missing; class subsidiary region; classlev subsidiary/style=[just=c]; var sales; table subsidiary='', n=''/box='Subsidiary'; title1 'Shoe Sales'; run;
However, built-in SAS number and character formats may not be outputted to Excel depending on the PROC used. PROC TABULATE and PROC REPORT do not send that information to Excel, although PROC PRINT does. In order to output our results in the desired formats, we will use the TAGATTR parameter within PROC REPORT and PROC TABULATE. We will discuss this parameter as if it is an ExcelXP option in the next section.
EXCELXP OPTIONS The ExcelXP tagset has 60 options as of its most current release. This may seem overwhelming to the novice ExcelXP tagset user, but fear not! The following list will provide an alphabetical list of some useful, simple options, including a reference to an example in which they are used. The examples will be shown throughout the listing.
ABSOLUTE_COLUMN_WIDTH = 'n2, n3, ... ' Sets the column width in Excel. The numbers correspond to each column in order. If '20', then all columns will be have a column width of 20 if there is more than one column. If '20, 30', the first column will have a width of 20, the second 30, the third 20, the fourth 30, and so on for the number of columns you have. You may use as many values as needed to accommodate the number of columns you have. If you have more values than you have columns, the extra are ignored. Note that PROC PRINT sends information through the ExcelXP tagset to set the column widths in Excel. PROC TABULATE and PROC REPORT do not. In any case, we can override the column widths set by any PROC using ABSOLUTE_COLUMN_WIDTH. (See Example 2, line 9.)

5
Embedded Footer
Footnote
Multiple Sheets
Example 2: ExcelXP Options and Multiple Sheets
1 %let footer_text = &LInstitutional Research and Assessment (C. Kraft) 2 
The University of Alabama 3 &R&fdate, Page &P of &N
&Z&F; 4 options topmargin=1in bottommargin=1in 5 leftmargin=.5in rightmargin=.5in; Footnote 6 ods tagsets.excelxp 7 file="c:\example2.xls" 8 style= Meadow 9 options(absolute_column_width="20" 10 center_horizontal = 'yes' 11 center_vertical = 'yes' 12 embedded_titles='yes' 13 embedded_footnotes='yes' Embedded Footer 14 fittopage = 'yes' 15 orientation='landscape' 16 print_footer="&footer_text" 17 scale = '80' 18 sheet_interval='none' 19 sheet_name='African Shoe Sales' Multiple Sheets 20 zoom = '80'); 21 22 proc tabulate data=sashelp.shoes missing style=[tagattr='format:$#,##0.00']; 23 class subsidiary region; 24 var sales; 25 table subsidiary='', sales*sum=''/box='Subsidiary'; 26 where region = 'Africa'; 27 title1 'Shoe Sales for Africa'; 28 footnote1 'This is an embedded footnote.'; run; 29 30 ods tagsets.excelxp 31 options(sheet_interval='none' 32 sheet_name='Canadian Shoe Sales'); 33 34 proc tabulate data=sashelp.shoes missing style=[tagattr='format:$#,##0.00']; 35 class subsidiary region; 36 var sales; 37 table subsidiary='', sales*sum=''/box='Subsidiary'; 38 where region = 'Canada'; 39 title1 'Shoe Sales for Canada'; run; 40 41 ods tagsets.excelxp close;

6
AUTOFIT_HEIGHT = 'yes': Automatically sets the row heights in Excel so that wrapped text can be seen. Default is no.
CENTER_HORIZONTAL = 'yes': Centers the results horizontally on the printed page. Default is no. (See Example 2, line 10.) CENTER_VERTICAL = 'yes': Centers the results vertically on the printed page. Default is no. (See Example 2, line 11.)
DEFAULT_COLUMN_WIDTH = 'n1, n2, ...': This option works the same way as absolute column width, but it can be overridden by procedures that send column width information to the printer. PROC REPORT and PROC TABULATE do NOT send column width information to the printer. PROC PRINT does. So, if you want to set column widths, you must use ABSOLUTE_COLUMN_WIDTH with PROC PRINT. (See Example 3, line 4.)
EMBEDDED_FOOTNOTES = 'yes': Embeds footnotes in the spreadsheet instead of putting them in the footer. Default is no. (See Example 2, line 13.)
EMBEDDED_TITLES = 'yes': Embeds titles in the spreadsheet instead of putting them in the header. (See Example 2, line 12 and Example 3, line 5.)
EMBED_TITLES_ONCE = 'yes': Embeds titles in the spreadsheet before the first table and not again, no matter how many tables are outputted to that sheet.
FITTOPAGE = 'yes': This option fits the output onto one page for printing. (See Example 2, line 14.) FROZEN_HEADERS = 'n': If 'Yes' the rows down to the bottom of the headers will be frozen when the table data scrolls. This includes any titles created with the embedded titles option. If a number is given, that is the row count that will be frozen.
ORIENTATION = 'landscape': The default for this option is portrait. (See Example 2, line 15 and Example 3, line 6.)
PAGES_FITHEIGHT = 'n': This option sets the number of pages to print to. If the number is in excess of the amount needed, the option has no effect. I often use this in conjunction with FITTOPAGE = 'yes' in order to get a width of one page. The PAGES_FITWIDTH option doesn't work for me. I don't know if it is a SAS 9.1.3 problem with the excelxp tagset or not.
PRINT_FOOTER = "&footer_text" : This option will print the footer in your excel file where footer_text is a macro variable with your footer text. You may use Excel option variables such as the following within your footer text. (See Example 2, line 1-3, 16.)
Newline: 
 Page Number: &P Pages: &N Date: &D Time: &T File Path: &Z File: &F Sheet Name: &A Left Align: &L Underline: &U Font Size: &8 Right Align: &R
ROW_HEIGHTS = 'n1, n2, n3, n4, n5, n6, n7': This option controls how tall the rows will be for each type of row. The numbers are in points as is used in Excel. The parameters of this option are positional, but not all values must be specified. A value of 0 means that the height should be taken from the style. The first value is the height for table header rows. The next is the height for the table body rows. The next value is the row height for bylines. The fourth is for titles, the fifth is for footers, the sixth is the pagebreak height, and the last value is the height for paragraph skip.
ROW_REPEAT = 'n1-n2': If a number is specified that row will be repeated across pages when a worksheet breaks across pages when printing. If a range such as '3-5' is given, that range of rows will be repeated. If 'header' is given, the table headers for the first table of the worksheet will be repeated.
SCALE = 'n': This option sets the scale of the document for printing. (See Example 2, line 17.)
SHEET_INTERVAL = 'none': The valid values for this option are 'none', 'table', 'proc', 'bygroup', and 'page'. The default is 'table', meaning that a new page is created for each new result. If you use the option SHEET_INTERVAL = 'table', you do not have control of the sheet names. The 'bygroup' option is helpful when you are outputting tables by group and want the sheet name to equal the by value. Use 'none' if you want to control when Excel starts a new tab. (See Example 2, line 18 and Example 3, line 7.)
SHEET_LABEL = 'Tab label': This option allows you to label a sheet something other than the SHEET_NAME. I only use this option when using SHEET_INTERVAL = 'bygroup'. In that case, we use SHEET_LABEL = 'none', and the SHEET_LABEL defaults to using the by group value. (See Example 3, line 8.)

7
SHEET_NAME = 'Tab name': This option allows you to name the current sheet. If you do not also specify a SHEET_LABEL, this is automatically the SHEET_LABEL. For a bygroup, use SHEET_NAME = 'none'. (See Example 2, line 19 and Example 3, line 9.)
SUPPRESS_BYLINES = 'yes': If 'Yes' Bylines will not appear in the worksheet. This is useful when you note the by group value somewhere else, such as in the title. (See Example 3, lines 10 and 20).
TAGATTR: Used in a STYLE option, the TAGATTR parameter is used to display a variable in an Excel format. Some examples of Excel formats are 0.00, #,##0.0, and $#,##0_);[Red]($#,##0). (See Example 2, lines 22 and 34 and Example 3, line 17).
ZOOM = 'n': This option sets the "zoom view" in Excel's View menu. (See Example 2, line 20.)
Example 3: More ExcelXP Options
Multiple tabs can be created in several ways as discussed under the sheet_interval option. To discuss this in more detail, note that if we did not change the sheet_interval option from its default of TABLE, each time a procedure created a new table, a new sheet would be created. Each tab would have the options set initially. If we set the sheet_interval option to PROC or BYGROUP as we did in Example 3, each time a new procedure ran and produced output or each time the by group variable value changed, respectively, a new sheet would be created, again using the options set initially.
Example 2 creates two sheets by calling the ODS ExcelXP tagset after outputting the first table to Excel. When Example 2 calls the ODS the second time, it names the sheet and sets the sheet_interval to NONE. Note that the options set in the ExcelXP tagset remain set through the duration of the run. They do not return to their defaults when starting a new worksheet. In Example 2, even though the option orientation was not set for the second sheet, since orientation was set to landscape for the first sheet, the orientation of the second sheet remains landscape. In order to change that, we would need to set orientation in the options section of the second call to the ODS.
1 ods tagsets.excelxp 2 file="c:\example3.xls" 3 style= journal 4 options(default_column_width= "15, 10" 5 embedded_titles= 'yes' 6 orientation= 'portrait' 7 sheet_interval= 'bygroup' 8 sheet_label= 'none' 9 sheet_name= 'none' 10 suppress_bylines = 'yes'); 11 12 proc tabulate data=sashelp.shoes missing; 13 class subsidiary region; 14 classlev subsidiary/style=[just=c]; 15 var sales; 16 table subsidiary='',sales*sum='' 17 *[style=[tagattr='format:$#,##0' 18 just=c]]/box='Subsidiary'; 19 by region; 20 title1 'Shoe Sales for #byval1'; 21 run; 22 ods tagsets.excelxp close;

8
DYNAMIC DATA EXCHANGE (DDE) DDE uses the Excel 4 Macro (X4ML) language to communicate from SAS to Excel. This is a sometimes tedious way to accomplish tasks, which is why performing as much formatting as possible using the ExcelXP tagset prior to using DDE will make your programs shorter and more user-friendly. Furthermore, if the Excel task to be accomplished by DDE is not being used multiple times or the layout of the output to be altered by DDE may change depending on the SAS run, DDE may not improve performance time. This is due to the rather painstaking amount of coding necessary. Thus, an analysis of time to code versus time to perform the tasks manually and check for errors may be appropriate. Perhaps the most appropriate tasks to be performed by DDE are those done on a spreadsheet that does not change in layout and that is updated on a repeating basis. An example of this for the Office of Institutional Research at the University of Alabama is At-A-Glance Enrollment Summaries. Prior to delving into this particular topic, we show how to engage DDE from SAS. Note that in order to use DDE, both SAS and Excel must be open. The following block of code activates Excel by calling the executable file. This may vary by computer. It then puts SAS to sleep for five seconds while Excel opens. The filename statement creates a reference to Excel. The final data step opens the file given by the macro variables dir\fname. This block of code opens Excel and the file we intend to alter using DDE. In order to make any alterations to the file, we need to explore the X4ML commands. /*Activate Excel*******************************************************/ options noxsync noxwait; %let xlsCmdPath = C:\Program Files\Microsoft Office\Office12\EXCEL.EXE; x "'&xlsCmdPath'"; data _null_; rc = sleep(5); run; /*Create a reference to Excel*****************************************/ filename sas2xl dde 'excel|system'; /*Open the file you just created**************************************/ data _null_; file sas2xl; put '[error(false)]'; put '[OPEN("'"&dir"'\'"&fname"'")]'; run;
The following is a list of commands to use in DDE, along with comments regarding what each accomplishes. A complete guide detailing all of the X4LM commands is available for download at http://support.microsoft.com/kb/128185, but only the following are used in the program used to create an At-A-Glance Summary in Appendix A. Activate: ACTIVATE(window_text) put '[WORKBOOK.ACTIVATE("Enrollment")]'; /*Activates sheet named Enrollment.*/ Alignment: ALIGNMENT(horiz_align, wrap, vert_align, orientation, add_indent) put '[alignment(7)]'; /* Center across selection.*/ put '[alignment(2,false)]'; /* Align left, do not wrap text.*/ put '[alignment(4,false)]'; /* Align right, wrap text.*/ For more alignment styles, see guide. Borders: BORDER(outline, left, right, top, bottom, shade, outline_color, left_color, right_color, top_color, bottom_color)
put'[border(0,0,0,0,0)]'; /* Clear borders*/ put'[border(0,0,0,1,1)]'; /* Set top and bottom border*/ put'[border(0,0,0,0,1)]'; /* Set bottom border */
For more line styles, see guide. Clear: CLEAR(type_num) put '[clear(1)]'; /* Clears all */ put '[clear(2)]'; /* Clears formats */ put '[clear(3)]'; /* Clears contents */
Column Width: COLUMN.WIDTH(width_num, reference, standard, type_num, standard_num) put '[column.width(28,"c1")]'; /*Sets the column width of column 1 to 28.*/ put '[column.width(9,"c2:c17")]'; /*Sets column width of columns 2 to 17 to 9.*/ Copy: COPY(from_reference, to_reference)

9
put '[copy("r19c2:r26c5")]'; /* Copies cells specified.*/ Delete: EDIT.DELETE(shift_num)
put '[EDIT.DELETE(1)]'; /* Shifts cells left.*/ put '[EDIT.DELETE(2)]'; /* Shifts cells up.*/ put '[EDIT.DELETE(3)]'; /* Deletes entire row.*/ put '[EDIT.DELETE(4)]'; /* Deletes entire column.*/
Format Font: FORMAT.FONT(name_text, size_num, bold, italic, underline, strike, color, outline, shadow)
put '[FORMAT.FONT("Arial", 11, true)]'; /* Makes the selected text font = Arial, size = 11, and bold=true.*/ put '[FORMAT.FONT("Arial", 11, true, , , , 3)]'; /* Same as above, also red.*/
You can find Excel color numbers here: http://www.mvps.org/dmcritchie/excel/colors.htm. Format Number: FORMAT.NUMBER(format_text)
put '[FORMAT.NUMBER("#,##0.0")]'; /* Applies formatting to selected cell.*/ put '[FORMAT.NUMBER("0.0%")]';
Formula: FORMULA(formula_text, reference)
put '[FORMULA("Title")]'; /* Enters the word Title in the selected cell.*/ put '[FORMULA("Title","r3c4")]'; /* Enters the word Title in row 3, column 4.*/ put '[FORMULA("=r2c2/r2c5*100")]';/* Enters the formula in the selected cell.*/
Page Setup: PAGE.SETUP(head, foot, left, right, top, bot, hdng, grid, h_cntr, v_cntr, orient, paper_size, scale, pg_num, pg_order, bw_cells, quality, head_margin, foot_margin, notes, draft) put '[PAGE.SETUP(, , .25, .25, .25, .4, , , true, true, 2, , true)]';
Insert: INSERT(shift_num)
put '[INSERT(1)]'; /* Shifts cells right.*/ put '[INSERT(2)]'; /* Shifts cells down.*/ put '[INSERT(3)]'; /* Shifts entire row.*/ put '[INSERT(4)]'; /* Shifts entire column.*/
Insert: WORKBOOK.INSERT(type_num) put '[WORKBOOK.insert(1)]'; /* Inserts a new tab in front of the current tab*/
Paste: PASTE(to_reference) put '[paste()]'; /* Pastes onto the selected area.*/
put '[paste("r3c4")]'; /* Pastes starting at row 3, column 4.*/ Paste: PASTE.LINK( ) put '[paste.link()]'; /* Pastes links to copied area.*/ Paste: PASTE.SPECIAL(paste_num, operation_num, skip_blanks, transpose) put '[paste.special(4)]'; /* Pastes the formats.*/ (For more paste options, see guide.)
Patterns: PATTERNS(apattern, afore, aback, newui) put '[patterns(1, ,6)]'; /*Fills current cell with solid(1) color yellow(6).*/
Save: SAVE( ) put '[save()]'; /* Saves Excel file.*/
Select: SELECT(selection)
put '[SELECT("r3c4")]'; /* Selects row 3, column 4.*/ put '[SELECT("r5c1:r6c2")]'; /* Selects row 5, column 1 to row 6, column 2.*/
Zoom: ZOOM(magnification) put '[zoom("75")]'; /* Zooms view to 75%. */
AT-A-GLANCE SUMMARY PROGRAM After outputting a multi-sheet detailed report using the ExcelXP tagset, we can use DDE to create a summary page. We do this by using the Excel file containing the report and the X4ML commands above to select, copy, paste, and format into an At-A-Glance Summary Sheet. Figure 4 shows the file output from the SAS program in Appendix A prior to using DDE. It has three sheets, each with a detailed look at enrollment.

10
Figure 4: Excel Workbook created using ExcelXP tagset Using DDE and the workbook shown in Figure 4, we can update the workbook with a new worksheet using tables from the three original sheets and Excel formatting. This At-A-Glance sheet in Figure 5 is a publishable report. See Appendix A for the SAS code, which is a compilation of the techniques presented in this paper. For the aggregated data sets, contact the author.
Figure 5: At-A-Glance Summary Sheet
CONCLUSION The ExcelXP tagset is a wonderful tool to aid in producing publishable reports from SAS during run time. And in many instances, it can do just that. However, when a summary sheet compiling data from multiple tables into one At-A-Glance summary view is desired, alternate means are necessary to accomplish this undertaking from SAS during run time. In this paper, we use DDE to complete the task. Recording or writing macros in Visual Basic in Excel and then calling those macros from SAS during run time would be another appropriate method for completing this summary page.

11
REFERENCES Gebhart, Eric S. “The Devil Is in the Details: Styles, Tips, and Tricks That Make Your Microsoft Excel Output Look Great!,”, SGF (2008), http://www2.sas.com/proceedings/forum2008/036-2008.pdf. Microsoft Corporation (no author specified) “Microsoft Excel Function Reference”. Document Number AB26298-0592, 1992. Available at http://support.microsoft.com/kb/128185. SAS Institute Inc., SAS Technical Report P-258, Using the REPORT Procedure in a Nonwindowing Environment, Release 6.07, Cary, NC: SAS Institute Inc., 1993. Available at http://support.sas.com/documentation/onlinedoc/v82/techreport_p258.pdf. SAS Institute Inc., SAS Technical Paper, Using Style Elements in the REPORT and TABULATE Procedures, Cary, NC: SAS Institute Inc., Available at http://support.sas.com/resources/papers/stylesinprocs.pdf. Vyverman, Koen. “Creating Custom Excel Workbooks from Base SAS with Dynamic Data Exchange: A Complete Walkthrough”. Proceedings of the Twenty-Seventh Annual SAS Users Group International Conference, paper 190, 2002. Vyverman, Koen. “Using Dynamic Data Exchange to Export Your SAS® Data to MS Excel – Against All ODS, Part I”. Proceedings of the Twenty-Sixth Annual SAS Users Group International Conference, paper 11, 2001.
RECOMMENDED READING Andrews, Rick. “Printable Spreadsheets Made Easy: Utilizing the SAS Excel XP Tagset”. Proceedings of the 2008 Northeast SAS Users Group Conference, paper AP06, 2008.
CONTACT INFORMATION Your comments and questions are valued and encouraged. For comments, questions, SAS code, SAS styles, or data sets specific to this paper, contact the author at:
Christine R. Kraft Office of Institutional Research and Assessment The University of Alabama Box 870166 Tuscaloosa, AL 35487 [email protected]
SAS and all other SAS Institute Inc. product or service names are registered trademarks or trademarks of SAS Institute Inc. in the USA and other countries. ® indicates USA registration. Other brand and product names are trademarks of their respective companies.

12
APPENDIX A: ENROLLMENT AT-A-GLANCE CODE ***********************************************************; %let progr=Enrollment_summary.sas; %let dir=P:\SAS; %let fname=Enrollment_summary.xls; %let term=FALL; %let year=2008; %let year_term=200840; %let footer_text =&LInstitutional Research and Assessment (C. Kraft) 
The University of Alabama &R&fdate, Page &P of &N
&Z&F; ************************************************************; libname oira "&dir"; proc format; value $college '1'='Arts & Sciences' '2'='Commerce & Business' '3'='Comm & Info Scs' '4'='CCHS' '5'='Continuing Educ' '6'='Education' '7'='Engineering' '8'='Graduate School' '9'='Human Environmental Scs' '91'='Law' '92'='Nursing' '93'='Social Work'; value $status '1' = 'TOTAL' '2' = 'FULL-TIME' '3' = 'PART-TIME' '4' = 'FULL-TIME EQUIVALENT (FTE)'; value $level '1' = 'UG' '2' = 'GR' '3' = 'PROF'; value $sex '1' = 'Male' '2' = 'Female'; value $race '1' = 'White' '2' = 'African-American' '3' = 'Asian/Pacific Island' '4' = 'Hispanic' '5' = 'Am Indian/Alas N' '6' = 'Non-Res Alien' '7' = 'Unreported'; run; options missing=''; ods tagsets.excelxp file="&dir\&fname" style = uaOIRA options(sheet_interval='none' embedded_titles='yes' print_footer="&footer_text" center_horizontal='yes' fittopage='yes' sheet_name='Enrollment at a Glance' orientation = 'landscape'); /* Just a fake procedure so that we have a "blank" sheet for doing the summary on. */ proc sql; select count(*)
from oira.enrollment where status = '5'; quit;
ods tagsets.excelxp options(sheet_interval='none' sheet_name='Enrollment by College' default_column_width="18,6,6,6,6,6,6,6,6,6,6,6,6,6,6,6,6" orientation = 'landscape'); title3 "Enrollment by College, &term &year"; proc tabulate data=oira.enrollment style=[tagattr='format:#,##0']; format college $college. status $status. level $level.; class college status level; var enroll; table college='' all='Total', status=''*(level='' all='Total')*(enroll=''*sum=''); run;

13
ods tagsets.excelxp options(sheet_interval='none' sheet_name='Distribution by Sex' default_column_width="6" orientation='portrait'); title3 "Distribution by Sex, &term &year"; proc tabulate data=oira.gender_enrollment style=[tagattr='format:#,##0']; format lev $level. sex $sex.; class lev sex; var enroll; table sex='' all='Total', (lev='' all='Total')*(enroll=''*sum='')/box='SEX'; run; title3 "Percent Distribution by Sex, &term &year"; proc tabulate data=oira.gender_enrollment style=[tagattr='format:#,##0.0']; format lev $level. sex $sex.; class lev sex; var enroll; table sex='', lev=''*(enroll=''*colpctsum='') enroll=''*reppctsum='TOTAL'/box='SEX'; run; options missing='0'; ods tagsets.excelxp options(sheet_interval='none' sheet_name='Distribution by Race' default_column_width="16, 5, 5, 5, 5"); title3 "Distribution by Race, &term &year"; proc tabulate data=oira.race_enrollment style=[tagattr='format:#,##0']; format lev $level. race $race.; class lev race; var enroll; table race='' all='Total', (lev='' all='Total')*(enroll=''*sum='')/box='RACE'; run; title3 "Percent Distribution by Race, &term &year"; proc tabulate data=oira.race_enrollment style=[tagattr='format:#,##0.0']; format lev $level. race $race.; class lev race; var enroll; table race='' , lev=''*(enroll=''*colpctsum='') enroll=''*reppctsum='TOTAL'/box='RACE'; run; ods tagsets.excelxp close; /*Activate Excel******************************************************************/ options noxsync noxwait; %let xlsCmdPath = C:\Program Files\Microsoft Office\Office12\EXCEL.EXE; x "'&xlsCmdPath'"; data _null_; rc = sleep(5); run; /*Create a reference to Excel ***************************************************/ filename sas2xl dde 'excel|system'; /*Open the file you just created***************************************************/ data _null_; file sas2xl; put '[error(false)]'; put '[OPEN("'"&dir"'\'"&fname"'")]'; run; /*Move, copy, format cells, etc. in the file***************************************/

14
data _null_; file sas2xl; put '[WORKBOOK.ACTIVATE("Enrollment by College")]'; put '[select("r5c1:r6c1")]'; put '[edit.delete(2)]';/*shift cells up*/ put '[select("r5c1")]'; put '[insert(2)]'; put '[insert(2)]';/*shift cells down*/ put '[select("r5c1")]'; put '[formula("COLLEGE/SCHOOL")]'; put '[select("r5c1")]'; put '[FORMAT.FONT("Arial", 11, true)]';/*bold*/ put '[select("r7c2:r19c17")]'; put '[FORMAT.FONT("Arial", 11, false)]'; put '[select("r7c5:r19c5, r7c9:r19c9, r7c13:r19c13, r7c17:r19c17, r19c1:r19c17")]'; put '[FORMAT.FONT("Arial", 11, true)]';/*bold*/ put '[column.width(6.5,"c2:c17")]';/*set column width for columns 2-17*/ put '[select("r19")]'; put '[insert(2)]';/*shift cells down*/ put '[select("r21")]'; put '[insert(2)]';/*shift cells down*/ put '[select("r21c1")]'; put '[FORMAT.FONT("Arial", 11, true, , , , 3)]';/*bold,red*/ put '[formula("% of Total")]'; /*write formulas to certain cells*/ put '[select("r21c2")]'; put '[formula("=r20c2/r20c5*100")]'; put '[select("r21c3")]'; put '[formula("=r20c3/r20c5*100")]'; put '[select("r21c4")]'; put '[formula("=r20c4/r20c5*100")]'; put '[select("r21c5")]'; put '[formula("=r20c5/r20c5*100")]'; put '[select("r21c6")]'; put '[formula("=r20c6/r20c5*100")]'; put '[select("r21c7")]'; put '[formula("=r20c7/r20c5*100")]'; put '[select("r21c8")]'; put '[formula("=r20c8/r20c5*100")]'; put '[select("r21c9")]'; put '[formula("=r20c9/r20c5*100")]'; put '[select("r21c10")]'; put '[formula("=r20c10/r20c5*100")]'; put '[select("r21c11")]'; put '[formula("=r20c11/r20c5*100")]'; put '[select("r21c12")]'; put '[formula("=r20c12/r20c5*100")]'; put '[select("r21c13")]'; put '[formula("=r20c13/r20c5*100")]'; put '[select("r21c14")]'; put '[formula("=r20c14/r20c5*100")]'; put '[select("r21c15")]'; put '[formula("=r20c15/r20c5*100")]'; put '[select("r21c16")]'; put '[formula("=r20c16/r20c5*100")]'; put '[select("r21c17")]'; put '[formula("=r20c17/r20c5*100")]'; put '[select("r21c2:r21c17")]'; put '[FORMAT.NUMBER("#,##0.0")]'; put '[FORMAT.FONT("Arial", 11, true, , , , 3)]';/*bold,red*/ put '[select("r5c1:r21c17")]'; put'[border(0,0,0,0,0)]';/*clear borders*/ put '[select("r5c1")]'; put'[border(1)]';/*border=outline*/ put '[select("r6c1")]'; put'[border(1)]'; put '[select("r7c1:r18c1")]'; put'[border(1)]'; put '[select("r19c1:r21c1")]'; put'[border(1)]'; put '[select("r5c2:r5c5")]'; put'[border(1)]'; put '[select("r5c6:r5c9")]'; put'[border(1)]'; put '[select("r5c10:r5c13")]'; put'[border(1)]'; put '[select("r5c14:r5c17")]'; put'[border(1)]'; put '[select("r6c2:r5c5")]'; put'[border(1)]'; put '[select("r6c6:r5c9")]'; put'[border(1)]'; put '[select("r6c10:r5c13")]'; put'[border(1)]'; put '[select("r6c14:r5c17")]'; put'[border(1)]'; put '[select("r7c2:r18c5")]'; put'[border(1)]'; put '[select("r7c6:r18c9")]'; put'[border(1)]'; put '[select("r7c10:r18c13")]'; put'[border(1)]'; put '[select("r7c14:r18c17")]'; put'[border(1)]'; put '[select("r19c2:r21c5")]'; put'[border(1)]'; put '[select("r19c6:r21c9")]'; put'[border(1)]'; put '[select("r19c10:r21c13")]'; put'[border(1)]'; put '[select("r19c14:r21c17")]'; put'[border(1)]'; put '[select("r1c1")]'; put '[save()]'; put '[workbook.activate("Distribution by Sex")]';/*switch sheets*/ put '[select("r5c1")]'; put '[FORMAT.FONT("Arial", 11, true)]'; put '[select("r6c2:r9c5")]'; put '[FORMAT.FONT("Arial", 11, false)]';
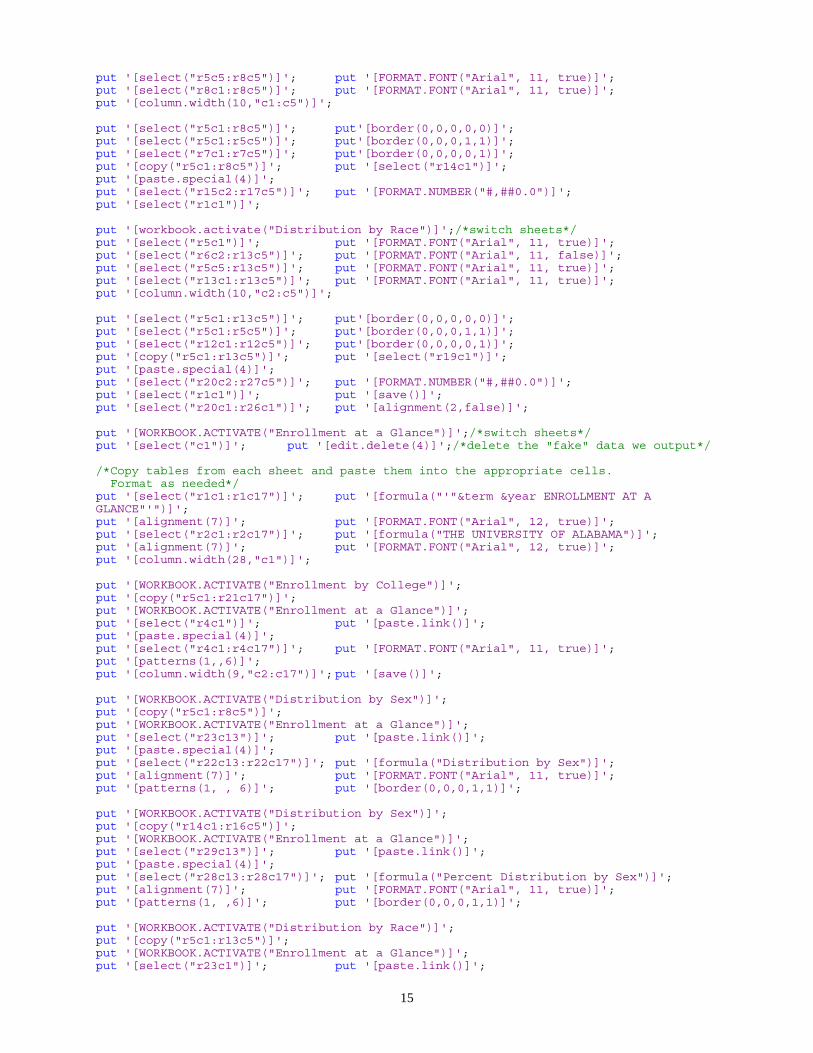
15
put '[select("r5c5:r8c5")]'; put '[FORMAT.FONT("Arial", 11, true)]'; put '[select("r8c1:r8c5")]'; put '[FORMAT.FONT("Arial", 11, true)]'; put '[column.width(10,"c1:c5")]'; put '[select("r5c1:r8c5")]'; put'[border(0,0,0,0,0)]'; put '[select("r5c1:r5c5")]'; put'[border(0,0,0,1,1)]'; put '[select("r7c1:r7c5")]'; put'[border(0,0,0,0,1)]'; put '[copy("r5c1:r8c5")]'; put '[select("r14c1")]'; put '[paste.special(4)]'; put '[select("r15c2:r17c5")]'; put '[FORMAT.NUMBER("#,##0.0")]'; put '[select("r1c1")]'; put '[workbook.activate("Distribution by Race")]';/*switch sheets*/ put '[select("r5c1")]'; put '[FORMAT.FONT("Arial", 11, true)]'; put '[select("r6c2:r13c5")]'; put '[FORMAT.FONT("Arial", 11, false)]'; put '[select("r5c5:r13c5")]'; put '[FORMAT.FONT("Arial", 11, true)]'; put '[select("r13c1:r13c5")]'; put '[FORMAT.FONT("Arial", 11, true)]'; put '[column.width(10,"c2:c5")]'; put '[select("r5c1:r13c5")]'; put'[border(0,0,0,0,0)]'; put '[select("r5c1:r5c5")]'; put'[border(0,0,0,1,1)]'; put '[select("r12c1:r12c5")]'; put'[border(0,0,0,0,1)]'; put '[copy("r5c1:r13c5")]'; put '[select("r19c1")]'; put '[paste.special(4)]'; put '[select("r20c2:r27c5")]'; put '[FORMAT.NUMBER("#,##0.0")]'; put '[select("r1c1")]'; put '[save()]'; put '[select("r20c1:r26c1")]'; put '[alignment(2,false)]'; put '[WORKBOOK.ACTIVATE("Enrollment at a Glance")]';/*switch sheets*/ put '[select("c1")]'; put '[edit.delete(4)]';/*delete the "fake" data we output*/ /*Copy tables from each sheet and paste them into the appropriate cells. Format as needed*/ put '[select("r1c1:r1c17")]'; put '[formula("'"&term &year ENROLLMENT AT A GLANCE"'")]'; put '[alignment(7)]'; put '[FORMAT.FONT("Arial", 12, true)]'; put '[select("r2c1:r2c17")]'; put '[formula("THE UNIVERSITY OF ALABAMA")]'; put '[alignment(7)]'; put '[FORMAT.FONT("Arial", 12, true)]'; put '[column.width(28,"c1")]'; put '[WORKBOOK.ACTIVATE("Enrollment by College")]'; put '[copy("r5c1:r21c17")]'; put '[WORKBOOK.ACTIVATE("Enrollment at a Glance")]'; put '[select("r4c1")]'; put '[paste.link()]'; put '[paste.special(4)]'; put '[select("r4c1:r4c17")]'; put '[FORMAT.FONT("Arial", 11, true)]'; put '[patterns(1,,6)]'; put '[column.width(9,"c2:c17")]'; put '[save()]'; put '[WORKBOOK.ACTIVATE("Distribution by Sex")]'; put '[copy("r5c1:r8c5")]'; put '[WORKBOOK.ACTIVATE("Enrollment at a Glance")]'; put '[select("r23c13")]'; put '[paste.link()]'; put '[paste.special(4)]'; put '[select("r22c13:r22c17")]'; put '[formula("Distribution by Sex")]'; put '[alignment(7)]'; put '[FORMAT.FONT("Arial", 11, true)]'; put '[patterns(1, , 6)]'; put '[border(0,0,0,1,1)]'; put '[WORKBOOK.ACTIVATE("Distribution by Sex")]'; put '[copy("r14c1:r16c5")]'; put '[WORKBOOK.ACTIVATE("Enrollment at a Glance")]'; put '[select("r29c13")]'; put '[paste.link()]'; put '[paste.special(4)]'; put '[select("r28c13:r28c17")]'; put '[formula("Percent Distribution by Sex")]'; put '[alignment(7)]'; put '[FORMAT.FONT("Arial", 11, true)]'; put '[patterns(1, ,6)]'; put '[border(0,0,0,1,1)]'; put '[WORKBOOK.ACTIVATE("Distribution by Race")]'; put '[copy("r5c1:r13c5")]'; put '[WORKBOOK.ACTIVATE("Enrollment at a Glance")]'; put '[select("r23c1")]'; put '[paste.link()]';

16
put '[paste.special(4)]'; put '[save()]'; put '[select("r22c1:r22c5")]'; put '[formula("Distribution by Race")]'; put '[alignment(7)]'; put '[FORMAT.FONT("Arial", 11, true)]'; put '[patterns(1, , 6)]'; put '[border(0,0,0,1,1)]'; put '[select("r22c7:r31c7")]'; put '[alignment(2,false)]'; put '[WORKBOOK.ACTIVATE("Distribution by Race")]'; put '[copy("r19c1:r26c5")]'; put '[WORKBOOK.ACTIVATE("Enrollment at a Glance")]'; put '[select("r23c7")]'; put '[paste.link()]'; put '[paste.special(4)]'; put '[save()]'; put '[select("r22c7:r22c11")]'; put '[formula("Percent Distribution by Race")]'; put '[alignment(7)]'; put '[FORMAT.FONT("Arial", 11, true)]'; put '[patterns(1, , 6)]'; put '[border(0,0,0,1,1)]'; put '[select("r18, r5c1")]'; put '[clear(3)]'; put '[select("r1c1")]'; put '[zoom("75")]'; put '[PAGE.SETUP(, , .25, .25, 1, .4, , , true, , 2, , true)]'; put '[save()]';run; data _null_; file sas2xl; put '[quit()]';run;