using the daysimeter: what can we measure?...to 500 lux, and has retrofitted lighting in one...
TRANSCRIPT

11© 2007 Rensselaer Polytechnic Institute. All rights reserved.
Using the Daysimeter:Using the Daysimeter:What can we measure?What can we measure?
John D. Bullough, Ph.D. John D. Bullough, Ph.D. March 7, 2007March 7, 2007

22© 2007 Rensselaer Polytechnic Institute. All rights reserved.
OutlineOutline
Conventional illuminance measurementsConventional illuminance measurementsSpectral power distribution Spectral power distribution ““analyzeranalyzer””Circadian stimulus/response measurementCircadian stimulus/response measurementTemporal analysesTemporal analyses
33© 2007 Rensselaer Polytechnic Institute. All rights reserved.
Conventional illuminance Conventional illuminance measurementsmeasurements
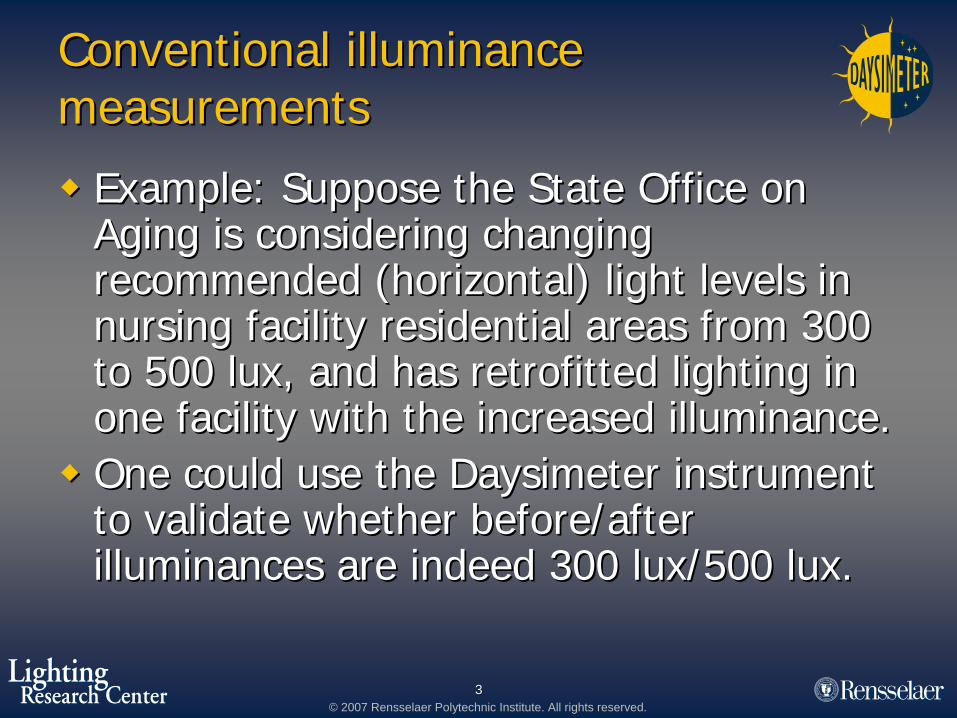
Example: Suppose the State Office on Example: Suppose the State Office on Aging is considering changing Aging is considering changing recommended (horizontal) light levels in recommended (horizontal) light levels in nursing facility residential areas from 300 nursing facility residential areas from 300 to 500 lux, and has retrofitted lighting in to 500 lux, and has retrofitted lighting in one facility with the increased illuminance.one facility with the increased illuminance.One could use the Daysimeter instrument One could use the Daysimeter instrument to validate whether before/after to validate whether before/after illuminances are indeed 300 lux/500 lux.illuminances are indeed 300 lux/500 lux.

44© 2007 Rensselaer Polytechnic Institute. All rights reserved.
Spectral response for illuminance Spectral response for illuminance measurementsmeasurements
The response of the The response of the DaysimeterDaysimeter’’ss photopic sensor is within that found in photopic sensor is within that found in commercially available illuminance meters.commercially available illuminance meters.
55© 2007 Rensselaer Polytechnic Institute. All rights reserved.
Spectral power distribution Spectral power distribution "analyzer""analyzer"
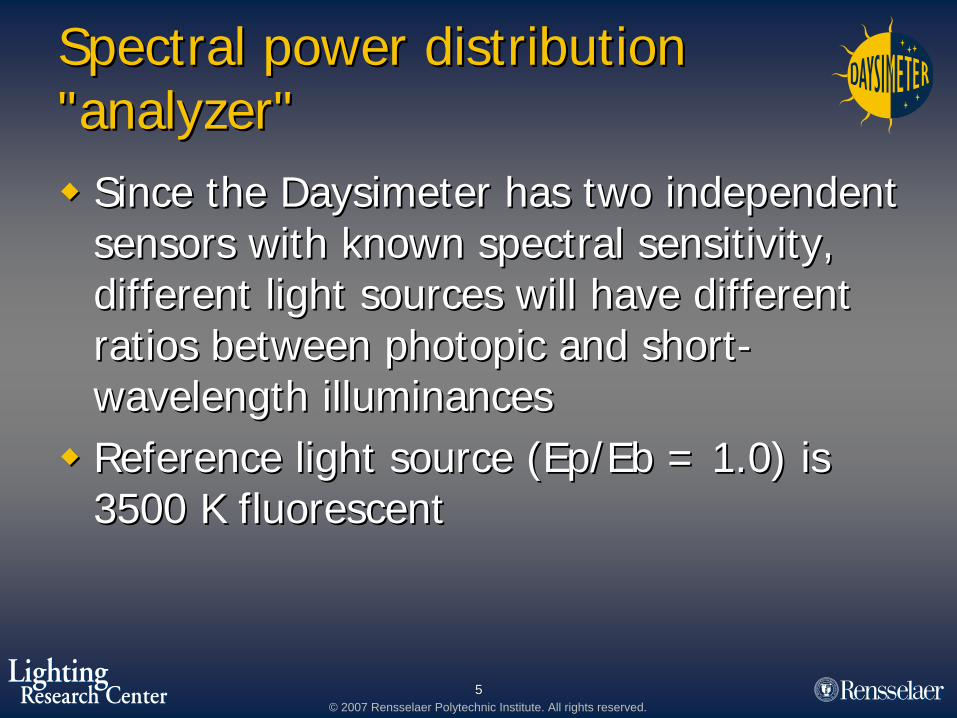
Since the Daysimeter has two independent Since the Daysimeter has two independent sensors with known spectral sensitivity, sensors with known spectral sensitivity, different light sources will have different different light sources will have different ratios between photopic and shortratios between photopic and short--wavelength illuminanceswavelength illuminancesReference light source (Reference light source (Ep/EbEp/Eb = 1.0) is = 1.0) is 3500 K fluorescent3500 K fluorescent
66© 2007 Rensselaer Polytechnic Institute. All rights reserved.
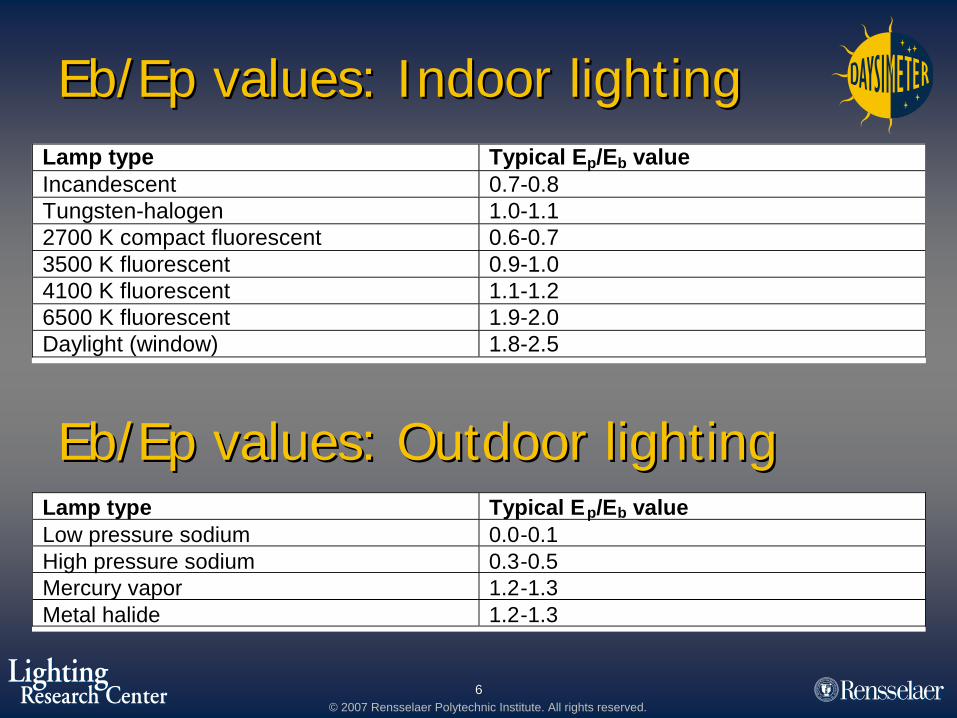
Eb/EpEb/Ep values: Indoor lightingvalues: Indoor lightingLamp type Typical Ep/Eb value Incandescent 0.7-0.8 Tungsten-halogen 1.0-1.1 2700 K compact fluorescent 0.6-0.7 3500 K fluorescent 0.9-1.0 4100 K fluorescent 1.1-1.2 6500 K fluorescent 1.9-2.0 Daylight (window) 1.8-2.5
Eb/EpEb/Ep values: Outdoor lightingvalues: Outdoor lightingLamp type Typical Ep/Eb valueLow pressure sodium 0.0-0.1High pressure sodium 0.3-0.5Mercury vapor 1.2-1.3Metal halide 1.2-1.3

77© 2007 Rensselaer Polytechnic Institute. All rights reserved.
Caveats when making field Caveats when making field measurementsmeasurements
A single light source rarely provides all A single light source rarely provides all illumination in a locationillumination in a location
0.80.8--1.01.0Incandescent + Incandescent + 10% daylight10% daylight
0.70.7--0.80.8IncandescentIncandescent
Resulting Resulting EEpp/E/Ebb valuevalueLight sourceLight source

88© 2007 Rensselaer Polytechnic Institute. All rights reserved.
Caveats when making field Caveats when making field measurementsmeasurements
Walls and other surfaces can affect the spectral Walls and other surfaces can affect the spectral distribution of illumination reaching the eyes, distribution of illumination reaching the eyes, but differences are small unless totally indirect but differences are small unless totally indirect lighting is used or very saturated colors are usedlighting is used or very saturated colors are used
0.580.582700 K CFL 2700 K CFL (light blue back wall)(light blue back wall)
0.530.532700 K CFL 2700 K CFL (yellow back wall)(yellow back wall)
0.560.562700 K CFL 2700 K CFL (flat white back wall)(flat white back wall)
Resulting Resulting EEpp/E/Ebb valuevalueLighting conditionLighting condition
99© 2007 Rensselaer Polytechnic Institute. All rights reserved.
Deducing locationsDeducing locations
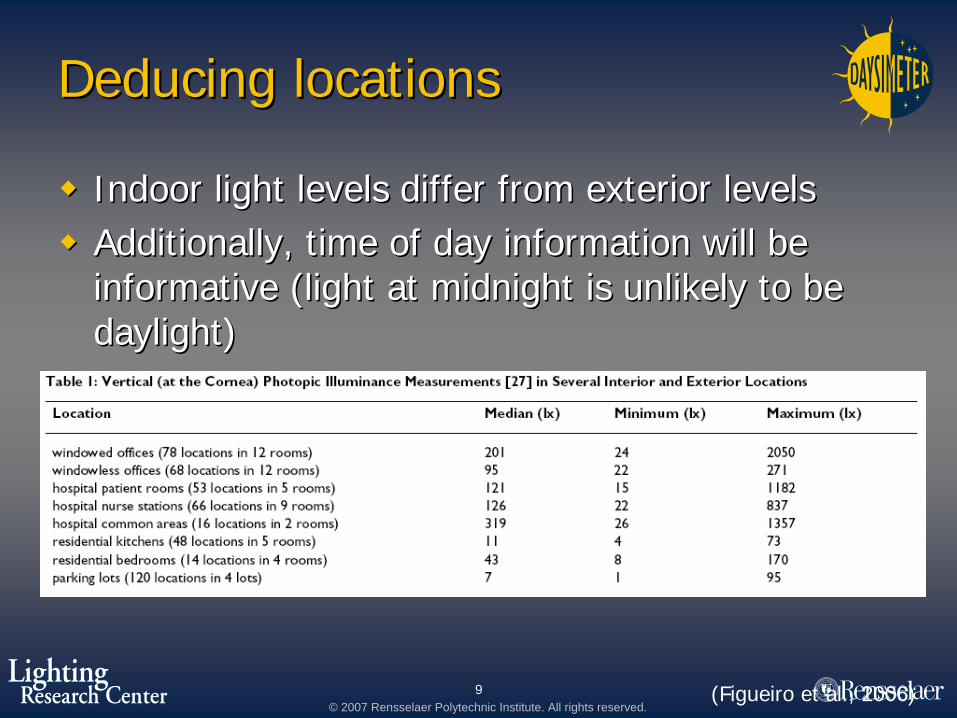
Indoor light levels differ from exterior levelsIndoor light levels differ from exterior levelsAdditionally, time of day information will be Additionally, time of day information will be informative (light at midnight is unlikely to be informative (light at midnight is unlikely to be daylight)daylight)
(Figueiro et al., 2006)
1010© 2007 Rensselaer Polytechnic Institute. All rights reserved.
Circadian stimulus/response Circadian stimulus/response characterizationcharacterization
Signals from two sensors can be combined Signals from two sensors can be combined to provide an estimate of circadian to provide an estimate of circadian stimulus (Rea et al., 2005)stimulus (Rea et al., 2005)›› Circadian stimulus is based on physiology as Circadian stimulus is based on physiology as
well as data from multiple studies of nocturnal well as data from multiple studies of nocturnal melatonin suppression by light (melatonin suppression by light (BrainardBrainard et et al., 2001; al., 2001; ThapanThapan et al., 2001; Rea et al., et al., 2001; Rea et al., 2001, 2002; Figueiro et al., 2004)2001, 2002; Figueiro et al., 2004)

1111© 2007 Rensselaer Polytechnic Institute. All rights reserved.
Circadian Circadian stimulusstimulusmeasurementmeasurement
0 1 2 3 4 5 6 7-2
0
2
4
6
Time (days)
log 10
(lux
or C
S)
unit 24.txt Filtered
R2 =
0 1 2 3 4 5 6 7-2
0
2
4
6
0 1 2 3 4 5 6 7-2
0
2
4
6
Time (days)
log 10
(lux
or C
S)
unit 24.txt Filtered
R2 =
0 1 2 3 4 5 6 7-2
0
2
4
6
Time (days)
log 10
(lux
or C
S)
unit 24.txt Filtered
0 1 2 3 4 5 6 7-2
0
2
4
6
Time (days)
log 10
(lux
or C
S)
unit 27.txt Filtered
Day
shi
ftD
ay s
hift
Grant #NIHGrant #NIH--RO1RO1--OH008171OH008171
Nig
ht s
hift
Nig
ht s
hift
1212© 2007 Rensselaer Polytechnic Institute. All rights reserved.
Stimulus versus responseStimulus versus response
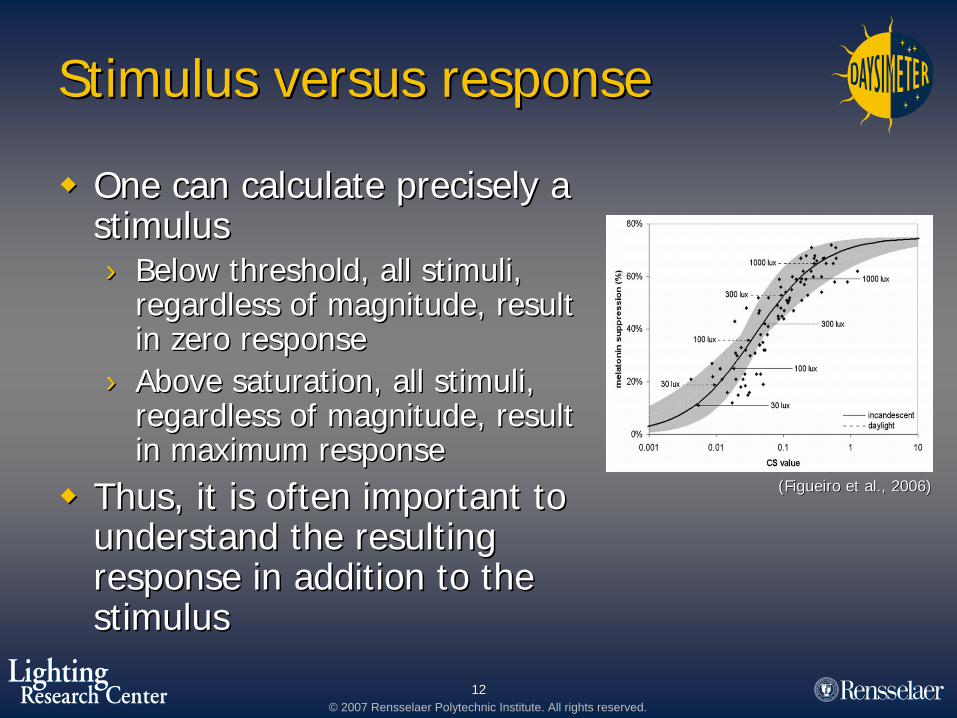
One can calculate precisely a One can calculate precisely a stimulusstimulus›› Below threshold, all stimuli, Below threshold, all stimuli,
regardless of magnitude, result regardless of magnitude, result in zero responsein zero response
›› Above saturation, all stimuli, Above saturation, all stimuli, regardless of magnitude, result regardless of magnitude, result in maximum responsein maximum response
Thus, it is often important to Thus, it is often important to understand the resulting understand the resulting response in addition to the response in addition to the stimulusstimulus
(Figueiro et al., 2006)(Figueiro et al., 2006)

1313© 2007 Rensselaer Polytechnic Institute. All rights reserved.
Circadian Circadian responseresponse measurementmeasurement
0 1 2 3 4 5 6 7-1
0
1
2
3
4
log 10
(CS)
Time (days)0 1 2 3 4 5 6 7
0
0.2
0.4
0.6
0.8
Rel
ativ
e R
espo
nse
Grant #NIHGrant #NIH--RO1RO1--OH008171OH008171

1414© 2007 Rensselaer Polytechnic Institute. All rights reserved.
Temporal analysesTemporal analyses
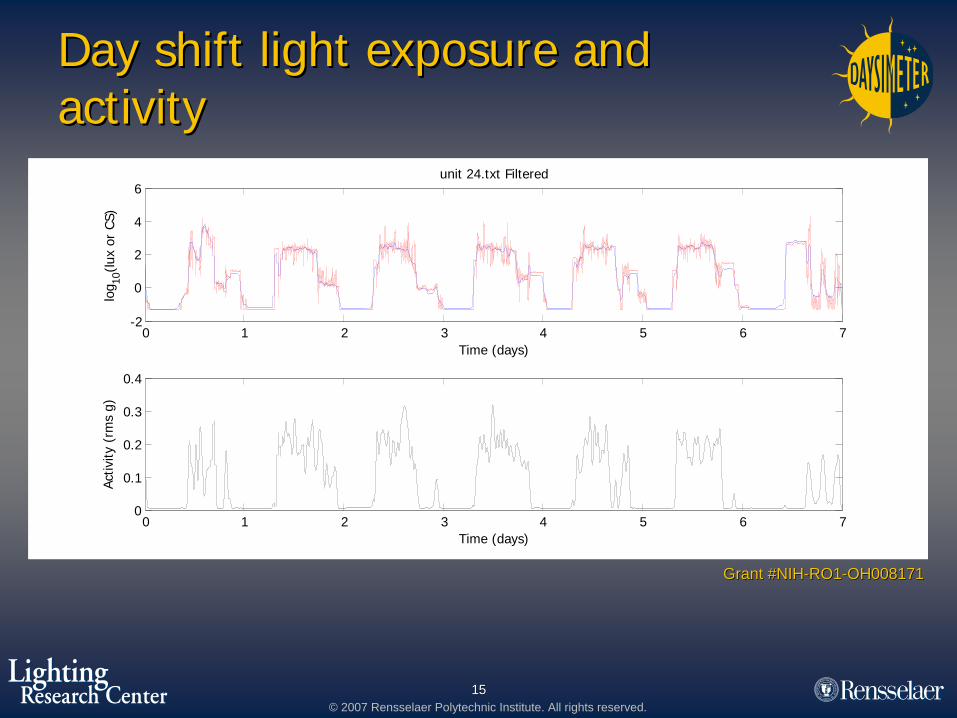
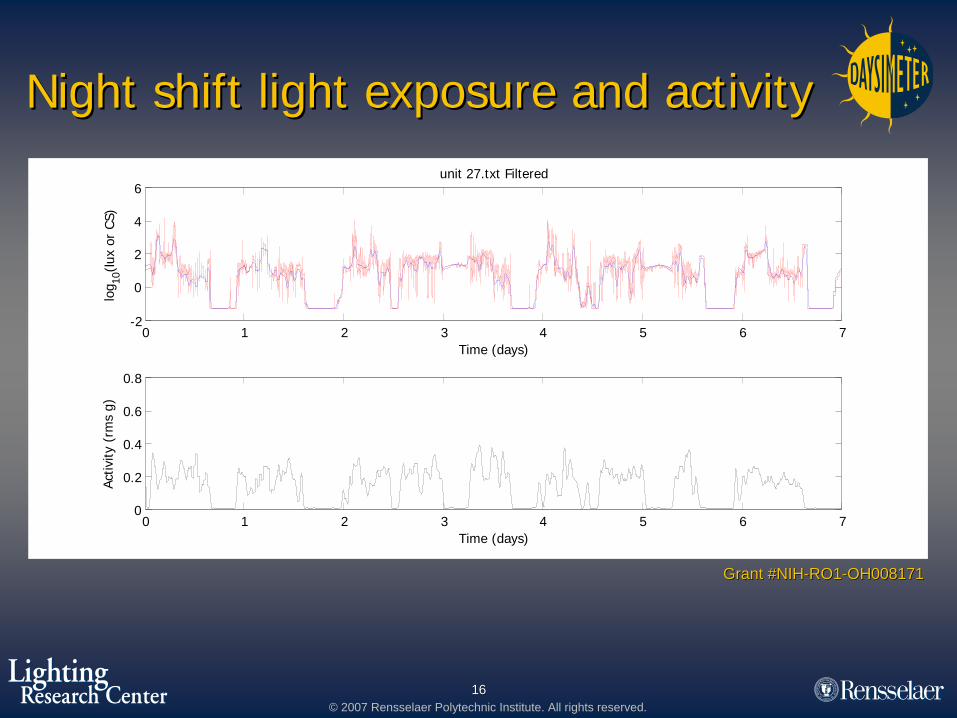
Unlike most conventional photometric Unlike most conventional photometric equipment, the Daysimeter date stamps equipment, the Daysimeter date stamps and records data continuouslyand records data continuouslyCan provide estimates of periodicity and of Can provide estimates of periodicity and of day/night light exposureday/night light exposureCan relate measurements to specific Can relate measurements to specific events (e.g., in diaries or sleep logs)events (e.g., in diaries or sleep logs)
1515© 2007 Rensselaer Polytechnic Institute. All rights reserved.
Day shift light exposure and Day shift light exposure and activityactivity
Grant #NIHGrant #NIH--RO1RO1--OH008171OH008171
0 1 2 3 4 5 6 7-2
0
2
4
6
Time (days)
log 10
(lux
or C
S)
unit 24.txt Filtered
0 1 2 3 4 5 6 70
0.1
0.2
0.3
0.4
Time (days)
Activ
ity (
rms
g)
R2 = 0.556
0 1 2 3 4 5 6 7-2
0
2
4
6
Time (days)
log 10
(lux
or C
S)
unit 24.txt Filtered
0 1 2 3 4 5 6 70
0.1
0.2
0.3
0.4
Time (days)
Activ
ity (
rms
g)
R2 = 0.556
1616© 2007 Rensselaer Polytechnic Institute. All rights reserved.
Night shift light exposure and activityNight shift light exposure and activity
0 1 2 3 4 5 6 7-2
0
2
4
6
Time (days)
log 10
(lux
or C
S)
unit 27.txt Filtered
0 1 2 3 4 5 6 70
0.2
0.4
0.6
0.8
Time (days)
Activ
ity (
rms
g)
Grant #NIHGrant #NIH--RO1RO1--OH008171OH008171
1717© 2007 Rensselaer Polytechnic Institute. All rights reserved.
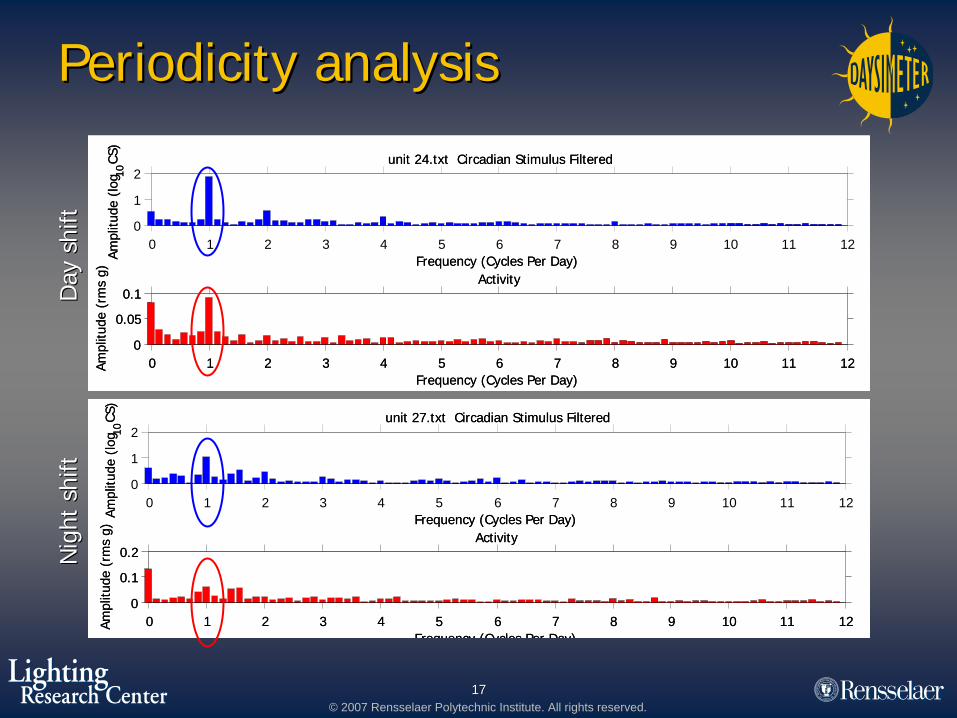
Periodicity analysisPeriodicity analysis
0 1 2 3 4 5 6 7 8 9 10 11 120
1
2
Frequency (Cycles Per Day)Ampl
itude
(lo
g 10CS
)
unit 24.txt Circadian Stimulus Filtered
0 1 2 3 4 5 6 7 8 9 10 11 120
0.05
0.1
Frequency (Cycles Per Day)
Ampl
itude
(rm
sg) Activity
0 1 2 3 4 5 6 7 8 9 10 11 120
1
2
0 1 2 3 4 5 6 7 8 9 10 11 120
1
2
Frequency (Cycles Per Day)Ampl
itude
(lo
g 10CS
)
unit 24.txt Circadian Stimulus Filtered
0 1 2 3 4 5 6 7 8 9 10 11 120
0.05
0.1
Frequency (Cycles Per Day)Ampl
itude
(lo
g 10CS
)
unit 24.txt Circadian Stimulus Filtered
0 1 2 3 4 5 6 7 8 9 10 11 120
0.05
0.1
Frequency (Cycles Per Day)
Ampl
itude
(rm
sg) Activity
Frequency (Cycles Per Day)
Ampl
itude
(rm
sg) Activity
0 1 2 3 4 5 6 7 8 9 10 11 120
1
2
Frequency (Cycles Per Day)Ampl
itude
(lo
g 10CS
)
unit 27.txt Circadian Stimulus Filtered
0 1 2 3 4 5 6 7 8 9 10 11 120
0.1
0.2
Frequency (Cycles Per Day)
Ampl
itude
(rm
sg) Activity
0 1 2 3 4 5 6 7 8 9 10 11 120
1
2
0 1 2 3 4 5 6 7 8 9 10 11 120
1
2
Frequency (Cycles Per Day)Ampl
itude
(lo
g 10CS
)
unit 27.txt Circadian Stimulus Filtered
0 1 2 3 4 5 6 7 8 9 10 11 120
0.1
0.2
Frequency (Cycles Per Day)Ampl
itude
(lo
g 10CS
)
unit 27.txt Circadian Stimulus Filtered
0 1 2 3 4 5 6 7 8 9 10 11 120
0.1
0.2
Frequency (Cycles Per Day)
Ampl
itude
(rm
sg) Activity
Frequency (Cycles Per Day)
Ampl
itude
(rm
sg) Activity
Day
shi
ft
Day
shi
ft
Nig
ht s
hift
Nig
ht s
hift
1818© 2007 Rensselaer Polytechnic Institute. All rights reserved.
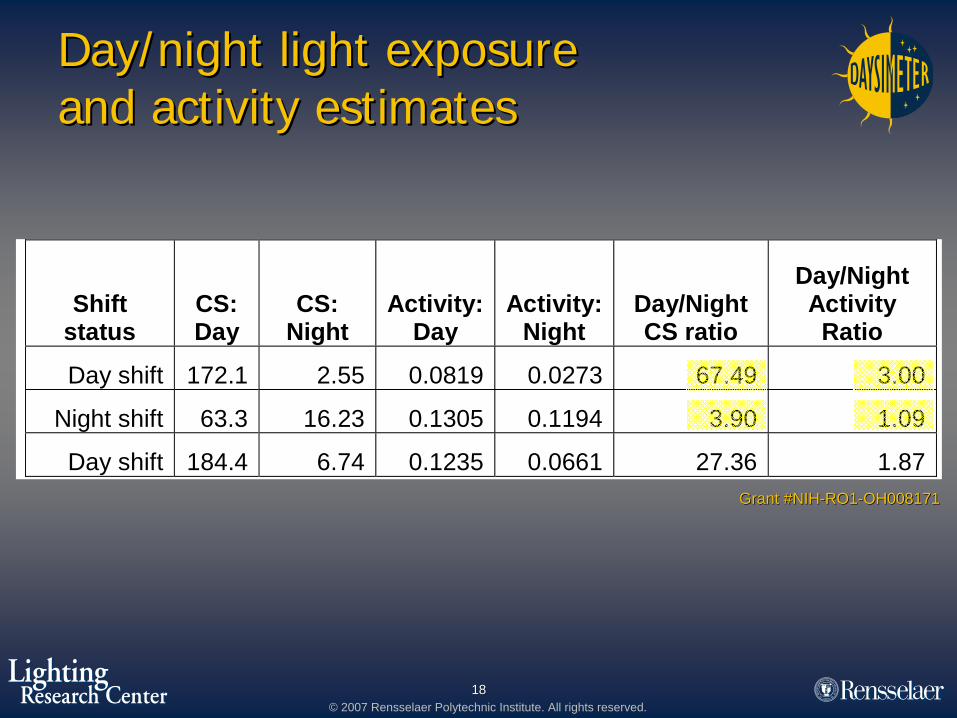
Day/night light exposure Day/night light exposure and activity estimatesand activity estimates
Shift status
CS: Day
CS: Night
Activity: Day
Activity: Night
Day/Night CS ratio
Day/Night Activity Ratio
Day shift 172.1 2.55 0.0819 0.0273 67.49 3.00
Night shift 63.3 16.23 0.1305 0.1194 3.90 1.09
Day shift 184.4 6.74 0.1235 0.0661 27.36 1.87Grant #NIHGrant #NIH--RO1RO1--OH008171OH008171

1919© 2007 Rensselaer Polytechnic Institute. All rights reserved.
Using diaries or sleep logsUsing diaries or sleep logs
(Figueiro et al., 2006)
2020© 2007 Rensselaer Polytechnic Institute. All rights reserved.
Thank you.Thank you.