using the axapta report wizard
TRANSCRIPT

Make reports more user-friendly with the Axapta Report Wizard Get step-by-step instructions to create and modify reports that users will find easier to read
By Bill Thompson, Microsoft Axapta Developer Support Consultant
IntroductionThis article will demonstrate how the Microsoft Axapta Report Wizard can be used to create a basic report, and how to make the report more user-friendly by modifying components—without additional coding.
Suppose you are a developer for a company, and you are asked to create a report that gives a summary of all Sales Orders, and their line items. It also would be nice to have an approximate Sales Order total as well. You could go into the AOT (Application Object Tree) and create a report by hand, but the use of the built in Report Wizard can quickly allow this type of report to be created.
Creating the reportThe first step is to actually start the Report Wizard. This is done by the navigation Tools | Development Tools | Wizards | Report Wizard (Figure 1).
Figure 1. Navigation to report wizard
When this selection is made, the following form is shown (Figure 2).

Figure 2. Initial Report Wizard form.
Please note the check box titled Show system names tables, fields, and methods. If this checkbox is enabled, the information displayed in the Report Wizard (table names, fields, etc.) will be displayed by name (or as actually shown in the AOT). If this box is not checked, the LABEL of the field will be used. This is what is normally displayed on a form (for example, the SalesTable or Create Sales Order form).
This discussion will use the box checked. Once the box is checked, click the Next button. This should display the next form (Figure 3).
Figure 3. Name Report form of Report Wizard

The form in Figure 3 is used to Name the report (this is the name of the report in the AOT), and create the Caption of the report. The caption is what is displayed in the title line when the report is printed.
Note the label section of this form. Axapta Best Practices recommends that labels be used in all instances. This is due to the use of labels allowing the customization to easily be converted to a multi-language product. This example does not use labels, as labels are not part of this discussion.
Click the Next button to continue.
The next form to be displayed is the Tables form (Figure 4).
Figure 4. Tables form of Report Wizard.
This form allows the user to choose the table (or tables) that will be used as the data source (or data sources) for the report. Since this report is based on Sales Order information, the table SalesTable is chosen. SalesTable contains the header information for each sales order that exists in the system. Highlight the table named SalesTable and press the insert button (button with the greater than sign “>”). Once this is done, the form should resemble Figure 4.
Notice in the lower left hand corner, a box is populated with related tables.
NOTE: this box will not be populated unless the data model portion of a cross reference is populated. This is done by navigating Tools | Development Tools | Cross reference | Periodic | Update and checking the Update data model checkbox and pressing the OK button (Figure 5).

Figure 5. Update cross-reference form
Since the line items for the Sales Orders are desired, the SalesLine table should be inserted into the list as well. Highlight the SalesLine table in the LOWER LEFT HAND BOX, and press the insert button (button on bottom of form with the greater than sign “>”). If this is done correctly, the form should resemble Figure 6.
Figure 6. SalesLine table inserted correctly into Data sources list.
Once this is done, press the Next button to continue.
Now it is time to add fields to the report. By default, if the table, or tables, being used as data sources have a table group called AutoReport, and this group has fields inserted into the group, these fields will be defaulted on to the report.
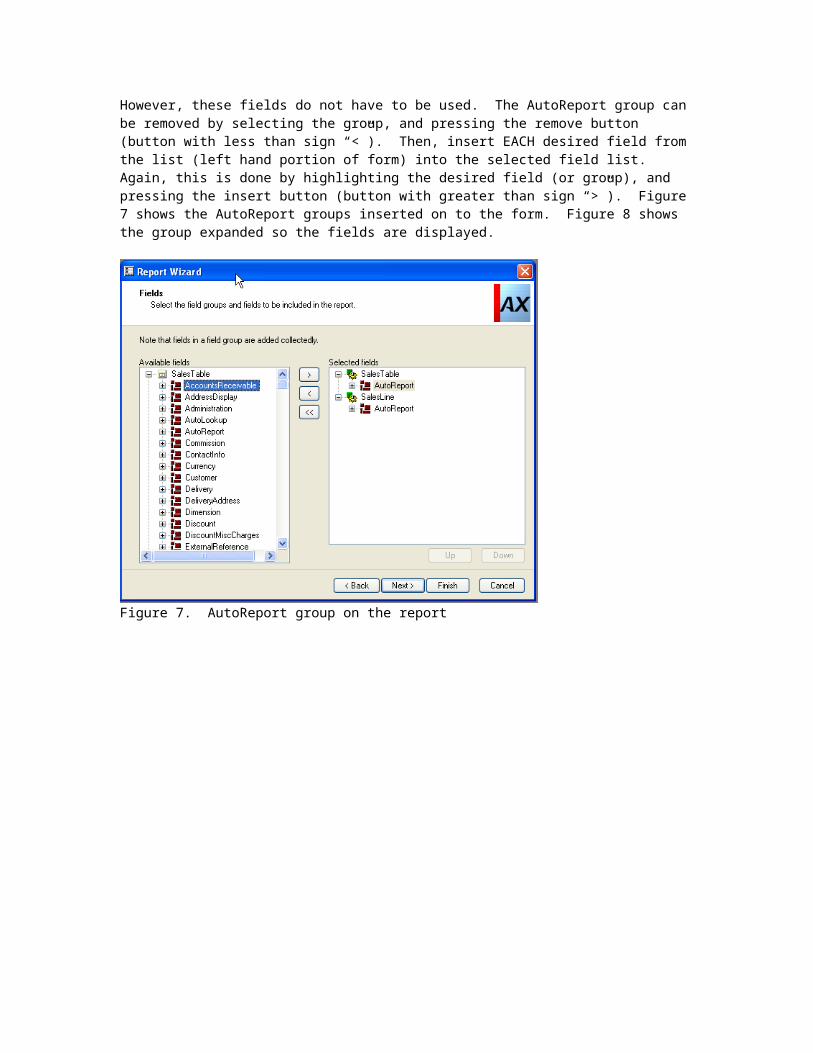
However, these fields do not have to be used. The AutoReport group can be removed by selecting the group, and pressing the remove button (button with less than sign “<”). Then, insert EACH desired field from the list (left hand portion of form) into the selected field list. Again, this is done by highlighting the desired field (or group), and pressing the insert button (button with greater than sign “>”). Figure

7 shows the AutoReport groups inserted on to the form. Figure 8 shows the group expanded so the fields are displayed.
Figure 7. AutoReport group on the report
Figure 8. AutoReport group expanded to display fields
Click the Next button to continue.
The next form (Figure 9) is used to define what fields are to be summed or totaled on the report. The choices are Sum total, which sums all values, Sums Positive, which
sums only positive values, and Sums negative, which is summation of negative values.
When completed, the form should resemble Figure 9.
Figure 9. Summation on fields
Once this is completed, press the Next button to continue.
Figure 10 shows the next form, which is the sorting fields form. This form shows the default way the data will be sorted when it is displayed on the form. Fields can be added or removed, and the sort method can be defined as well.
For the purposes of this report, accept the defaults by pressing the Next button.

Figure 10. Sorting fields form
The next form is the subheadings definition form. A subheading is printed when the value of the field changes. For the purposes of this report, a sub-heading should print when the Sales Order number (SalesId field) changes. To accomplish this, check the box next to SalesId, and click the Next button to accept the value (Figure 11).
Figure 11. Sub-headings form

Figure 12 shows the Group totals form. This form is used to place where the report prints totals. Again, since the requested report is going to break on Sales Order number (SalesId of SalesTable), the proper location should be the SalesID field. Place a check mark next to SalesId.
Figure12. Group Totals form
When ready, the form should resemble Figure 12. Press the Next button to continue.
The next form is used to determine ranges on the form. A range is a limiting value to control what is printed on the report. This could be a range of items, order numbers, different statuses of the Sales Order, etc.
In this case, the range can be placed on the Sales Order ID, status of the order, or Item information.

Figure 13. Range form
Once the range form resembles Figure 13, press the Next button to continue.
The next form is the Report Layout form. This form controls how the report will be presented. First is the layout box. This determines if the report lists the data in columns, or in a “table” format.
The second box (Orientation) determines the way the report prints (landscape or portrait, or let Axapta choose).
The third box is a preview, which gives a generic view of what the report should look like when it prints.
The final box (Report template) is used to define a “default” layout of the report. This can include (or exclude) System date, number of pages, company name, and more. This information is defined in the report template. The best way to see what each template does is to choose the template, hit the Next button, and use print preview to see the report. You can then hit the back button to change the template to see what the other templates produce.

Figure 14. Report layout form.
For the purposes of this report, choose Tabular Layout, Auto Orientation, and FrontPage Report Template. Press the Next button when ready.
The next form is a good testing form for the report. It is the Print Preview form (Figure 15).
Figure 15. Report Preview form

The Preview form allows the viewing of a layout of the report, an actual printing of the report, and how to launch the report.
The first button is the Design button. Pressing this will bring up the Design Editor form (Figure 16). This form allows you to see a general layout of the report, and give you an idea of how the information will be presented when the actual report is generated. Layout of the report can be modified on this form, if so desired. For the purposes of this discussion, please do not do any additional modification, as this will be explained later in the article.
Figure 16. Design form
The second button allows the actual generation of the report to be done. This is the Preview button. Pressing the preview button will bring up the form shown in figure 17. This form is used to apply any desired ranges that will be used to limit the data on the report. Once all ranges have been entered, press the OK button to continue. If using the demo data, leave the ranges empty, and press OK.

Figure 17. Range, sorting, print options form
Pressing OK brings up the Report Destination form (Figure 18). This form is used to set any printer options that are desired, where the report is to be sent, printer to use, etc.
Figure 18. Report Destination form
For the purposes of this test, choose Screen, and press OK (as shown in figure 18).
After the OK button is pressed, the report will be generated, and displayed on the screen (Figure 19). The report will be able to be scrolled through, pages will be changed, and it can be printed to the printer. This navigation is done by using the icons displayed in the upper left corner of the preview form.

Figure 19. Report Print to screen
Close the form to continue. At this point, click the Next button and the form shown in Figure 20 is displayed. If this is shown, you have successfully created a report via the report wizard.
Figure 20. Finished form

Modifying the report
If you now open the Application Object Tree (AOT), you will see the report listed as the first report listed in the Reports node. However, once Axapta is closed and reopened, this report will be shown in its alphabetically correct location. Figure 21 shows the report in the AOT.
Figure 21. Report in AOT
At this point, it has been decided that the report prints the information that is desired, but you have been asked to make the report more readable, and remove any redundant information. To do this, much can be done by editing properties of fields and sections of the report.
So, the first step is to open the report for modification. It may be easier to work with the report if it is in its own window, separate from the AOT. To do this, right click on the report name, and choose Open New Window (see figure 22).

Figure 22. Open new window functionality
The new window will open with just the report in it.
The first step that has been requested is to indent the order lines to make it easier to distinguish the line information (SalesLine table) from the header information (SalesTable table). To do this, the first step is to locate the SalesLine table information. The steps to do this are:
1. Expand the Designs node by clicking the plus sign “+” in front of the Designs node of the report.
2. Expand ReportDesign node.3. Expand AutoDesignSpecs node.4. Highlight the node entitled Body: SalesLine
The report window should look similar to Figure 23. The next step is to open the properties of this node. To do this, click the 3rd icon (next to the disk icon) in the upper left hand corner of the form.

Figure 23. Expanded report design
The form displayed in Figure 24 should now be shown. This allows the modification of properties of the section called SalesLine. These changes will affect ALL records that come from SalesLine table, and printed on the report.
Figure 24. Properties form
To modify the LeftMargin property, click on the button with the box on it (located at the right of the field). This will allow you to enter an actual value into the field. For the purposes of this report, change this value by typing into the property field. Use a value of 10.00 mm (10 millimeters). When completed, the fields should resemble figure 25.
Figure 25. Modified LeftMargin property

At this point, the report will need to be saved. This is denoted by a vertical red line showing in front of the report name.
Figure 26. Report needs to be saved
Save the report by clicking on the disk icon of the window. When this is done, the vertical red line should disappear.
Now, test the report by either clicking on the open folder icon of the displayed window, or right clicking on the report name, and then choosing Open from the menu that appears. The report should now appear and resemble Figure 27.
Figure 27. SalesLine indented report preview
Notice that the line items are now indented. This is the desired effect. However, this still doesn’t set off the information enough. So, the next request is to change the print of the Sales Order information to print in bold. This is done by going to the properties of the SalesTable section of the report. Expand nodes of the report until you locate the Body: SalesTable node (as seen in Figure 28).

Figure 28. SalesTable node
As was done previously, the properties need to be edited. So, highlight the Body:SalesTable section, right click, and choose properties. Locate the Bold property, and in the dropdown list next to it, choose Heavy. Once that is done, save and print the report again. The report should now resemble Figure 29.
Figure 29. Updated report with bold SalesTable information.
Notice now that there are no totals on the report anymore. This happened when we started changing properties of the report. Properties of the fields that were originally

summed need to be modified. However, since the fields are contained in groups, be default, they cannot be edited. To change this, the properties of the AutoGroup (found in the SalesLine node) need to be modified. Locate AutoGroup node, right click, and choose properties. Change the properties to match Figure 30, and save the report.
Figure 30. Modified AutoGroup Properties.
Now, the properties of each field in the AutoGroup should be able to be modified.
To get the desired results, the SumAll property of field SalesLine_LineAmount needs to be changed to Yes. Also, since the request was made to remove redundant information, the SaledID field in SalesLine does not need to be seen on the report, as this is displayed in the SalesTable information. Therefore, the Visible property of SalesId field should be set to No (Figure 31).
Figure 31. Visible property set to No
Save and print the report. It should now resemble Figure 32.

Figure 32. Updated report preview
Notice in the report that the Sales Order TOTAL is not bold, and it doesn’t have a caption on it. To do this, a Generated Design is required.
A Generated Design basically takes the AutoDesignSpecs (what was created by the report wizard, and modified previously in this discussion), and breaks the report into additional segments. Headers and footers will be created for the pages. We are interested in the foot at this time as it will contain the summation information that we need to modify.
To create a Generated Design, highlight the ReportDesign node of the report, right click, and choose Generate Design from the displayed menu (Figure 33).
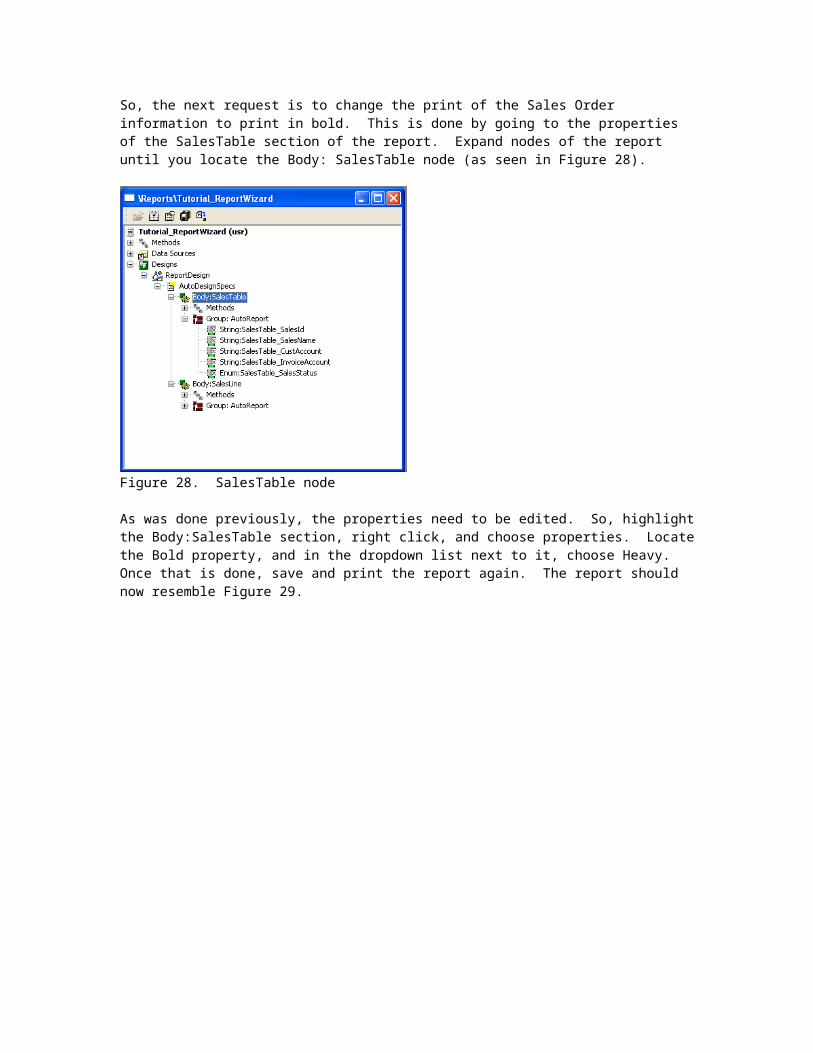
Figure 33. Generate Design
Your report should now have a Generated Design node located directly under the AutoDesignSpecs node.
NOTE: any changes that are made now will have to be done in the Generated Design as this is what will now be used to print the report. No additional modifications done in AutoDesignSpecs will be recognized unless the Generated Design is created again. Also, whenever a Generated Design is created, and modifications that exist in an existing Generated Design will be overwritten, and need to be created again.
Expand the Generated Design node until you locate the SalesLine_LineAmount_1 field (see Figure 34 for the navigation).
Figure 34. Navigation to the summation field

Open the properties of this field. Modify the properties to resemble what is displayed in Figure 35. Notice specifically the Label and LabelBold properties.
Figure 35. Modified properties of the summation field/
Save and print the report. It should resemble Figure 36.

Figure 36. Final report.
SummaryThis discussion showed how easy it is to create a custom report within Axapta using the Report Wizard, using multiple related tables, and by simple manipulation of properties, we modified the report layout to make an easy to read presentation. And, this was accomplished without writing a single line of X++ code.