using statistical and machine learning approaches to
TRANSCRIPT

Zijiang Yang, Youwu Liu
December 2017
Using Statistical and Machine Learning Approaches to Investigate the Factors Affecting Fire Incidents

2
Executive Summary Fires can cause costly property damages and significant economic losses. They are also a major source of severe injury and loss of human life in our urban and rural communities.
Historical data of fire incidents can reveal patterns of fire incidents. The national fire information database (NFID) contains historical data of fire incidents across the country and related injuries and deaths from 2005 to 2015.
The objective of this research is to discover the possible underlying causes from data in the NFID and create quantitative models to evaluate and assess fire safety risks. Specifically, the research focuses on investigating the key factors to affect the likelihood or intensity of fire incidents and addressing the firefighter safety issue related to fire incidents. Statistical analysis and machine learning algorithm are applied in this research.
The research yields three conclusions. Firstly, we identify eight factors: Firefighter - Helmet Worn At Time of Injury, Firefighter - Helmet Line Used At Time of Injury, Firefighter - Coat (Turnout) Worn At Time of Injury, Firefighter - Boots Worn At Time of Injury, Fire Fighting Years of Experience, Age of Victim, Height Firefighter, Weight Firefighter, as main influential factors on firefighter injuries; Secondly, eighteen factors: Initial detection, Building height, Ground floor area, Major Occupancy Group, Energy causing ignition (form of heat), Fuel or energy associated with igniting object, Act or Omission Group, Material First Ignited Group, Sprinkler protection, Manual fire protection facilities, Area of Origin Group, Igniting Object Group, Level of Origin, Automatic fire detection system, Number of occupants, Property Classification Group, Action taken, Method of Fire Control & Extinguishment Group, are found as main influential factors on fire incidents; Finally, relative importance of the factors in relation to spreading fires are provided.

3
TABLE OF CONTENTS
List of Figures …………………………………………………………………………………………………………………………. 4
List of Tables …………………………………………………………………………………………………………………………… 5
1. Introduction ……………………………………………………………………………………………………………………… 6
1.1. Fire incidents in North America …………………………………………………………………………………. 6
1.2. Fire Risk and Data ……………………………………………………………………………………………….…….. 8
1.3. Research approach ………………………………………………………………………….………………………… 9
1.4. Research Objective ………………………………………………………………………….…………………..…… 10
2. Literature review ……………………………………………………………………………………………………………… 10
3. Methodology …………………………………………………………………………………………………………………… 12
3.1. Identify main influential variables on firefighter injuries ……………………………….……….… 13
3.2. Identify main influential variables on fire incidents ……………………………………...………….. 13
3.3. Identify main influential variables on spread of fires ……………………………………..…………. 14
4. Results and Discussions ……………………………………………………………………………………..……………. 14
4.1. Data Overview …………………………………………………………………………………………….…………… 14
4.2. Main influential variables on firefighter injuries ………………………………..……………..……… 16
4.3. Main influential variables on fire incidents ………………………………….……………..……………. 22
4.4. Main influential variables on spread of fires ………….…………………………………………..…….. 31
5. Conclusion ……………………………………………………………………………………………..……………….………. 34
Acknowledgment .…………………………………………………………………………………………………..…….………. 35
Reference ……….……………………………..…………………………………………….………………………..……………… 35

4
List of Figures
Fig 1 Scree Plot of 25 Components (Victim Dataset) ………………………………………………………… 19
Fig 2 Scree Plot of 15 Components (Victim Dataset) ………………………………………………………… 21
Fig 3 Scree Plot for 36 Components (Incident Dataset) ……………………………………………………. 25
Fig 4 Scree Plot for 23 Components (Incident Dataset) …………………………………………………..... 28
Fig 5 Relative Importance of Variables on Spreading Fires …………………………………………………………… 33

5
List of Tables
Table 1 U.S. Fire incidents (2006~2015) …………………………………………………………………………. 6
Table 2 Ontario Fire incidents (2006~2015) …………………………………………………………………… 6
Table 3 Total Firefighter Injuries at the Fireground and at Non-fire Emergencies …………….. 7
Table 4 Example Variables of Missing Values ………………………………………………………………... 15
Table 5 Example Variable of ‘Unknown’ Value …………………………………………………………….… 16
Table 6 Missing Key Validation Result …………………………………………………………………………… 17
Table 7 Total Variance Explained I ………………………………………………………………………………… 18
Table 8 Component Correlation Matrix I ……………………………………………………………………….. 19
Table 9 Total Variance Explained II ………………………………………………………………………………. 20
Table 10 Monte Carlo simulation for Parallel PCA test ……………………………………………………. 21
Table 11 Component Correlation Matrix II …………………………………………………………………….. 21
Table 12 Component Structure Matrix for Buildings ……………………………………………………… 22
Table 13 Property Classification and Incidents Percentage …………………………………………… 23
Table 14 Initial Eigenvalues for 36 variables ………………………………………………………………… 25
Table 15 Missing Value and Extreme Value Statistics ……………………………………………………. 27
Table 16 Principle Components and their Variable Loadings ………………………………………… 29
Table 17 Variables with Greater Influence on Building Fire Incidents …………………………… 29
Table 18 Variables with Greater Influence on Residential Fire Incidents ………………………. 30
Table 19 Codes of Extent of Fire ………………………………………………………………………………….. 31

6
Introduction
Fires can cause costly property damages and significant economic losses. They are also a major source of severe injury and loss of human life in our urban and rural communities.
On June 14, 2017, a fire flared up in the Grenfell Tower located in North London around midnight. The London Fire Brigade rapidly responded and dispatched 200+ firefighters with 40+ fire engines to the fire scene to carry out rescue mission. Despite attending within six minutes after receiving the first call and succeeding multiple rescues of 65 persons, it could not prevent the fire from developing into a disaster. According to media reports, the tragedy caused 71 counts loss of life, including known deaths and missing presumed dead.
1.1 FIRE INCIDENTS IN NORTH AMERICA
In 2016, there were 1,342,000 fires reported in the United States. These fires caused 3,390 civilian deaths, 14,650 civilian injuries, and $10.6 billion economic losses in property damage. Recent historical fire incidents information can be found in the table below:
Table 1 U.S. Fire incidents (2006~2015)
Total Estimated $
Loss (billion)
Number of Loss Fires
(000)
Residential Fire Injuries
Residential Fire Deaths
Residential Estimated $
Loss (million)
2015 $14.30 380.9 11,475 2,565 $7,099 2014 $11.60 379.5 12,075 2,765 $6,909 2013 $11.50 380.3 12,450 2,755 $6,996 2012 $12.40 374.0 13,050 2,385 $7,333 2011 $11.70 364.5 13,900 2,450 $7,009 2010 $11.60 362.1 13,275 2,555 $7,225 2009 $12.50 356.2 12,600 2,480 $8,021 2008 $15.50 378.2 13,100 2,650 $8,831 2007 $14.60 390.3 13,525 2,765 $8,182 2006 $11.30 392.7 12,550 2,490 $7,813
Source: US Fire Administration & FEMA (December 2017)
In Ontario, the most populous province of Canada, 10,951 loss fires, with 860 related injuries and 94 fatalities, were reported in 2015. Estimated economic loss caused by the fires was approximately $730.5 million. National level statistics of fire incidents is unavailable.
Table 2 Ontario Fire incidents (2006~2015)
Number of loss fires
Fire Injuries
Fire fatalities
Estimated $ loss in
millions No loss fires
2015 10,951 860 94 $730.50 9,679

7
2014 10,632 814 80 $862.00 8,090 2013 10,730 784 79 $639.50 8,433 2011 11,501 779 86 $632.90 10,108 2010 12,850 859 79 $585.60 11,479 2009 12,945 872 97 $642.60 11,022 2008 13,151 649 99 $570.50 8,754 2007 14,310 836 92 $549.40 12,711 2006 13,773 736 81 $444.90 12,119
Source: Ontario Ministry of Community Safety and correctional Services
An important but less reported fire related loss is firefighter injuries on-duty. Firefighters’ job tasks are physically demanding. They are often exposed to hazardous work conditions, which cannot be imagined by ordinary citizens, such as an explosion when carrying out a rescue or a multiple vehicle crash on the way to a fire scene. Firefighters face a relatively high chance of being injured, possibly killed on the job. They may suffer a variety of injuries, including
• physical injury due to extreme heat, falling objects, or vehicular, • chemical injury due to carbon monoxide, • biological injury due to infectious disease, • ergonomic injury due to heavy lifting or awkward postures, and • psychological injury due to stress.
Table 3 illustrates the historical statistics of firefighter injuries in the United States.
Table 3 Total Firefighter Injuries at the Fireground, and at Non-fire Emergencies (1981-2016)
Year Total
Firefighter injurie
Injuries at the
Fireground
Injuries per 1,000 Fires
Injuries at Non-fire
Emergencies
Injuries per 1,000
Incidens
1981 103,340 67,500 23.3 9,600 1.24 1982 98,150 61,400 24.2 9,385 1.17 1983 103,150 61,700 26.5 11,105 1.29 1984 102,300 62,700 26.8 10,600 1.21 1985 100,900 61,300 25.9 12,500 1.38 1986 96,540 55,900 24.7 12,545 1.30 1987 102,600 57,755 24.8 13,940 1.41 1988 102,900 61,790 25.4 12,325 1.13 1989 100,700 58,250 27.5 12,580 1.11 1990 100,300 57,100 28.3 14,200 1.28 1991 103,300 55,839 27.3 15,065 1.20 1992 97,700 52,290 26.6 18,140 1.43 1993 101,500 52,885 27.1 16,675 1.25 1994 95,400 52,875 25.7 11,810 0.84

8
1995 94,500 50,640 25.8 13,500 0.94 1996 87,150 45,725 23.1 12,630 0.81 1997 85,400 40,920 22.8 14,880 0.92 1998 87,500 43,080 24.5 13,960 0.82 1999 88,500 45,500 25.0 13,565 0.76 2000 84,550 43,065 25.2 13,660 0.73 2001 82,250 41,395 23.9 14,140 0.73 2002 80,800 37,860 22.4 15,095 0.77 2003 78,750 38,045 24.0 14,550 0.70 2004 75,840 36,880 22.1 13,150 0.62 2005 80,100 41,950 26.2 12,250 0.56 2006 83,400 44,210 26.9 13,090 0.57 2007 80,100 38,340 24.6 15,435 0.65 2008 79,700 36,595 25.2 15,745 0.66 2009 78,150 32,205 24.1 15,455 0.62 2010 71,875 32,675 24.5 13,355 0.50 2011 70,090 30,505 22.0 14,905 0.50 2012 69,400 31,490 22.9 12,760 0.42 2013 65,880 29,760 24.0 12,535 0.41 2014 63,350 27,015 20.8 14,595 0.48 2015 68,085 29,130 21.6 14,320 0.44 2016 62,085 24,325 18.1 12,780 0.38
Source: NFPA Survey of Fire Departments for U.S. Fire Experience (1981-2016).
1.2 FIRE RISK AND DATA
Majority of the loss fires are building fires, or structural fires in professional term. The challenge to reduce the loss fire incidents and minimize their negative impact is that nobody can predict exactly when or where a fire will occur, under what conditions, and who will be at risk. Most buildings allow a generally tolerable level of fire performance. Therefore, risks of life safety or financial loss might exist in any given building due to some unknown or unacceptable attributes of its structure or its occupants.
One way to determine whether such a potential exists is by undertaking a fire risk assessment of the building or facility. Fire risk assessment is a very important part of fire prevention and safety management. A crucial element of fire risk assessment is to identify main influential factors that are more prone to start a fire or spread fast to other areas from its origins. Fire risk assessment also evaluates likelihood and severity of damages or injury, and even life loss might be caused by these risk related factors.
Historical data of fire incidents can reveal patterns when and how potential and hazardous sources can lead or intensify fires. In Canada, fire incidents data has been collected throughout

9
the country for years and it has been serving as worthy references for fire safety authority and professionals to protect local communities. However, the data was not standardized among various jurisdictions nor in centralized national depository.
The Canadian Association of Fire Chiefs (CAFC), teaming up with the Canadian Council of Fire Marshalls and Fire Commissioners (CCFM&FC) implemented the national fire information database (NFID) in 2017. The database (NFID) project funded by the Canadian Safety and Security Program (CSSP), a federal program led by Defense Research and Development Canada’s Centre for Security Science, in partnership with Public Safety Canada.
The NFID consolidates currently available data across the country. It contains historical data of fire incidents and related injuries and deaths from 2005 to 2015. Although there are limitations, such as incomplete coverage and underreporting and relatively high proportion of missing data or unknown values, the NFID constitutes a starting point and foundation for enhanced understanding of fire and safety risks on a nationwide basis, which allows evidence informed policy improvements and best practice in fire risk management. The NFID enables analytics approaches for investigating and identifying main influential factors that affect fire incidents and fire related injuries and losses.
1.3 RESEARCH APPROACH
Traditionally, research on fire incidents data was relatively qualitative in nature, partly due to data availability and standardization. It often combines with simple statistics such as frequencies and percentages presented in tables and charts. Significances and implications of such research outcomes highly depended on interpretations, which could yield inconsistent conclusions. Since NFID provides large quantity of standardized data of fire incidents, our research adopts quantitative approach to analyze the data.
There are two main approaches to perform data analytics, statistical analysis and machine learning. Although the methodologies are different, both retain their common objective, learning from data. Statistical analysis is a collection of quantitative methods of evaluating and estimating data in order to interpret the underlying relationships and causes and further to make inference on patterns and trends from the data. Machine learning is a branch of artificial intelligence and possesses a variety of data ‘learning’ methods. Machine learning methods analyze data to discover latent patterns that can be later used to process new data. The pattern discovery process relies on specific representation of data, a set of “features” that can be understood by a computer program.
In this project, we adopt both statistical analysis approach including correlation analysis, factor analysis, and machine learning approach including clustering and neural networks to carry out the analytics research.

10
1.4 RESEARCH OBJECTIVE
The objective of this research is to discover the possible underlying causes from given data and create quantitative models to evaluate and assess fire safety risks. The proposed methodology is positioned to resolve the following challenges:
• investigate the key factors to affect the likelihood or intensity of fire incidents, i.e., identifying the factors that have most contributed to the fire incidents. Such identification process requires assessing the impact of building codes, occupants or residents of structure on fire incidents and examining the influence of the factors of the fire incidents to spread or intensify the fires
• address the firefighter safety issue related to fire incidents • explore the relationship between fire risk and particular populations or locations
The report is organized as follows: Section 2 presents a literature review on fire study globally; Section 3 gives a formal introduction of the proposed methodology; Section 4 summarizes the data and discusses the results and Section 5 concludes this report.
Literature review
Many researchers have done research in fire related field. Some have focused on a comprehensive fire risk assessment. Lau, Lai, Lee and Du [1] proposed a fire risk scorecard based on a scoring system used in banking and insurance industry. The fire risk of each industrial and non-industrial building is assessed and its risk level is identified by the paper. The authors applied Analytic Hierarchy Process (AHP) to determine the weights for the different fire risk factors. The machine learning method, Support Vector Machine, was introduced in order to verify the model. Real data were also used to validate the proposed method.
Asgary, Sadeghi-Naini, and Levy [2] applied supervised version of Self-Organizing Map (SOM) to classify and assess the risk levels of structural fire incidents. A SOM is a popular example of unsupervised neural networks, an artificial intelligence technique. The authors defined five fire risk levels from very low (VL) to very high (VH) according to a set of criteria in order to classify the fire incidents. Seven years (2000~ 2006) of Toronto data related to structural fire incidents were used to validate the proposed model. They claimed that their proposed model could be used not only for improving fire safety and protection of existing and future structures, but also for enhancing emergency responses to future fire incidents. The availability of past fire incidents data is one of the necessary conditions for predictive fire risk assessment models.
Vadrevu, Eaturu, and Badarinath [3] applied AHP with fuzzy logic to rank and prioritize the causative factors of fire risk in south India. The satellite remote sensing datasets, topographic, vegetation, climate, and socioeconomic datasets are used in this study. The authors quantified the fire risk in the study area as a function of topographic, vegetation, climatic, and

11
socioeconomic attributes. In order to infer fire risk, the authors introduced linguistic variables in fuzzy classification.
Some researchers have explored the relationship between fire risk and particular populations or locations. Harpur, Boyce, and McConnell [4] presented their analysis on young children fatalities in dwelling fires. They examined coronial reports over 11-year period and gathered both abundance of detailed qualitative information and rich quantitative data. They took an in-depth and comprehensive look at aspects of these fires as well as the relevant demographics, households, lifestyles and behaviors. Their analysis identified the most common cause of fatal dwelling fires involving very young children and two other contributory factors. The authors claimed that their research had taken an important step forward in identifying risk factors and risky behaviors which could be used to inform education and intervention strategies.
Duncanson, Woodward, and Reid [5] conducted a study funded by the New Zealand Fire Service Commission. The study investigated the relationship between socioeconomic deprivation and risk of an unintentional fatal domestic fire incident. The study used New Zealand fire mortality data from the New Zealand Fire Service Fire Information Recording System (FIRS) for the period July 1993 to June 1998. The method was an analysis based on the calculation of total fatal domestic fire incident occurrences in geographic meshblocks. Their study showed a clear gradient of increasing rates of unintentional fatal domestic fire injury in New Zealand with increasing social and economic deprivation at census meshblock level. The study suggested that further local research was necessary to identify barriers to household fire safety in relatively socioeconomically deprived communities, as well as barriers in population groups.
Jennings [6] conducted a literature review on social, economic, and building stock characteristics as they related to residential fire risk in urban neighborhoods. The paper suggests that mixed research methods are needed for further research. Specifically, rich case studies, and descriptive studies of fire loss patterns and resident characteristics remained important to illuminate local dynamics of the fire problem and identify potential variables useful in future quantitative studies. The paper further suggests that the most promising and unrealized need for research is in undertaking holistic studies of neighborhood conditions simultaneously, using sophisticated analytic techniques, and truly engaging multidisciplinary perspectives.
Hastie and Searle [7] published a paper that details an analysis of fire service data, which sought to establish how accidental dwelling fires are distributed through different sectors of society and to identify socio-economic and demographic factors, which are associated with higher rates of dwelling fire. Their analysis applied statistical methods, principal component analysis (PCA) and ordinary least squares regression, to develop a model that explains around one third of the variance in rates of fire at small neighborhood level using just three predictor variables. The authors used fire incidents data provided by the West Midlands Fire Service and National Statistics and Ordnance Survey data governed under the UK Open Government License. Their study confirmed that the ethnic make-up of an area and the economic

12
deprivation present in an area are strongly indicative of rates of fire. In addition, it revealed a clear, and un-reported, link to the proportion of single people in middle age groups living in an area. This was an insight that is of considerable value to fire services, made all the more important by the fact that this latter group is growing in numbers in the UK. The author claimed that the findings of their study would help fire services to improve the targeting of fire safety interventions and to focus on those neighborhoods and communities where interventions were most needed and have the greatest potential to reduce both response demand and inequality. The findings also have value in helping plan the location of emergency response resources.
Another research direction focuses on fire fighters. Cloutier and Champoux [8] studied the risk faced by fire fighters and analyzed relationships between age and the characteristics of accidents involving firefighters. Their study used data extracted from the reports filed for the 1041 occupational accidents suffered by firefighters in two large Quebec municipalities during 1992. The research method was qualitative in nature. The conclusions of their study suggested that further research on the real work tasks of firefighters is necessary. Such study should focus on the effect of the most common and most onerous environmental, organizational and other constraints. Their study also indicated the need to focus attention on the transmission of expertise and the learning of individual and collective compensatory strategies among firefighters.
Britton, Lynch, Torner, and Peek-Asa [9] aimed to identify fire-related factors associated with injury. The authors studied the data provided by the National Interagency Fire Center in USA from 2003 to 2007. They used epidemiologic methods to expand on previous descriptive studies. Their results indicated that complexity of the fire is related to firefighter injury and the more complex fires had a lower injury incidence rate than less complex fires. Their finding could provide a basis for specific injury prevention strategies and for the evaluation of injury prevention efforts. In addition, the authors also concluded that the more experienced and specialized firefighting teams had lower injury incidence.
Rosalky, hostler, and webb [10] examined the effect of work duration on hormonal and affective stress responses in a sample of healthy, experienced firefighters. 42 apparently healthy firefighters completed all components of the study. Their study suggested that work duration appears not to have an effect on hormonal or affective stress response to fire suppression.
Methodology
In this section, we propose to integrate the statistical and machine learning approaches to investigate the key factors to affect the likelihood or intensity of fire incidents and firefighter safety. In the meanwhile, the proposed research also aims to explore the relationship between

13
fire risk and particular populations or locations. The concept and implementation are described in the following subsections.
3.1 IDENTIFY MAIN INFLUENTIAL VARIABLES ON SPREAD OF FIRES
The main analytics method we propose to apply is principle components analysis (PCA) [11]. PCA is used to identify main influential variables that have significant impact on firefighter injuries in fire incidents.
PCA is a statistical technique that transforms a set of observations of possibly correlated variables into a set of values of linearly uncorrelated variables. The new sets of variables, usually fewer, are called principal components.
SPSS program is used as primary computing tools to produce desired results and SAS program is used to verify the results.
Data extraction, transformation and loading process is an essential step before effective analysis can be performed. The provided dataset of victims contains records of both civilian injuries and firefighter injuries. Our focus for this part is on firefighter injuries. Therefore, extracting data of firefighter injuries from the dataset is a necessary step. We also use the following procedures to transform the data:
• Convert variables from text format into numeric format; • Examine data for its validity and eliminate all invalid data; and • Substitute missing values with best possible estimations.
3.2 IDENTIFY MAIN INFLUENTIAL VARIABLES ON FIRE INCIDENTS
The analytics method we propose to apply for this objective is also PCA. Preliminary processing of the incidents data indicates that
• the data from three jurisdictions are of better quality than the data from other jurisdictions; and
• the data about residential buildings are of better quality than the data about other structures, such as vehicles.
Based on these observations, we decide to focus on structural fire incidents in residential areas.
Following the same logic described in section 3.1, we do text-to-numeric conversion and missing value substitution.

14
3.3 IDENTIFY MAIN INFLUENTIAL VARIABLES ON SPREAD OF FIRES
The analytics method applied for this purpose is artificial neural networks (ANN) [12]. Artificial neural networks (ANNs) are computing systems inspired by the biological neural networks that constitute animal brains. Such systems learn (progressively improve performance on) tasks by considering examples, generally without task-specific programming. We use ANN to understand the relationships between the selected variables of the fire incidents data and spreading of fires.
An important advantage of ANN is that it does not assume the linear relationship. It can analyze data in which non-linear influences exist without a priori knowledge of what those non-linear influences should look like and further approximate the actual non-linear functions.
In order to perform ANNs, we create a new variable Spread (spread of fires) as the dependent variable. The variable Spread is a binary variable with value of either one or zero. The value zero represents the situations that the fires were contained within or near the origins of the fire incidents while the value one represents the situations that the fires spread to other areas.
We use MATLAB as primary computing platform to program ANNs for the desired analytics results and use python program to verify the results.
Data extraction, transformation and loading process is essentially similar to the Section 3.1.
Results and Discussions 4.1 DATA OVERVIEW
The data used in this study comes from the national fire information database (NFID). The Canadian Association of Fire Chiefs (CAFC), teaming up with the Canadian Council of Fire Marshalls and Fire Commissioners (CCFM&FC) implemented the NFID in 2017. The NFID database project was funded by the Canadian Safety and Security Program (CSSP), a federal program led by Defense Research and Development Canada’s Centre for Security Science, in partnership with Public Safety Canada.
The NFID contains two datasets, incident dataset and victim dataset. It contains historical data of fire incidents and related injuries and deaths from 2005 to 2015. The information is from seven jurisdictions: New Brunswick, Ontario, Manitoba, Saskatchewan, Alberta, British Columbia and the Canadian Armed Forces. Social domain data from Statistics Canada were added to the dataset.
The incident dataset contains 467,929 records and each record has 136 variables, which are affiliated with the following categories:
• Incident Information (24)

15
• Property Description (7) • Property Details (9) • Fire Protection Features (8) • Circumstances Contributing to the Outbreak of Fire (8) • Factors Relating to the Origin and Spread of Fire (7) • Fire Loss Details (5) • Discovery of Fire and Actions Taken (12) • Other Social Domain Data (56)
The victim dataset contains 15,326 records and each record has 31 variables. The information is about injuries and deaths of firefighters and civilians related to fire incidents.
Data quality assessment was performed prior to our analytics. Since our focus is primarily on the characteristics of residential fires and related injuries, records about other structural incidents are excluded from further analysis.
There exists relatively high proportion of missing values for some variables. We ran missing value analysis on all variables. Table 4 below provides the information on missing values for seven variables, from variable 13 to variable 19 in the incident dataset.
RESPONSE TIME OF
SUBSEQUENT VEHICLES
SUBSEQUENT CREW SIZE
NUMBER OF
ENGINES
NUMBER OF
AERIALS
NUMBER OF
TANKERS
NUMBER OF CFR
VEHICLES
DISTANCE FROM FIRE
DEPARTMENT TO
EMERGENCY
N Valid 116 236,540 152 11 49 67 235,955
Missing 467,813 231,389 467,777 467,918 467,880 467,862 231,974
Table 4 Example Variables of Missing Values
As we can observe from the table, the following four variables have high proportion of missing values:
• RESPONSE TIME OF SUBSEQUENT VEHICLES (99.98% missing values) • NUMBER OF AERIALS (99.97% missing values) • NUMBER OF TANKERS (99.99% missing values) • NUMBER OF CFR VEHICLES (99.99% missing values)
These four variables will be excluded from our analysis in the data validation process due to the large number of missing values.
According to the Canadian Centre for Justice Statistics, a number of the variables in the NFID contain a relatively high proportion of “unknown” values. This posed a challenge in the analysis and interpretation of the data in the preparation of the analytical report in that “unknown” values create an underestimate in the “known” values [13].
We ran statistical analysis on all variables for “unknown” values. Table 5 below summarizes “unknown” values of the variable ILLEGAL USE OF BUILDING. From this table, we can observe

16
that the total percentage of cases with value ‘8’ or ‘9’ is 50.4%. According to the data dictionary, the value 8 represents ‘Not Applicable’ and the value 9 represents ‘Unknown’. In addition, we notice that there are 49.6% cases labeled ‘Valid’ with no specified value. Further examining the variable, we find that values for cases are ‘.’, which is considered as ‘valid’ by the system. This causes the fact that the total percentage of ‘unknown’ or invalid cases is almost 100%.
ILLEGAL USE OF BUILDING
Frequency Percent Valid Percent
Cumulative Percent
Valid
231,974 49.6 49.6 49.6
1 113 0.0 0.0 49.6
2 6 0.0 0.0 49.6
3 36 0.0 0.0 49.6
4 164 0.0 0.0 49.6
8 45,791 9.8 9.8 59.4
9 189,845 40.6 40.6 100.0
Total 467,929 100.0 100.0
Table 5 Example Variable of ‘Unknown’ Value
We treat “unknown” values as missing values and exclude such variables from our analysis.
Additionally, we perform the following analysis to examine the two datasets:
• Consistency among jurisdictions (The quality of some jurisdictions are better.) • Outliers (Some numeric fields contain extreme values, which may or may not be valid.) • Duplicate “keys” or duplicate cases (A unique key is required in order to link between
the incident dataset and the victim dataset.)
4.2 MAIN INFLUENTIAL VARIABLES ON FIREFIGHTER INJURIES
Our objective is to identify the main influential factors that have impact on firefighter injuries based on the victim dataset, which has 15,326 records in total with 36 variables.
Data Validation and Extraction
The source data is validated to ensure the accuracy of the results. Two types of data tests including missing data tests and duplicate records test are applied in this study. The missing data tests were performed on 36 variables.
The duplicate record validation test was performed on variable LINK_ID and the result is presented in Table 6. The result indicates that although there is no missing value for the variable (LINK_ID), there were 4,013 duplicate records, about 26.2% of the total records in the dataset. These duplicate records were excluded for further analysis.
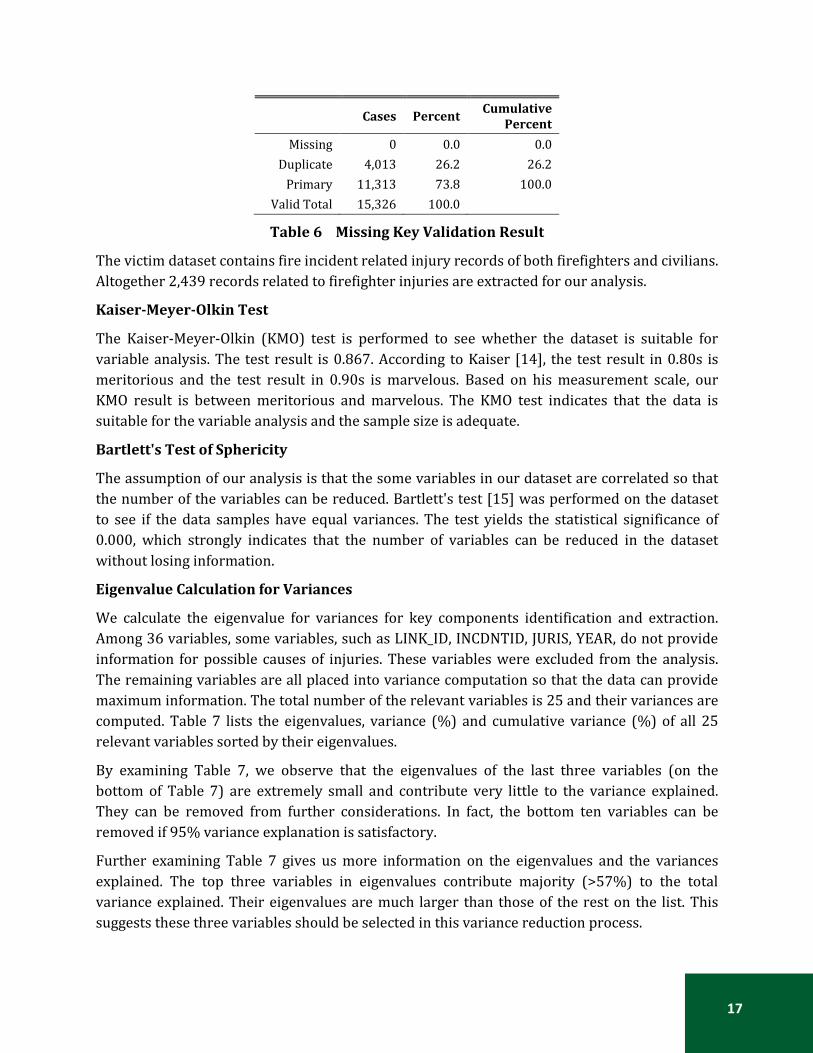
17
Cases Percent Cumulative Percent
Missing 0 0.0 0.0 Duplicate 4,013 26.2 26.2
Primary 11,313 73.8 100.0 Valid Total 15,326 100.0
Table 6 Missing Key Validation Result
The victim dataset contains fire incident related injury records of both firefighters and civilians. Altogether 2,439 records related to firefighter injuries are extracted for our analysis.
Kaiser-Meyer-Olkin Test
The Kaiser-Meyer-Olkin (KMO) test is performed to see whether the dataset is suitable for variable analysis. The test result is 0.867. According to Kaiser [14], the test result in 0.80s is meritorious and the test result in 0.90s is marvelous. Based on his measurement scale, our KMO result is between meritorious and marvelous. The KMO test indicates that the data is suitable for the variable analysis and the sample size is adequate.
Bartlett's Test of Sphericity
The assumption of our analysis is that the some variables in our dataset are correlated so that the number of the variables can be reduced. Bartlett's test [15] was performed on the dataset to see if the data samples have equal variances. The test yields the statistical significance of 0.000, which strongly indicates that the number of variables can be reduced in the dataset without losing information.
Eigenvalue Calculation for Variances
We calculate the eigenvalue for variances for key components identification and extraction. Among 36 variables, some variables, such as LINK_ID, INCDNTID, JURIS, YEAR, do not provide information for possible causes of injuries. These variables were excluded from the analysis. The remaining variables are all placed into variance computation so that the data can provide maximum information. The total number of the relevant variables is 25 and their variances are computed. Table 7 lists the eigenvalues, variance (%) and cumulative variance (%) of all 25 relevant variables sorted by their eigenvalues.
By examining Table 7, we observe that the eigenvalues of the last three variables (on the bottom of Table 7) are extremely small and contribute very little to the variance explained. They can be removed from further considerations. In fact, the bottom ten variables can be removed if 95% variance explanation is satisfactory.
Further examining Table 7 gives us more information on the eigenvalues and the variances explained. The top three variables in eigenvalues contribute majority (>57%) to the total variance explained. Their eigenvalues are much larger than those of the rest on the list. This suggests these three variables should be selected in this variance reduction process.

18
The Scree plot is generated to validate this assessment (Fig 1).
Variables Initial
Eigenvalues % of Variance Cumulative % 1 5.732 22.927 22.927 2 4.401 17.604 40.531 3 4.167 16.67 57.201 4 1.499 5.997 63.198 5 1.163 4.653 67.851 6 1.137 4.548 72.4 7 0.934 3.734 76.134 8 0.902 3.608 79.742 9 0.813 3.253 82.995
10 0.717 2.866 85.861 11 0.663 2.651 88.512 12 0.602 2.409 90.921 13 0.474 1.896 92.817 14 0.404 1.615 94.432 15 0.37 1.48 95.913 16 0.281 1.125 97.038 17 0.234 0.936 97.974 18 0.21 0.84 98.815 19 0.16 0.639 99.454 20 0.064 0.256 99.709 21 0.048 0.192 99.901 22 0.025 0.099 100 23 7.29E-14 2.92E-13 100 24 -1.47E-14 -5.90E-14 100 25 -1.05E-13 -4.20E-13 100
Table 7 Total Variance Explained I
Fig 1 shows that the “elbow” is at four on x-axis, which further validates that three is an appropriate choice for number of components in this variance reduction process.

19
Fig 1 Scree Plot of 25 Components (Victim Dataset)
From Table 8, we can see that the correlations of the chosen three components are 0.027, 0.056, and 0.052 respectively. The correlations coefficients indicate that these three components are not correlated significantly.
Component 1 2 3 1 1 0.027 0.056 2 0.027 1 0.052 3 0.056 0.052 1
Table 8 Component Correlation Matrix I
Analysis of both component variances and component correlation indicates that the three components solution is acceptable. Since each component loads five variables, we reduce the number of variables from 25 to 15. We re-compute the variances of these fifteen variables. Table 9 lists the eigenvalues, variance (%) and cumulative variance (%) of these fifteen variables ranked by their eigenvalues.
In order to select the optimal number of components, we did the following analysis:

20
1. Table 9 indicates that two is an optimal choice. From the Table 9, we can observe that the top two components contribute to most variance (total cumulative variance > 64 %) and their individual contributions are much greater than other components;
2. The sharp turn of the curve in Fig 2 clearly indicates that two is an optimal choice for the number of principle components;
3. We run parallel PCA test of Monte Carlo simulation (Table 10) and compare the eigenvalues generated in the simulation to the relevant eigenvalues in the Table 9.
Component Eigenvalues % of Variance Cumulative %
1 5.682 37.879 37.879 2 3.965 26.433 64.312 3 1.007 6.715 71.027 4 .961 6.405 77.432 5 .811 5.409 82.841 6 .661 4.408 87.249 7 .480 3.198 90.447 8 .393 2.619 93.065 9 .286 1.904 94.969
10 .242 1.616 96.585 11 .212 1.414 97.999 12 .162 1.078 99.077 13 .065 .430 99.507 14 .049 .328 99.835 15 .025 .165 100.000
Table 9 Total Variance Explained II
By comparing eigenvalues in the Table 9 with the random eigenvalues in the Table 10, we observe that in the first pair, 5.682 is greater than 1.1331. Thus, Component #1 is accepted. In the second pair, 3.965 is greater than 1.1054. Component #2 is also accepted. In the third pair, 1.007 is less than 1.0833. Component #3 and beyond are rejected. The Monte Carlo simulation for parallel PCA test validates that two principle components are the optimal choice in this case.
Number of variables: 15 Number of subjects: 2439 Number of replications: 100
Number Random
Eigenvalue Standard
Dev 1 1.1331 0.0157 2 1.1054 0.0131 3 1.0833 0.0108

21
4 1.0635 0.0102 5 1.0468 0.009 6 1.0305 0.0075 7 1.0147 0.0073 8 0.998 0.0078 9 0.9822 0.0081
10 0.9673 0.0074
Table 10 Monte Carlo simulation for Parallel PCA test
Fig 2 Scree Plot of 15 Components (Victim Dataset)
As the final step of the examination, the correlation of these two components is calculated. The result is shown in Table 11. The correlation coefficient (0.043) indicates that these two principle components are not correlated significantly. This validates the two principle components.
Component 1 2 1 1 0.043 2 0.043 1

22
Table 11 Component Correlation Matrix II
The structure matrix of the two components is presented in Table 12.
Component 1 2
Firefighter- Helmet Worn At Time of Injury .934 Firefighter- Helmet Line Used At Time of Injury .930 Firefighter - Coat (Turnout) Worn At Time of Injury .906 Firefighter - Boots Worn At Time of Injury .891 Firefighter - Gloves Worn At Time of Injury .841 Firefighter - Face Shield Used At Time of Injury .801 Firefighter - Breathing Apparatus Used At Time of Injury .654 Firefighter - Other Eye Protection Used At Time of Injury
Firefighter Status
Firefighter - Bunker Suit Worn At Time of Injury
Fire Fighting Years of Experience
.944 Age of Victim
.931 Height of Firefighter
.920 Weight of Firefighter
.918 Firefighter - Protective Hood Worn At Time of Injury
-.700
Table 12 Component Structure Matrix for Buildings
We choose top four variables from each principle components as the influential factors identified. These influential factors are:
1. Firefighter - Helmet Worn At Time of Injury 2. Firefighter - Helmet Line Used At Time of Injury 3. Firefighter - Coat (Turnout) Worn At Time of Injury 4. Firefighter - Boots Worn At Time of Injury 5. Fire Fighting Years of Experience 6. Age of Victim 7. Height Firefighter 8. Weight Firefighter
4.3 MAIN INFLUENTIAL VARIABLES ON FIRE INCIDENTS
The objective of this analysis is to identify the main influential factors that have impact on fire incidents based on the data provided. The source data is the incident dataset, which has a total of 467,927 records with 136 variables. We adopted the similar approach as described in the previous section.

23
Record Selection and Exclusion
The incident dataset contains fire incident records with different property types. Two main classes of properties involved in fire incidents in the past ten years are residential and transportation equipment. The dataset has about 29% of incident records for residential buildings and about 37% of incident records for transportation equipment (Table 13). Transportation equipment is a very different property class from residential building. Causes of fire for Transportation equipment should be studied separately. Since our focus is on buildings, records of transportation equipment class (Table 13 – code 8000) were not extracted.
In addition, in the incident dataset, three other classes of property have different risk characteristic in fire incident involvement. These classes are mercantile (Code 5000), industrial manufacturing (Code 6000) and storage (Code 7000). The records of these classes were not extracted, either.
Finally, the unspecified class (9000) and the unknown class (0000) are not included because they provide no additional information. Therefore, 153,570 records (32% of total records) are extracted from the incident dataset for our analysis.
Code Classification Valid Cumulative 1000 Assembly 2.77% 2.77% 2000 Institutional 0.58% 3.35% 3000 Residential 28.84% 32.19% 4000 Business & personal service 0.63% 32.82% 5000 Mercantile 1.87% 34.69% 6000 Industrial manufacturing companies 1.68% 36.37% 7000 Storage properties 3.50% 39.87% 8000 Special property & transportation equipment 36.78% 76.64% 9000 Miscellaneous property 6.83% 83.47% 0000 Unknown, undetermined, not applicable, not available 16.53% 100.00%
Table 13 Property Classification and Incidents Percentage
Variable Selection and Exclusion
Although there are 136 variables in the dataset, majority of them is irrelevant to either direct causes of fires or intensity of fire incidents. Such variables are in three categories:
• Incident Information (24 variables)
• Fire Loss Details (5 variables)
• Social Domain Information (56)
The variables in these three categories were not included in analysis. There are a dozen variables with 100% missing values. They were also excluded from the analysis.
The data of remaining 36 variables are included for analysis in order to identify variables that are more influential.

24
The Kaiser-Meyer-Olkin (KMO) test is performed and the test result is 0.628. The Bartlett's test of sphericity is also performed on the dataset and it yields statistical significance of 0.000. These test results indicate that the chosen data are suitable for variable reduction analysis.
Eigenvalue Calculation for Variances
From Table 14, last seven components contribute less than a half percent of the total variance explained. Furthermore, individual contribution from the top ranked component to the total variance explained is not significant. The top 13 components in total that have eigenvalues greater than one contribute only 69% to the total variance explained. Even the top two components do not contribute much. This indicates that potentially more components are required to explain the variance. The Scree plot (Fig 3) validates it.
Component Total % of
Variance Cumulative % 1 4.066 11.293 11.293 2 3.620 10.055 21.349 3 2.847 7.908 29.257 4 2.198 6.105 35.362 5 2.061 5.725 41.087 6 1.579 4.386 45.473 7 1.530 4.250 49.723 8 1.377 3.824 53.547 9 1.315 3.652 57.199
10 1.186 3.295 60.494 11 1.133 3.148 63.642 12 1.009 2.804 66.446 13 1.007 2.798 69.245 14 .983 2.731 71.975 15 .967 2.686 74.661 16 .929 2.582 77.243 17 .885 2.459 79.702 18 .833 2.315 82.017 19 .809 2.247 84.264 20 .761 2.114 86.378 21 .726 2.016 88.395 22 .704 1.957 90.352 23 .622 1.727 92.079 24 .588 1.633 93.712 25 .572 1.590 95.302 26 .553 1.537 96.839 27 .508 1.411 98.250 28 .461 1.279 99.530 29 .118 .329 99.858

25
30 .018 .051 99.909 31 .011 .029 99.938 32 .008 .021 99.959 33 .007 .018 99.978 34 .005 .013 99.991 35 .002 .007 99.997 36 .001 .003 100.000
Table 14 Initial Eigenvalues for 36 variables
Fig 3 shows that there is not clear ‘elbow’ turning point until 28~29 on x-axis. This ‘smooth’ downhill curve does not give clear indication of a ‘cut-off’ point.
Fig 3 Scree Plot for 36 Components (Incident Dataset)
Removing less informative variables will potentially improve this situation. The key question is to decide which variables to remove from the list. Our strategy is the below:
• Remove variables that provide inadequate information due to high percentage of missing values or ‘unknown’ values; and

26
• Remove variables that provide redundant information
Table 15 shows missing value analysis result. Variables that possess more than 60% missing values were excluded from the further analysis (highlighted in the Table 15).
One exception was the removal of Method of Fire Control & Extinguishment (Contmeth) due to both high percentage (56.7%) of missing values and ‘outliers’ (extreme high values).
Some variables provide similar information. For example, three variables, Property Class, Property Sub-group, and Property Group provide similar information. In order to reduce redundancy, we intended to keep only one of them. Since Property Group provides sufficient information for our analysis, we only kept Property Group in our analysis and the other two property related variables were dropped.
The following four pairs of variables were processed in the same approach:
1. Major Occupancy Group (Majocgrp) was retained while Major Occupancy (Majocc) was excluded;
2. Material First Ignited Group (Matergrp) was retained while Material First Ignited (Material) was excluded;
3. Act or Omission Group (Actomgrp) was retained while Act or Omission (Actorom) was excluded; and
4. Area of Origin Group (Origgrp) was retained while Area of Origin (Origin) was excluded.
After the variable selection analysis, 24 variables in total were retained for the next round of computational analysis.
N Mean Std. Deviation
Missing No. of Extremes
Count Percent Low High Propgrp 153,570 2,832.62 588.566 0 0.0 12,963 0 Propclas 153,570 3,075.82 541.381 0 0.0 12,963 1,116 Propsubg 153,570 3,045.78 538.132 0 0.0 12,963 901 Igniobj
153,570 358.40 346.452 0 0.0 0 0
Majocc 448,327 49.71 42.036 19,602 4.2 0 0
Majocgrp 467,929 175.42 285.789 0 0.0 0 53,123 Genconst 198,598 5.62 3.199 269,331 57.6 0 0 Yearcons 143,106 578.51 895.331 324,823 69.4 0 0 Height 431,511 5.47 49.042 36,418 7.8 0 1,078 Flrarea 208,538 5.03 3.343 259,391 55.4 0 0 Numbocc 385,908 1.74 3.141 82,021 17.5 0 8,769 Riskvalc 55,851 2,111,356.86 46,380,243.501 412,078 88.1 0 147 Manprot
434,553 2.65 3.547 33,376 7.1 0 0
Sprinpro 464,095 3.93 3.808 3,834 0.8 0 0

27
Autodet 434,553 3.07 3.871 33,376 7.1 0 14,374
Outprot 148,354 1.80 1.775 319,575 68.3 0 9,026 Energy 208,538 2.48 2.814 259,391 55.4 0 4,890 Matergrp 467,929 4,142.76 3,797.296 0 0.0 0 0 Material 457,989 459.38 407.939 9,940 2.1 0 0 Actorom 467,929 310.69 329.540 0 0.0 0 41,985 Actomgrp 467,929 2,747.06 2,999.523 0 0.0 0 42,025 Origin
467,929 538.71 374.990 0 0.0 0 0
Origgrp 467,929 4,950.24 3,691.906 0 0.0 0 0 Levelor 444,493 6.42 15.912 23,436 5.0 0 12,092 Fireext 389,001 1.72 2.927 78,928 16.9 0 32,160 Damext 93,566 4.57 2.808 374,363 80.0 0 0 Dollossc
222,469 32,857.90 440,613.398 245,460 52.5 0 865
Detect 434,553 12.29 26.707 33,376 7.1 0 47,456
Transalm 427,655 5.49 2.648 40,274 8.6 22,250 0
Action 339,095 2.31 1.856 128,834 27.5 0 13,191 Perform 444,493 2.73 3.771 23,436 5.0 0 0 Contmeth 202,432 39.73 23.185 265,497 56.7 0 10,535 Methdgrp 467,929 156.76 231.353 0 0.0 0 22,452 Impact 284,886 58.75 48.300 183,043 39.1 0 0
Table 15 Missing Value and Extreme Value Statistics
Re-perform KMO Test and Bartlett's Test
KMO test was re-performed to check the validity of the new dataset. The test result is 0.745, which shows a significant improvement. According to Kaiser’s proposed measurement, this number is in middle level. The Bartlett's test of sphericity was also re-performed on the new data set and it yields statistical significance of 0.000, which indicates that we can do variable reduction based on the new dataset.
Eigenvalues and variance explained were calculated and the Scree plot (Fig 4) was generated for the new dataset. Our component selection criterion in this analysis was to choose those components whose eigenvalues are greater than one. This criterion allows us choose seven principle components (Table 16).

28
Fig 4 Scree Plot for 23 Components (Incident Dataset)
Table 16 illustrates the seven principle components with their loaded variables, from which the influential variables can be inferred.
Variables Component
1 2 3 4 5 6 7 Initial detection .884 Building height .811 Ground floor area .723 Majocgrp -.610 .546 General construction
Energy causing ignition (form of heat)
.750 Fuel or energy associated with igniting object
.705 Actomgrp
.678 Matergrp
.646 Extent of fire
Sprinkler protection
.812 Manual fire protection facilities
.769

29
Performance of automatic extinguishing equipment
Origgrp .684
Ignobgrp .677
Level of origin .592
Automatic fire detection system -.640
Number of occupants .543
Impact of smoke alarm activation on occupant response/ evacuation Dollar loss - total property and contents
Transmission of alarm to fire department
Propgrp
.870 Action taken
.714 Methdgrp .696
Table 16 Principle Components and their Variable Loadings
Table 17 lists the influential variables identified by the quantitative analysis. The factors are listed in the order of importance (from high to low).
Factors Variables
Building Initial detection Building height Ground floor area Major Occupancy Group
Outbreak of Fire Energy causing ignition (form of heat) Fuel or energy associated with igniting object Act or Omission Group Material First Ignited Group
Protection Features Sprinkler protection Manual fire protection facilities
Fire Origin Area of Origin Group Igniting Object Group Level of Origin
Detect Automatic fire detection system Number of occupants
Property Property Classification Group
Control Action taken Method of Fire Control & Extinguishment Group
Table 17 Variables with Greater Influence on Building Fire Incidents

30
Residential Building Fire Incidents
Our analysis is specifically focused on residential buildings. Data was extracted from the incident dataset, 134,959 cases in total. The KMO test produces the measure at 7.57, which is an indicator of good data suitability and adequacy. The Barlett’s test shows that the significance level is 0.000, which allows us to do variable reduction for the dataset. The total number of variables in the analysis is 24. The choice of variables is the same as the previous sections, except for one variable, property classification group. Values of this variable (property classification group) caused computing errors. Instead we use a similar variable, Property Classification Subgroup.
The identified influential variables are listed in Table 18.
Factors Variables
Building Initial Detection Major Occupancy Group Building Height Ground Floor Area General Construction (As Related To Property Classification) Automatic Fire Detection System
Outbreak of Fire Energy causing ignition (form of heat) Fuel or energy associated with igniting object Act or Omission Group Material First Ignited Group
Protection Features Sprinkler protection Manual fire protection facilities
Fire Origin Area of Origin Group Igniting Object Group Level of Origin
Detect Number of Occupants Dollar Loss - Total Property and Contents
Control Action taken Method of Fire Control & Extinguishment Group
Auto-Control Performance of Automatic Extinguishing Equipment
Table 18 Variables with Greater Influence on Residential Fire Incidents
Several variances can be observed by comparing Table 17 with Table 16:

31
• General Construction and Automatic Fire Detection System are listed in the building factor and considered more influential. General Construction was not an identified variable for general buildings.
• Performance of Automatic Extinguishing Equipment is another newly added variable to the list. So is the dollar loss.
4.4 MAIN INFLUENTIAL VARIABLES ON SPREAD OF FIRES
Our objective is to identify main influential variables that are relevant to spread of fires. Artificial Neural Networks (ANN), a machine learning methodology, is applied in our analysis. A new binary variable (Spread) was created to reflect the categories, with zero representing non-spread and one representing spread. The value assignments are based on the values of the variable Extent of Fire (Fireext). The details of the variable are provided in Table 19.
Values Extent of Fire
1 Confined to object of origin 2
Confined to part of room/area of origin
3
Confined to room of origin 4
Confined to floor level of origin
5
Confined to building of origin 6
Extended beyond building of origin
7
Confined to roof 8
Not applicable - vehicle or outside area
9
Extent of fire – unclassified 14
Spread beyond room of origin
15
Multi-unit dwelling – Spread beyond room of fire origin, same floor, outside unit 16
Multi-unit-dwelling – Spread beyond room of fire origin, same floor, separate unit
17
Spread beyond floor of fire origin, different floor 18
Spread to entire structure
20
Spread beyond suit or apartment, same floor 21
Spread to additional suit or apartment, same floor
0
Extent of fire - unknown Blank Data element not available in jurisdictional system
Table 19 Codes of Extent of Fire
From Table 19, codes 1, 2, and 3 are considered as non-spread. Codes 8, 9, 0, and blank are considered as ‘unknown’ value. The rest codes are considered as spread. The records were excluded when value of the Extent of Fire is 8, 9, 0, or Blank. Spread is the dependent variable for the classifier.
The source data was extracted from the dataset used to identify main influential variables in Section 4.3. Records with missing values were filtered out. 90,597 records in total were

32
included. The records were randomly divided into two sets: training set and testing test. Training set had 70% of the data and testing set had 30% of the data.
The overall accuracy of the ANN model based on the training set is 79.3% and the overall accuracy based on the testing set is 78.8%. The area under the curve (Spread = 1) is 0.869; the area under the curve (Spread = 0) is also 0.869. All these measures indicate that this ANN model is an adequate model to discover the pattern in the data.
In the computation process, ANN model computes the ‘weight’ that each variable contributes to the prediction during its formation. We call the relative weight of each variable as relative importance and use them to create a normalized importance plot. The normalized importance plot allows us to visualize importance of those variables on a single chart (Fig 5) below.
In Fig 5, the left scale is the measure of real number (importance) and the right scale is the measure of relative proportion. The highest importance is defined as one (100%) and the remaining are calculated based on its proportion.
The eighteen variables stand on the x-axis with their labels on the bottom of the figure. These eighteen variables are ranked from the highest to the lowest (left to right) in the order of their importance.

33
Fig 5 Relative Importance of Variables on Spreading Fires
Studying Fig 5 allows us to learn which variables are more important to spread of a fire. The following is a list of the eighteen variables.
1. METHDGRP – Method of Fire Control & Extinguishment 2. ACTION – Action Taken, referring to the action taken to combat the fire 3. ORIGGRP – Area of Origin (Group), referring to the specific use or occupancy of that part
of the property where the fire originates 4. MATERGRP – Material First Ignited (Group), referring to is the actual material ignited
which brings about the fire condition. 5. IGNOBGRP – Igniting Object (Group), is the actual equipment, device or item which
brings about ignition. 6. HEIGHT – Building Height 7. MAJOCC – Major Occupancy

34
8. ACTOMGRP – Act or Omission (Group), is a set of circumstances precipitated by human acts (something is done) or human omissions to act (something which has not been done).
9. FUELERGY – Fuel or Energy Associated with Igniting Object 10. MANPROT – Manual Fire Protection Facilities 11. MAJOCGRP – Major Occupancy Group 12. AUTODET – Automatic Fire Detection System 13. DETECT – Initial Detection, referring to the means by which the fire incident was first
detected. 14. SPRINPRO – Sprinkler Protection 15. LEVELOR – Level of Origin, referring to the floor or area where the fire originated. 16. FLRAREA – Ground Floor Area (in m2) 17. ENERGY – Energy Causing Ignition, referring to the energy which associates the Igniting
Object with the Material First Ignited. 18. PROPGRP – Property Classification Group
Conclusion
We used principle component analysis and other statistical methods to analyze cases of firefighters’ injuries. The dataset used for this analysis is victim dataset. As a result, eight variables: Firefighter - Helmet Worn At Time of Injury, Firefighter - Helmet Line Used At Time of Injury, Firefighter - Coat (Turnout) Worn At Time of Injury, Firefighter - Boots Worn At Time of Injury, Fire Fighting Years of Experience, Age of Victim, Height Firefighter, Weight Firefighter, from the victim dataset are identified as main influential variables to firefighter injury.
We used similar approach to analyze cases of residential fire incidents. The dataset used for this analysis is incident dataset. As a result, eighteen variables: Initial detection, Building height, Ground floor area, Major Occupancy Group, Energy causing ignition (form of heat), Fuel or energy associated with igniting object, Act or Omission Group, Material First Ignited Group, Sprinkler protection, Manual fire protection facilities, Area of Origin Group, Igniting Object Group, Level of Origin, Automatic fire detection system, Number of occupants, Property Classification Group, Action taken, Method of Fire Control & Extinguishment Group, from the incident dataset are identified as main influential variables to residential fire incidents.
We used artificial neural networks to model spread of fires. The dataset used for this analysis is also incident dataset. Overall accuracy of the model is 79%. The model generates relative importance for each variable’s influence on spreading of building fires.

35
Acknowledgments
This work is supported by the Canadian Association of Fire Chiefs. The authors want to thank Mr. Zhaowei Yang and Prof. Michael Chen in York University for the support.
References
[1] Chun Kit Lau, Kin Keung Lai, Yan Pui Lee, and Jiangze Du, Fire risk assessment with scoring system using the support vector machine approach, Fire Safety Journal, 78, 2015, pp.188–195.
[2] Ali Asgary, Ali Sadeghi Naini, and Jason Levy, Modeling the risk of structural fire incidents using a self-organizing map, Fire Safety Journal, 49, 2012, pp. 1–9.
[3] K. P. Vadrevu, A. Eaturu, and K. V. S. Badarinath, Fire risk evaluation using multicriteria analysis—A case study, Environmental Monitoring and Assessment, 166, 2010, pp. 223–239
[4] A.P.Harpur, K.E.Boyce, and N.C.McConnell, An investigation into the circumstances surrounding fatal dwelling fires involving very young children, Fire Safety Journal, 61, 2013, pp.72–82.
[5] Mavis Duncanson, Alistair Woodward, and Papaarangi Reid, Socioeconomic deprivation and fatal unintentional domestic fire incidents in New Zealand 1993–1998, Fire Safety Journal, 37, 2002, pp.165–179.
[6] Charles, R. Jennings, Social and economic characteristics as determinants of residential fire risk in urban neighborhoods: A review of the literature, Fire Safety Journal, 62, 2013, pp.13–19.
[7] Chris Hastie, Rosalind Searle, Socio-economic and demographic predictors of accidental dwelling fire rates, Fire Safety Journal, 84, 2016, pp.50-56.
[8] E. Cloutier, and D. Champoux, Injury risk profile and aging among Quebec firefighters, International Journal of Industrial Ergonomics, 25, 2000, pp. 513-523.
[9] Carla Britton, Charles F. Lynch, James Torner, Corinne Peek-Asa, Fire characteristics associated with firefighter injury on large federal wildland fires, Annals of Epidemiology, 23, 2013, pp.37-42.
[10] Deena S. Rosalky, David Hostler, Heather E. Webb, Work duration does not affect cortisol output in experienced firefighters performing live burn drills, Applied Ergonomics, 58, 2017, pp.583-591.
[11] H. Hotelling, Analysis of a complex of statistical variables into principal components. Journal of Educational Psychology, 24, 1933, 417–441, and 498–520.
[12] Simon S. Haykin, Neural networks: a comprehensive foundation. Prentice Hall, 1999.

36
[13] The Canadian Centre for Justice Statistics, Sustainability of the National Fire Information Database – Next Steps, September 2017. nfidcanada.ca/statistics-canada-report/
[14] Henry F. Kaiser, John Rice, LITTLE JEFFY MARK IV, Educational and Psychological Measurement 1974, 34, 1974, p111 – p117.
[15] George W. Snedecor, and William G. Cochran, Statistical Methods, Eighth Edition, Iowa State University Press, 1989.
[16] www.surefirecpr.com/rescuer-needs-rescued-introducing-firefighter-cpr/

37
Author Biographical Information
Zijiang Yang received the M.A.Sc. and Ph.D. degrees in industrial engineering from the University of Toronto, Toronto, ON, Canada, in 1999 and 2002, respectively. Currently, she is a full Professor at the School of Information Technology, York University, Toronto, ON, Canada. Her current research interests include prediction, classification, performance analysis in the financial service industry, and data mining algorithms. She has published papers in IEEE Transactions on Neural Networks, Communications in Nonlinear Science and Numerical Simulations, Information Sciences, IEEE Transactions on Systems, Man, and Cybernetics--Part C: Applications and Reviews, IEEE Transactions on Engineering Management, Knowledge-Based Systems, Chemometrics and Intelligent Laboratory Systems, Expert System with Applications, Computers and Operations Research, Applied Mathematics and Computation, Mathematical and Computer Modeling, Journal of the OR Society (JORS), Annals of Operations Research, Engineering Computations, and other peer-reviewed journals.
Youwu Liu received the M. Sc. degree in computer science and MBA degree from Loyola University Chicago, Chicago, IL, USA, in 1993 and 1995, respectively. He received the Ontario graduate diploma in data analytics from Centennial College, Toronto, ON, Canada, in 2013. Currently, he is a graduate student at York University, Toronto, ON, Canada. His current research interests include mathematical modelling, machine learning, artificial neural networks, and statistical analysis in real world applications.

38