using scientific measurements - amazon s3 · using scientific measurements main ideas accuracy is...
TRANSCRIPT

Key Termsaccuracy significant figures inversely proportionalprecision scientific notationpercentage error directly proportional
If you have ever measured something several times, you know that the results can vary. In science, for a reported measurement to be useful, there must be some indication of its reliability or uncertainty.
Main idea
Accuracy is different from precision.The terms accuracy and precision mean the same thing to most people. However, in science their meanings are quite distinct. Accuracy refers
to the closeness of measurements to the correct or accepted value of
the quantity measured. Precision refers to the closeness of a set of
measurements of the same quantity made in the same way. Thus, measured values that are accurate are close to the accepted value. Measured values that are precise are close to one another but not necessarily close to the accepted value.
Figure 3.1 on the facing page can help you visualize the difference between precision and accuracy. Several darts thrown separately at a dartboard may land in various positions, relative to the bull’s-eye and to one another. The closer the darts land to the bull’s - eye, the more accu-rately they were thrown. The closer they land to one another, the more precisely they were thrown. Thus, the set of results shown in Figure 3.1a is both accurate and precise: the darts are close to the bull’s - eye and close to each other. In Figure 3.1b, the set of results is inaccurate but precise: the darts are far from the bull’s - eye but close to each other. In Figure 3.1c, the set of results is both inaccurate and imprecise: the darts are far from the bull’s - eye and far from each other. Notice also that the darts are not evenly distributed around the bull’s - eye, so the set, even considered on average, is inaccurate. In Figure 3.1d, the set on average is accurate compared with the third case, but it is imprecise. That is because the darts are distributed evenly around the bull’s - eye but are far from each other.
Percentage ErrorThe accuracy of an individual value or of an average experimental value can be compared quantitatively with the correct or accepted value by calculating the percentage error. Percentage error is calculated by subtract-
ing the accepted value from the experimental value, dividing the difference by
the accepted value, and then multiplying by 100.
Using Scientific Measurements
Main ideas
Accuracy is different from precision.
Significant figures are those measured precisely, plus one estimated digit.
Scientific notation is used to express very large or very small numbers.
Sample problems are guides to solving similar types of problems.
Variables that are directly proportional increase or decrease by the same factor.
Quantities are inversely proportional if one decreases in value when the other increases.
> Virginia standards
CH.1 The student will investigate and understand that experiments in which variables are measured, analyzed, and evaluated produce observations and verifiable data. Key concepts include:CH.1.f mathematical and procedural error analysis.CH.1.g mathematical manipulations including SI units, scientific notation, linear equations, graphing, ratio and proportion, significant digits, and dimensional analysis.CH.1.EKS-11; CH.1.EKS-12; CH.1.EKS-14; CH.1.EKS-15; CH.1.EKS-17; CH.1.EKS-18; CH.1.EKS-20; CH.1.EKS-22
42 Chapter 2
SectIon 3

(a) Darts within small area = High precision
Area centered on bull’s-eye = High accuracy
(b) Darts within small area = High precision
Area far from bull’s-eye = Low accuracy
(c) Darts within large area = Low precision
Area far from bull’s-eye = Low accuracy
(d) Darts within large area = Low precision
Area centered around bull’s-eye = High accuracy (on average)
Percentage error has a negative value if the accepted value is greater than the experimental value. It has a positive value if the accepted value is less than the experimental value. The following sample problem illustrates the concept of percentage error.
Percentage Error
Sample Problem C A student measures the mass and volume of a substance and calculates its density as 1.40 g/mL. The correct, or accepted, value of the density is 1.30 g/mL. What is the percentage error of the student’s measurement?
SolVe Percentage error = Valueexperimental – Valueaccepted
___ Valueaccepted
× 100
= 1.40 g/mL – 1.30 g/mL
___ 1.30 g/mL
× 100 = 7.7%
Answers in Appendix E
1. What is the percentage error for a mass measurement of 17.7 g, given that the correct value is 21.2 g?
2. A volume is measured experimentally as 4.26 mL. What is the percentage error, given that the correct value is 4.15 mL?
Comparing Precision and Accuracy
Figure 3.1
Percentage Error
Percentage error = Valueexperimental – Valueaccepted
___ Valueaccepted
×100
43Measurements and Calculations
ChemistryHMDScience.com
Premium Content
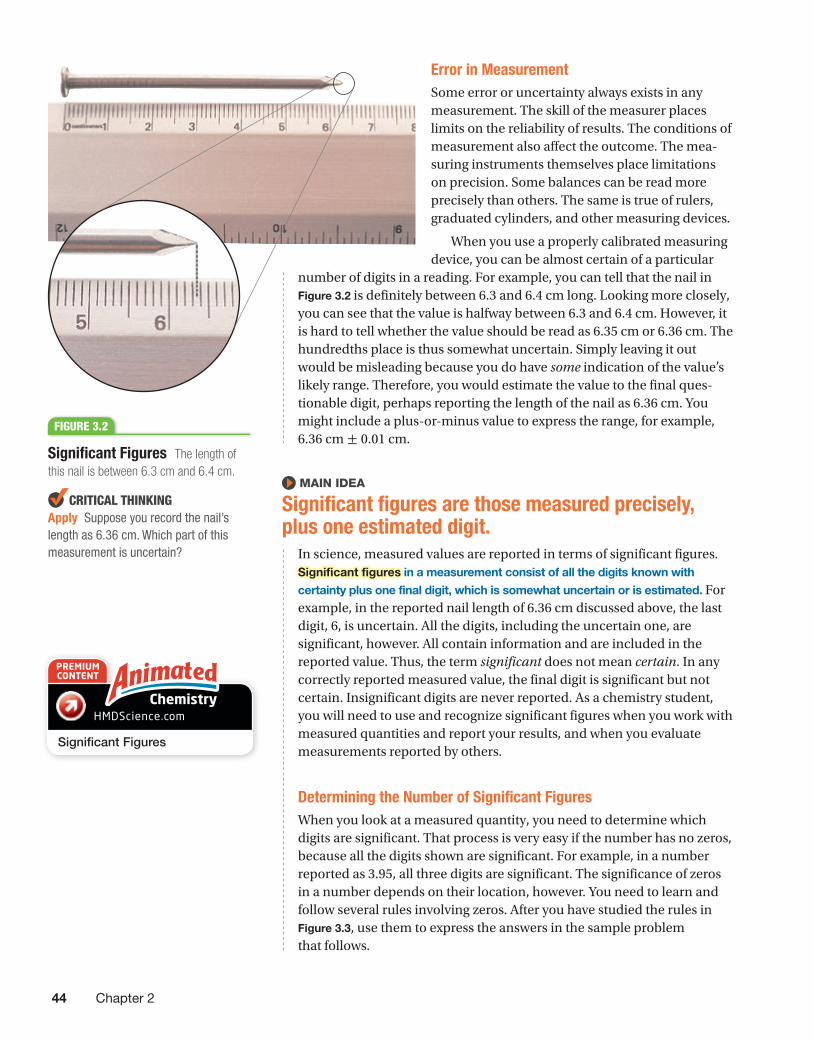
Error in MeasurementSome error or uncertainty always exists in any measurement. The skill of the measurer places limits on the reliability of results. The conditions of measurement also affect the outcome. The mea-suring instruments them selves place limitations on precision. Some balances can be read more precisely than others. The same is true of rulers, graduated cylinders, and other measuring devices.
When you use a properly calibrated measuring device, you can be almost certain of a particular
number of digits in a reading. For example, you can tell that the nail in Figure 3.2 is definitely between 6.3 and 6.4 cm long. Looking more closely, you can see that the value is halfway between 6.3 and 6.4 cm. However, it is hard to tell whether the value should be read as 6.35 cm or 6.36 cm. The hundredths place is thus somewhat uncertain. Simply leaving it out would be misleading because you do have some indication of the value’s likely range. Therefore, you would estimate the value to the final ques-tionable digit, perhaps reporting the length of the nail as 6.36 cm. You might include a plus - or - minus value to express the range, for example, 6.36 cm ± 0.01 cm.
Main idea
Significant figures are those measured precisely, plus one estimated digit.
In science, measured values are reported in terms of significant figures. Significant figures in a measurement consist of all the digits known with
certainty plus one final digit, which is somewhat uncertain or is estimated. For example, in the reported nail length of 6.36 cm discussed above, the last digit, 6, is uncertain. All the digits, including the uncertain one, are significant, however. All contain information and are included in the reported value. Thus, the term significant does not mean certain. In any correctly reported measured value, the final digit is significant but not certain. Insignificant digits are never reported. As a chemistry student, you will need to use and recognize significant figures when you work with measured quantities and report your results, and when you evaluate measurements reported by others.
Determining the Number of Significant FiguresWhen you look at a measured quantity, you need to determine which digits are significant. That process is very easy if the number has no zeros, because all the digits shown are significant. For example, in a number reported as 3.95, all three digits are significant. The significance of zeros in a number depends on their location, however. You need to learn and follow several rules involving zeros. After you have studied the rules in Figure 3.3, use them to express the answers in the sample problem that follows.
Significant Figures The length of this nail is between 6.3 cm and 6.4 cm.
critical thinkingApply Suppose you record the nail’s length as 6.36 cm. Which part of this measurement is uncertain?
Figure 3.2
Significant Figures
44 Chapter 2
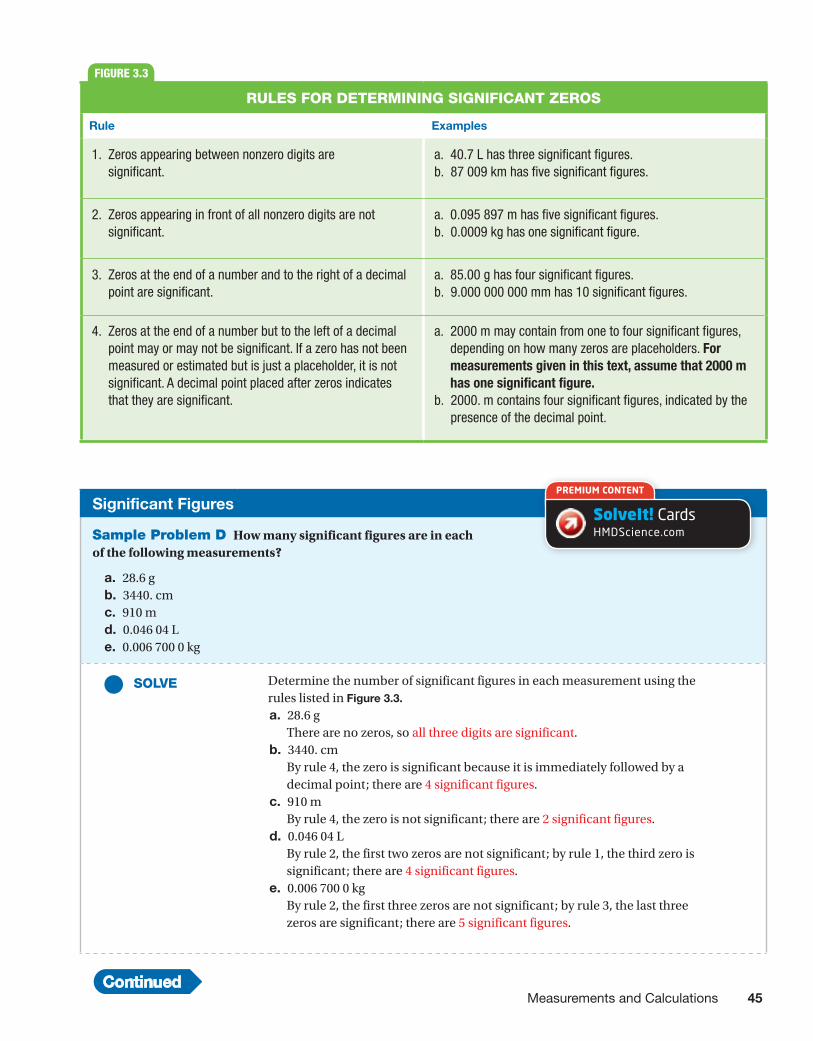
Figure 3.3
RuleS foR deteRMining Significant ZeRoS
Rule Examples
1. Zeros appearing between nonzero digits are significant.
a. 40.7 L has three significant figures.b. 87 009 km has five significant figures.
2. Zeros appearing in front of all nonzero digits are not significant.
a. 0.095 897 m has five significant figures.b. 0.0009 kg has one significant figure.
3. Zeros at the end of a number and to the right of a decimal point are significant.
a. 85.00 g has four significant figures.b. 9.000 000 000 mm has 10 significant figures.
4. Zeros at the end of a number but to the left of a decimal point may or may not be significant. If a zero has not been measured or estimated but is just a placeholder, it is not significant. A decimal point placed after zeros indicates that they are significant.
a. 2000 m may contain from one to four significant figures, depending on how many zeros are placeholders. For measurements given in this text, assume that 2000 m has one significant figure.
b. 2000. m contains four significant figures, indicated by the presence of the decimal point.
Significant Figures
Sample Problem D How many significant figures are in each of the following measurements?
a. 28.6 gb. 3440. cmc. 910 md. 0.046 04 Le. 0.006 700 0 kg
SolVe Determine the number of significant figures in each measurement using the rules listed in Figure 3.3.
a. 28.6 gThere are no zeros, so all three digits are significant.
b. 3440. cmBy rule 4, the zero is significant because it is immediately followed by a decimal point; there are 4 significant figures.
c. 910 mBy rule 4, the zero is not significant; there are 2 significant figures.
d. 0.046 04 LBy rule 2, the first two zeros are not significant; by rule 1, the third zero is significant; there are 4 significant figures.
e. 0.006 700 0 kgBy rule 2, the first three zeros are not significant; by rule 3, the last three zeros are significant; there are 5 significant figures.
Continued
SolveIt! CardsHMDScience.com
Premium Content
45Measurements and Calculations

RoundingWhen you perform calculations involving measurements, you need to know how to handle significant figures. This is especially true when you are using a calculator to carry out mathematical operations. The answers given on a calculator can be derived results with more digits than are justified by the measurements.
Suppose you used a calculator to divide a measured value of 154 g by a measured value of 327 mL. Each of these values has three significant figures. The calculator would show a numerical answer of 0.470948012. The answer contains digits not justified by the measurements used to calculate it. Such an answer has to be rounded off to make its degree of certainty match that in the original measurements. The answer should be 0.471 g/mL.
The rules for rounding are shown in Figure 3.4. The extent of rounding required in a given case depends on whether the numbers are being added, subtracted, multiplied, or divided.
Significant Figures (continued)
Answers in Appendix E
1. Determine the number of significant figures in each of the following.a. 804.05 gb. 0.014 403 0 kmc. 1002 md. 400 mLe. 30 000. cmf. 0.000 625 000 kg
2. Suppose the value “seven thousand centimeters” is reported to you. How should the number be expressed if it is intended to contain the following?a. 1 significant figureb. 4 significant figuresc. 6 significant figures
Figure 3.4
RuleS foR Rounding nuMbeRS
If the digit following the last digit to be retained is:
then the last digit should: Example (rounded to three significant figures)
greater than 5 be increased by 1 42.68 g ―⟶ 42.7 g
less than 5 stay the same 17.32 m ―⟶ 17.3 m
5, followed by nonzero digit(s) be increased by 1 2.7851 cm ―⟶ 2.79 cm
5, not followed by nonzero digit(s), and preceded by an odd digit
be increased by 1 4.635 kg ―⟶ 4.64 kg (because 3 is odd)
5, not followed by nonzero digit(s), and the preceding significant digit is even
stay the same 78.65 mL ―⟶ 78.6 mL (because 6 is even)
46 Chapter 2

Addition or Subtraction with Significant FiguresConsider two mass measurements, 25.1 g and 2.03 g. The first measurement, 25.1 g, has one digit to the right of the decimal point, in the tenths place. There is no information on possible values for the hundredths place. That place is simply blank and cannot be assumed to be zero. The other measurement, 2.03 g, has two digits to the right of the decimal point. It provides information up to and including the hundredths place.
Suppose you were asked to add the two measurements. Simply carrying out the addition would result in an answer of 25.1 g + 2.03 g = 27.13 g. That answer suggests there is certainty all the way to the hundredths place. However, that result is not justified because the hundredths place in 25.1 g is completely unknown. The answer must be adjusted to reflect the uncertainty in the numbers added.
When adding or subtracting decimals, the answer must have the same number of digits to the right of the decimal point as there are in the measurement having the fewest digits to the right of the decimal point. When you compare the two values 25.1 g and 2.03 g, the measurement with the fewest digits to the right of the decimal point is 25.1 g. It has only one such digit. Following the rule, the answer must be rounded so that it has no more than one digit to the right of the decimal point. The answer should therefore be rounded to 27.1 g.
When working with whole numbers, the answer should be rounded so that the final significant digit is in the same place as the leftmost uncer-tain digit. For example, 5400 + 365 = 5800.
Multiplication and Division with Significant FiguresSuppose you calculated the density of an object that has a mass of 3.05 g and a volume of 8.47 mL. The following division on a calculator will give a value of 0.360094451.
density = mass _ volume
= 3.05 g
_ 8.47 mL
= 0.360094451 g/mL
The answer must be rounded to the correct number of significant figures. The values of mass and volume used to obtain the answer have only three significant figures each. The degree of certainty in the calculated result is not justified. For multiplication or division, the answer can have no more significant figures than are in the measurement with the fewest number of significant figures. In the calculation just described, the answer, 0.360094451 g/mL, would be rounded to three significant figures to match the significant figures in 8.47 mL and 3.05 g. The answer would thus be 0.360 g/mL.
cHecK foR undeRStandingAnalyze Suppose you measure the classroom once using a piece of rope you know to be 10 m long and again with a measuring tape marked in m, cm, and mm. You then take the average of the two measurements. Which would de-termine the number of significant figures in your answer? Explain your answer.
47Measurements and Calculations

Conversion Factors and Significant FiguresEarlier in this chapter, you learned how conversion factors are used to change one unit to another. Such conversion factors are typically exact. That is, there is no uncertainty in them. For example, there are exactly 100 cm in a meter. If you were to use the conversion factor 100 cm/m to change meters to centimeters, the 100 would not limit the degree of certainty in the answer. Thus, 4.608 m could be converted to centimeters as follows.
4.608 m × 100 cm _ m = 460.8 cm
The answer still has four significant figures. Because the conversion factor is considered exact, the answer would not be rounded. Most exact conversion factors are defined, rather than measured, quantities.
Counted numbers also produce conversion factors of unlimited precision. For example, if you counted that there are 10 test tubes for every student, that would produce an exact conversion factor of 10 test tubes/student. There is no uncertainty in that factor.
SolVe Carry out each mathematical operation. Follow the rules in Figures 3.3 and 3.4 for determining significant figures and for rounding.a. The answer is rounded to 2.83 m, because for subtraction
there should be two digits to the right of the decimal point, to match 5.44 m.
b. The answer is rounded to 38 g, because for multiplication there should be two significant figures in the answer, to match 2.4 g/mL.
1. What is the sum of 2.099 g and 0.05681 g?2. Calculate the quantity 87.3 cm – 1.655 cm.3. Calculate the area of a rectangular crystal surface that measures 1.34 µm by 0.7488 µm.
(Hint: Recall that area = length × width and is measured in square units.)4. Polycarbonate plastic has a density of 1.2 g/cm3. A photo frame is constructed from two
3.0 mm sheets of polycarbonate. Each sheet measures 28 cm by 22 cm. What is the mass of the photo frame?
Significant Figures
Sample Problem E Carry out the following calculations. Express each answer to the correct number of significant figures.
a. 5.44 m – 2.6103 mb. 2.4 g/mL × 15.82 mL
48 Chapter 2
Main idea
Scientific notation is used to express very large or very small numbers.
In scientific notation, numbers are written in the form M × 10n, where the
factor M is a number greater than or equal to 1 but less than 10, and n is a
whole number. For example, to put the quantity 65 000 km in scientific notation and show the first two digits as significant, you would write:
6.5 × 10⁴ km
Writing the M factor as 6.5 shows that there are exactly two significant figures. If, instead, you intended the first three digits in 65 000 to be significant, you would write 6.50 × 10⁴ km. When numbers are written in scientific notation, only the significant figures are shown.
Suppose you are expressing a very small quantity, such as the length of a flu virus. In ordinary notation this length could be 0.000 12 mm. That length can be expressed in scientific notation as follows.
0.000 12 mm = 1.2 × 10 –4 mm
Move the decimal point four places to the right, and multiply the number by 10 – 4.
1. Determine M by moving the decimal point in the original number to the left or the right so that only one nonzero digit remains to the left of the decimal point.
2. Determine n by counting the number of places that you moved the decimal point. If you moved it to the left, n is positive. If you moved it to the right, n is negative.
Mathematical Operations Using Scientific Notation1. Addition and subtraction These operations can be performed only
if the values have the same exponent (n factor). If they do not, adjustments must be made to the values so that the exponents are equal. Once the exponents are equal, the M factors can be added or subtracted. The exponent of the answer can remain the same, or it may then require adjustment if the M factor of the answer has more than one digit to the left of the decimal point. Consider the example of the addition of 4.2 × 10⁴ kg and 7.9 × 10³ kg. We can make both exponents either 3 or 4. The following solutions are possible.
4.2 × 10⁴ kg
+0.79 × 10⁴ kg
4.99 × 10⁴ kg rounded to 5.0 × 10⁴ kg
or
7.9 × 10³ kg
+42 × 103 kg
49.9 × 10³ kg = 4.99 × 10⁴ kg rounded to 5.0 × 10⁴ kg
Note that the units remain kg throughout.
49Measurements and Calculations
2. Multiplication The M factors are multiplied, and the exponents are added algebraically.
Consider the multiplication of 5.23 × 106 µm by 7.1 × 10 -2 µm.
(5.23 × 106 µm)(7.1 × 10 –2 µm) = (5.23 × 7.1)(106 × 10 –2)
= 37.133 × 104 µm2 (adjust to two significant digits)
= 3.7 × 105 µm2
Note that when length measurements are multiplied, the result is area. The unit is now µm2.
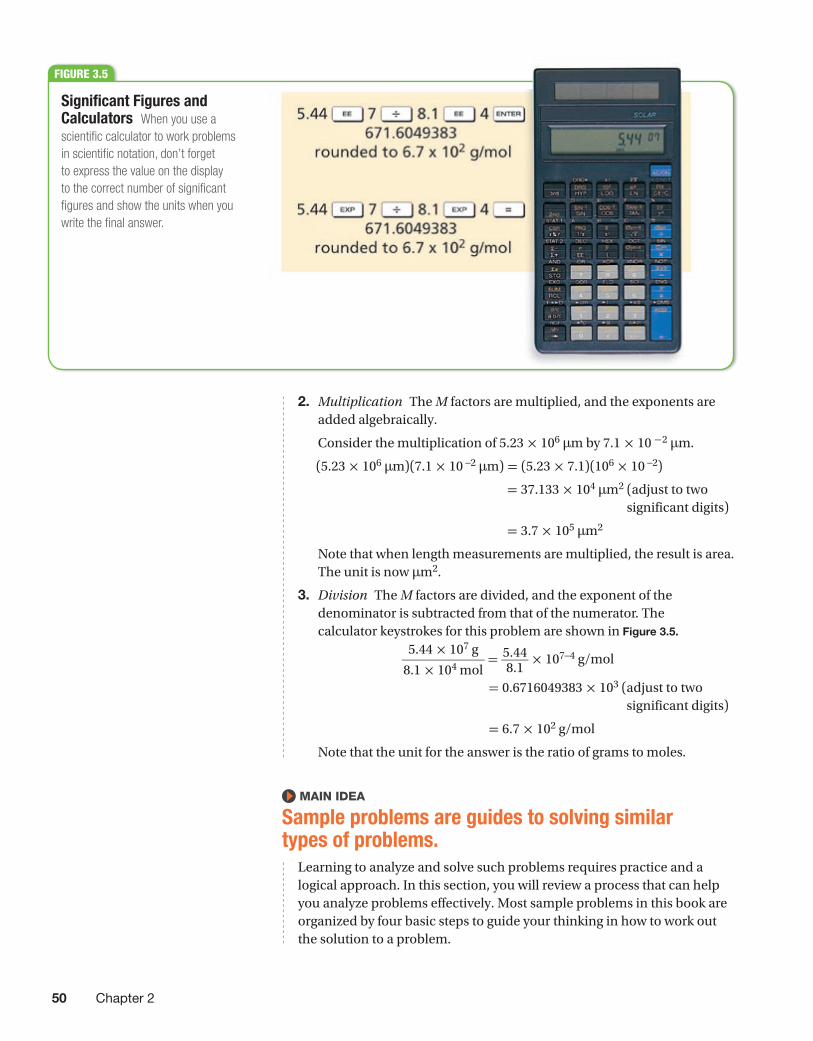
3. Division The M factors are divided, and the exponent of the denominator is subtracted from that of the numerator. The calculator keystrokes for this problem are shown in Figure 3.5.
5.44 × 10⁷ g
__ 8.1 × 10⁴ mol
= 5.44 _ 8.1
× 107–4 g/mol
= 0.6716049383 × 10³ ( adjust to two significant digits)
= 6.7 × 10² g/mol
Note that the unit for the answer is the ratio of grams to moles.
Main idea
Sample problems are guides to solving similar types of problems.
Learning to analyze and solve such problems requires practice and a logical approach. In this section, you will review a process that can help you analyze problems effectively. Most sample problems in this book are organized by four basic steps to guide your thinking in how to work out the solution to a problem.
Figure 3.5
Significant Figures and Calculators When you use a scientific calculator to work problems in scientific notation, don’t forget to express the value on the display to the correct number of significant figures and show the units when you write the final answer.
50 Chapter 2

Step 1. AnalyzeThe first step in solving a quantitative word problem is to read the problem carefully at least twice and to analyze the information in it. Note any important descriptive terms that clarify or add meaning to the problem. Identify and list the data given in the problem. Also identify the unknown—the quantity you are asked to find.
Step 2. PlanThe second step is to develop a plan for solving the problem. The plan should show how the information given is to be used to find the unknown. In the process, reread the problem to make sure you have gathered all the necessary information. It is often helpful to draw a picture that represents the problem. For example, if you were asked to determine the volume of a crystal given its dimensions, you could draw a representation of the crystal and label the dimensions. This drawing would help you visualize the problem.
Decide which conversion factors, mathematical formulas, or chemical principles you will need to solve the problem. Your plan might suggest a single calculation or a series of them involving different conversion factors. Once you understand how you need to proceed, you may wish to sketch out the route you will take, using arrows to point the way from one stage of the solution to the next. Sometimes you will need data that are not actually part of the problem statement. For instance, you’ll often use data from the periodic table.
Step 3. SolveThe third step involves substituting the data and necessary conversion factors into the plan you have developed. At this stage you calculate the answer, cancel units, and round the result to the correct number of significant figures. It is very important to have a plan worked out in step 2 before you start using the calculator. All too often, students start multiply-ing or dividing values given in the problem before they really understand what they need to do to get an answer.
Step 4. Check Your WorkExamine your answer to determine whether it is reasonable. Use the following methods, when appropriate, to carry out the evaluation.
1. Check to see that the units are correct. If they are not, look over the setup. Are the conversion factors correct?
2. Make an estimate of the expected answer. Use simpler, rounded numbers to do so. Compare the estimate with your actual result. The two should be similar.
3. Check the order of magnitude in your answer. Does it seem reasonable compared with the values given in the problem? If you calculated the density of vegetable oil and got a value of 54.9 g/mL, you should know that something is wrong. Oil floats on water.
51Measurements and Calculations
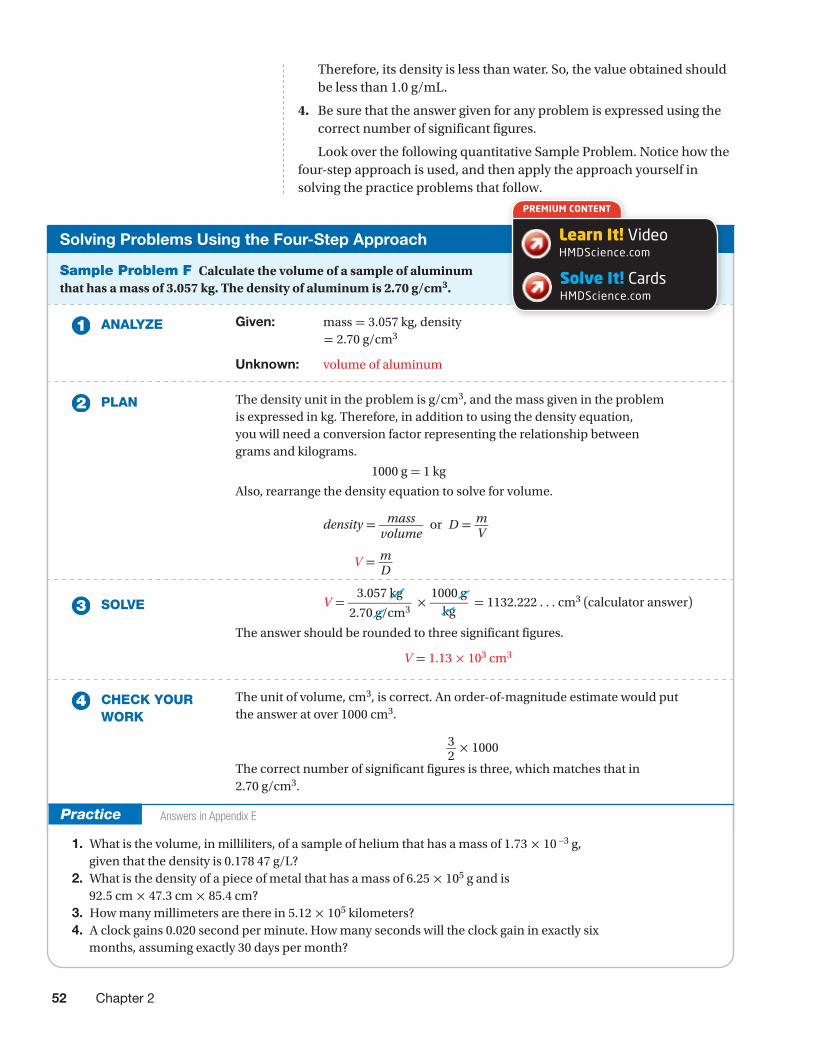
Solving Problems Using the Four-Step Approach
Sample Problem F Calculate the volume of a sample of aluminum that has a mass of 3.057 kg. The density of aluminum is 2.70 g/cm3.
analyZe Given: mass = 3.057 kg, density = 2.70 g/cm3
Unknown: volume of aluminum
Plan The density unit in the problem is g/cm3, and the mass given in the problem is expressed in kg. Therefore, in addition to using the density equation, you will need a conversion factor representing the relationship between grams and kilograms.
1000 g = 1 kg
Also, rearrange the density equation to solve for volume.
density = mass _ volume
or D = m _ V
V = m _ D
SolVe V = 3.057 kg
__ 2.70 g/cm3
× 1000 g
_ kg
= 1132.222 . . . cm3 (calculator answer)
The answer should be rounded to three significant figures.
V = 1.13 × 103 cm3
cHecK youR WoRK
The unit of volume, cm3, is correct. An order - of - magnitude estimate would put the answer at over 1000 cm3.
3 _ 2
× 1000
The correct number of significant figures is three, which matches that in 2.70 g/cm3.
Answers in Appendix E
1. What is the volume, in milliliters, of a sample of helium that has a mass of 1.73 × 10 –3 g, given that the density is 0.178 47 g/L?
2. What is the density of a piece of metal that has a mass of 6.25 × 10⁵ g and is 92.5 cm × 47.3 cm × 85.4 cm?
3. How many millimeters are there in 5.12 × 10⁵ kilometers?4. A clock gains 0.020 second per minute. How many seconds will the clock gain in exactly six
months, assuming exactly 30 days per month?
Therefore, its density is less than water. So, the value obtained should be less than 1.0 g/mL.
4. Be sure that the answer given for any problem is expressed using the correct number of significant figures.
Look over the following quantitative Sample Problem. Notice how the four - step approach is used, and then apply the approach yourself in solving the practice problems that follow.
Premium Content
Learn It! VideoHMDScience.com
Solve It! CardsHMDScience.com
52 Chapter 2

Volume (cm )3
Mas
s (g
)
0
20
40
60
80
100
120
0 10 20 30 40 50 60
Mass vs. Volume of Aluminum
Main idea
Variables that are directly proportional increase or decrease by the same factor.
Two quantities are directly proportional to each other if dividing one by the
other gives a constant value. For example, if the masses and volumes of different samples of aluminum are measured, the masses and volumes will be directly proportional to each other. As the masses of the samples increase, their volumes increase by the same factor, as you can see from the data. Doubling the mass doubles the volume. Halving the mass halves the volume.
When two variables, x and y, are directly proportional to each other, the relationship can be expressed as y ∝ x, which is read as “y is propor-tional to x.” The general equation for a directly proportional relationship between the two variables can also be written as follows.
y
_ x = k
The value of k is a constant called the proportionality constant. Written in this form, the equation expresses an important fact about direct proportion: the ratio between the variables remains constant. Note that using the mass and volume values in Figure 3.6 gives a mass - volume ratio that is constant (neglecting measurement error). The equation can be rearranged into the following form.
y = kx
The equation y = kx may look familiar to you. It is the equation for a special case of a straight line. If two variables related in this way are graphed versus one another, a straight line, or linear plot that passes through the origin, results. The data for aluminum from Figure 3.6 are graphed in Figure 3.7. The mass and volume of a pure substance are directly proportional to each other. Consider mass to be y and volume to be x. The constant ratio, k, for the two variables is density. The slope of the line reflects the constant density, or mass - volume ratio.
Figure 3.6
MaSS-VoluMe data foR aluMinuM at 20°c
Mass (g) Volume (cm3) m _ V
(g/cm3)
54.7 20.1 2.72
65.7 24.4 2.69
83.5 30.9 2.70
96.3 35.8 2.69
105.7 39.1 2.70
Mass vs. Volume The graph of mass versus volume shows a relationship of direct proportion. Notice that the line is extrapolated to pass through the origin.
Figure 3.7
53Measurements and Calculations

For aluminum, this value is 2.70 g/cm3 at 20°C. Notice also that the plotted line passes through the origin (0,0). All directly proportional relationships produce linear graphs that pass through the origin.
Main idea
Quantities are inversely proportional if one decreases in value when the other increases.
Two quantities are inversely proportional to each other if their product is
constant. An example of an inversely proportional relationship is that between speed of travel and the time required to cover a fixed distance. The greater the speed, the less time that is needed to go a certain fixed distance. Doubling the speed cuts the required time in half. Halving the speed doubles the required time.
When two variables, x and y, are inversely proportional to each other, the relationship can be expressed as follows.
y ∝ 1 _ x
This is read “y is proportional to 1 divided by x.” The general equation for an inversely proportional relationship between the two variables can be written in the following form.
xy = k
In the equation, k is the proportionality constant. If x increases, y must decrease by the same factor to keep the product constant.
When the temperature of a sample of nitrogen is kept constant, the volume (V ) of the gas sample decreases as the pressure (P ) increases, as shown in Figure 3.8. Note that P × V gives a reasonably constant value. Thus, P and V are inversely proportional to each other. The graph of this data is shown in Figure 3.9. A graph of variables that are inversely propor-tional produces a curve called a hyperbola.
Figure 3.8
PReSSuRe-VoluMe data foR nitRogen at conStant teMPeRatuRe
Pressure (kPa) Volume (cm3) P × V
100 500 50 000
150 333 50 000
200 250 50 000
250 200 50 000
300 166 49 800
350 143 50 100
400 125 50 000
450 110 49 500
54 Chapter 2

Pressure (kPa)
600
550
500
450
400
300
250
200
150
100
50
0
350
0 50 100 150 200 250 300 350 400 450 500 550 600
Volume vs. Pressure of Nitrogen
Volu
me
(cm
)3
Reviewing Main Ideas
1. The density of copper is listed as 8.94 g/cm3. Two students each make three density determi-nations of samples of the substance. Student A’s results are 7.3 g/mL, 9.4 g/mL, and 8.3 g/mL. Student B’s results are 8.4 g/cm3, 8.8 g/cm3, and 8.0 g/cm3. Compare the two sets of results in terms of precision and accuracy.
2. Determine the number of significant figures.a. 6.002 cm d. 7000 kgb. 0.0020 m e. 7000. kgc. 10.0500 g
3. Round 2.6765 to two significant figures.
4. Carry out the following calculations.a. 52.13 g + 1.7502 gb. 12 m × 6.41 m
c. 16.25 g
_ 5.1442 mL
5. Perform the following operations. Express each answer in scientific notation.a. (1.54 × 10 -2 g) + (2.86 × 10 -1 g)b. (7.023 × 10⁹ g) – (6.62 × 10⁷ g)c. (8.99 × 10 -4 m) × (3.57 × 10⁴ m)
d. 2.17 × 10 -3 g
__ 5.002 × 10 4 mL
6. Write the following numbers in scientific notation.a. 560 000b. 33 400c. 0.000 4120
7. A student measures the mass of a beaker filled with corn oil. The mass reading averages 215.6 g. The mass of the beaker is 110.4 g.a. What is the mass of the corn oil?b. What is the density of the corn oil if its volume
is 114 cm3?
8. Calculate the mass of gold that occupies 5.0 × 10 –3 cm3. The density of gold is 19.3 g/cm3.
9. What is the difference between a graph repre-senting data that are directly proportional and a graph of data that are inversely proportional?
Critical Thinking
10. APPlyInG ConCEPTS The mass of a liquid is 11.50 g, and its volume is 9.03 mL. How many significant figures should its den-sity value have? Explain the reason for your answer.
Volume vs. Pressure The graph of volume versus pressure shows an inversely proportional relationship. The curve is called a hyperbola. Note the difference between the shape of this graph and that of the graph in Figure 3.7.
critical thinkingApply For this graph, if V ∝ 1/x, what does x represent?
Figure 3.9
55Measurements and Calculations
SeCtion 3 FoRMATIVE ASSESSMEnT