using sas® proc import to read cms hospital … sas® proc import to read cms hospital compare ......
TRANSCRIPT
1
Using SAS® PROC IMPORT to Read CMS Hospital Compare and HCAHPS
Data in Support of a Hospital Pay-for-Performance Program
Michael Cunningham, Highmark, Pittsburgh, PA
Don Colarosa, Highmark, Pittsburgh, PA
ABSTRACT
Highmark, Inc., which operates health insurance plans in Pennsylvania, Delaware, and West Virginia, is one of the largest health insurers in the U.S. One of Highmark’s quality initiatives is the Quality BlueSM
hospital pay-for-performance program, which incents a hospital based upon its performance on quality indicators as well as the hospital’s performance on CMS’ Hospital Compare measures and HCAHPS scores. Hospital Compare provides information about the quality of care for hospitals across the country and HCAHPS is a patient survey sent to indi-viduals who have been recently discharged to characterize their hospital experience. The Hospital Compare and HCAHPS data are routinely updated and made available to the public for download as Microsoft Access® data-bases or CSV flat files. The Access file is a single database containing separate tables with hospital-specific data and state and national averages. Using SAS® 9.2 and PROC IMPORT, we will demonstrate code for reading the Hospital Compare and HCAHPS data for all hospitals from PA, WV, and NY. The Hospital Compare data will also be limited to process of care measures related to heart attack, heart failure, pneumonia, and surgery. Using array programming, a hospital’s Hospital Compare and HCAHPS scores are compared to the state averages. These comparisons are then used to assign a score to the participating Quality Blue hospitals based on the percentage of the state averages that are met or exceeded. This program can easily be modified by individuals looking to read in the state-specific Hospital Compare CMS and/or HCAHPS data.
INTRODUCTION
Highmark, with more than 20,000 employees, is among the largest health insurers in the United States, operating health insurance plans in Pennsylvania, Delaware, and West Virginia. Highmark has been working to transform our health care system by reducing costs, improving quality and outcomes and enhancing the patient experience. To that end, our company has implemented pay-for-performance and pay-for-value programs to incent providers for demonstrating exceptional performance on measures and indicators related to positive patient outcomes.
For over a decade, Highmark’s Quality Blue Hospital Pay-for-Performance program has supported network health care providers as they work to improve patient safety and care quality. The Quality Blue Hospital program contin-ues to focus clinical energies by addressing relevant, evidenced-based, national, state and regional health care issues that have a major impact on the lives of patients throughout Pennsylvania, West Virginia, and Delaware. The program has experienced tremendous growth, expanding from only six participating hospitals in fiscal year (FY) 2002 to over 100 hospitals in FY 2014. The goals of the Highmark Quality Blue program are to align provider reimbursement with performance incentives and to build process excellence into everyday healthcare operations, as well as prepare our participants for the upcoming changes to healthcare mandated by the Affordable Care Act (ACA).
Hospitals participating in the Quality Blue program select from a set of indicators at the beginning of each program year, which runs on a fiscal year. These indicators cover three main areas: hospital efficiency, infection preven-tion, and process of care. The hospitals report outcomes for their selected indicators for all payers (not just High-mark members) during the program year measurement period. These indicators are then scored. A hospital’s incentive amount is determined largely from their scores on these select indicators; however, additional program points are earned if the hospital performs well on the Centers for Medicare and Medicaid Services (CMS) Hospital Compare measures and HCAHPS survey.
HOSPITAL COMPARE AND HCAHPS
CMS developed Hospital Compare as a tool to help promote and objectively measure hospital quality for over 4,000 hospitals across the United States (CMS, 2013a). Hospital Compare, which is part of CMS’ Hospital Quality Initiative, was developed through a multi-collaborative effort involving consumers, hospitals, doctors, employers, accrediting organizations, and other Federal agencies. Hospital Compare is a consumer-oriented website that provides information on how well hospitals provide recommended care to their patients. This information can help consumers make informed decisions about health care. Hospital Compare, which can be accessed via the web at
2
http://medicare.gov/hospitalcompare, allows consumers to select multiple hospitals and directly compare quality measure data related to: timely and effective care, readmissions, complications, mortality, use of imaging, number of Medicare patients, hospital spending, and the patient hospital experience. The timely and effective care, or process of care measures, cover member conditions such as heart attack, heart failure, pneumonia, and surgery.
The patient hospital experience component of Hospital Compare, or HCAHPS (Hospital Consumer Assessment of Healthcare Providers and Systems), “is the first national, standardized, publicly reported survey of patients' per-spectives of hospital care” (CMS, 2013b). The HCAHPS survey, which is given to a random sample of patients recently discharged from a hospital, includes questions designed to measure patients’ perceptions of their total hospital experience. The goal for each of the participating hospitals is to obtain at least 300 completed surveys during a given year. HCAHPS was designed to allow valid comparisons of the patient experience to be made across hospitals at the local, regional and national level.
HIGHMARK QUALITY BLUE HOSPITAL PROGRAM AND HOSPITAL COMPARE DATA
The Hospital Compare and HCAHPS data are used by Highmark as a component of the hospital’s score in the Quality Blue program. We also compare these participating hospitals to those not in the program for the states of Pennsylvania, West Virginia, and Delaware. For scoring purposes, the hospital can earn the maximum Hospital Compare and HCAHPS points if the hospital meets or exceeds the state averages, or if the hospital’s percentages are greater than or equal to 90% for the Hospital Compare measures and HCAHPS results.
The specific quality measures posted on Hospital Compare used in the Quality Blue program come from these areas:
• Timely and Effective Care (Process of Care Measures)
Heart Attack (Acute myocardial infarction - AMI)
Heart Failure
Pneumonia • Surgery (Surgical Care Improvement Project)
When the initial SAS program was written, there were 26 measures included, but with the most recent CMS up-date, only 16 measures have data and are used in our scoring.
The 10 HCAHPS survey questions included in the scoring are:
• Global
How do patients rate the hospital overall?
Would patients recommend the hospital to friends and family? • Individual
How often was the area around patients' rooms kept quiet at night?
How often were the patients' rooms and bathrooms kept clean? • Summary
How often did doctors communicate well with patients?
How often did nurses communicate well with patients?
How often did patients receive help quickly from hospital staff?
How often did staff explain about medicines before giving them to patients?
How often was patients' pain well controlled?
Were patients given information about what to do during their recovery at home?
A standard internal report already existed for summarizing the Highmark Quality Blue hospital performance on the Hospital Compare measures and HCAHPS survey (Appendix A and Appendix B, respectively). This report has been used for years and has become the standard method of displaying these rates, so our goal was to use SAS to pull the data, but retain the existing form design, eliminating the need for the tedious manual data extracts and manipulation.
HOSPITAL COMPARE DATA DOWNLOAD
The Hospital Compare data are routinely updated, with the most recent update on April 18, 2013. The data can be downloaded from Medicare’s download site (https://data.medicare.gov/data/hospital-compare) as a single Mi-

3
crosoft Access database with separate tables for each of the different data components, or as separate comma separated variable (CSV) flat files (Figure 1). Our program imports the Hospital Compare data from the single Access database, however, the import steps could be modified to read in the individual CSV files. The Access database is named “Hospital.mdb”, a name that does not change with each file update. A detailed system re-quirements manual (Hospital.pdf) is available for download under the Supporting Documentation section and pro-vides the details for all of the variables, tables, and data (CMS, 2013c).
Figure 1: Hospital Compare Download Page
SAS PROGRAMS
Once the most recent MS Access hospital data set is downloaded from the Medicare website, the following SAS code fragments demonstrate how to import the required data elements and score the hospitals to get the report elements shown in Appendices A and B. Each of the SAS programs is relatively lengthy (11 pages); therefore they are not included here in their entirety, but may be obtained from the authors upon request.
HOSPITAL COMPARE MEASURE DATA
The Hospital Compare report (Appendix A) contains various components: the hospital name, the state averages, the hospital-specific measure results, and the hospital’s overall performance. The first component, the hospital name, is defined in the first section of our program. The hypothetical report in Appendix A contains five Pennsyl-vania hospitals, A through E, but could contain any subset of hospitals the user identifies, as long as the user’s hospital file contains a six-digit “Provider Number” or “Hospital Name” (both variables in the measure database) that can be matched to a hospital in the Hospital Compare data. Our program matches on “Provider Number” in the Hospital Compare data.
The Hospital Compare state averages are found in the dbo_vwHQI_STATE_MSR_AVg table in the Hospital.mdb database. The following PROC IMPORT command reads the state averages:
proc import table = "dbo_vwHQI_STATE_MSR_AVg"
out = state
dbms = access
replace ;
database = 'Z:\SAS\NESUG\Hospital.mdb' ;
run ;
4
This import statement defines the table in which the state averages are found (TABLE = "dbo_vwHQI_STATE_MSR_AVg"). The output data set is defined as “state” (OUT=state), the DBMS=access tells SAS that the data are in an Access database, and the REPLACE option will replace the output data set each time the procedure is run. The “DATABASE =” option defines the location of the Acces database (SAS, 2009).
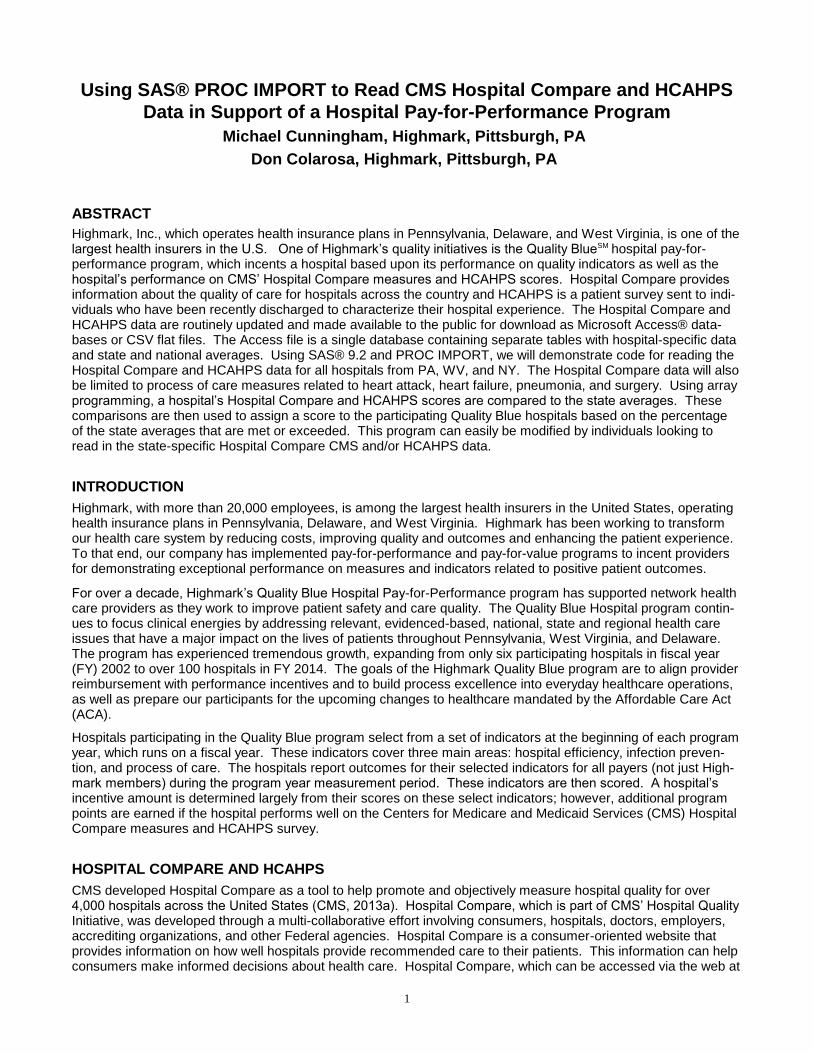
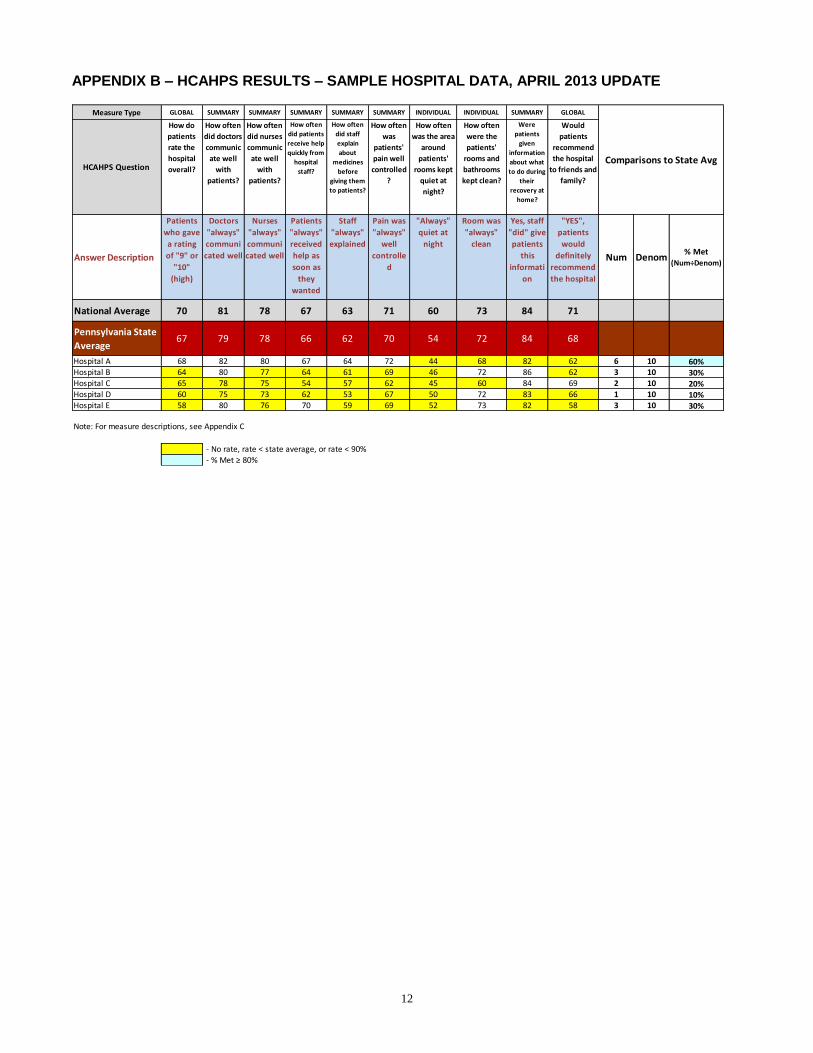
The state averages are in long format in the source table and must be transposed to get them into the correct wide format to match the state averages shown in Appendix A. Additional procedures are run to rename and reorder the measures to match those shown in Appendix A and to limit the averages to the state(s) of interest, in this case PA. Appendix C is a crosswalk showing the Hospital Compare measures included in our analysis, their order, their abbreviations, and corresponding definitions. After transposing the data, the following results are obtained for the PA state averages (note that 16 measures have averages while the others are no longer scored and are shown as “.” in the output):
The hospital-specific rates are imported using a similar PROC IMPORT statement to the state rates, but the table name is now dbo_vwHQI_HOSP_MSR_XWLK:
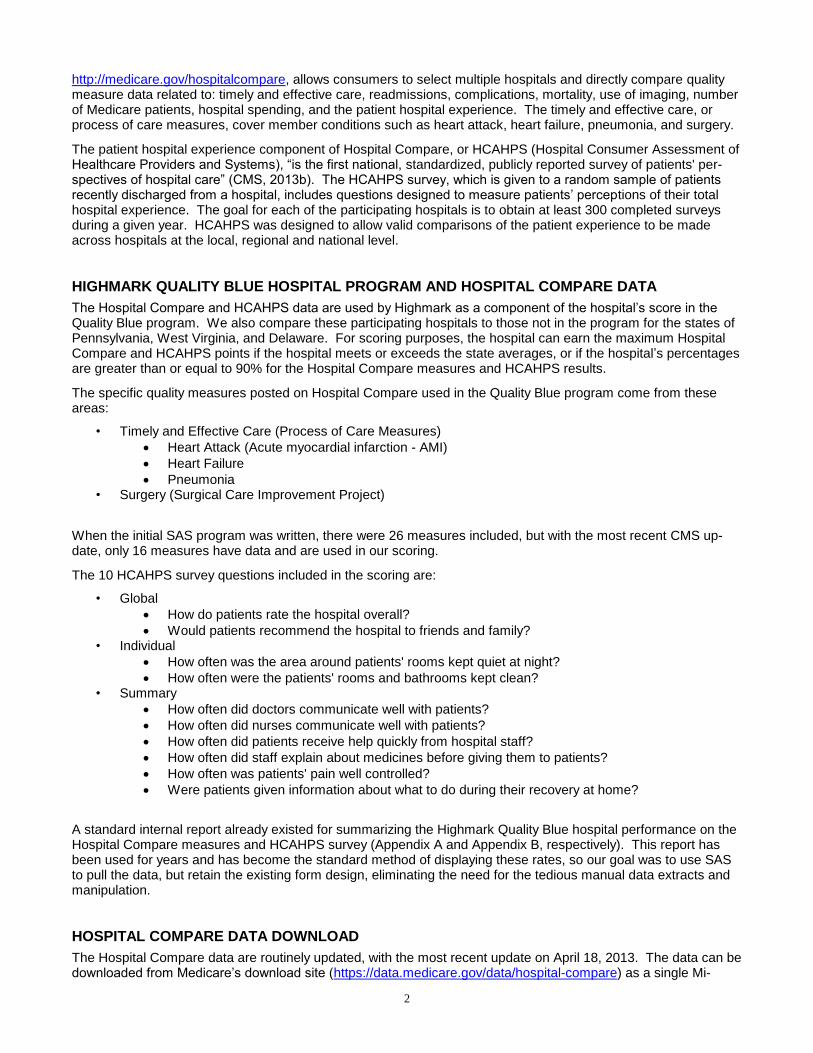
Figure 2 shows a sample of the hospital measure data contained in the dbo_vwHQI_HOSP_MSR_XWLK table. The data are in long format, with one line per hospital and measure. We use the six digit provider number to cre-ate subsets of the hospital data to only export the Quality Blue hospitals for reporting in the Appendix A format.
Figure 2: Sample Data from dbo_vwHQI_HOSP_MSR_XWLK Table
Provider
Number
Hospital
Name State Condition Measure Code Measure Name Score Sample Footnote
'000001' A PA Heart Attack or Chest Pain AMI_10 Heart attack patients … Too few cases Too few cases 1
'000002' B PA Heart Attack or Chest Pain AMI_10 Heart attack patients … 100 301 2
'000003' C PA Heart Attack or Chest Pain AMI_10 Heart attack patients … 84 32
'000004' D PA Heart Attack or Chest Pain AMI_10 Heart attack patients … 96 57
This procedure may take some time, as is contains all of the hospital data for all Hospital Compare measures in long format (approximately 114,000 observations in the April 2013 update). For this reason, we limit the data in a subsequent DATA step and create a permanent data set only for the state(s) of interest:
The IF statement in the DATA step is required to change the results of measures with a rate of “Not Available” to missing. Missing rates are not eligible for inclusion in the hospital’s score, so they are removed in this step. The
data 'Z:\SAS\NESUG\hosp2' ;
set hosp ;
if score = 'Not Available' then score = . ;
where state in ('PA' ) ;
run ;
proc import table = "dbo_vwHQI_HOSP_MSR_XWLK"
out = hosp
dbms = access
replace ;
database = 'Z:\SAS\NESUG\Hospital.mdb' ;
run ;
5
WHERE statement limits the data only to Pennsylvania and can be modified to include more states. Creating the permanent data set with a subset of the Hospital Compare data speeds up subsequent processing.
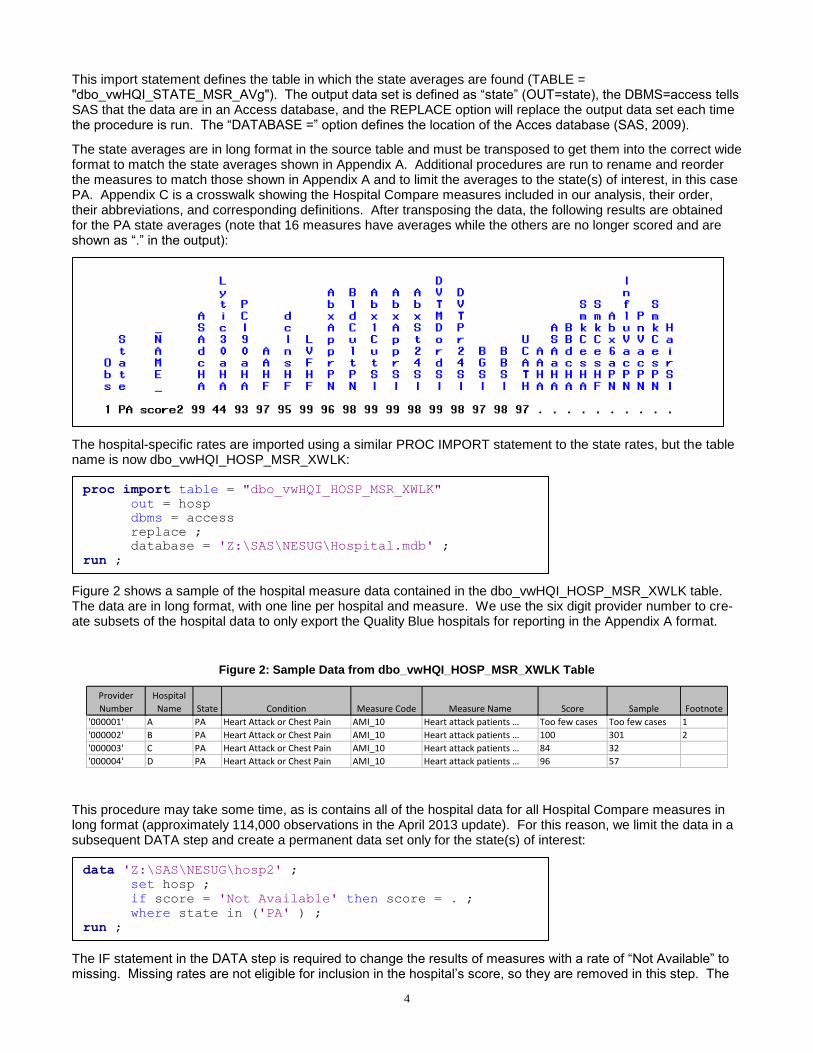
We exclude other rates from the results and scoring if they have a limited number of observations or contain data that was gathered over a limited time period, reducing the reliability of the measure results. These measure re-sults contain footnotes explaining any potential data limitations (“Hospital.pdf”, CMS 2013c). The following DATA step converts all rates with the following footnotes or combinations of footnotes to missing:
The following are descriptions of the footnotes used to determine if a hospital’s measure results should be exclud-ed:
1 – the number of cases is too small to reliably tell how well a hospital is performing. 2 – the hospital indicated that the data submitted for this measure were based on a sample of cases. 3 – data were collected during a shorter time period (fewer quarters) than the maximum possible time for this measure. 4 – suppressed for one or more quarters by CMS. 5 – no data are available from the hospital for this measure.
For the first hospital listed in Figure 2, the AMI_10 measure rate (located in the “score” variable before transposi-tion) would be set equal to “.”, because the footnote = 1.
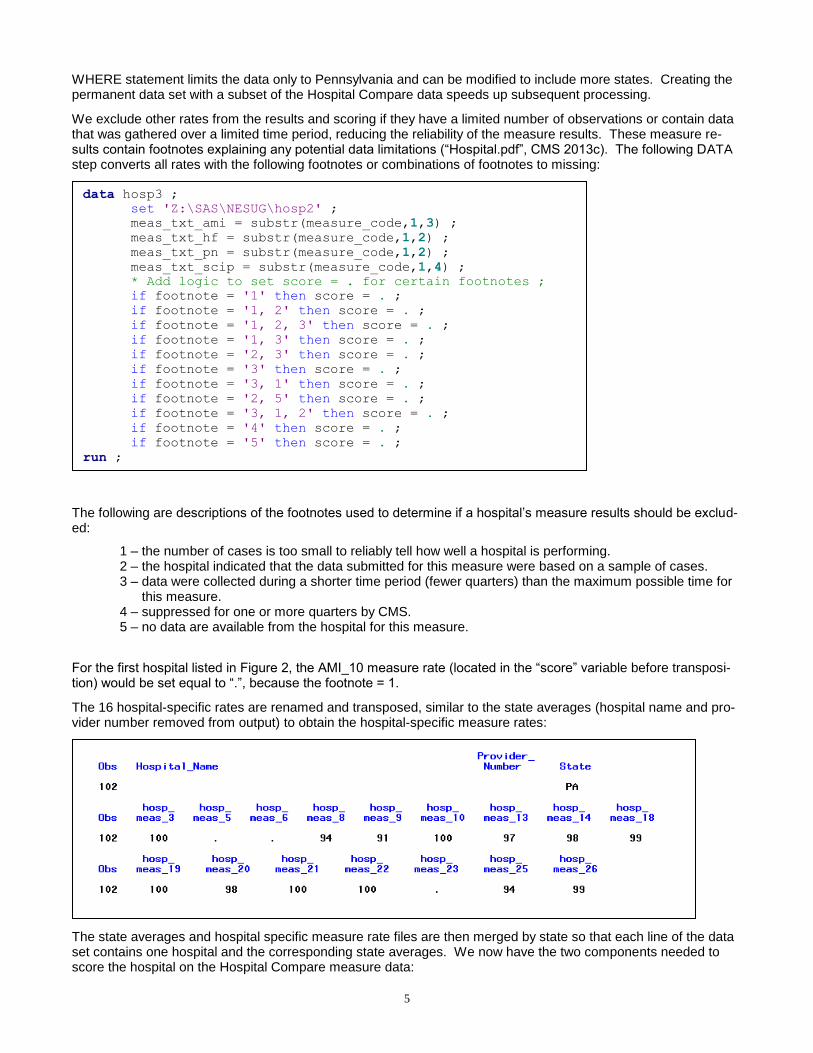
The 16 hospital-specific rates are renamed and transposed, similar to the state averages (hospital name and pro-vider number removed from output) to obtain the hospital-specific measure rates:
The state averages and hospital specific measure rate files are then merged by state so that each line of the data set contains one hospital and the corresponding state averages. We now have the two components needed to score the hospital on the Hospital Compare measure data:
data hosp3 ;
set 'Z:\SAS\NESUG\hosp2' ;
meas_txt_ami = substr(measure_code,1,3) ;
meas_txt_hf = substr(measure_code,1,2) ;
meas_txt_pn = substr(measure_code,1,2) ;
meas_txt_scip = substr(measure_code,1,4) ;
* Add logic to set score = . for certain footnotes ;
if footnote = '1' then score = . ;
if footnote = '1, 2' then score = . ;
if footnote = '1, 2, 3' then score = . ;
if footnote = '1, 3' then score = . ;
if footnote = '2, 3' then score = . ;
if footnote = '3' then score = . ;
if footnote = '3, 1' then score = . ;
if footnote = '2, 5' then score = . ;
if footnote = '3, 1, 2' then score = . ;
if footnote = '4' then score = . ;
if footnote = '5' then score = . ;
run ;
6
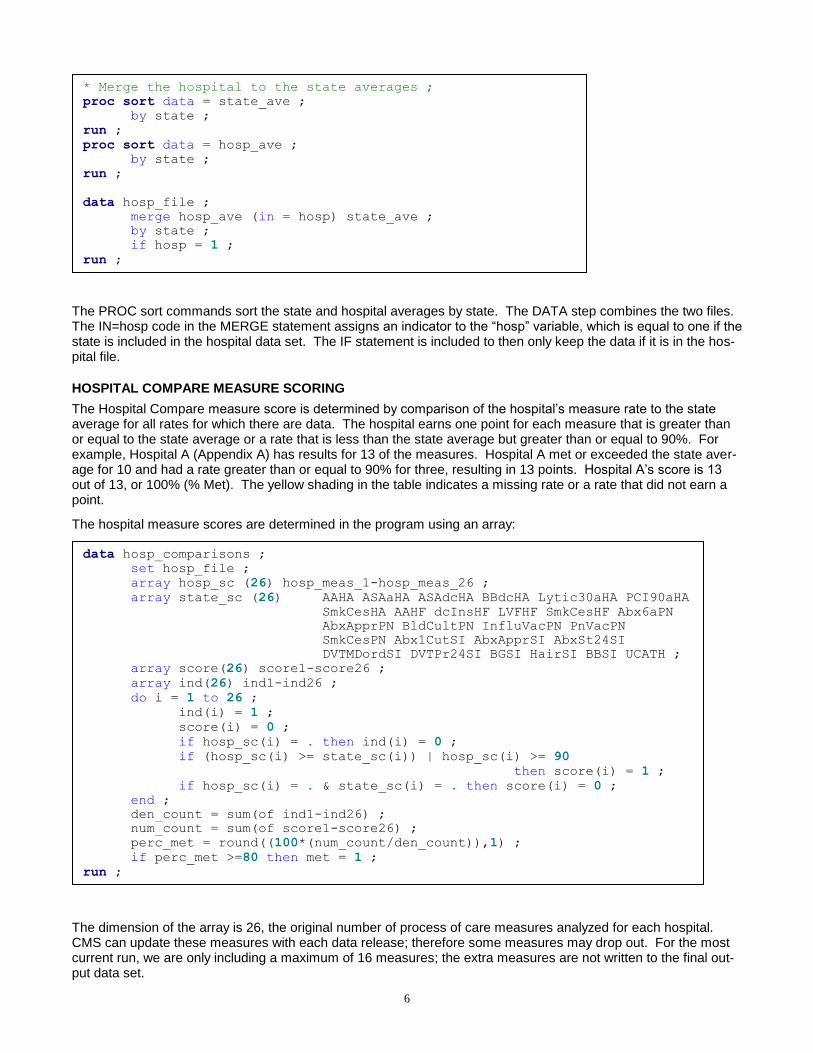
The PROC sort commands sort the state and hospital averages by state. The DATA step combines the two files. The IN=hosp code in the MERGE statement assigns an indicator to the “hosp” variable, which is equal to one if the state is included in the hospital data set. The IF statement is included to then only keep the data if it is in the hos-pital file.
HOSPITAL COMPARE MEASURE SCORING
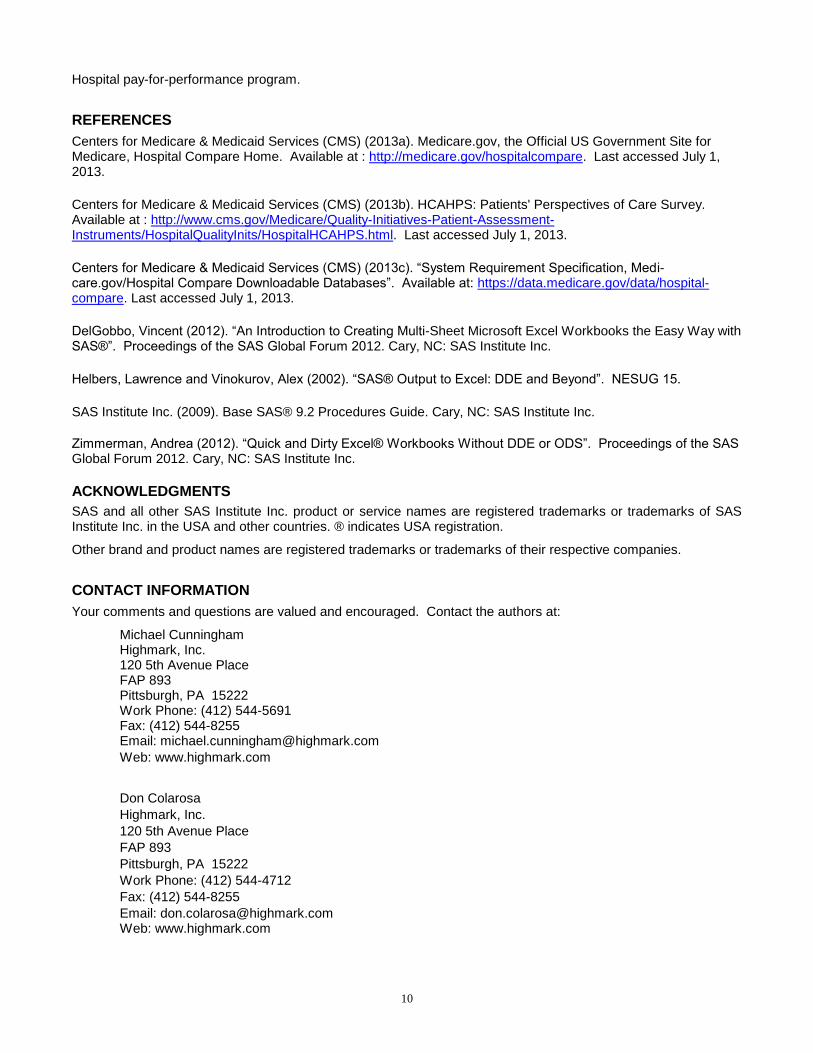
The Hospital Compare measure score is determined by comparison of the hospital’s measure rate to the state average for all rates for which there are data. The hospital earns one point for each measure that is greater than or equal to the state average or a rate that is less than the state average but greater than or equal to 90%. For example, Hospital A (Appendix A) has results for 13 of the measures. Hospital A met or exceeded the state aver-age for 10 and had a rate greater than or equal to 90% for three, resulting in 13 points. Hospital A’s score is 13 out of 13, or 100% (% Met). The yellow shading in the table indicates a missing rate or a rate that did not earn a point.
The hospital measure scores are determined in the program using an array:
The dimension of the array is 26, the original number of process of care measures analyzed for each hospital. CMS can update these measures with each data release; therefore some measures may drop out. For the most current run, we are only including a maximum of 16 measures; the extra measures are not written to the final out-put data set.
data hosp_comparisons ;
set hosp_file ;
array hosp_sc (26) hosp_meas_1-hosp_meas_26 ;
array state_sc (26) AAHA ASAaHA ASAdcHA BBdcHA Lytic30aHA PCI90aHA
SmkCesHA AAHF dcInsHF LVFHF SmkCesHF Abx6aPN
AbxApprPN BldCultPN InfluVacPN PnVacPN
SmkCesPN Abx1CutSI AbxApprSI AbxSt24SI
DVTMDordSI DVTPr24SI BGSI HairSI BBSI UCATH ;
array score(26) score1-score26 ;
array ind(26) ind1-ind26 ;
do i = 1 to 26 ;
ind(i) = 1 ;
score(i) = 0 ;
if hosp_sc(i) = . then ind(i) = 0 ;
if (hosp_sc(i) >= state_sc(i)) | hosp_sc(i) >= 90
then score(i) = 1 ;
if hosp_sc(i) = . & state_sc(i) = . then score(i) = 0 ;
end ;
den_count = sum(of ind1-ind26) ;
num_count = sum(of score1-score26) ;
perc_met = round((100*(num_count/den_count)),1) ;
if perc_met >=80 then met = 1 ;
run ;
* Merge the hospital to the state averages ;
proc sort data = state_ave ;
by state ;
run ;
proc sort data = hosp_ave ;
by state ;
run ;
data hosp_file ;
merge hosp_ave (in = hosp) state_ave ;
by state ;
if hosp = 1 ;
run ;
7
The “hosp_sc” array contains the individual hospital’s performance on each measure and the “state_sc” array con-tains the state averages. The “score” array is used to hold the hospital’s score, which is equal to one if the rate is greater than or equal to the state average or ≥ 90%. The ”ind”, or indicator array, is equal to one if there is a valid rate for the measure (a rate not equal to “.”). The DO loop assigns values to the “ind” and “score” arrays. The “den_count” and “num_count”, the denominator and numerator counts, respectively, are calculated using the use the SUM() function. The hospital’s score, “perc_met”, is the numerator divided by the denominator multiplied by 100. This rate is shown in the last column of data in Appendix A; the light blue shading indicates a rate ≥ 80%. The hospitals in the Quality Blue program receive points if they have a percentage ≥ 80% (the IF statement in the last line of the DATA step). In Appendix A, all five hospitals have rates ≥ 80% and will receive the Hospital Com-pare measure program points as part of their total Quality Blue program score.
The current version of our program uses ODS to write the state averages, the hospital measure rates, and the hospital scores (numerator, denominator, percent met) to a CSV file which is then pasted into the Excel report shown in Appendix A. Future refinements to the program would use either DDE (Helbers and Vinokurov, 2002), the Excel ODS TAGSETS functionality (DelGobbo, 2012), or another method (Zimmerman, 2012) to insert the results directly into Excel.
HCAHPS DATA
The HCAHPS report (Appendix B) is similar to the Hospital Compare report, with the hospital name, the state av-erages, the hospital-specific survey question results, and the hospital’s overall performance. The national averag-es are also included in the HCAHPS report to provide an additional comparison; however, only the state averages are used for scoring. The report in Appendix B contains survey results for the same five Pennsylvania hospitals, A through E.
The state and national averages are imported into SAS using procedures similar to the Hospital Compare import:
The state and national HCAHPS survey results are in the dbo_vwHQI_STATE_HCAHPS_MSR and dbo_vwHQI_US_NATIONAL_HCAHPS_MSR tables, respectively. The IMPORT statements are the same as those described for the Hospital Compare data. The table name is defined (TABLE=), an output data set is named (OUT=), and the location of the Access file is defined (DATABASE=). These rate files are both in long format (one rate per observation) and must be transposed for array processing and display in the Appendix B for-mat.
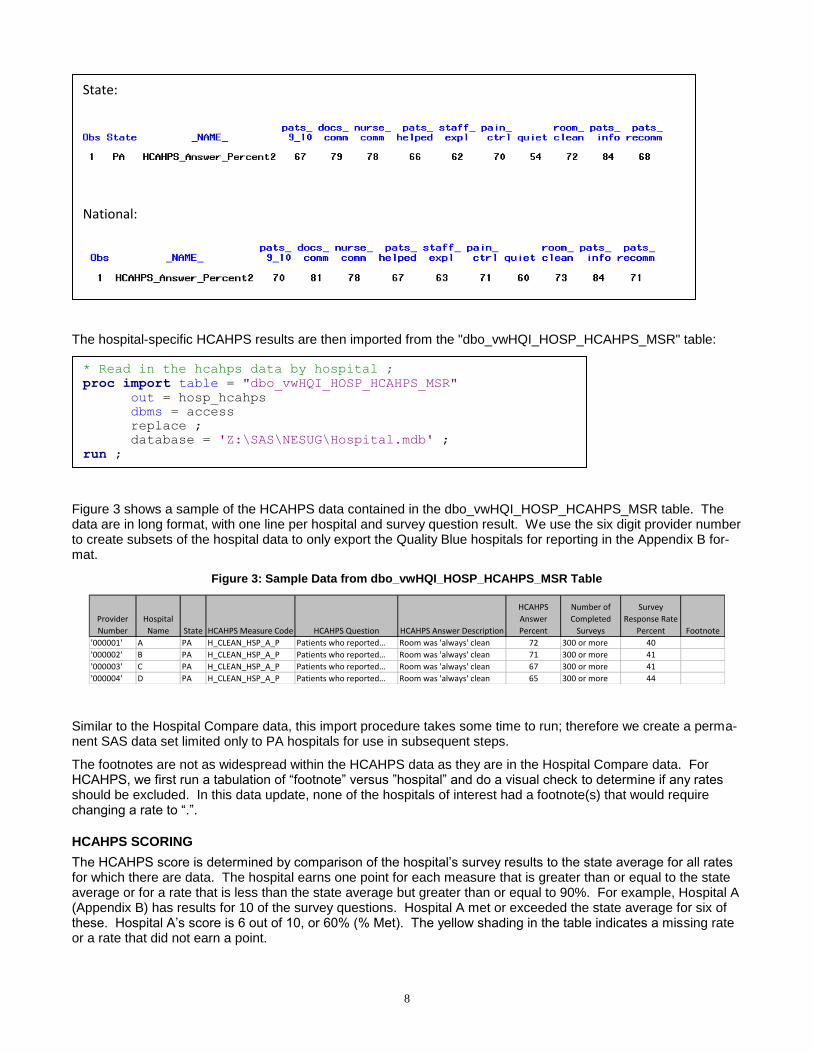
Appendix C is a crosswalk showing the HCAHPS survey questions included in our analysis, their order, their ab-breviations, and corresponding descriptions. After limiting the state rates to PA only and transposing both the state and national reference rate files, the following rate outputs are obtained:
* Read in the state averages for hcahps ;
proc import table = "dbo_vwHQI_STATE_HCAHPS_MSR"
out = state
dbms = access
replace ;
database = 'Z:\SAS\NESUG\Hospital.mdb' ;
run ;
* Read in the national averages for hcahps ;
proc import table = "dbo_vwHQI_US_NATIONAL_HCAHPS_MSR"
out = natl
dbms = access
replace ;
database = 'Z:\SAS\NESUG\Hospital.mdb' ;
run ;
8
The hospital-specific HCAHPS results are then imported from the "dbo_vwHQI_HOSP_HCAHPS_MSR" table:
Figure 3 shows a sample of the HCAHPS data contained in the dbo_vwHQI_HOSP_HCAHPS_MSR table. The data are in long format, with one line per hospital and survey question result. We use the six digit provider number to create subsets of the hospital data to only export the Quality Blue hospitals for reporting in the Appendix B for-mat.
Figure 3: Sample Data from dbo_vwHQI_HOSP_HCAHPS_MSR Table
Provider
Number
Hospital
Name State HCAHPS Measure Code HCAHPS Question HCAHPS Answer Description
HCAHPS
Answer
Percent
Number of
Completed
Surveys
Survey
Response Rate
Percent Footnote
'000001' A PA H_CLEAN_HSP_A_P Patients who reported… Room was 'always' clean 72 300 or more 40
'000002' B PA H_CLEAN_HSP_A_P Patients who reported… Room was 'always' clean 71 300 or more 41
'000003' C PA H_CLEAN_HSP_A_P Patients who reported… Room was 'always' clean 67 300 or more 41
'000004' D PA H_CLEAN_HSP_A_P Patients who reported… Room was 'always' clean 65 300 or more 44
Similar to the Hospital Compare data, this import procedure takes some time to run; therefore we create a perma-nent SAS data set limited only to PA hospitals for use in subsequent steps.
The footnotes are not as widespread within the HCAHPS data as they are in the Hospital Compare data. For HCAHPS, we first run a tabulation of “footnote” versus ”hospital” and do a visual check to determine if any rates should be excluded. In this data update, none of the hospitals of interest had a footnote(s) that would require changing a rate to “.”.
HCAHPS SCORING
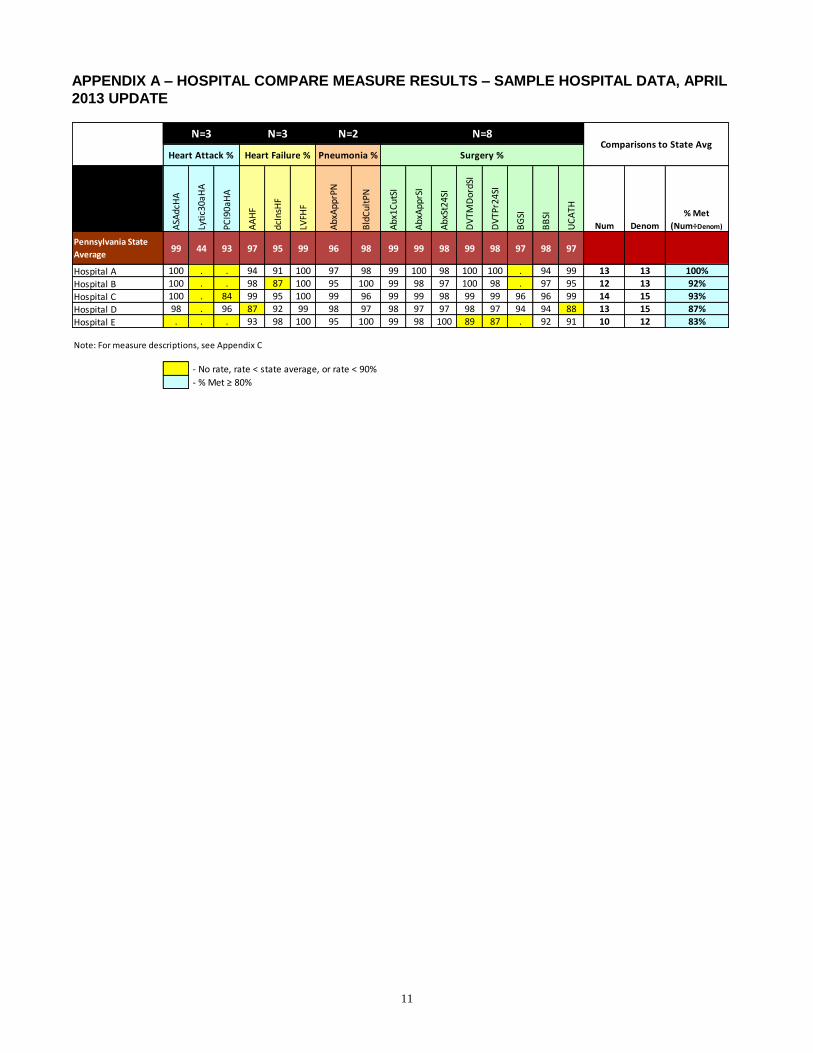
The HCAHPS score is determined by comparison of the hospital’s survey results to the state average for all rates for which there are data. The hospital earns one point for each measure that is greater than or equal to the state average or for a rate that is less than the state average but greater than or equal to 90%. For example, Hospital A (Appendix B) has results for 10 of the survey questions. Hospital A met or exceeded the state average for six of these. Hospital A’s score is 6 out of 10, or 60% (% Met). The yellow shading in the table indicates a missing rate or a rate that did not earn a point.
* Read in the hcahps data by hospital ;
proc import table = "dbo_vwHQI_HOSP_HCAHPS_MSR"
out = hosp_hcahps
dbms = access
replace ;
database = 'Z:\SAS\NESUG\Hospital.mdb' ;
run ;
State:
National:
9
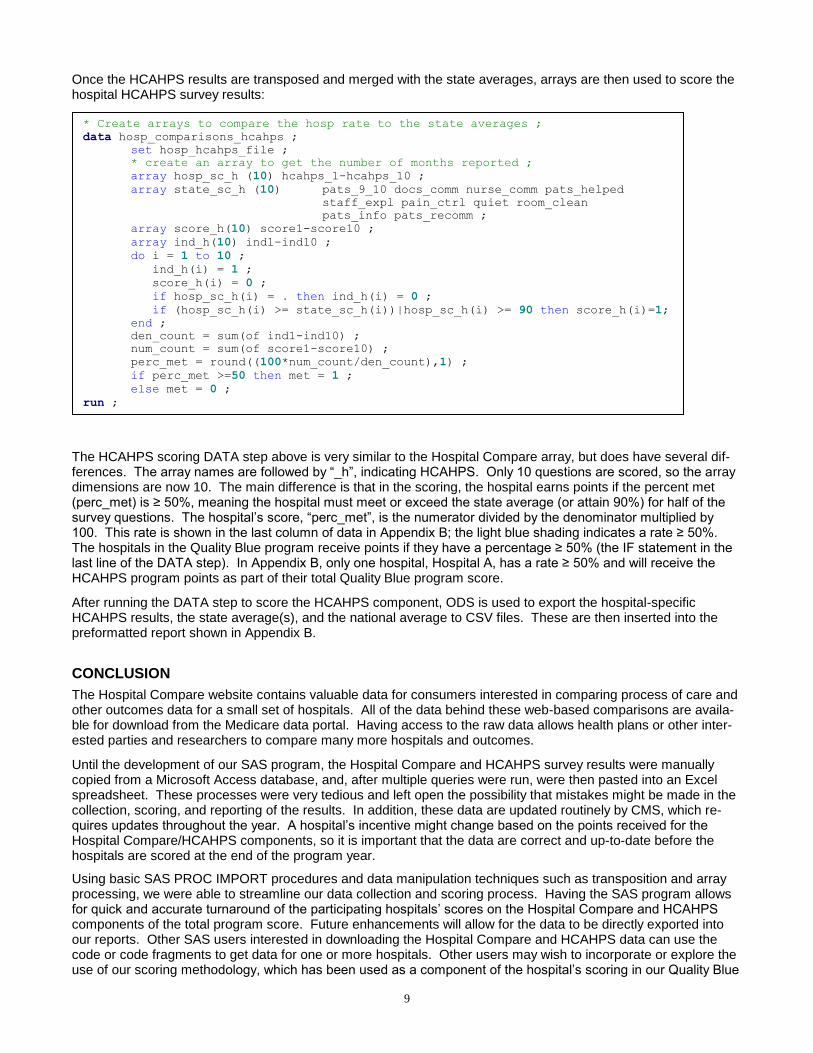
Once the HCAHPS results are transposed and merged with the state averages, arrays are then used to score the hospital HCAHPS survey results:
The HCAHPS scoring DATA step above is very similar to the Hospital Compare array, but does have several dif-ferences. The array names are followed by “_h”, indicating HCAHPS. Only 10 questions are scored, so the array dimensions are now 10. The main difference is that in the scoring, the hospital earns points if the percent met (perc_met) is ≥ 50%, meaning the hospital must meet or exceed the state average (or attain 90%) for half of the survey questions. The hospital’s score, “perc_met”, is the numerator divided by the denominator multiplied by 100. This rate is shown in the last column of data in Appendix B; the light blue shading indicates a rate ≥ 50%. The hospitals in the Quality Blue program receive points if they have a percentage ≥ 50% (the IF statement in the last line of the DATA step). In Appendix B, only one hospital, Hospital A, has a rate ≥ 50% and will receive the HCAHPS program points as part of their total Quality Blue program score.
After running the DATA step to score the HCAHPS component, ODS is used to export the hospital-specific HCAHPS results, the state average(s), and the national average to CSV files. These are then inserted into the preformatted report shown in Appendix B.
CONCLUSION
The Hospital Compare website contains valuable data for consumers interested in comparing process of care and other outcomes data for a small set of hospitals. All of the data behind these web-based comparisons are availa-ble for download from the Medicare data portal. Having access to the raw data allows health plans or other inter-ested parties and researchers to compare many more hospitals and outcomes.
Until the development of our SAS program, the Hospital Compare and HCAHPS survey results were manually copied from a Microsoft Access database, and, after multiple queries were run, were then pasted into an Excel spreadsheet. These processes were very tedious and left open the possibility that mistakes might be made in the collection, scoring, and reporting of the results. In addition, these data are updated routinely by CMS, which re-quires updates throughout the year. A hospital’s incentive might change based on the points received for the Hospital Compare/HCAHPS components, so it is important that the data are correct and up-to-date before the hospitals are scored at the end of the program year.
Using basic SAS PROC IMPORT procedures and data manipulation techniques such as transposition and array processing, we were able to streamline our data collection and scoring process. Having the SAS program allows for quick and accurate turnaround of the participating hospitals’ scores on the Hospital Compare and HCAHPS components of the total program score. Future enhancements will allow for the data to be directly exported into our reports. Other SAS users interested in downloading the Hospital Compare and HCAHPS data can use the code or code fragments to get data for one or more hospitals. Other users may wish to incorporate or explore the use of our scoring methodology, which has been used as a component of the hospital’s scoring in our Quality Blue
* Create arrays to compare the hosp rate to the state averages ;
data hosp_comparisons_hcahps ;
set hosp_hcahps_file ;
* create an array to get the number of months reported ;
array hosp_sc_h (10) hcahps_1-hcahps_10 ;
array state_sc_h (10) pats_9_10 docs_comm nurse_comm pats_helped
staff_expl pain_ctrl quiet room_clean
pats_info pats_recomm ;
array score_h(10) score1-score10 ;
array ind_h(10) ind1-ind10 ;
do i = 1 to 10 ;
ind_h(i) = 1 ;
score_h(i) = 0 ;
if hosp_sc_h(i) = . then ind_h(i) = 0 ;
if (hosp_sc_h(i) >= state_sc_h(i))|hosp_sc_h(i) >= 90 then score_h(i)=1;
end ;
den_count = sum(of ind1-ind10) ;
num_count = sum(of score1-score10) ;
perc_met = round((100*num_count/den_count),1) ;
if perc_met >=50 then met = 1 ;
else met = 0 ;
run ;
10
Hospital pay-for-performance program.
REFERENCES
Centers for Medicare & Medicaid Services (CMS) (2013a). Medicare.gov, the Official US Government Site for Medicare, Hospital Compare Home. Available at : http://medicare.gov/hospitalcompare. Last accessed July 1, 2013.
Centers for Medicare & Medicaid Services (CMS) (2013b). HCAHPS: Patients' Perspectives of Care Survey. Available at : http://www.cms.gov/Medicare/Quality-Initiatives-Patient-Assessment-Instruments/HospitalQualityInits/HospitalHCAHPS.html. Last accessed July 1, 2013.
Centers for Medicare & Medicaid Services (CMS) (2013c). “System Requirement Specification, Medi-care.gov/Hospital Compare Downloadable Databases”. Available at: https://data.medicare.gov/data/hospital-compare. Last accessed July 1, 2013.
DelGobbo, Vincent (2012). “An Introduction to Creating Multi-Sheet Microsoft Excel Workbooks the Easy Way with SAS®”. Proceedings of the SAS Global Forum 2012. Cary, NC: SAS Institute Inc.
Helbers, Lawrence and Vinokurov, Alex (2002). “SAS® Output to Excel: DDE and Beyond”. NESUG 15.
SAS Institute Inc. (2009). Base SAS® 9.2 Procedures Guide. Cary, NC: SAS Institute Inc.
Zimmerman, Andrea (2012). “Quick and Dirty Excel® Workbooks Without DDE or ODS”. Proceedings of the SAS Global Forum 2012. Cary, NC: SAS Institute Inc.
ACKNOWLEDGMENTS
SAS and all other SAS Institute Inc. product or service names are registered trademarks or trademarks of SAS Institute Inc. in the USA and other countries. ® indicates USA registration.
Other brand and product names are registered trademarks or trademarks of their respective companies.
CONTACT INFORMATION
Your comments and questions are valued and encouraged. Contact the authors at:
Michael Cunningham Highmark, Inc. 120 5th Avenue Place FAP 893 Pittsburgh, PA 15222 Work Phone: (412) 544-5691 Fax: (412) 544-8255 Email: [email protected]
Web: www.highmark.com
Don Colarosa
Highmark, Inc.
120 5th Avenue Place
FAP 893
Pittsburgh, PA 15222
Work Phone: (412) 544-4712
Fax: (412) 544-8255
Email: [email protected] Web: www.highmark.com
11
APPENDIX A – HOSPITAL COMPARE MEASURE RESULTS – SAMPLE HOSPITAL DATA, APRIL
2013 UPDATE
ASA
dcH
A
Lyti
c30a
HA
PCI9
0aH
A
AA
HF
dcIn
sHF
LVFH
F
Abx
App
rPN
Bld
Cul
tPN
Abx
1Cut
SI
Abx
App
rSI
Abx
St24
SI
DV
TMD
ordS
I
DV
TPr2
4SI
BG
SI
BB
SI
UC
ATH
Num Denom
% Met
(Num÷Denom)
Pennsylvania State
Average99 44 93 97 95 99 96 98 99 99 98 99 98 97 98 97
Hospital A 100 . . 94 91 100 97 98 99 100 98 100 100 . 94 99 13 13 100%
Hospital B 100 . . 98 87 100 95 100 99 98 97 100 98 . 97 95 12 13 92%
Hospital C 100 . 84 99 95 100 99 96 99 99 98 99 99 96 96 99 14 15 93%
Hospital D 98 . 96 87 92 99 98 97 98 97 97 98 97 94 94 88 13 15 87%
Hospital E . . . 93 98 100 95 100 99 98 100 89 87 . 92 91 10 12 83%
Note: For measure descriptions, see Appendix C
- No rate, rate < state average, or rate < 90%
- % Met ≥ 80%
Comparisons to State AvgHeart Attack % Surgery %
N=8N=3 N=3 N=2
Heart Failure % Pneumonia %
12
APPENDIX B – HCAHPS RESULTS – SAMPLE HOSPITAL DATA, APRIL 2013 UPDATE
Measure Type GLOBAL SUMMARY SUMMARY SUMMARY SUMMARY SUMMARY INDIVIDUAL INDIVIDUAL SUMMARY GLOBAL
HCAHPS Question
How do
patients
rate the
hospital
overall?
How often
did doctors
communic
ate well
with
patients?
How often
did nurses
communic
ate well
with
patients?
How often
did patients
receive help
quickly from
hospital
staff?
How often
did staff
explain
about
medicines
before
giving them
to patients?
How often
was
patients'
pain well
controlled
?
How often
was the area
around
patients'
rooms kept
quiet at
night?
How often
were the
patients'
rooms and
bathrooms
kept clean?
Were
patients
given
information
about what
to do during
their
recovery at
home?
Would
patients
recommend
the hospital
to friends and
family?
Answer Description
Patients
who gave
a rating
of "9" or
"10"
(high)
Doctors
"always"
communi
cated well
Nurses
"always"
communi
cated well
Patients
"always"
received
help as
soon as
they
wanted
Staff
"always"
explained
Pain was
"always"
well
controlle
d
"Always"
quiet at
night
Room was
"always"
clean
Yes, staff
"did" give
patients
this
informati
on
"YES",
patients
would
definitely
recommend
the hospital
Num Denom% Met
(Num÷Denom)
National Average 70 81 78 67 63 71 60 73 84 71
Pennsylvania State
Average67 79 78 66 62 70 54 72 84 68
Hospital A 68 82 80 67 64 72 44 68 82 62 6 10 60%Hospital B 64 80 77 64 61 69 46 72 86 62 3 10 30%Hospital C 65 78 75 54 57 62 45 60 84 69 2 10 20%Hospital D 60 75 73 62 53 67 50 72 83 66 1 10 10%Hospital E 58 80 76 70 59 69 52 73 82 58 3 10 30%
Note: For measure descriptions, see Appendix C
- No rate, rate < state average, or rate < 90% - % Met ≥ 80%
Comparisons to State Avg
13
APPENDIX C – HOSPITAL COMPARE AND HCAHPS MEASURE CODES AND DESCRIPTIONS
Measure Code Measure Description Abbreviation
SAS Variable
Name
AMI_2 Heart Attack Patients Given Aspirin at Discharge ASAdcHA hosp_meas2
AMI_7a
Heart Attack Patients Given Fibrinolytic Medication Within 30 Minutes Of
Arrival Lytic30aHA hosp_meas6
AMI_8a Heart Attack Patients Given PCI Within 90 Minutes Of Arrival PCI90aHA hosp_meas7
HF_3
Heart Failure Patients Given ACE Inhibitor or ARB for Left Ventricular
Systolic Dysfunction AAHF hosp_meas11
HF_1 Heart Failure Patients Given Discharge Instructions dcInsHF hosp_meas9
HF_2
Heart Failure Patients Given an Evaluation of Left Ventricular Systolic (LVS)
Function LVFHF hosp_meas10
PN_6 Pneumonia Patients Given the Most Appropriate Initial Antibiotic(s) AbxApprPN hosp_meas17
PN_3b
Pneumonia Patients Whose Initial Emergency Room Blood Culture Was
Performed Prior To The Adm BldCultPN hosp_meas14
SCIP_INF_1
Surgery patients who were given an antibiotic at the right time (within one
hour before surg Abx1CutSI hosp_meas20
SCIP_INF_2
Surgery patients who were given the right kind of antibiotic to help prevent
infection AbxApprSI hosp_meas21
SCIP_INF_3
Surgery patients whose preventive antibiotics were stopped at the right
time (within 24 hour AbxSt24SI hosp_meas22
SCIP_VTE_1
Surgery patients whose doctors ordered treatments to prevent blood clots
after certain types DVTMDordSI hosp_meas27
SCIP_VTE_2
Patients who got treatment at the right time (within 24 hours before or
after their surgery) DVTPr24SI hosp_meas28
SCIP_INF_4
Heart surgery patients whose blood sugar (blood glucose) is kept under
good control in the d BGSI hosp_meas23
SCIP_CARD_2
Surgery patients who were taking heart drugs called beta blockers before
coming to the hospi BBSI hosp_meas19
SCIP_INF_9
Surgery patients whose urinary catheters were removed on the first or
second day after surge UCATH hosp_meas25
Measure Code Measure Description
SAS Variable
Name
H_HSP_RATING_9_10 Patients who gave a rating of 9 or 10 (high) pats_9_10
H_COMP_2_A_P Doctors always communicated well docs_comm
H_COMP_1_A_P Nurses always communicated well nurse_comm
H_COMP_3_A_P Patients always received help as soon as they wanted pats_helped
H_COMP_5_A_P Staff always explained staff_expl
H_COMP_4_A_P Pain was always well controlled pain_ctrl
H_QUIET_HSP_A_P Always quiet at night quiet
H_CLEAN_HSP_A_P Room was always clean room_clean
H_COMP_6_Y_P Yes, staff did give patients this information pats_info
H_RECMND_DY YES, patients would definitely recommend the hospital pats_recomm
Hospital Compare
HCAHPS