using remote sensing to optimize management strategies for invasive plant control
DESCRIPTION
Using Remote Sensing to Optimize Management Strategies for Invasive Plant Control. Jim Bean Jennifer Vollmer, Ph.D. Daniel Watts Professional Vegetation Management Group BASF Corporation. Environmental Resource Specialists. Jennifer Vollmer. Jim Bean. Why Map?. Diagnose the problem - PowerPoint PPT PresentationTRANSCRIPT

Using Remote Sensing toOptimize Management
Strategies for Invasive Plant Control
Jim BeanJennifer Vollmer, Ph.D.
Daniel WattsProfessional Vegetation Management Group
BASF Corporation
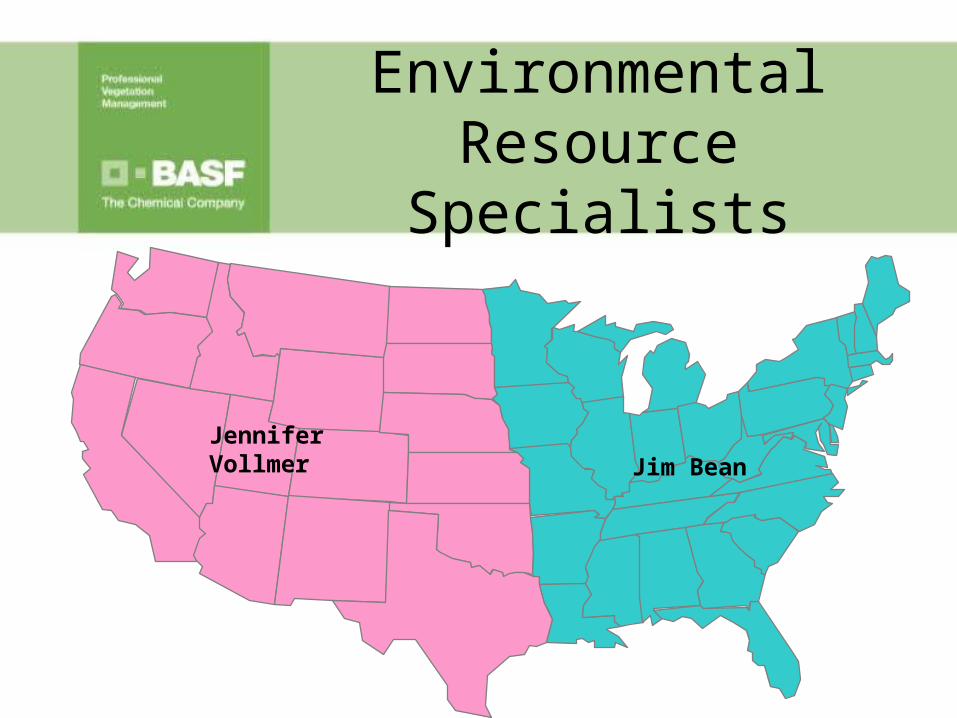
Environmental Resource Specialists
Jennifer VollmerJim Bean

Why Map?
• Diagnose the problem• ‘Lookout Towers’ / Early detection• Search & (rescue) destroy• Create inventory: what, where, how much• More efficient use of resources
Weed survey is an important aspect of land health

Choosing a Method
• How large is the area?
• How long will it take?
• How much will it cost?
• Will methods meet the goals?

Hyper-spectral Imaging
• Photo imaging by aircraft• Full coverage• Multiple weeds• Multiple non-weeds• Abundance / Density• GIS layer• Treatment Optimization
– Can reduce treatment cost and increase herbicide efficiency

BEALS CREEKColorado River Basin, TXCase Study
= Saltcedar

Actual Northstar treatment map
Generated from HSI plus Applicator GIS system combined
~1000 acres sprayedEstimated 400 acres of saltcedar received spray
40% Efficiency overall
= treated area
= Saltcedar
Sprayed area with no vegetation
Missed this large population

Actual CostSaltcedar density*
Spray Efficiency Acres saltcedar/Acres treated
Treatment Cost
0.16 54% 46.4/86.6 $17,587
0.14 46% 20.1/43.9 $8,930
0.17 57% 66.7/118 $13,596$40,113
•Acres of saltcedar divided by the total infested areaDensity 0.1 = ~27 trees / 30x30 meter
Case Study Beals Creek3 Example treatment Section

Treatment Optimization
LAYER 1• Determine cost effective treatment
– Herbicide application method• Aerial• Ground• Spot treatment (foliar)
– Biological• Appropriate site
– Mechanical

Treatment Optimization
LAYER 2• Appropriate Treatment
– Density– Abundance of desirable plants – Proximity to urban area– Other
• customer concern• quantified parameter
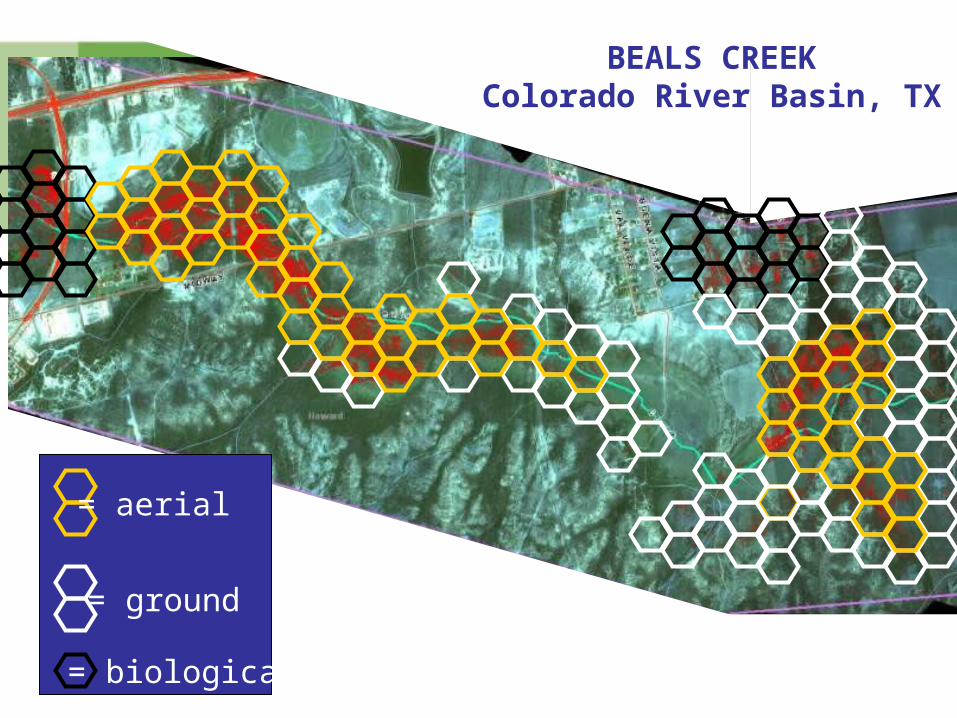
= aerial
= ground
= biological
BEALS CREEKColorado River Basin, TX

Actual CostSaltcedar density*
Spray Efficiency Acres saltcedar/Acres treated
Treatment Cost
0.16 54% 46.4/86.6 $17,587
0.14 46% 20.1/43.9 $8,930
0.17 57% 66.7/118 $13,596$40,113
$15,97166.7/78.785%0.17
$5,95320.1/29.369%0.14
$11,78446.4/57.780%0.16
$33,708
Cost Utilizing HSI data
* Acres of saltcedar divided by the total infested area

Actual Herbicide UseSaltcedar density*
Spray Efficiency Acres saltcedar/Acres treated
Herbicide Applied
0.16 54% 46.4/86.6 43.5 gal
0.14 46% 20.1/43.9 22 gal
0.17 57% 66.7/118 59 gal124.5 gal
39.566.7/78.785%0.17
14.520.1/29.369%0.14
2946.4/57.780%0.16
83 gal
Herbicide Utilizing HSI data
* Acres of saltcedar divided by the total infested area

Treatment Optimization
LAYER 3
• Appropriate Treatment– Fuel management need– Site Access– Landowner preference– Aesthetics

= aerial
= ground
= biological
= mechanical
= cut stump
BEALS CREEKColorado River Basin, TX

Mechanical Cost
Cut + treat
• $1200 to >$5000 /acre
Dozer/Chipper/etc.
• $300 / hr
• 4 hr / acre

Cost
Trt method Acres Cost Herbicide
Biological 140 15 days
Ground 560 $28,000 22 gal
Aerial 610 $12,200 305 gal
Cut Stump 120 $144,000 6 gal
Mechanical 50 $60,000
Total 1480 $244,200 333 gal

Total Project dollars needed
Budget:
Phase 1• HSI / Planning 40,000acre $80,000
Phase 2• Treatment 244,200 + herbicide• Monitoring covered / Phase 1• Follow-up treatment minimal

Benefits
• Many uses of remote sensing data
• Treatment optimization
• Most efficient use of resources
• Monitor and measure effectiveness

Summary
BASF would like to discuss your remote sensing needs
[email protected] (east)
[email protected] (west)

Thank You!