using qualitative comparative analysis (qca) to … qualitative comparative analysis (qca) ......
TRANSCRIPT
Using Qualitative Comparative Analysis (QCA) to Study Patient-Centered Medical Homes
An Introductory Guide
Kelly J. Devers, PhD, Nicole Cafarella Lallemand, MPP, Rachel A. Burton, MPP, Leila Kahwati, MD, MPH, Nancy McCall, ScD, & Stephen Zuckerman, PhD
September 2013
Submitted to Suzanne Wensky, PhD Centers for Medicare & Medicaid Services (CMS)

[This page intentionally left blank.]
iii
Abstract This guide provides an in-depth introduction to using qualitative comparative analysis (QCA) in medical home evaluations to identify practice-level “conditions” (e.g., specific practice characteristics, medical home care processes) that are linked to an outcome of interest (e.g., improved care quality, higher patient satisfaction ratings, or reduced health care utilization or expenditures). This guide provides an overview of the QCA approach and key analytic steps.
What is QCA? QCA is a research approach and analytic method based on set-theory and Boolean algebra.
Why use QCA? QCA can potentially help CMS policymakers identify where, when, and under what circumstances the medical home model (and other new payment and delivery models, such as accountable care organizations) are successful. QCA has been characterized as an innovative methodological approach that is well suited for concept formation, the creation of typologies, and causal analysis, particularly when there is reason to believe that alternative factors can produce the same outcome, single conditions do not display their effect on their own but only in combination with other conditions, or there are different causal explanations for “success” or “failure” on an outcome of interest. QCA can also complement traditional qualitative, quantitative, or mixed-methods research and evaluations, particularly when a sample size is in the small to medium-sized range (between 10-50 “cases”, though QCA can be used on larger sample sizes as well). Finally, the results of QCA can be used to inform traditional quantitative analyses by identifying key factors to include or exclude from statistical models.
What steps are involved in QCA? The QCA approach involves first identifying a research question that is suitable for exploration using this technique, and then selecting relevant “conditions” and an outcome of interest. The analysis must include “cases” (e.g., practices) with a positive outcome and cases with a negative outcome. Conditions should be selected based on a theoretical or conceptual framework that explains positive or negative performance on the outcome of interest, as well as deep knowledge of the cases under study. Data on the conditions and outcome are then compiled into a raw data table, and in the next analytically-intensive step, all values are converted into “set membership scores.” Subsequently, cases with consistent combinations of values on these conditions are grouped together into common rows in a “truth table” (which can be generated using QCA software or by hand) and “contradictions” are resolved by revisiting prior steps. Truth table findings can be summarized as written statements, Venn diagrams, or solution formulas that identify combinations of conditions linked to positive outcomes, and combinations that are linked to negative outcomes. Among cases that have a positive outcome, conditions that are always present when a particular outcome is observed are considered “necessary,” and conditions (or combinations of conditions) that are present when a particular outcome is observed in some cases but are not present in other cases where a positive outcome is observed are considered “sufficient” to produce the positive outcome. The final step is to summarize and interpret findings in a narrative discussion.

iv
Acknowledgements
The authors thank the following individuals for their helpful comments on this paper: Charles Ragin, PhD, Chancellor's Professor of Sociology at the University of California, Irvine and inventor of the QCA method; Marcus Thygeson, MD, Vice President of Medical Services at Blue Shield of California and the author of a recent journal article that used the QCA approach to study medical homes; and Suzanne Wensky, PhD, a research analyst at CMS.

v
Contents
Abstract .......................................................................................................................................... iii
Acknowledgements ........................................................................................................................ iv
1. Introduction .............................................................................................................................1
2. What is QCA? .........................................................................................................................1
3. The Value of QCA in Medical Home Research .....................................................................4
4. Issues to Consider Before Getting Started ..............................................................................5
5. Software ..................................................................................................................................6
6. Working with an Interdisciplinary Team ................................................................................7
7. Step-by-Step Guide to Conducting QCA ................................................................................8 Step #1. Refine QCA Evaluation Question .............................................................................9 Step #2. Select the Case, Unit of Analysis, and Outcomes to be Studied ..............................9 Step #3. Select “Conditions” .................................................................................................10 Step #4. Collect and Compile Data into a “Raw Data Table” ..............................................11 Step #5. Calibrate the Raw Data ...........................................................................................12 Step #5a. Calibrate the Data for csQCA ...............................................................................12 Step #5b. Calibrate the Data for fsQCA ...............................................................................14 Step #6. Group Sets of Practices Together in a “Truth Table” .............................................17 Step #6a. Construct a Truth Table Using Crisp Conditions..................................................17 Step #6b. Construct a Truth Table Using Fuzzy Values .......................................................20 Step #6b-i. Construct a Table of Set Membership Scores and their Complements ..............20 Step #6b-ii. Construct a Set Membership Score Table .........................................................20 Step #6b-iii. Construct a Truth Table ...................................................................................23 Step #7. Resolve Contradictions ...........................................................................................24 Step #8. Summarize Findings Using Statements and/or Diagrams ......................................25 Step #9. Assess the Strength of Findings ..............................................................................28 Step #10. Interpret Findings ..................................................................................................29
8. The Promise of QCA for Medical Home Evaluations ..........................................................30
References ......................................................................................................................................31
Appendix ........................................................................................................................................33
vi
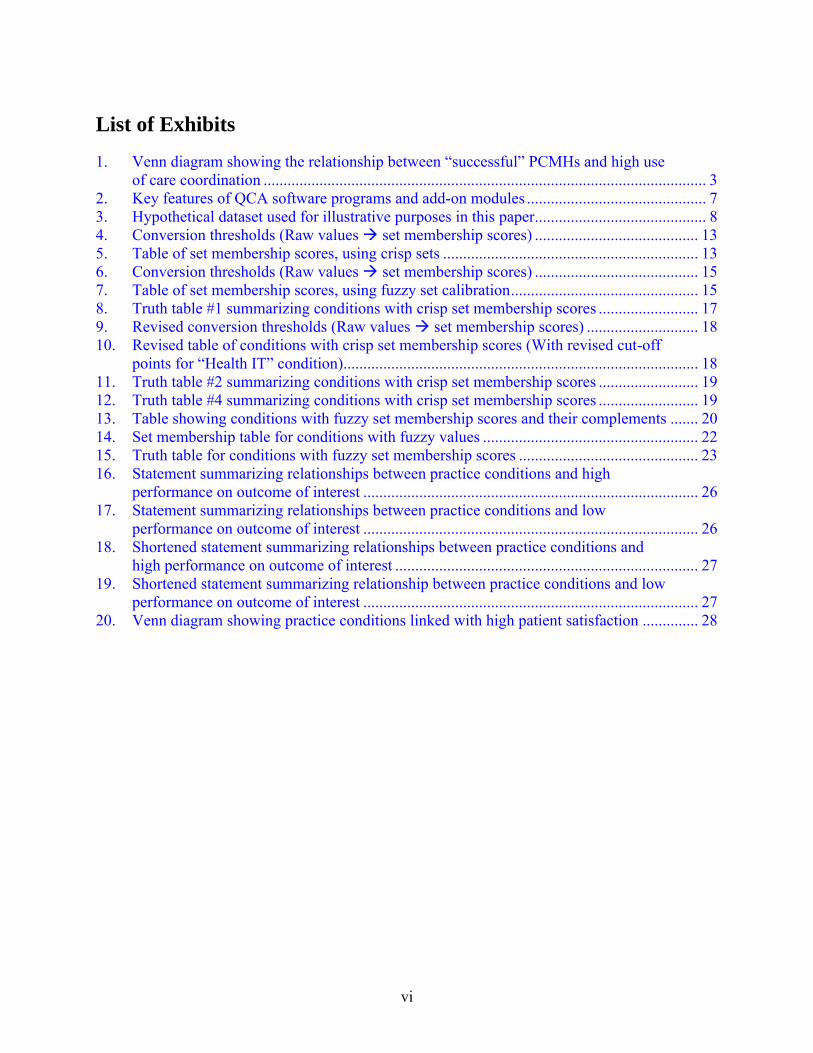
List of Exhibits
1. Venn diagram showing the relationship between “successful” PCMHs and high use of care coordination ............................................................................................................... 3
2. Key features of QCA software programs and add-on modules ............................................. 7 3. Hypothetical dataset used for illustrative purposes in this paper ........................................... 8 4. Conversion thresholds (Raw values set membership scores) ......................................... 13 5. Table of set membership scores, using crisp sets ................................................................ 13 6. Conversion thresholds (Raw values set membership scores) ......................................... 15 7. Table of set membership scores, using fuzzy set calibration ............................................... 15 8. Truth table #1 summarizing conditions with crisp set membership scores ......................... 17 9. Revised conversion thresholds (Raw values set membership scores) ............................ 18 10. Revised table of conditions with crisp set membership scores (With revised cut-off
points for “Health IT” condition) ......................................................................................... 18 11. Truth table #2 summarizing conditions with crisp set membership scores ......................... 19 12. Truth table #4 summarizing conditions with crisp set membership scores ......................... 19 13. Table showing conditions with fuzzy set membership scores and their complements ....... 20 14. Set membership table for conditions with fuzzy values ...................................................... 22 15. Truth table for conditions with fuzzy set membership scores ............................................. 23 16. Statement summarizing relationships between practice conditions and high
performance on outcome of interest .................................................................................... 26 17. Statement summarizing relationships between practice conditions and low
performance on outcome of interest .................................................................................... 26 18. Shortened statement summarizing relationships between practice conditions and
high performance on outcome of interest ............................................................................ 27 19. Shortened statement summarizing relationship between practice conditions and low
performance on outcome of interest .................................................................................... 27 20. Venn diagram showing practice conditions linked with high patient satisfaction .............. 28
1
1. Introduction Qualitative comparative analysis (QCA) is both a research approach and a data analysis technique. As with other methods, the approach should inform all phases of the research process, including sampling (or case selection), data collection, analysis, and the interpretation of results.
The approach and formal data analysis techniques are unfamiliar to many health services and policy researchers, despite having deep roots in the social sciences. QCA was invented and more formally articulated by the American social scientist Charles Ragin in the 1980s (Schneider & Wagemann, 2012). QCA, and a family of related set-theoretic methods, is part of a broader dialogue about the strengths and weaknesses of traditional quantitative and possible alternatives. The method has increasingly gained attention, becoming part of some methods course curricula and offered in specialized seminars, and used by researchers in variety of fields. For example, in the area of health and health care, a recent review identified 35 studies that have used the method within the context of health, health services, and public health research or evaluation (Kahwati, Kane, & Lewis, 2013).
The primary purpose of this paper it to provide an in-depth overview of QCA and its potential application to patient-centered medical home (PCMH) research and evaluation and possibly other provider payment and delivery system reforms, such as accountable care organizations. To achieve our aim, we divide this paper into five parts. First, we provide a brief overview and description of the approach. There are a number of texts and books about QCA and related approaches, so our aim here is to provide a basic overview of the approach and several core aspects of it. Second, we provide both general and specific rationales for why one might consider using this method for PCMH research and evaluation and perhaps other research and evaluations of health care initiatives. Third, we identify and describe several issues for researchers to consider before using QCA in a particular study. Fourth, we provide an overview of the major steps in a QCA analysis, which comprises the bulk of the paper. While we describe the process as a sequence, in practice data collection, specification, and analysis is iterative, with each step continually informing other stages of the research process. We conclude with a brief discussion of the possibilities and prospects for applying a QCA approach to PCMH and perhaps other health and health care research and evaluations.
2. What is QCA? In general, QCA has been characterized as a new, “third” way to conduct social science research that combines the strengths of traditional quantitative and qualitative methods. The approach combines the comparative case-based and inductive approaches often used in qualitative research with the formal, mathematical approaches employed in quantitative research. However, this description of QCA can be somewhat deceiving because the approach differs from both traditional qualitative or quantitative approaches in significant ways so that it can be difficult for people trained in either research method to fully grasp its underlying conceptual basis in set-theory. In this respect, the approach might be better characterized as an attempt to redesign or transcend existing qualitative and quantitative approaches, not substituting for them but complementing them under certain circumstances.
2
More specifically, QCA can be defined as a specific set-theoretic approach to analyzing complex social phenomena, of which PCMHs and many other provider payment and health care delivery interventions are examples. Set-theoretic approaches analyze the relationships among complex social structures, processes, and outcomes through the notion of sets and their relations, operating on membership scores of aspects of cases in sets. Causal relationships are modeled as subset or superset relationships between explanatory factors and an outcome, which are expressed as logical statements of necessity and sufficiency, as opposed to qualitative comparisons or statistical correlations. Set theory can unravel causally complex patterns and three concepts are critical for understanding how and why the method differs from traditional quantitative and qualitative approaches–equifinality, conjunctural causation, and asymmetry. Following below, we provide further explanation of each of these abstract concepts, illustrating them with a simple example.
First, what do we mean by “set theory”? Set theory is the branch of mathematical logic that studies sets, that is collections of cases of interest. Although we often implicitly use sets and seek to unravel complex causal mechanisms in social science and evaluation research through sets, Ragin and others argue that our traditional methods have not fully or formally followed suit. Qualitative methods often compare and contrast cases and search for common patterns and themes or multiple causal pathways, but usually on a relatively small number of cases and without the benefit of formal logic and sets and the associated mathematics (i.e., Boolean algebra). Quantitative methods have largely moved away from sets and the consideration of whole cases and their relationships, to what Ragin terms a “variable-based approach” that typically decomposes cases into their individual variable components, and often assumes linear, additive relationships while employing different quantitative techniques (i.e., statistical probability and the desire to understand the unique contribution of a particular variable, independent of the values of other variables or context). While non-linear models and interaction terms can be used, Ragin and others point out the limits of these fundamental assumptions and mathematical techniques. Additionally, a relatively large number of cases (e.g., 100 or more) must be included to use these techniques, which may not exist empirically or may not be feasible to collect data on.
Some people find the term set-theory confusing, assuming that they need to study formal logic to understand it and/or that there is a specific “theory” about sets or set relationships that would determine or guide how to array cases or aspects of cases. Neither is true. A literature search of an electronic database using the Boolean operators “AND,” “OR,” and “NOT” is a simple everyday example of set-theory in practice. As we discuss further below (see Steps 2 and 3), a central task involved in QCA is assigning cases to sets and then further specifying the relationships between aspects of cases through superset and subset relationships. This assignment of cases or aspects of cases to sets must be informed by several methods or data sources, alone or in combination. This includes prior literature review (theoretical or conceptual as well as empirical) and deep, first-hand knowledge of the specific cases in the study through qualitative and quantitative methods and data. As with other methods, all choices made by the research team will have to be justified and grounded in the data.
The following simple example of set theory and set relationships may be helpful. Suppose we claim that primary care practices with high use of care coordinators are “successful” PCMHs, performing relatively well on patient satisfaction measures, as one example of an outcome. This

3
statement can be represented as sub-set and super-set relationships. The set of practices with high use of care coordinators (X) is a sub-set of all “successful” PCMHs (Y). This means that all cases (primary care practices) that exhibit X (i.e., high use of care coordinators) also exhibit Y (they are “successful” PCMHs). This denotes the inner circle (X,Y) in the Venn diagram.
Exhibit 1. Venn diagram showing the relationship between “successful” PCMHs and high use of care coordination
Additionally, as we learn later in this paper, such a pattern in the data can be interpreted to mean that X (i.e., high use of care coordination) is sufficient for Y (i.e., “successful” PCMH). It is important to note that this statement does not tell us anything about the practices that do not have high use of care coordinators. They may be “successful” PCMHs (Area ~X,Y) or they may not (Area ~X, ~Y). Nor does the sufficiency claim entail that all “successful” PCMHs are ones with high use of care coordinators. The fact that there are other types of “successful” PCMHs indicates that there are other sufficient conditions (i.e., aspects of cases that may explain the outcome of interest) or combinations of conditions.
The link between subset relations and the notion of sufficiency (and its companion necessity, which we explain further below) results in other analytic consequences of importance. First, alternative factors can produce the same outcome (a concept also known as equifinality). As indicated in the example above, “high use of care coordination” is not the only way to be a successful PCMH. Second, in order to find perfect set relationships, one often needs to refer to combinations of condition sets, where single conditions do not display their effect on their own, but only together or in combination with other conditions (also known as conjunctural causation). Finally, what explains “successful” PCMHs may not explain “unsuccessful” or “failed” PCMHs (a concept also known as asymmetry). In other words, “unsuccessful” or

4
“failed” PCMHs are not just the opposite of “successful” PCMHs in terms of the conditions that may or may not be present to varying degrees, but rather may have their own unique set, set relationships, and causal explanations. All three of these key analytic consequences (equifinality, conjunctural causation, and asymmetry) specifically derive from the set-theoretic framework on which QCA is based.
While all types of QCA shares this general set-theoretic framework, there are three main variants of QCA, which differ in terms of how they operationalize or calibrate cases and set membership. First, there is crisp set QCA (csQCA), which operates exclusively on sets where cases can either be full members or full non-members in the set (i.e., membership being scored dichotomously as either a “0” or a “1”). In contrast, fuzzy set QCA (fsQCA) allows cases to have gradations of set membership. The membership scores can fall anywhere between the two extremes (0 or 1, with 1 being full membership), with 0.5 representing the point of indeterminancy (neither in or out of the set) and the threshold where membership in the set qualitatively changes (above .5 meaning somewhat in the set and below .5 meaning somewhat out of the set). Fuzzy sets mitigate many of the problems and concerns with crisp sets, which divides phenomenon into either/or categories rather than degrees or gradations. Although fsQCA can incorporate sets that are calibrated crisply, including dichotomous outcomes, this is not recommended and if pursued adjustments are required (see Step 5). A third QCA variant is known as multi-value QCA (mvQCA), which allows for multinomial categorical data to be used (e.g., not just 0 or 1 but 0, 1, 2, 3 4).
In this paper, we focus on crisp and fuzzy set QCA because they are the two primary variants of the approach, well-suited to addressing the majority of research and evaluation questions of interest about medical homes and perhaps other provider payment and delivery reforms, and compatible with available data sources. Additionally, there is some debate about mvQCA (see Thiem, 2013; Vink & Van Vliet, 2009; Vink & Vliet, 2013).
3. The Value of QCA in Medical Home Research Why and/or when should funders or researchers consider using QCA or other kinds of set-theoretic approaches? Several reasons or conditions have been cited in the wider literature. QCA and other set theoretic methods are well suited for concept formation, the creation of typologies, and causal analysis, particularly when we have reason to believe that alternative factors can produce the same outcome, combinations of conditions matter, or there are different causal explanations for “success” or “failure” or other key outcomes of interest. In short, QCA was developed to address causal complexity, particularly conjunctural causation and equifinality.
QCA is also well suited for situations in which the number of cases being studied is in the mid-range (10-50). The method can be applied to a larger number of cases, especially when there is reason to believe that causal complexity is present. With a larger number of cases, research teams lose some in-depth knowledge of the cases; but this is true of alternative statistical methods as well. Additionally, the method has been primarily used for cross-sectional analyses, but methods have been developed to apply the method to longitudinal analysis (see Schneiderman and Wagemann (2012) and Thygeson, Peikes, and Zutshi (2013) on temporal QCA).
5
Four other reasons to consider the use of QCA in PCMH research and evaluation especially are:
1) PCMH pilots and demonstrations are causally complex and context specific. Primary care practices, (i.e., “cases”) are nested. For example, there are diverse practices that started with different capabilities, may or may not be part of larger organized delivery systems or physician organizations, have contracts with particular plans or work in different states with different provider payment models and forms of technical assistance, and treat very different patient populations. In the Multi-payer Advanced Primary Care Practice (MAPCP) Demonstration for example, there is tremendous variation across and within the eight states, the participating payers and practices, and the beneficiaries they serve. No one recipe for a successful PCMH exists, and one PCMH capability in one context may have different causal effects than the same capability in another context. When studying the implementation of complex interventions, explaining how an intervention succeeds or fails in different context is as important if not more important than answering the question “does it work” (Pawson et al., 2005).
2) Prior empirical results show null or inconsistent findings. Much of the research on PCMHs show little or no impact on outcomes of interest (e.g., quality, cost or efficiency), or mixed results in some areas. The methods being used may not be well suited to identifying PCMH types and multiple causal pathways or the unique “recipes” for success or failure in particular pilots or demonstrations. Thygeson’s paper shows how the same data set used to study PCMHs showed no statistically significant results using traditional quantitative methods, but very interesting patterns were identified when QCA was applied to the data (Thygeson et al., 2012). Similarly, the only consistent finding in quality improvement (QI) research is the inconsistency of results, in part because of the importance of context and variation in how QI interventions are customized and implemented (Devers, 2009).
3) Results from QCA can feed into future stages of qualitative and quantitative data collection and analysis. As noted, QCA can complement traditional methods. For example, results from QCA can inform future traditional, quantitative methods by identifying which variable to include or drop from equations or ways to combine them into a broader factor or scale. (Chuang, Dill, Morgan et al., 2012; Dixon-Woods, Agarwal, Jones et al., 2005; Glatman-Freedman, Dohen, Nichols et al., 2010; Grofman & Schneider, 2009)
4) Results of QCA analysis may be more relevant and actionable for policymaking and quality improvement, as they identify specific combinations of conditions under which PCMH efforts are likely to succeed and where they are likely to fail. Because of the context specific nature of the analysis and the ability to consider asymmetric relationships, information is not only available about where or in what areas to focus effort but also about what to avoid.
4. Issues to Consider Before Getting Started A good first step is to develop a basic familiarity with this approach, such as by reading this paper and other materials. As described, there are an increasing number of texts that provide a

6
very good overview of the approach and specific aspects of the method including how to do specific steps. Additionally, there are several overviews of studies in the health services and policy research world that provide concrete examples of where QCA has been applied to answer health services and policy research questions.
Despite the increasing availability of general texts and specific articles on QCA, in-person training is invaluable. Some University social science departments–particularly political science and sociology–offer courses on QCA and related set theoretic methods or briefly cover them as part of other methods courses. However, these are still quite rare. For busy professionals and/or those not near a university that offers such a course, more intensive workshops are available.1
5. Software
Software can help automate steps in the QCA process, especially when dealing with larger datasets. Six QCA software programs or modules are described on a helpful webpage available at http://www.compasss.org/software.htm, maintained by a network of prominent QCA researchers that calls itself COMPASSS (COMPArative Methods for Systematic cross-caSe analySis). This webpage briefly describes each of these software options, notes the presence of absence of particular features, and includes computer screen shots showing what each software application’s user interface looks like. The website also includes hyperlinks to websites where QCA software and accompanying user manuals can be downloaded. All six of the software programs or add-on modules to existing software programs are available for free, though the underlying software required to run one of the software programs, Stata fuzzy (i.e., Stata), is not. Each of the available software modules provides slightly different capabilities, but some lack of standardization in the field makes it hard to use only one package. Also, care must be taken to crosswalk results using different packages because they do not all work the same.
One of the main considerations researchers will likely want to take into account when selecting software is how easy it is to use. Three software options have a graphical user interface, meaning users can click on graphical buttons or use drop-down menus to choose commands and can begin using the program with little prior training; three other software options have a command line interface, meaning users must write commands using a programming language that they must learn. An example of a commonly-used software program with a graphical user interface is Microsoft Word; an example of a command line interface is the DOS operating systems that ran on many personal computers in the 1980s. See Exhibit 2, below, for a table showing the six software options and which interface category they fall into.
Another important consideration when selecting software is the type of set membership scores a program can convert raw data into (e.g., crisp or fuzzy–see Step 5 for details). One should select the appropriate software after deciding on the type of set membership scores and the QCA variant to use in an analysis. See Exhibit 2 for a table showing the six software options and which types of values they can calibrate.
1 A list of upcoming QCA workshops is maintained at: http://www.compasss.org/events.htm.

Finally, researchers planning to use advanced QCA techniques not covered in this paper will want to consider different software programs’ advanced functionalities as well (described on COMPASSS’s website).
Exhibit 2. Key features of QCA software programs and add-on modules
Software
Can calibrate data into set membership scores that are:
Crisp Fuzzy
Graphical user interface fs/QCA (version 2.5) X X Tosmana (version 1.3.2.0) X Kirq (version 2.1.9)* --
Command line interface R QCA (version 1.0-5) X X R QCA3 (version 0.0-5) X X Stata fuzzy (version st0140_2) X X
Note: * Kirq does not have the ability to calibrate raw data into set membership scores.
Source: Thiem, A. (2013). Software. http://www.compasss.org/software.htm.
6. Working with an Interdisciplinary Team
Beyond these resources, it is important to recognize that QCA will benefit from if not require both quantitative, qualitative, and substantive knowledge and skills. While QCA can be conducted by a single researcher, large research and evaluation teams are likely to require an interdisciplinary and methodologically diverse team. While a small number of team members will have greater knowledge and expertise in QCA, those leading the QCA analysis will need to communicate, coordinate, and work collaboratively with colleagues trained in traditional quantitative and qualitative methods. Therefore, it is important for those leading the QCA component of the project to be able to clearly explain basic aspects of the method to their colleagues, help them understand likely misinterpretations and pitfalls (e.g., difference between QCA and statistical interaction), and work together at all phases of the research process. For example, Ragin (2008) highlights some areas where traditionally quantitatively or qualitatively trained researchers will have difficulty with the logic of the method and how one might address it.
Ultimately, an interdisciplinary and methodologically diverse team can ensure that qualitative and quantitative data will be collected in a form useful for QCA. Ideally, team members should plan for QCA analysis at the beginning of the study, before data collection begins. Like any methodological approach and data analysis technique, QCA is limited by the types of data available. Additionally, team members can assist with key aspects of the QCA analysis process, such as the construction of truth tables and interpretation of results.
Finally, QCA can inform statistical regression models (by eliminating certain variables that may have been contemplated for inclusion in a regression model–thus increasing statistical power); for this reason, it can be useful to know what regression models are being contemplated by
7
quantitative researchers involved in a study. As noted, QCA can be used on larger N’s (above 50 cases) as well.
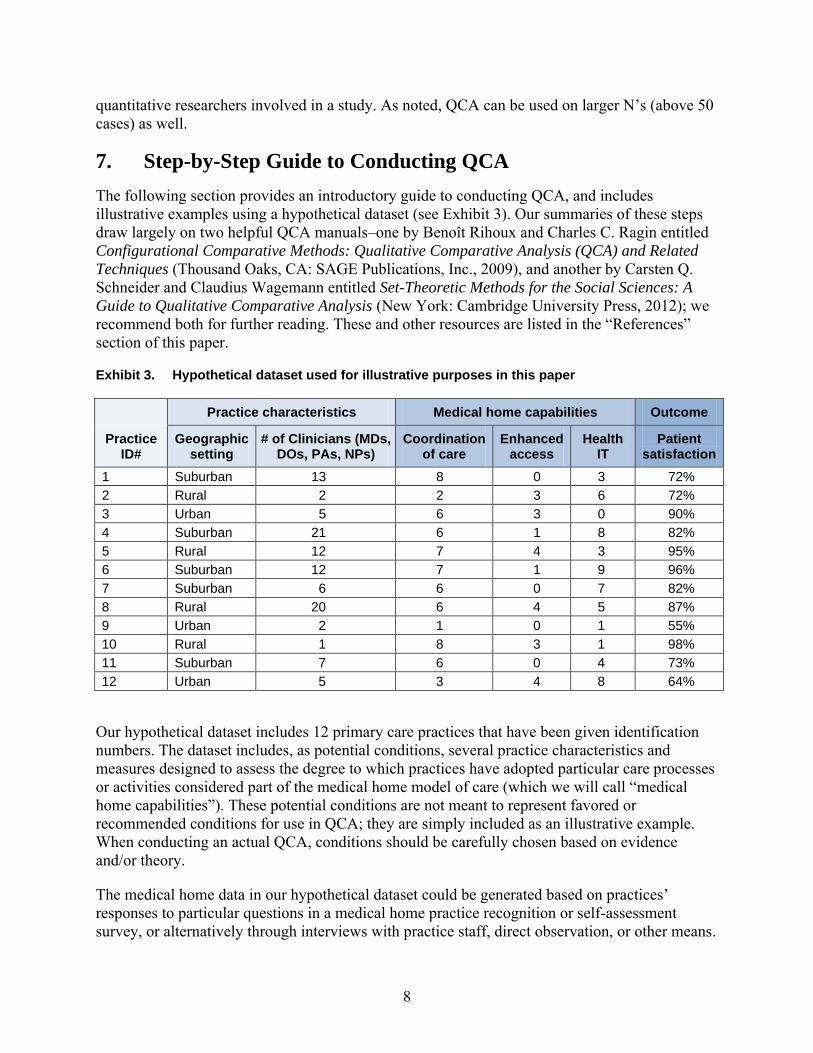
7. Step-by-Step Guide to Conducting QCA The following section provides an introductory guide to conducting QCA, and includes illustrative examples using a hypothetical dataset (see Exhibit 3). Our summaries of these steps draw largely on two helpful QCA manuals–one by Benoît Rihoux and Charles C. Ragin entitled Configurational Comparative Methods: Qualitative Comparative Analysis (QCA) and Related Techniques (Thousand Oaks, CA: SAGE Publications, Inc., 2009), and another by Carsten Q. Schneider and Claudius Wagemann entitled Set-Theoretic Methods for the Social Sciences: A Guide to Qualitative Comparative Analysis (New York: Cambridge University Press, 2012); we recommend both for further reading. These and other resources are listed in the “References” section of this paper.
Exhibit 3. Hypothetical dataset used for illustrative purposes in this paper
Practice ID#
Practice characteristics Medical home capabilities Outcome
Geographic setting
# of Clinicians (MDs, DOs, PAs, NPs)
Coordination of care
Enhanced access
Health IT
Patient satisfaction
1 Suburban 13 8 0 3 72% 2 Rural 2 2 3 6 72% 3 Urban 5 6 3 0 90% 4 Suburban 21 6 1 8 82% 5 Rural 12 7 4 3 95% 6 Suburban 12 7 1 9 96% 7 Suburban 6 6 0 7 82% 8 Rural 20 6 4 5 87% 9 Urban 2 1 0 1 55% 10 Rural 1 8 3 1 98% 11 Suburban 7 6 0 4 73% 12 Urban 5 3 4 8 64%
Our hypothetical dataset includes 12 primary care practices that have been given identification numbers. The dataset includes, as potential conditions, several practice characteristics and measures designed to assess the degree to which practices have adopted particular care processes or activities considered part of the medical home model of care (which we will call “medical home capabilities”). These potential conditions are not meant to represent favored or recommended conditions for use in QCA; they are simply included as an illustrative example. When conducting an actual QCA, conditions should be carefully chosen based on evidence and/or theory.
The medical home data in our hypothetical dataset could be generated based on practices’ responses to particular questions in a medical home practice recognition or self-assessment survey, or alternatively through interviews with practice staff, direct observation, or other means.
8

9
Qualitative or quantitative data could be used to construct a dataset for QCA. Our hypothetical dataset does not draw on a particular medical home practice survey; a variety of them exists and may be used in medical home research.
The outcome of interest in our hypothetical dataset is practices’ average rating on a patient satisfaction survey. (Other outcome measures could have consisted of average annual expenditures per patient for each practice, the practice’s performance on a composite of clinical quality measures, or some other practice-level outcome measure.)
Step #1. Refine QCA Evaluation Question
QCA is well suited for studying situations where the research team has reason to believe that an outcome could be the result of several different causal paths and that conditions may only show their causal effect in combination with other conditions. Examples of research questions that have been studied using QCA include:
• What is the relationship between medical practice capabilities and three quality measures: diabetes risk factor control, preventive service delivery, and patient experience? (Thygeson, Solberg, Asche et al., 2012)?
• What facility structure, policies and processes are linked to larger patient weight loss outcomes in Veterans Affairs (VA) weight loss programs (Kahwati, Lewis, Kane et al., 2011)?
In short, a good QCA research question takes account of QCA’s emphasis on combinations of conditions. Additionally, it usually is a mistake to phrase research questions in terms of one condition at a time. Rather, it is more helpful to think in terms of causal recipes–ideal combinations of conditions for a specific outcome. Sometimes it is also helps to think in terms of multiple synergistic combinations or conditions.
When refining research questions explored using QCA, researchers should also keep in mind that QCA distances itself from causal assumptions that are commonly associated with traditional statistical techniques like regression. QCA does not assume that each causal condition has a causal effect independent of other conditions; that there is only one causal path to an outcome; that a causal condition has the same effect on an outcome when added to different combinations of conditions; and that the presence or absence of an outcome always requires the same explanation. Nor does QCA require that the underlying data have a normal distribution.
In the example analysis we present in this paper, our research question is aimed at identifying the practice characteristics and medical home capabilities that are linked to greater patient satisfaction.
Step #2. Select the Case, Unit of Analysis, and Outcomes to be Studied
An early step in QCA is to decide what the “case”, or unit of analysis, is (e.g. a case could be a state, organized delivery system, or a practice–as in our example analysis in this paper). This decision is based on a number of factors, including the nature of the research or evaluation question and the availability of data.

10
Many times, cases will be “nested,” with state and regional level information perhaps attached to intermediary organizations (e.g., organized delivery systems, independent practice associations, other umbrella organizations), and ultimately practices. Therefore, it may be useful to conduct separate analyses of groups of practices (defined by state or regions within states) and then conduct a separate, more macro-level analysis of the groups (the second analysis being more like a meta-analysis, only qualitative). Once the study’s unit of analysis has been established, the next step is to select the specific cases that will be included in the analysis. The primary consideration in case selection for QCA is the outcome of interest. In the example we present in this paper, the outcome of interest is patient satisfaction. The research team should already have a clear definition of the outcome prior to selecting cases for the analysis. Cases must share enough background characteristics–considered “constants” in the analysis–to be comparable within the context of the outcome of interest. For example, it would not be feasible to include both primary care practices and hospitals in the analysis presented in this paper.
Within the subset of cases initially chosen for their commonalities, the cases included in the model must be as diverse as possible. This diversity helps to limit the number of combinations of conditions without empirical instances (explained in greater detail later in the paper). For instance, in the example presented in this paper, cases should vary as much as possible in the number of clinicians working in the practice. In addition, some cases should have a negative outcome, and other cases should have a positive outcome.
One practical issue to keep in mind in any QCA study is increasing the number of cases included in the analysis makes it more challenging for researchers to develop extensive familiarity with each case, which may limit certain kinds of QCA related analysis; but it does not prevent fsQCA from being potentially useful.
At the same time, if the number of cases is too low, for example below ten, then the advantages of QCA over traditional comparative case studies are minimal. “The number of logical remainders will be high, barely any logical minimization of the truth table will be possible, and the paths identified will mostly cover only one case each” (Schneider & Wagemann, 2012).
A key difference between QCA and traditional quantitative analysis is that case selection is iterative, steered by the research question being studied and the research team’s evolving hypothesis. As a result, random sampling and other more mechanical approaches cannot be used in case selection. Rather, a case should be included or excluded from a QCA study based on theoretical reasoning and knowledge of the conditions in the context of the outcome of interest. As the research team’s hypothesis evolves, cases can be added to or dropped from the analysis but researchers should keep a log explaining why they added or removed a case from the analysis so that that action can later be defended. For example, cases can be added or dropped later in the analysis when resolving contradictions in the truth table (see Step 7).
Step #3. Select “Conditions”
A major challenge to selecting conditions for health policy and other social sciences is that one must choose from far too many possible conditions. The primary strategy for reducing the number of conditions to a manageable amount is to take into consideration all existing theories, hypotheses, explanations, and previous findings related to the research question and outcome of
11
interest and rich knowledge of the cases, and based on that information, only include in the analysis conditions that are likely to affect the outcome of interest. A conceptual framework can help researchers identify the conditions and outcome of interest in a QCA study. For example, one could use the Chronic Care Model (Wagner 1998) to guide the selection of conditions and the outcome of interest for an analysis that assesses the impact of medical homes on quality of care or health outcomes. Other models of PCMH capabilities that may affect outcomes of interest (Hoff, 2012; McNeillis & Genevro, 2013). In the example presented in this paper, the conditions are specific practices characteristics and medical home capabilities. On a practical level, the availability of data will also affect the conditions that are included in the analysis.
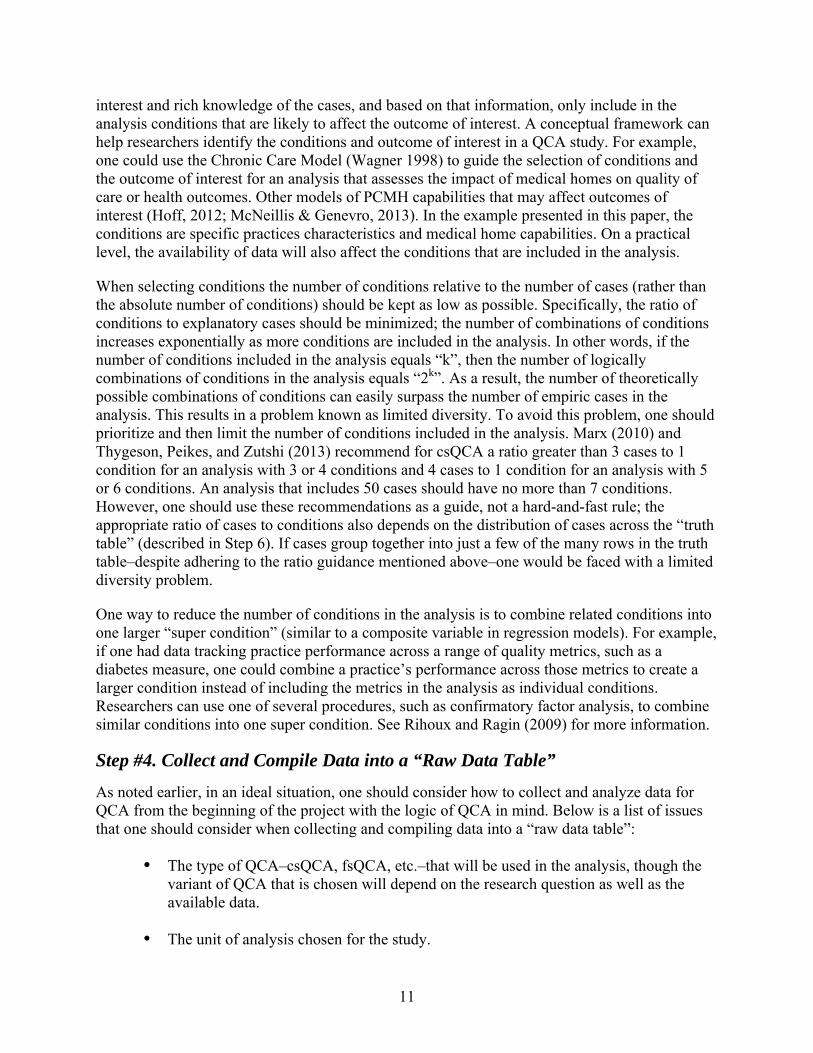
When selecting conditions the number of conditions relative to the number of cases (rather than the absolute number of conditions) should be kept as low as possible. Specifically, the ratio of conditions to explanatory cases should be minimized; the number of combinations of conditions increases exponentially as more conditions are included in the analysis. In other words, if the number of conditions included in the analysis equals “k”, then the number of logically combinations of conditions in the analysis equals “2k”. As a result, the number of theoretically possible combinations of conditions can easily surpass the number of empiric cases in the analysis. This results in a problem known as limited diversity. To avoid this problem, one should prioritize and then limit the number of conditions included in the analysis. Marx (2010) and Thygeson, Peikes, and Zutshi (2013) recommend for csQCA a ratio greater than 3 cases to 1 condition for an analysis with 3 or 4 conditions and 4 cases to 1 condition for an analysis with 5 or 6 conditions. An analysis that includes 50 cases should have no more than 7 conditions. However, one should use these recommendations as a guide, not a hard-and-fast rule; the appropriate ratio of cases to conditions also depends on the distribution of cases across the “truth table” (described in Step 6). If cases group together into just a few of the many rows in the truth table–despite adhering to the ratio guidance mentioned above–one would be faced with a limited diversity problem.
One way to reduce the number of conditions in the analysis is to combine related conditions into one larger “super condition” (similar to a composite variable in regression models). For example, if one had data tracking practice performance across a range of quality metrics, such as a diabetes measure, one could combine a practice’s performance across those metrics to create a larger condition instead of including the metrics in the analysis as individual conditions. Researchers can use one of several procedures, such as confirmatory factor analysis, to combine similar conditions into one super condition. See Rihoux and Ragin (2009) for more information.
Step #4. Collect and Compile Data into a “Raw Data Table”
As noted earlier, in an ideal situation, one should consider how to collect and analyze data for QCA from the beginning of the project with the logic of QCA in mind. Below is a list of issues that one should consider when collecting and compiling data into a “raw data table”:
• The type of QCA–csQCA, fsQCA, etc.–that will be used in the analysis, though the variant of QCA that is chosen will depend on the research question as well as the available data.
• The unit of analysis chosen for the study.
12
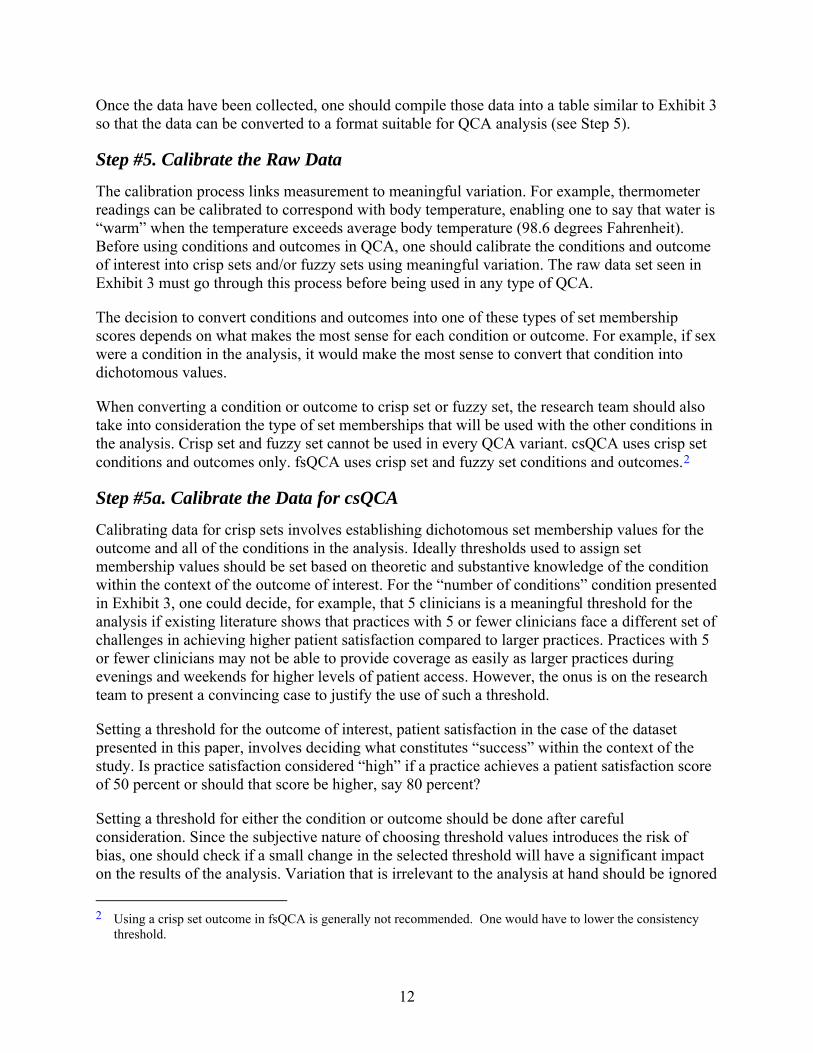
Once the data have been collected, one should compile those data into a table similar to Exhibit 3 so that the data can be converted to a format suitable for QCA analysis (see Step 5).
Step #5. Calibrate the Raw Data
The calibration process links measurement to meaningful variation. For example, thermometer readings can be calibrated to correspond with body temperature, enabling one to say that water is “warm” when the temperature exceeds average body temperature (98.6 degrees Fahrenheit). Before using conditions and outcomes in QCA, one should calibrate the conditions and outcome of interest into crisp sets and/or fuzzy sets using meaningful variation. The raw data set seen in Exhibit 3 must go through this process before being used in any type of QCA.
The decision to convert conditions and outcomes into one of these types of set membership scores depends on what makes the most sense for each condition or outcome. For example, if sex were a condition in the analysis, it would make the most sense to convert that condition into dichotomous values.
When converting a condition or outcome to crisp set or fuzzy set, the research team should also take into consideration the type of set memberships that will be used with the other conditions in the analysis. Crisp set and fuzzy set cannot be used in every QCA variant. csQCA uses crisp set conditions and outcomes only. fsQCA uses crisp set and fuzzy set conditions and outcomes.2
Step #5a. Calibrate the Data for csQCA
Calibrating data for crisp sets involves establishing dichotomous set membership values for the outcome and all of the conditions in the analysis. Ideally thresholds used to assign set membership values should be set based on theoretic and substantive knowledge of the condition within the context of the outcome of interest. For the “number of conditions” condition presented in Exhibit 3, one could decide, for example, that 5 clinicians is a meaningful threshold for the analysis if existing literature shows that practices with 5 or fewer clinicians face a different set of challenges in achieving higher patient satisfaction compared to larger practices. Practices with 5 or fewer clinicians may not be able to provide coverage as easily as larger practices during evenings and weekends for higher levels of patient access. However, the onus is on the research team to present a convincing case to justify the use of such a threshold.
Setting a threshold for the outcome of interest, patient satisfaction in the case of the dataset presented in this paper, involves deciding what constitutes “success” within the context of the study. Is practice satisfaction considered “high” if a practice achieves a patient satisfaction score of 50 percent or should that score be higher, say 80 percent?
Setting a threshold for either the condition or outcome should be done after careful consideration. Since the subjective nature of choosing threshold values introduces the risk of bias, one should check if a small change in the selected threshold will have a significant impact on the results of the analysis. Variation that is irrelevant to the analysis at hand should be ignored 2 Using a crisp set outcome in fsQCA is generally not recommended. One would have to lower the consistency
threshold.
when identifying qualitative thresholds. For example, when establishing a threshold for the health IT condition found in Exhibit 3, one could ignore a practice’s chosen health IT brand if that detail were irrelevant within the context of the outcome of interest.
If it is not possible to use theoretical and substantive knowledge to establish a threshold, one should use technical criteria, such as the distribution of cases. For instance, in the “number of clinicians” example used above, one could decide that existing literature does not support a specific threshold after all and that a better approach is to look at the distribution of cases. If the cases cluster with some small practices and the rest large (in other words, a bimodal distribution), one could use a crisp set membership function. The research team would look at the relationship between the outcome and the “number of clinicians” condition to see if the distribution suggests a cut-point for dichotomizing the measurement function.
As a last resort, the median or mean could be used to establish thresholds. This approach should be used with caution however; one should confirm that using the median or mean as the threshold makes sense in the context of the distribution of cases in the analysis.
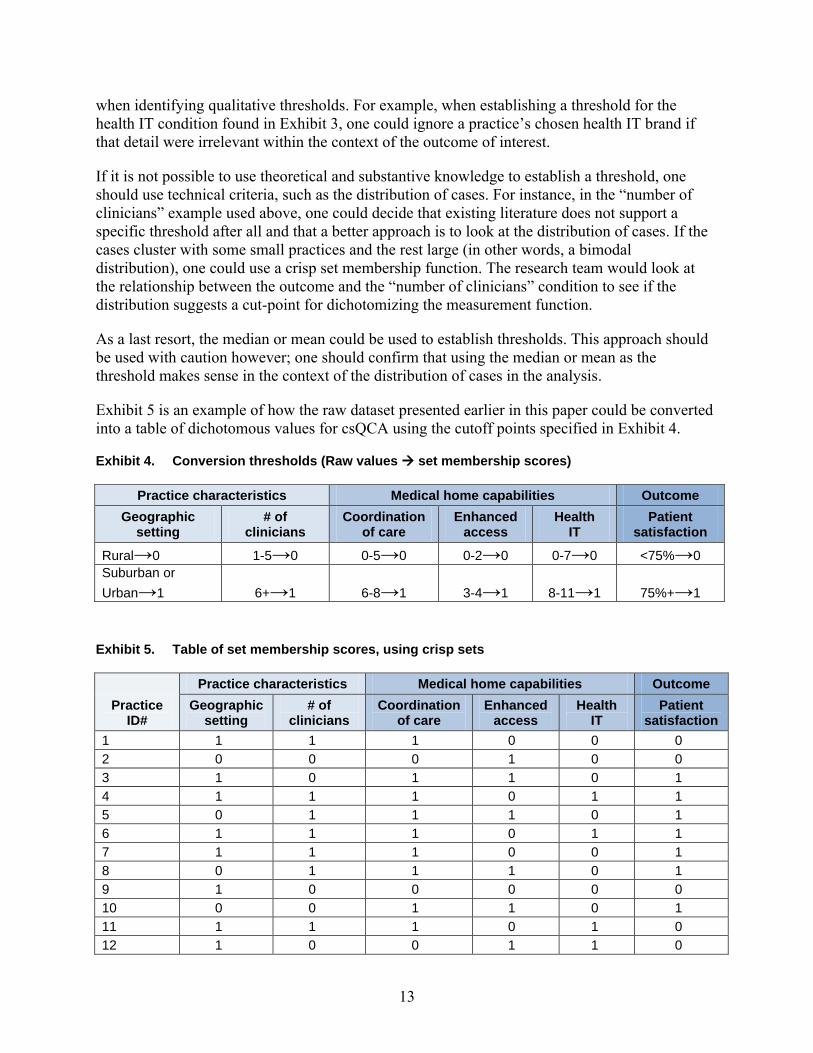
Exhibit 5 is an example of how the raw dataset presented earlier in this paper could be converted into a table of dichotomous values for csQCA using the cutoff points specified in Exhibit 4.
Exhibit 4. Conversion thresholds (Raw values set membership scores)
Practice characteristics Medical home capabilities Outcome Geographic
setting # of
clinicians Coordination
of care Enhanced
access Health
IT Patient
satisfaction
Rural→0 1-5→0 0-5→0 0-2→0 0-7→0 <75%→0 Suburban or Urban→1 6+→1 6-8→1 3-4→1 8-11→1 75%+→1
Exhibit 5. Table of set membership scores, using crisp sets
Practice ID#
Practice characteristics Medical home capabilities Outcome Geographic
setting # of
clinicians Coordination
of care Enhanced
access Health
IT Patient
satisfaction 1 1 1 1 0 0 0 2 0 0 0 1 0 0 3 1 0 1 1 0 1 4 1 1 1 0 1 1 5 0 1 1 1 0 1 6 1 1 1 0 1 1 7 1 1 1 0 0 1 8 0 1 1 1 0 1 9 1 0 0 0 0 0 10 0 0 1 1 0 1 11 1 1 1 0 1 0 12 1 0 0 1 1 0
13
14
Step #5b. Calibrate the Data for fsQCA
fsQCA is designed to study conditions and outcomes that vary by level or degree and that cannot easily be divided into dichotomous set membership scores. As previously noted, one can also include dichotomous conditions and outcomes in fsQCA where appropriate.3 In fsQCA, one can calibrate partial membership in a fuzzy set, with values ranging from non-membership (considered “0”) to full membership (considered “1”) and a qualitative threshold (considered “0.5”) where the value of a condition switches from being viewed as more in the set membership to being more out of the set membership, or vice versa. Choosing a condition’s qualitative threshold is one of the most important steps in the calibration process for fuzzy sets.
The fuzzy set approach allows researchers to scale set membership values where appropriate–referred to as partial membership in a set. Scores that are close to full membership in the set–for example, 0.9 or 0.8–demonstrate strong but not full membership in the set. Likewise a score of 0.1 or 0.2 is considered weak but not full non-membership. In addition, while 0.5 can be a qualitative anchor for fuzzy sets, the use of “0.5” as a value to code during calibration for a set membership score is discouraged because it essentially contributes no information to the analysis, a score of “0.5” means the case is neither in nor out. As a result a score of “0.5” cannot contribute any information to the analysis. By definition, even conditions calibrated according to a fuzzy scheme should fall on one side or the other of the “0.5” qualitative anchor.
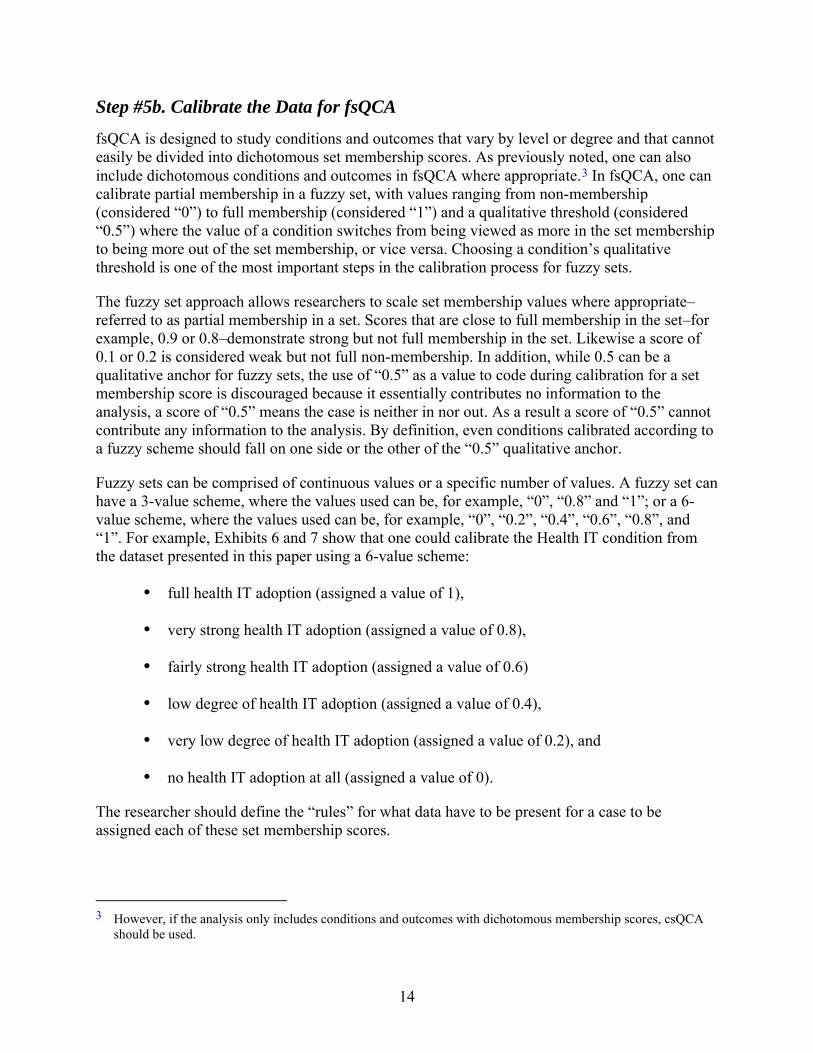
Fuzzy sets can be comprised of continuous values or a specific number of values. A fuzzy set can have a 3-value scheme, where the values used can be, for example, “0”, “0.8” and “1”; or a 6-value scheme, where the values used can be, for example, “0”, “0.2”, “0.4”, “0.6”, “0.8”, and “1”. For example, Exhibits 6 and 7 show that one could calibrate the Health IT condition from the dataset presented in this paper using a 6-value scheme:
• full health IT adoption (assigned a value of 1),
• very strong health IT adoption (assigned a value of 0.8),
• fairly strong health IT adoption (assigned a value of 0.6)
• low degree of health IT adoption (assigned a value of 0.4),
• very low degree of health IT adoption (assigned a value of 0.2), and
• no health IT adoption at all (assigned a value of 0).
The researcher should define the “rules” for what data have to be present for a case to be assigned each of these set membership scores.
3 However, if the analysis only includes conditions and outcomes with dichotomous membership scores, csQCA
should be used.
15
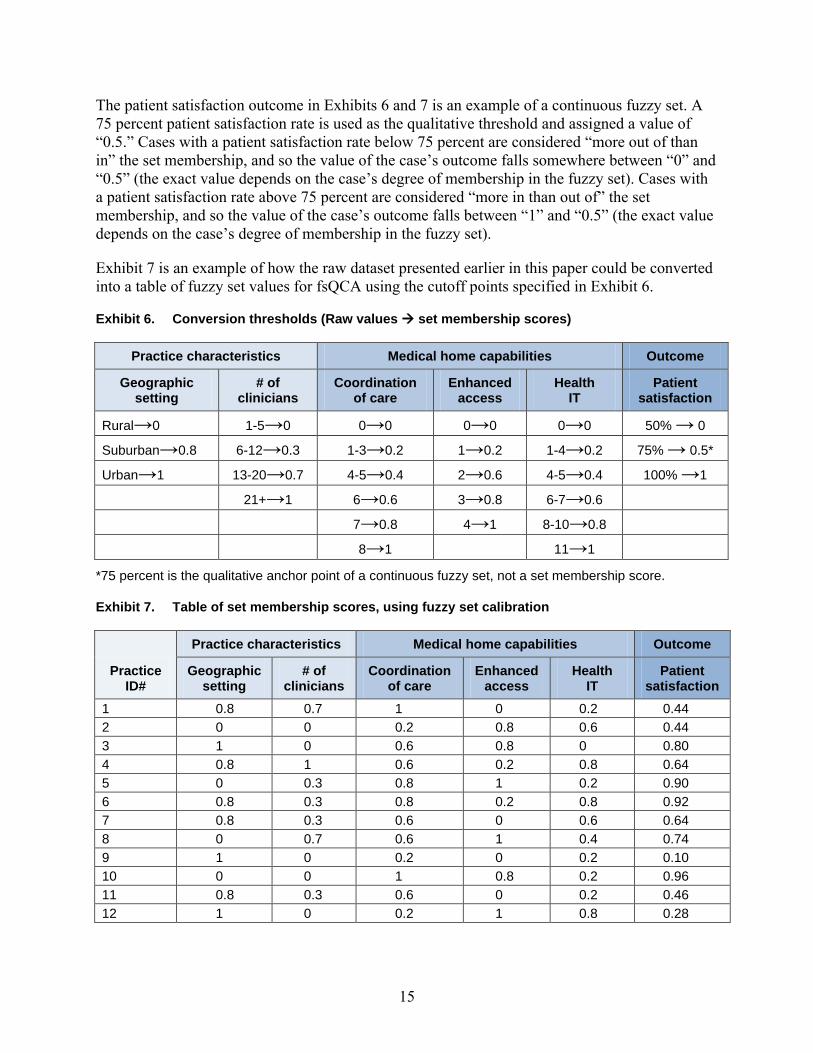
The patient satisfaction outcome in Exhibits 6 and 7 is an example of a continuous fuzzy set. A 75 percent patient satisfaction rate is used as the qualitative threshold and assigned a value of “0.5.” Cases with a patient satisfaction rate below 75 percent are considered “more out of than in” the set membership, and so the value of the case’s outcome falls somewhere between “0” and “0.5” (the exact value depends on the case’s degree of membership in the fuzzy set). Cases with a patient satisfaction rate above 75 percent are considered “more in than out of” the set membership, and so the value of the case’s outcome falls between “1” and “0.5” (the exact value depends on the case’s degree of membership in the fuzzy set).
Exhibit 7 is an example of how the raw dataset presented earlier in this paper could be converted into a table of fuzzy set values for fsQCA using the cutoff points specified in Exhibit 6.
Exhibit 6. Conversion thresholds (Raw values set membership scores)
Practice characteristics Medical home capabilities Outcome
Geographic setting
# of clinicians
Coordination of care
Enhanced access
Health IT
Patient satisfaction
Rural→0 1-5→0 0→0 0→0 0→0 50% → 0
Suburban→0.8 6-12→0.3 1-3→0.2 1→0.2 1-4→0.2 75% → 0.5*
Urban→1 13-20→0.7 4-5→0.4 2→0.6 4-5→0.4 100% →1 -- 21+→1 6→0.6 3→0.8 6-7→0.6 --
-- -- 7→0.8 4→1 8-10→0.8 --
-- -- 8→1 -- 11→1 --
*75 percent is the qualitative anchor point of a continuous fuzzy set, not a set membership score.
Exhibit 7. Table of set membership scores, using fuzzy set calibration
Practice ID#
Practice characteristics Medical home capabilities Outcome
Geographic setting
# of clinicians
Coordination of care
Enhanced access
Health IT
Patient satisfaction
1 0.8 0.7 1 0 0.2 0.44 2 0 0 0.2 0.8 0.6 0.44 3 1 0 0.6 0.8 0 0.80 4 0.8 1 0.6 0.2 0.8 0.64 5 0 0.3 0.8 1 0.2 0.90 6 0.8 0.3 0.8 0.2 0.8 0.92 7 0.8 0.3 0.6 0 0.6 0.64 8 0 0.7 0.6 1 0.4 0.74 9 1 0 0.2 0 0.2 0.10 10 0 0 1 0.8 0.2 0.96 11 0.8 0.3 0.6 0 0.2 0.46 12 1 0 0.2 1 0.8 0.28
16
There are a number of calibration approaches that one could use as part of fsQCA. One approach relies on the research team’s theoretical knowledge as well as empirical evidence. For this method, the research team should develop specific rules for set membership assignment using obvious facts (e.g., healthcare is expensive), generally accepted ideas in social science, and deeper knowledge in one’s field of study. For example, students typically receive a high school diploma after completing twelfth grade in the United States. When calibrating a condition about high school-educated individuals, a research team would take into consideration that there is a significant difference between someone who has completed eleventh grade and someone who has completed twelfth grade. Before proceeding to calibration, one should analyze pertinent primary and secondary data sources to the extent possible.
Another group of calibration methods are used specifically with interval scale data. One technique is for researchers to use interval-scale measures from external sources to calibrate conditions and outcomes. For example, when calibrating a “rich countries” condition, one could use a measure of Gross National Product (GDP) per capita from an external data source to gauge the wealth of the countries in the analysis. One would then use the context of the study to determine whether a country should be classified as having full membership, partial membership or non-membership in the set. For example, a country with a GDP per capita of $19,000 could be identified as having full membership in the context of a global study but only partial membership in the context of a study that only includes developed countries. Researchers who choose this approach may also use case knowledge to identify and justify qualitative anchors. For example, one may decide that Hungary’s GDP per capita is the lowest point at which a case should be considered “more in than out of” the membership set of the condition “rich countries” based on the research team’s knowledge of the cases in the analysis.
The next two methods–referred to as “indirect” and “direct”–rely partially on statistical models and can also be used with interval scale data. In the direct method, the raw data are converted to values between full non-membership (“0”) and full membership (“1”) using a logistic function. In the indirect method, one estimates each case’s placement along the 0 to 1 spectrum and then regresses those estimates on the raw data using a fractional logit model to estimate predicted values. Those predicted values become the set membership scores in the analysis. For a more detailed description of these two methods, see Ragin (2008).
Several concerns about the indirect and direct methods have been raised. First, the two techniques drill down to levels that may be more granular than should be allowed given the raw data and the research team’s knowledge of the topic. For example, data on HIT adoption may not be detailed enough to justify set membership scores that are “0.25” versus “0.20.” Second, the choice of the logistic model is somewhat arbitrary; other functions (e.g., the square root function) may be just as suitable (or unsuitable) a tool (Thiem, 2010).
Generally, one’s decision to use a specific calibration method should not influence the results of the analysis as long as the anchors are chosen thoughtfully and therefore will not change when using a different calibration approach or functional form. However, the direct and indirect methods may be a less appropriate technique for datasets where the conditions are based more on qualitative assessments and less on empirical data.
17
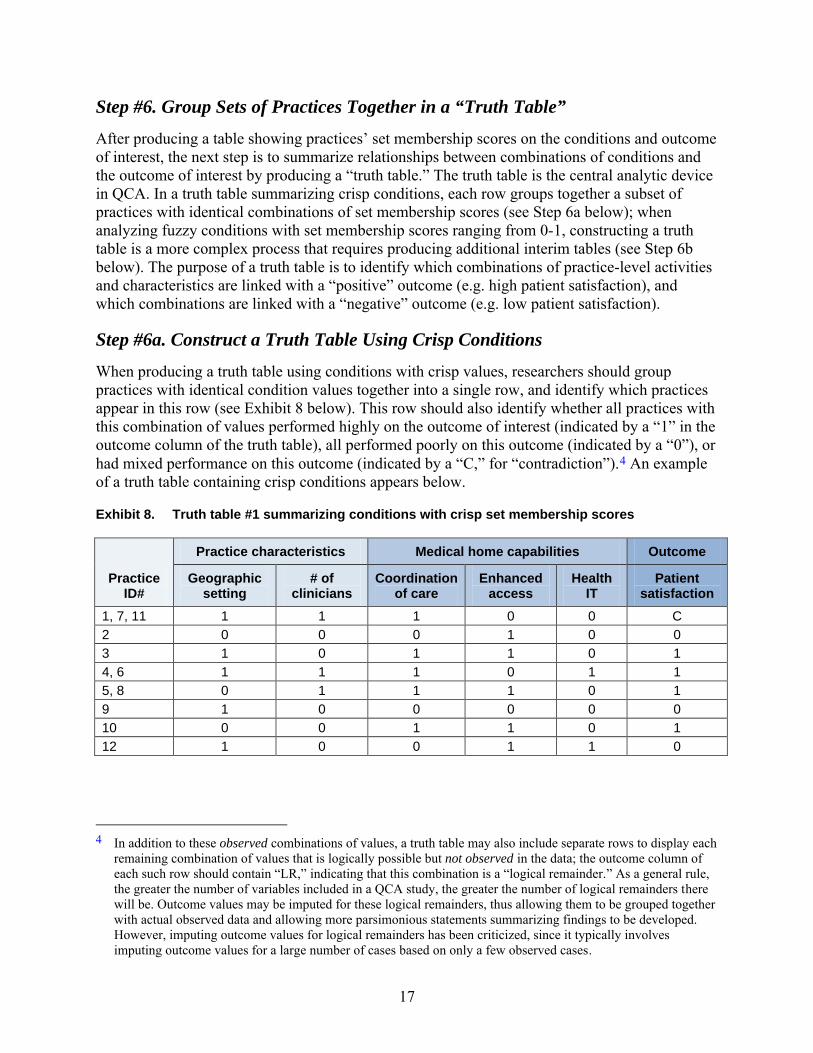
Step #6. Group Sets of Practices Together in a “Truth Table”
After producing a table showing practices’ set membership scores on the conditions and outcome of interest, the next step is to summarize relationships between combinations of conditions and the outcome of interest by producing a “truth table.” The truth table is the central analytic device in QCA. In a truth table summarizing crisp conditions, each row groups together a subset of practices with identical combinations of set membership scores (see Step 6a below); when analyzing fuzzy conditions with set membership scores ranging from 0-1, constructing a truth table is a more complex process that requires producing additional interim tables (see Step 6b below). The purpose of a truth table is to identify which combinations of practice-level activities and characteristics are linked with a “positive” outcome (e.g. high patient satisfaction), and which combinations are linked with a “negative” outcome (e.g. low patient satisfaction).
Step #6a. Construct a Truth Table Using Crisp Conditions
When producing a truth table using conditions with crisp values, researchers should group practices with identical condition values together into a single row, and identify which practices appear in this row (see Exhibit 8 below). This row should also identify whether all practices with this combination of values performed highly on the outcome of interest (indicated by a “1” in the outcome column of the truth table), all performed poorly on this outcome (indicated by a “0”), or had mixed performance on this outcome (indicated by a “C,” for “contradiction”).4 An example of a truth table containing crisp conditions appears below.
Exhibit 8. Truth table #1 summarizing conditions with crisp set membership scores
Practice ID#
Practice characteristics Medical home capabilities Outcome
Geographic setting
# of clinicians
Coordination of care
Enhanced access
Health IT
Patient satisfaction
1, 7, 11 1 1 1 0 0 C 2 0 0 0 1 0 0 3 1 0 1 1 0 1 4, 6 1 1 1 0 1 1 5, 8 0 1 1 1 0 1 9 1 0 0 0 0 0 10 0 0 1 1 0 1 12 1 0 0 1 1 0
4 In addition to these observed combinations of values, a truth table may also include separate rows to display each
remaining combination of values that is logically possible but not observed in the data; the outcome column of each such row should contain “LR,” indicating that this combination is a “logical remainder.” As a general rule, the greater the number of variables included in a QCA study, the greater the number of logical remainders there will be. Outcome values may be imputed for these logical remainders, thus allowing them to be grouped together with actual observed data and allowing more parsimonious statements summarizing findings to be developed. However, imputing outcome values for logical remainders has been criticized, since it typically involves imputing outcome values for a large number of cases based on only a few observed cases.
18
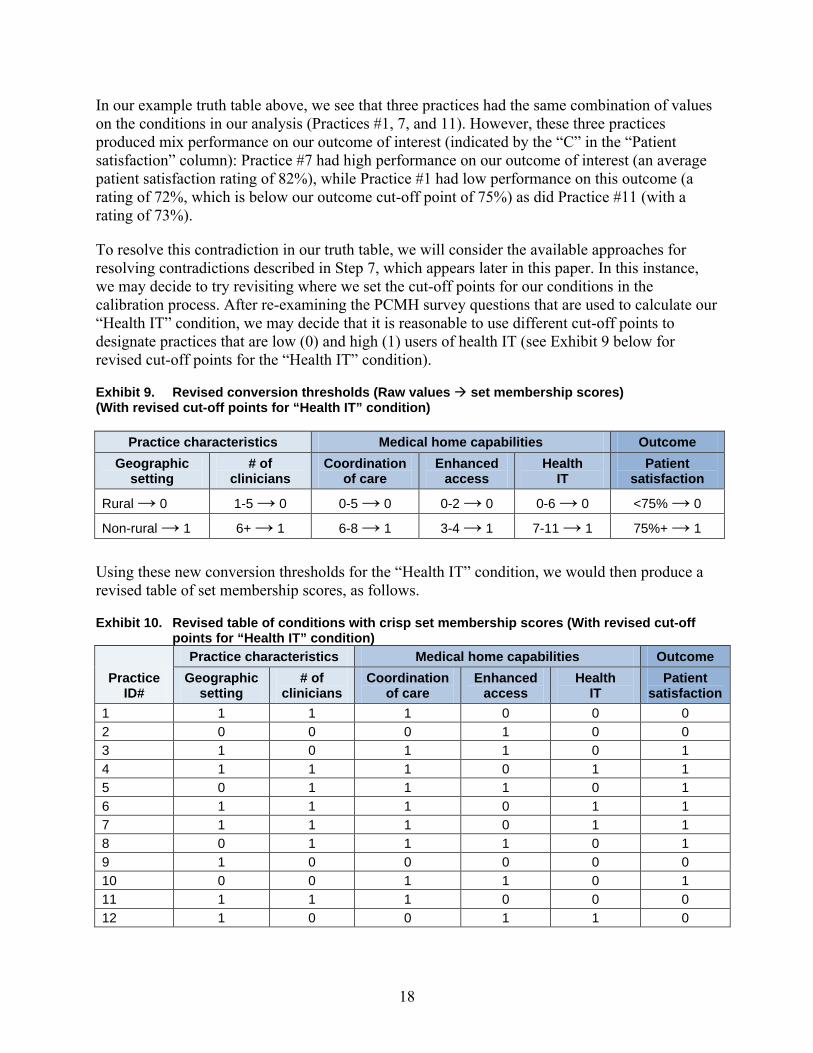
In our example truth table above, we see that three practices had the same combination of values on the conditions in our analysis (Practices #1, 7, and 11). However, these three practices produced mix performance on our outcome of interest (indicated by the “C” in the “Patient satisfaction” column): Practice #7 had high performance on our outcome of interest (an average patient satisfaction rating of 82%), while Practice #1 had low performance on this outcome (a rating of 72%, which is below our outcome cut-off point of 75%) as did Practice #11 (with a rating of 73%).
To resolve this contradiction in our truth table, we will consider the available approaches for resolving contradictions described in Step 7, which appears later in this paper. In this instance, we may decide to try revisiting where we set the cut-off points for our conditions in the calibration process. After re-examining the PCMH survey questions that are used to calculate our “Health IT” condition, we may decide that it is reasonable to use different cut-off points to designate practices that are low (0) and high (1) users of health IT (see Exhibit 9 below for revised cut-off points for the “Health IT” condition).
Exhibit 9. Revised conversion thresholds (Raw values set membership scores) (With revised cut-off points for “Health IT” condition)
Practice characteristics Medical home capabilities Outcome Geographic
setting # of
clinicians Coordination
of care Enhanced
access Health
IT Patient
satisfaction
Rural → 0 1-5 → 0 0-5 → 0 0-2 → 0 0-6 → 0 <75% → 0
Non-rural → 1 6+ → 1 6-8 → 1 3-4 → 1 7-11 → 1 75%+ → 1
Using these new conversion thresholds for the “Health IT” condition, we would then produce a revised table of set membership scores, as follows.
Exhibit 10. Revised table of conditions with crisp set membership scores (With revised cut-off points for “Health IT” condition)
Practice ID#
Practice characteristics Medical home capabilities Outcome Geographic
setting # of
clinicians Coordination
of care Enhanced
access Health
IT Patient
satisfaction 1 1 1 1 0 0 0 2 0 0 0 1 0 0 3 1 0 1 1 0 1 4 1 1 1 0 1 1 5 0 1 1 1 0 1 6 1 1 1 0 1 1 7 1 1 1 0 1 1 8 0 1 1 1 0 1 9 1 0 0 0 0 0 10 0 0 1 1 0 1 11 1 1 1 0 0 0 12 1 0 0 1 1 0
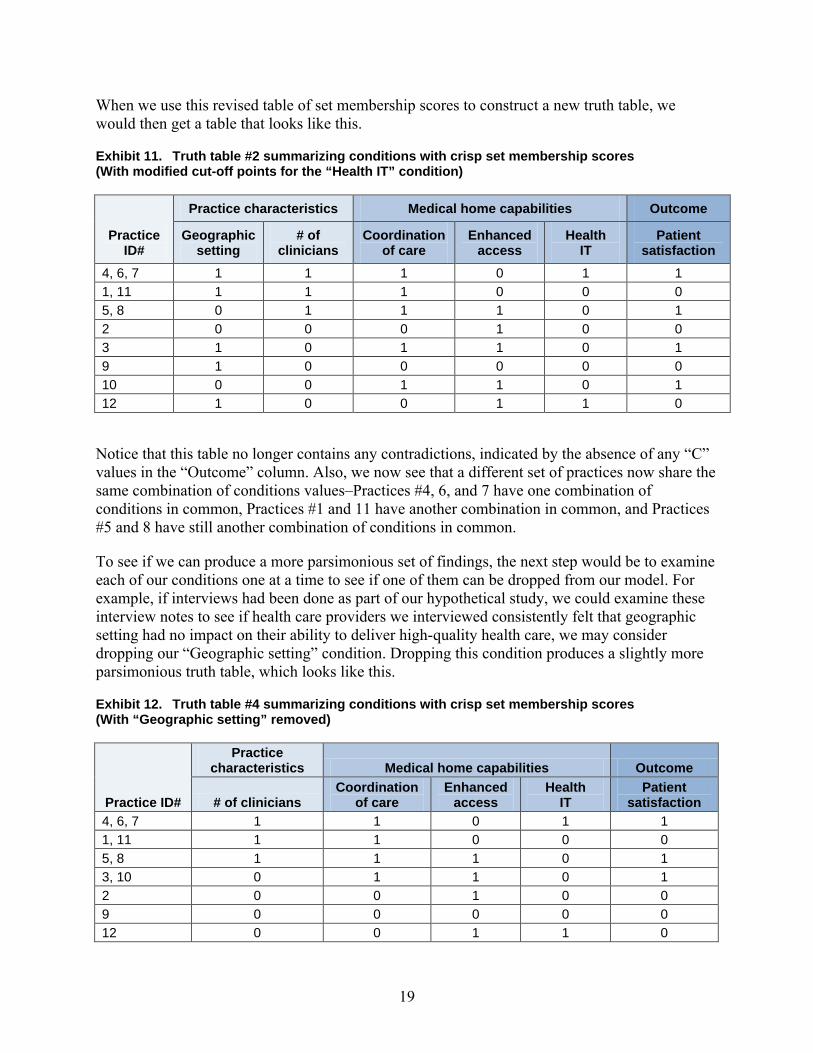
When we use this revised table of set membership scores to construct a new truth table, we would then get a table that looks like this.
Exhibit 11. Truth table #2 summarizing conditions with crisp set membership scores (With modified cut-off points for the “Health IT” condition)
Practice ID#
Practice characteristics Medical home capabilities Outcome
Geographic setting
# of clinicians
Coordination of care
Enhanced access
Health IT
Patient satisfaction
4, 6, 7 1 1 1 0 1 1 1, 11 1 1 1 0 0 0 5, 8 0 1 1 1 0 1 2 0 0 0 1 0 0 3 1 0 1 1 0 1 9 1 0 0 0 0 0 10 0 0 1 1 0 1 12 1 0 0 1 1 0
Notice that this table no longer contains any contradictions, indicated by the absence of any “C” values in the “Outcome” column. Also, we now see that a different set of practices now share the same combination of conditions values–Practices #4, 6, and 7 have one combination of conditions in common, Practices #1 and 11 have another combination in common, and Practices #5 and 8 have still another combination of conditions in common.
To see if we can produce a more parsimonious set of findings, the next step would be to examine each of our conditions one at a time to see if one of them can be dropped from our model. For example, if interviews had been done as part of our hypothetical study, we could examine these interview notes to see if health care providers we interviewed consistently felt that geographic setting had no impact on their ability to deliver high-quality health care, we may consider dropping our “Geographic setting” condition. Dropping this condition produces a slightly more parsimonious truth table, which looks like this.
Exhibit 12. Truth table #4 summarizing conditions with crisp set membership scores (With “Geographic setting” removed)
Practice ID#
Practice characteristics Medical home capabilities Outcome
# of clinicians Coordination
of care Enhanced
access Health
IT Patient
satisfaction 4, 6, 7 1 1 0 1 1 1, 11 1 1 0 0 0 5, 8 1 1 1 0 1 3, 10 0 1 1 0 1 2 0 0 1 0 0 9 0 0 0 0 0 12 0 0 1 1 0
19
12 0.2 0.8 1 0 0.8 0.2 0.28
This iterative process of preparing and revising truth tables to resolve contradictions is a hallmark of the QCA process, and differs from traditional quantitative analyses, where re-constructing variables after conducting an analysis in an effort to produce a different result is not typically recommended.
Step #6b. Construct a Truth Table Using Fuzzy Values
When analyzing conditions with fuzzy values, some interim tables are needed to facilitate the creation of a truth table.
Step #6b-i. Construct a Table of Set Membership Scores and their Complements
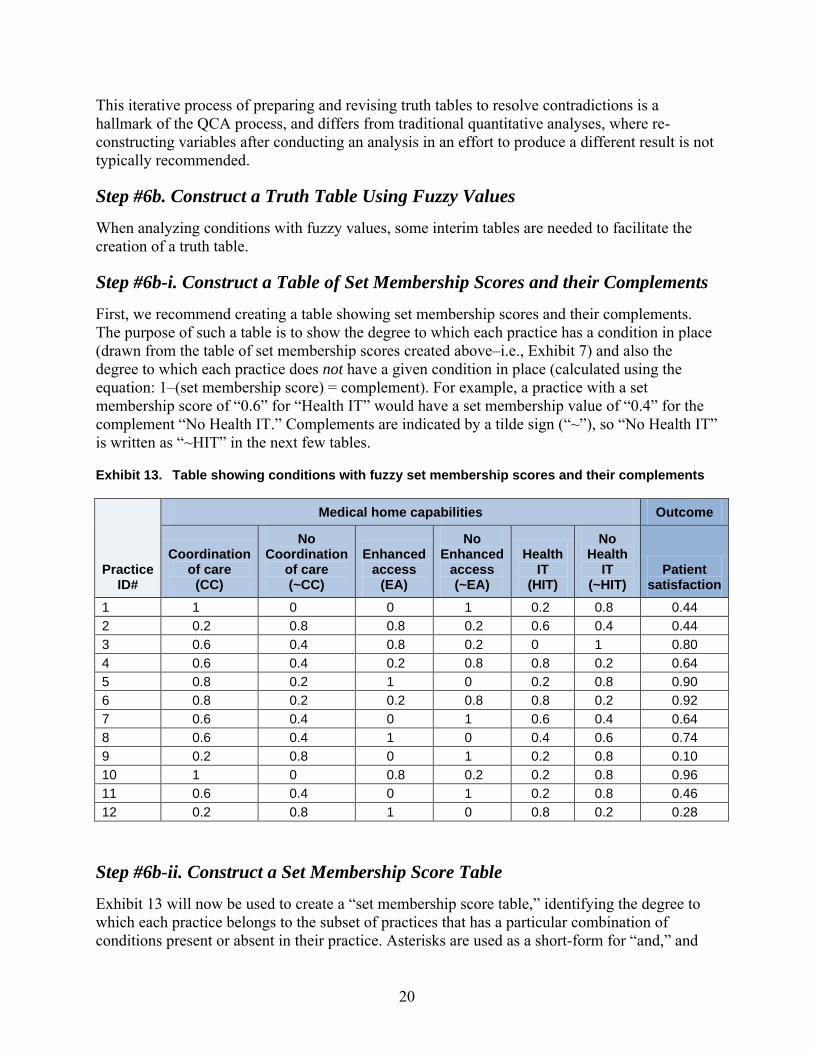
First, we recommend creating a table showing set membership scores and their complements. The purpose of such a table is to show the degree to which each practice has a condition in place (drawn from the table of set membership scores created above–i.e., Exhibit 7) and also the degree to which each practice does not have a given condition in place (calculated using the equation: 1–(set membership score) = complement). For example, a practice with a set membership score of “0.6” for “Health IT” would have a set membership value of “0.4” for the complement “No Health IT.” Complements are indicated by a tilde sign (“~”), so “No Health IT” is written as “~HIT” in the next few tables.
Exhibit 13. Table showing conditions with fuzzy set membership scores and their complements
Practice ID#
Medical home capabilities Outcome
Coordination of care
(CC)
No Coordination
of care (~CC)
Enhanced access
(EA)
No Enhanced
access (~EA)
Health IT
(HIT)
No Health
IT (~HIT)
Patient satisfaction
1 1 0 0 1 0.2 0.8 0.44 2 0.2 0.8 0.8 0.2 0.6 0.4 0.44 3 0.6 0.4 0.8 0.2 0 1 0.80 4 0.6 0.4 0.2 0.8 0.8 0.2 0.64 5 0.8 0.2 1 0 0.2 0.8 0.90 6 0.8 0.2 0.2 0.8 0.8 0.2 0.92 7 0.6 0.4 0 1 0.6 0.4 0.64 8 0.6 0.4 1 0 0.4 0.6 0.74 9 0.2 0.8 0 1 0.2 0.8 0.10 10 1 0 0.8 0.2 0.2 0.8 0.96 11 0.6 0.4 0 1 0.2 0.8 0.46
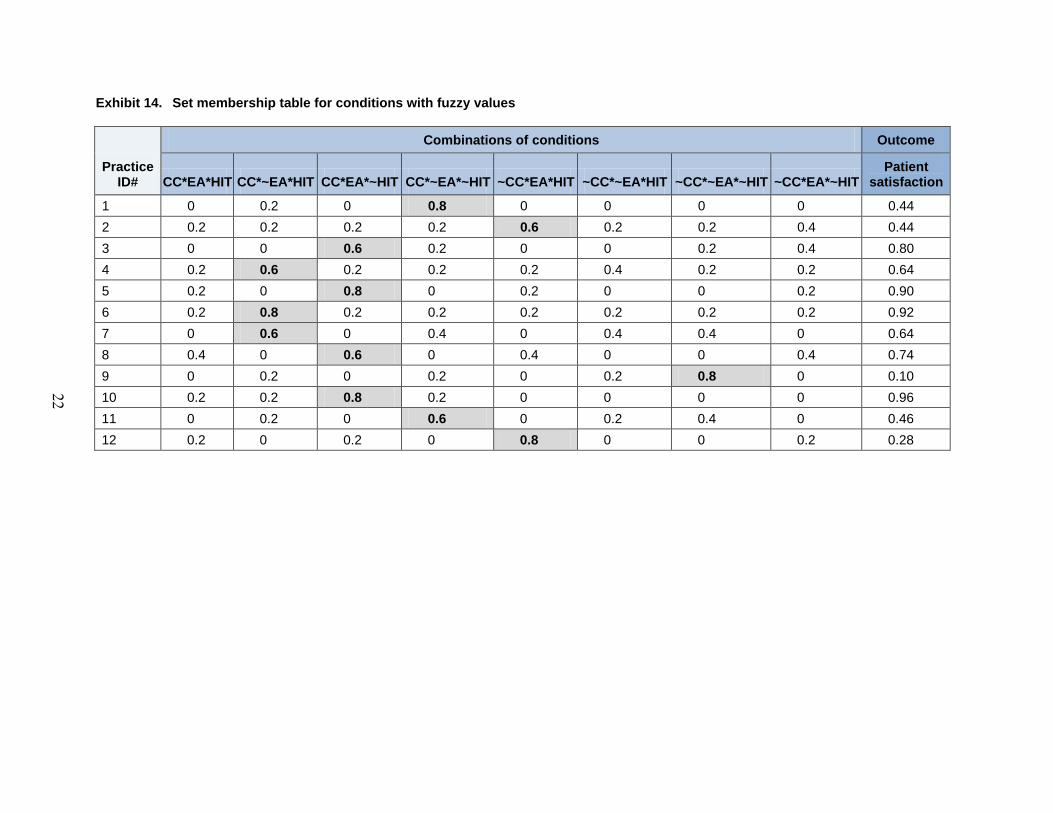
Step #6b-ii. Construct a Set Membership Score Table
Exhibit 13 will now be used to create a “set membership score table,” identifying the degree to which each practice belongs to the subset of practices that has a particular combination of conditions present or absent in their practice. Asterisks are used as a short-form for “and,” and
20

21
the tilde sign (“~”) will continue to be used to indicate that a condition is not present. For example, “CC*~EA*HIT” is used to represent the combination of engaging in care coordination, not offering enhanced access, and having adopted health IT. Our outcome variable will continue to be displayed in the final column of this new table we are creating.
The rules of formal logic and Boolean algebra, rather than statistics, are used to identify the degree to which each practice has or does not have a given combination of medical home capabilities present in the set membership table. These rules dictate that the degree to which a practice has a combination of two conditions in place, for example, is represented by the lower of these two values. For example, if a practice has a value of “0.6” on the “Health IT” condition (which can be thought of as meaning the practice is weakly a member of the set of practices that have adopted Health IT), and a value of “0.3” on the “Care coordination” value (suggesting the practice has mostly not adopted care coordination), the degree to which the practice has adopted both “Health IT” AND “Care coordination” would be “0.3” (since 0.3 is the lower of the two values).
To identify the degree to which a practice has adopted one condition and not adopted another, which we will need to display in our set membership table below, we would turn to the complements calculated in the table above. For example, if the same practice has a value of “0.6” on “Health IT” and a value of “0.7” on “No Care coordination” (the complement of their “Care coordination” set membership score), the degree to which this practice belongs to the set of practices that has adopted “Health IT” but not “Care coordination” would be “0.6.”
Once a set membership table has been populated with values using the above approach, the final step is to flag all combinations of conditions with a value above “0.5,” such as through the use of a bold font and grey shading. Each practice in the table should have one value above 0.5 in its row, identifying the combination of conditions that best characterizes the mix of conditions that are present and absent in their practice.
22
Exhibit 14. Set membership table for conditions with fuzzy values
Practice ID#
Combinations of conditions Outcome
CC*EA*HIT CC*~EA*HIT CC*EA*~HIT CC*~EA*~HIT ~CC*EA*HIT ~CC*~EA*HIT ~CC*~EA*~HIT ~CC*EA*~HIT Patient
satisfaction
1 0 0.2 0 0.8 0 0 0 0 0.44 2 0.2 0.2 0.2 0.2 0.6 0.2 0.2 0.4 0.44 3 0 0 0.6 0.2 0 0 0.2 0.4 0.80 4 0.2 0.6 0.2 0.2 0.2 0.4 0.2 0.2 0.64 5 0.2 0 0.8 0 0.2 0 0 0.2 0.90 6 0.2 0.8 0.2 0.2 0.2 0.2 0.2 0.2 0.92 7 0 0.6 0 0.4 0 0.4 0.4 0 0.64 8 0.4 0 0.6 0 0.4 0 0 0.4 0.74 9 0 0.2 0 0.2 0 0.2 0.8 0 0.10 10 0.2 0.2 0.8 0.2 0 0 0 0 0.96 11 0 0.2 0 0.6 0 0.2 0.4 0 0.46 12 0.2 0 0.2 0 0.8 0 0 0.2 0.28
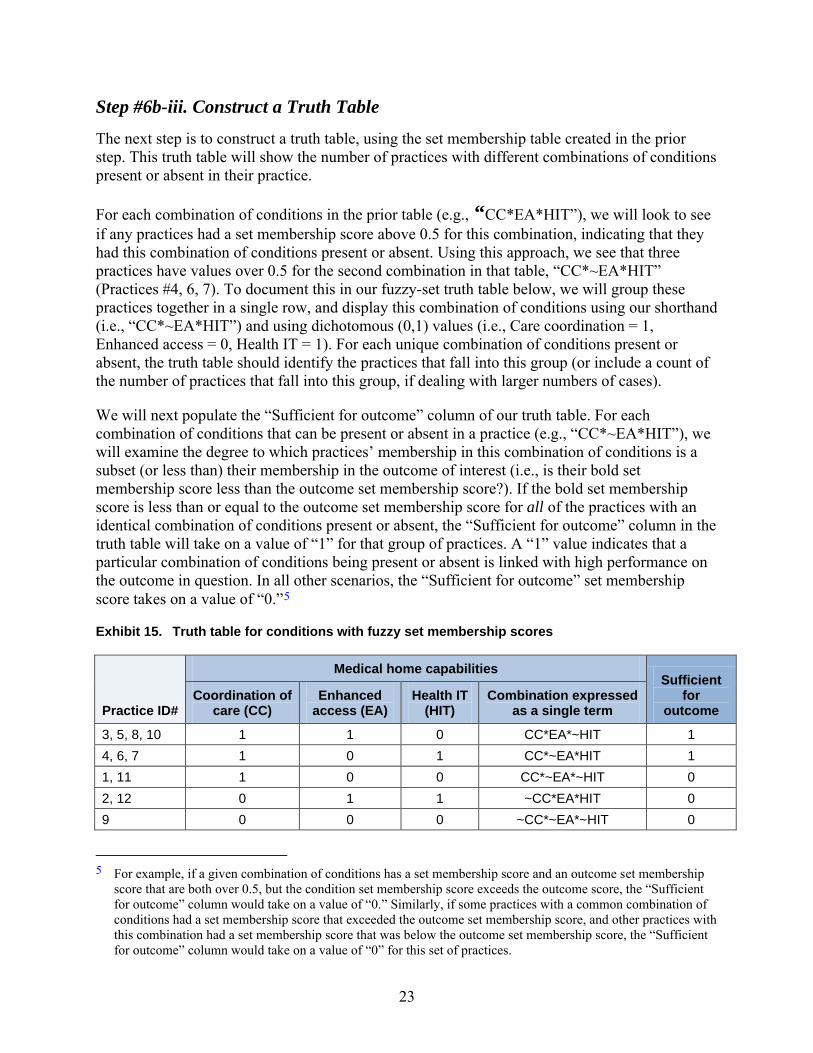
Step #6b-iii. Construct a Truth Table
The next step is to construct a truth table, using the set membership table created in the prior step. This truth table will show the number of practices with different combinations of conditions present or absent in their practice.
For each combination of conditions in the prior table (e.g., “CC*EA*HIT”), we will look to see if any practices had a set membership score above 0.5 for this combination, indicating that they had this combination of conditions present or absent. Using this approach, we see that three practices have values over 0.5 for the second combination in that table, “CC*~EA*HIT” (Practices #4, 6, 7). To document this in our fuzzy-set truth table below, we will group these practices together in a single row, and display this combination of conditions using our shorthand (i.e., “CC*~EA*HIT”) and using dichotomous (0,1) values (i.e., Care coordination = 1, Enhanced access = 0, Health IT = 1). For each unique combination of conditions present or absent, the truth table should identify the practices that fall into this group (or include a count of the number of practices that fall into this group, if dealing with larger numbers of cases).
We will next populate the “Sufficient for outcome” column of our truth table. For each combination of conditions that can be present or absent in a practice (e.g., “CC*~EA*HIT”), we will examine the degree to which practices’ membership in this combination of conditions is a subset (or less than) their membership in the outcome of interest (i.e., is their bold set membership score less than the outcome set membership score?). If the bold set membership score is less than or equal to the outcome set membership score for all of the practices with an identical combination of conditions present or absent, the “Sufficient for outcome” column in the truth table will take on a value of “1” for that group of practices. A “1” value indicates that a particular combination of conditions being present or absent is linked with high performance on the outcome in question. In all other scenarios, the “Sufficient for outcome” set membership score takes on a value of “0.”5
Exhibit 15. Truth table for conditions with fuzzy set membership scores
Practice ID#
Medical home capabilities Sufficient
for outcome
Coordination of care (CC)
Enhanced access (EA)
Health IT (HIT)
Combination expressed as a single term
3, 5, 8, 10 1 1 0 CC*EA*~HIT 1 4, 6, 7 1 0 1 CC*~EA*HIT 1 1, 11 1 0 0 CC*~EA*~HIT 0 2, 12 0 1 1 ~CC*EA*HIT 0 9 0 0 0 ~CC*~EA*~HIT 0
5 For example, if a given combination of conditions has a set membership score and an outcome set membership score that are both over 0.5, but the condition set membership score exceeds the outcome score, the “Sufficient for outcome” column would take on a value of “0.” Similarly, if some practices with a common combination of conditions had a set membership score that exceeded the outcome set membership score, and other practices with this combination had a set membership score that was below the outcome set membership score, the “Sufficient for outcome” column would take on a value of “0” for this set of practices.
23
24
Step #7. Resolve Contradictions
After constructing an initial truth table, the next step is to resolve any contradictions. In truth tables produced using crisp set membership scores, contradictions are identified with a “C” in the “Outcome” column of the table–meaning the presence or absence of a particular combination of conditions was linked with high performance on the outcome of interest in some practices and low performance in other practices. In truth tables constructed using fuzzy values, combinations of conditions that have low “consistency scores” (which we discuss in Step 9, below) are considered contradictory.
Contradictions can be resolved using any of the following techniques:
• Add a condition to the model. Adding a condition can cause a set of practices that previously had identical conditions present and absent to now fall into new subgroups that vary in terms of which conditions are present or absent in their practice. However, adding a condition makes a QCA model more complex, and reduces the number of practices that will have a particular combination of conditions in common, which can in turn produce less parsimonious findings.
• Remove a condition and/or replace it with another condition. A condition can be removed from the QCA model if other available data sources (e.g., notes from interviews with health care providers) suggest that the condition in question has no relationship to the outcome of interest. Recall that in Step 6a, we removed the “Geographic setting” variable from our model for this reason.
• Change cut-off points used in the data conversion process. Changing the cut-off points used to determine if a condition is present or absent can resolve contradictions, but should be done thoughtfully to ensure that the resulting set membership scores still make sense. Recall that in Step 6a, we changed the cut-off points for the “Health IT” condition to resolve a contradiction.
• Use a different outcome variable. An entirely different outcome can be used, or the way the outcome is measured can be modified. For example, contradictions may arise if the outcome variable is measured too broadly (e.g., a composite quality measure of too many different clinical quality measures).
• Qualitatively study each practice to identify omitted conditions. Re-examining notes from interviews with practices and other qualitative information available on each practice can help illuminate some other condition that might explain differences observed in outcomes. Such conditions can be added to the QCA.
• Drop borderline practices. If some practices are “borderline” cases–for instance, their scores on medical home capability conditions are so low that it is unclear if they should even be considered medical homes–these practices can be removed from a QCA analysis.
25
Step #8. Summarize Findings Using Statements and/or Diagrams
The next step in our analysis is to summarize the findings from our truth tables using solution formulas, written statements, and/or Venn diagrams. Two sets of these statements or diagrams should be created: one identifying which conditions are linked with high performance on an outcome of interest, and another identifying which conditions are linked with low performance on the outcome of interest. These two statements are not automatically the inverse or complement of each other – a concept known in QCA as “asymmetry” – and will therefore need to be derived separately. There are two types of relationships that can exist between a condition (or combination of conditions) and an outcome of interest:
• Necessity–A condition is necessary to produce an outcome if it is always present when the outcome occurs. For example, in order for a patient to report high quality-of-life ratings one month following surgery, it is necessary for the patient to first survive the surgery. When a condition is found to always be necessary to produce the outcome of interest, statements of findings can be simplified by “factoring out” this condition, which we describe how to do below. Another way of thinking about this is that necessary conditions exhibit a superset relationship with the outcome set.
• Sufficiency–A condition (or combination of conditions) is sufficient to produce an outcome if the outcome always occurs when the condition (or combination of conditions) is present. Because phenomena studied in social sciences tend to be causally complex, most QCAs will identify multiple sufficient conditions (or combinations of conditions). For example, following surgery, “spending two days recuperating in the hospital,” “receiving written discharge instructions,” and “having a follow-up appointment with a doctor within one week of discharge” may be a sufficient combination of conditions to consistently produce high quality-of-life ratings one month after surgery. Alternatively, “being prescribed pain killers,” “having a caregiver present for discharge instructions,” and “receiving weekly phone calls from a care transitions nurse” may be another combination of conditions that is sufficient to produce high quality-of-life ratings one month following surgery. In the written statements of findings that appear below, each bullet lists a combination of medical home conditions that are sufficient to produce our outcome of interest. Another way of thinking about this is that a sufficient condition (or combination of conditions) exhibits a subset relationship with the outcome set.
Although necessity and sufficiency are concepts used to describe relationships between conditions and an outcome of interest, conditions should not be thought of as causing the outcome of interest based solely on QCA findings.
An example statement summarizing the relationships in the truth table we created at the end of Step 6b (Exhibit 15) would be written as follows:
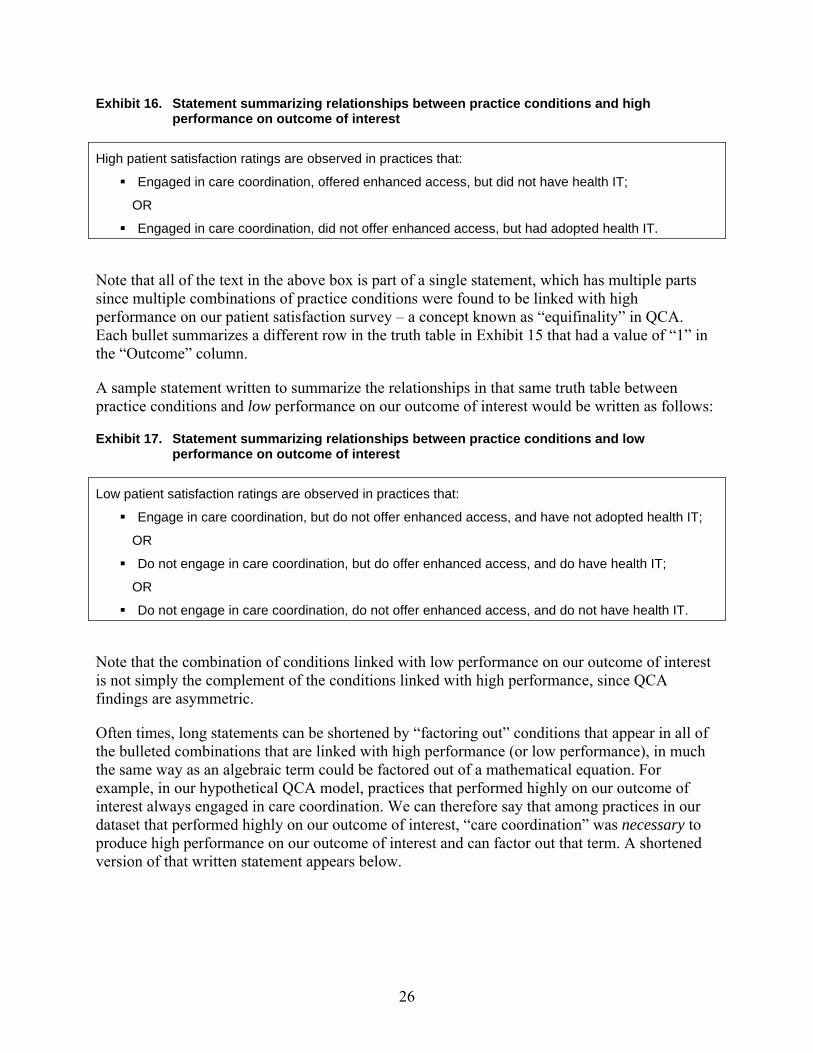
26
Exhibit 16. Statement summarizing relationships between practice conditions and high performance on outcome of interest
High patient satisfaction ratings are observed in practices that:
Engaged in care coordination, offered enhanced access, but did not have health IT;
OR
Engaged in care coordination, did not offer enhanced access, but had adopted health IT.
Note that all of the text in the above box is part of a single statement, which has multiple parts since multiple combinations of practice conditions were found to be linked with high performance on our patient satisfaction survey – a concept known as “equifinality” in QCA. Each bullet summarizes a different row in the truth table in Exhibit 15 that had a value of “1” in the “Outcome” column.
A sample statement written to summarize the relationships in that same truth table between practice conditions and low performance on our outcome of interest would be written as follows:
Exhibit 17. Statement summarizing relationships between practice conditions and low performance on outcome of interest
Low patient satisfaction ratings are observed in practices that:
Engage in care coordination, but do not offer enhanced access, and have not adopted health IT;
OR
Do not engage in care coordination, but do offer enhanced access, and do have health IT;
OR
Do not engage in care coordination, do not offer enhanced access, and do not have health IT.
Note that the combination of conditions linked with low performance on our outcome of interest is not simply the complement of the conditions linked with high performance, since QCA findings are asymmetric.
Often times, long statements can be shortened by “factoring out” conditions that appear in all of the bulleted combinations that are linked with high performance (or low performance), in much the same way as an algebraic term could be factored out of a mathematical equation. For example, in our hypothetical QCA model, practices that performed highly on our outcome of interest always engaged in care coordination. We can therefore say that among practices in our dataset that performed highly on our outcome of interest, “care coordination” was necessary to produce high performance on our outcome of interest and can factor out that term. A shortened version of that written statement appears below.
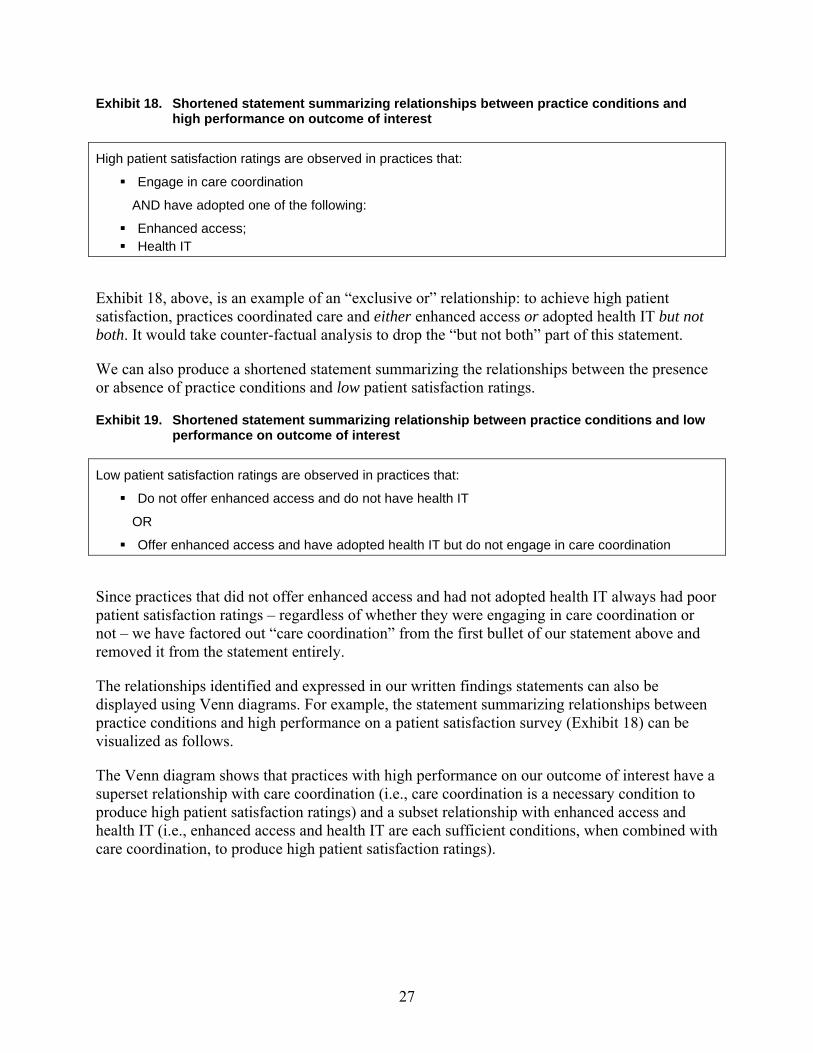
27
Exhibit 18. Shortened statement summarizing relationships between practice conditions and high performance on outcome of interest
High patient satisfaction ratings are observed in practices that: Engage in care coordination
AND have adopted one of the following:
Enhanced access; Health IT
Exhibit 18, above, is an example of an “exclusive or” relationship: to achieve high patient satisfaction, practices coordinated care and either enhanced access or adopted health IT but not both. It would take counter-factual analysis to drop the “but not both” part of this statement.
We can also produce a shortened statement summarizing the relationships between the presence or absence of practice conditions and low patient satisfaction ratings.
Exhibit 19. Shortened statement summarizing relationship between practice conditions and low performance on outcome of interest
Low patient satisfaction ratings are observed in practices that: Do not offer enhanced access and do not have health IT
OR
Offer enhanced access and have adopted health IT but do not engage in care coordination
Since practices that did not offer enhanced access and had not adopted health IT always had poor patient satisfaction ratings – regardless of whether they were engaging in care coordination or not – we have factored out “care coordination” from the first bullet of our statement above and removed it from the statement entirely.
The relationships identified and expressed in our written findings statements can also be displayed using Venn diagrams. For example, the statement summarizing relationships between practice conditions and high performance on a patient satisfaction survey (Exhibit 18) can be visualized as follows.
The Venn diagram shows that practices with high performance on our outcome of interest have a superset relationship with care coordination (i.e., care coordination is a necessary condition to produce high patient satisfaction ratings) and a subset relationship with enhanced access and health IT (i.e., enhanced access and health IT are each sufficient conditions, when combined with care coordination, to produce high patient satisfaction ratings).
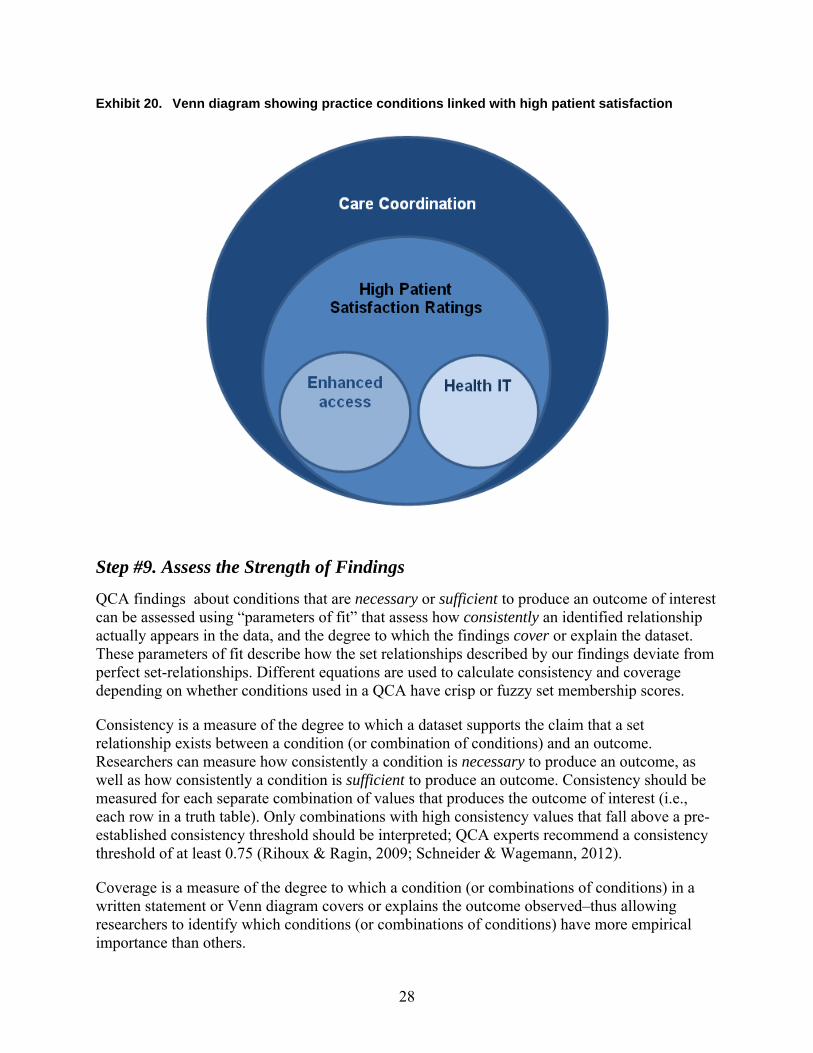
28
Exhibit 20. Venn diagram showing practice conditions linked with high patient satisfaction
Step #9. Assess the Strength of Findings
QCA findings about conditions that are necessary or sufficient to produce an outcome of interest can be assessed using “parameters of fit” that assess how consistently an identified relationship actually appears in the data, and the degree to which the findings cover or explain the dataset. These parameters of fit describe how the set relationships described by our findings deviate from perfect set-relationships. Different equations are used to calculate consistency and coverage depending on whether conditions used in a QCA have crisp or fuzzy set membership scores.
Consistency is a measure of the degree to which a dataset supports the claim that a set relationship exists between a condition (or combination of conditions) and an outcome. Researchers can measure how consistently a condition is necessary to produce an outcome, as well as how consistently a condition is sufficient to produce an outcome. Consistency should be measured for each separate combination of values that produces the outcome of interest (i.e., each row in a truth table). Only combinations with high consistency values that fall above a pre-established consistency threshold should be interpreted; QCA experts recommend a consistency threshold of at least 0.75 (Rihoux & Ragin, 2009; Schneider & Wagemann, 2012).
Coverage is a measure of the degree to which a condition (or combinations of conditions) in a written statement or Venn diagram covers or explains the outcome observed–thus allowing researchers to identify which conditions (or combinations of conditions) have more empirical importance than others.
29
The equations used to calculate the consistency and coverage of QCA findings are included in an Appendix to this paper. In addition, QCA software programs identified earlier can automatically generate consistency and coverage values (see the software user manuals for specific commands to use). Additional reading is recommended before attempting to calculate or interpret the consistency or coverage of QCA findings.
Step #10. Interpret Findings
In the final QCA step, researchers should present their findings in a narrative format, identifying combinations of conditions that are linked with high performance on their outcome of interest and combinations that are linked with low performance on that outcome–making sure to only interpret combinations with high “consistency” values. Focusing on a single condition in a discussion of QCA findings is contrary to the goals of the approach, but can be done if appropriate. For example, in discussing the findings from the analysis we conducted of a hypothetical dataset in this paper, we may want to single out “Care coordination” as being the most important medical home care process to adopt, but we would want to note that adopting it by itself–without also adopting “Enhanced access” or “Health IT”–was not sufficient to guarantee high patient satisfaction ratings.
Researchers should identify the share of practices not covered by their written statements or Venn diagrams, and explain what the calculated consistency and coverage values mean in terms of the strength and trustworthiness of their QCA findings.
Venn diagrams should be used to graphically represent relationships between conditions and the outcome of interest, if possible. Truth tables and set membership tables should be included in a presentation of findings, along with any other tables that researchers believe readers may find helpful, such as raw data tables. Researchers should be transparent and explicit about what cut-off points they use to convert raw data into set membership scores, and should identify and justify all choices made in their analysis.
An analysis of QCA findings can be enhanced by combining it with a discussion of findings generated using traditional quantitative and qualitative approaches, which may be possible if QCA is being conducted as part of a larger study that also employs traditional quantitative research methods (e.g., statistical regression analysis) and qualitative research methods (e.g., thematic analysis of notes from interviews and/or focus groups).
Researchers should also draw on prior literature when they discuss why particular conditions or combinations of conditions may be linked with performance on an outcome of interest.
As with any area of health services research, one should be sensitive to the audience and limit jargon when talking to those less familiar with the QCA method.
Some examples of journal articles summarizing QCA studies are included in the “References” section of this paper (Kahwati, Lewis, Kane, et al., 2011; Weiner, Jabobs, Minasian, et al., 2012; Ford, Duncan & Ginter, 2005; Chuang, Dill, Craft Morgan & Konrad, 2012; Longest & Thoits, 2012).
30
8. The Promise of QCA for Medical Home Evaluations This paper sought to provide an in-depth overview of QCA and its potential application to PCMH research and evaluation and possibly other provider payment and delivery system reforms, such as accountable care organizations. There are both general and specific reasons for funders, policymakers, and researchers to consider using QCA. Generally, QCA seeks to combine the strengths of traditional qualitative and quantitative research, providing a new and complementary approach and data analysis tool-kit.
QCA is well suited for concept formation, the creation of typologies, and complex causal analysis, particularly when there is reason to believe that alternative factors can produce the same outcome, combinations of conditions matter, or there are different causal explanations for “success” or “failure” or other key outcomes of interest. QCA is also very well suited to situations when the number of cases being studied is in the mid-range (10-50), although it can be used for larger numbers of cases as well.
More specifically, QCA seems to be well suited to the mission and role of policymakers and practitioners seeking to understand a relatively new and complex payment and delivery intervention like PCMH, particularly the “recipes” for success or failure, how best to improve, and whether, where and how to scale up and spread any successful pilot or demonstration. One could argue the field of PCMH research is in its infancy and for several reasons could benefit from a “third” way to explore causal relationships. These reasons are that: PCMH pilots and demonstrations are complex and context specific; prior empirical result shows null or inconsistent findings and at least one study (Thygeson et al., 2012) illustrates the potential value of QCA; and, finally, results from QCA can inform future stages of qualitative and quantitative data collection, analysis, and interpretation of results.
QCA analysis of PCMH initiatives can complement qualitative and quantitative methods and help identify:
• Useful theoretical/conceptual frameworks, typologies, and concepts, particularly through identification of aspects of cases to include in the analysis. For example, which aspects or features of medical homes are important and why?
• What level or value is important or meaningful, particularly through calibration in sets. For example, what differences in medical home assessment or recognition scores are important and why?
• Multiple casual pathways for successful medical home implementation and/or outcomes, or in other words, the “secret recipe” for medical home success; and
• Where, when, and/or under what conditions the medical home model is likely to succeed, informing future decisions such as scale up and spread activities. For example, promising places or conditions under which medical home initiatives could be scaled up and spread.
31
References
Brady, H. E. & Collier, D. (2004). Rethinking social inquiry: Diverse tools, shared standards. Lanham, MD: Rowman & Littlefield Publishers, Inc.
Chuang, E., Dill, J., Morgan, J. C., et al. (2012). A configurational approach to the relationship between high performance work practices and frontline health care worker outcomes. Health Services Research, 47(4),1460-81.
Devers, K. J. (2011). The state of quality improvement science in health: what do we know about how to provide better care? Princeton, NJ: Robert Wood Johnson Foundation. Retrieved from http://www.urban.org/uploadedpdf/412454-State-of-Quality-Improvement-Science-in-Health.pdf
Dixon-Woods, M., Agarwal, S., Jones, D., et al. (2005). Synthesising qualitative and quantitative evidence: A review of possible methods. Journal of Health Services Research and Policy, 10(1), 45-53.
Ford, E. W., Duncan, W. J., Ginter, P. M. (2005). Health departments’ implementation of public health’s core functions: an assessment of health impacts. Public Health, 119, 11-21.
Glatman-Freedman A., Cohen M. L, Nichols K. A., et al. (2010). Factors affecting the introduction of new vaccines to poor nations: A comparative study of the Haemophilus influenzae type B and hepatitis B vaccines. PLOS One, 5(11), e13802.
Grofman, B., & Schneider, C. Q. (2009). An introduction to crisp set QCA, with a comparison to binary logistic regression. Political Research Quarterly, 62, 662.
Hoff T., Weller W., & DePuccio M. (2012) The patient-centered medical home: A review of recent research. Medical Care Research and Review, DOI: 0.1177/1077558712447688.
Kahwati, L.C., Kane, H. L., & Lewis, M. A. (2013, June). “Qualitative comparative analysis: A systematic review of application within health care and public health.” Poster presented at Academy Health Annual Research Meeting, Baltimore, MD.
Kahwati, L. C., Lewis, M. A., Kane, H., et al. (2011). Best practices in the Veterans Health Administration’s MOVE! weight management program. American Journal of Preventive Medicine, 41(5), 457-464.
Longest, K. C. & Thoits, P. A. (2012). Gender, the stress process, and health: A configurational approach. Society and Mental Health, (XX)X, 1-20.
Marx A. (2010). Crisp-set qualitative comparative analysis (csQCA) and model specification: Benchmarks for future csQCA applications. International Journal of Multiple Research Approaches, 4, 138-58.
McNeillis, R.J., Genevro, J.L., and Meyers D.S. Lessons Learned From the Study of Primary Care Transformation. (2013). Annals of Family Medicine, 11(1), S1-S5.
32
Pawson, R., T. Greenhalgh, et al. (2005). Realist review–a new method of systematic review designed for complex policy interventions. J Health Serv Res Policy, 10(Suppl 1), 21-34.
Ragin, C. C. (1987). The comparative method: Moving beyond qualitative and quantitative strategies. Berkeley: University of California Press.
Ragin, C. C. (2008). Redesigning social inquiry: Fuzzy sets and beyond. Chicago: University of Chicago Press.
Rîhoux, B. & Ragin, C. C. (2009). Configurational comparative methods: Qualitative comparative analysis (QCA) and related techniques. Thousand Oaks, CA: Sage Publications, Inc.
Schneider, C. Q. & Wagemann, C. (2012). Set-theoretic methods for the social sciences: A guide to qualitative comparative analysis. New York: Cambridge University Press.
Thiem, A. (2013). Software. Retrieved from http://www.compasss.org/software.htm
Thiem, A. (2010). Set-relational fit and the formulation of transformational rules in fsQCA. COMPASSS working paper No. 61.
Thygeson, N. M., Peikes, D., & Zutshi, A. (2013). Mixed methods: Fuzzy set qualitative comparative analysis and configurational comparative methods: Powerful tools to study and refine patient-centered medical home models. Rockville, MD: Agency for Healthcare Research and Quality.
Thygeson, N. M., Solberg, L. I., Asche, S. E., et al. (2012). Using fuzzy set qualitative comparative analysis (fs/QCA) to explore the relationship between medical “homeness” and quality. Health Services Research, 47(1), 22-45.
Vink, M. P. & Van Vliet, O. (2013). Not quite crisp, not yet fuzzy? Assessing the potentials and pitfalls of multi-value QCA: Response to Thiem. Field Methods, 25(2), 208-213.
Vink, M. P. & Van Vliet, O. (2009). Not quite crisp, not yet fuzzy? Assessing the potentials and pitfalls of multi-value QCA. Field Methods, 21(3), 265-289.
Wagner, E. H. (1998). Chronic disease management: What will it take to improve care for chronic illness? Effective Clinical Practices, 1(1), 2-4.
Weiner, B. J., Jacobs, S. R., Minasian, L. M., Good, M. J. (2012). Organizational designs for achieving high treatment trial enrollment: A fuzzy-set analysis of the community clinical oncology program. Journal of Oncology Practice, 8(5), 287-291.

33
Appendix
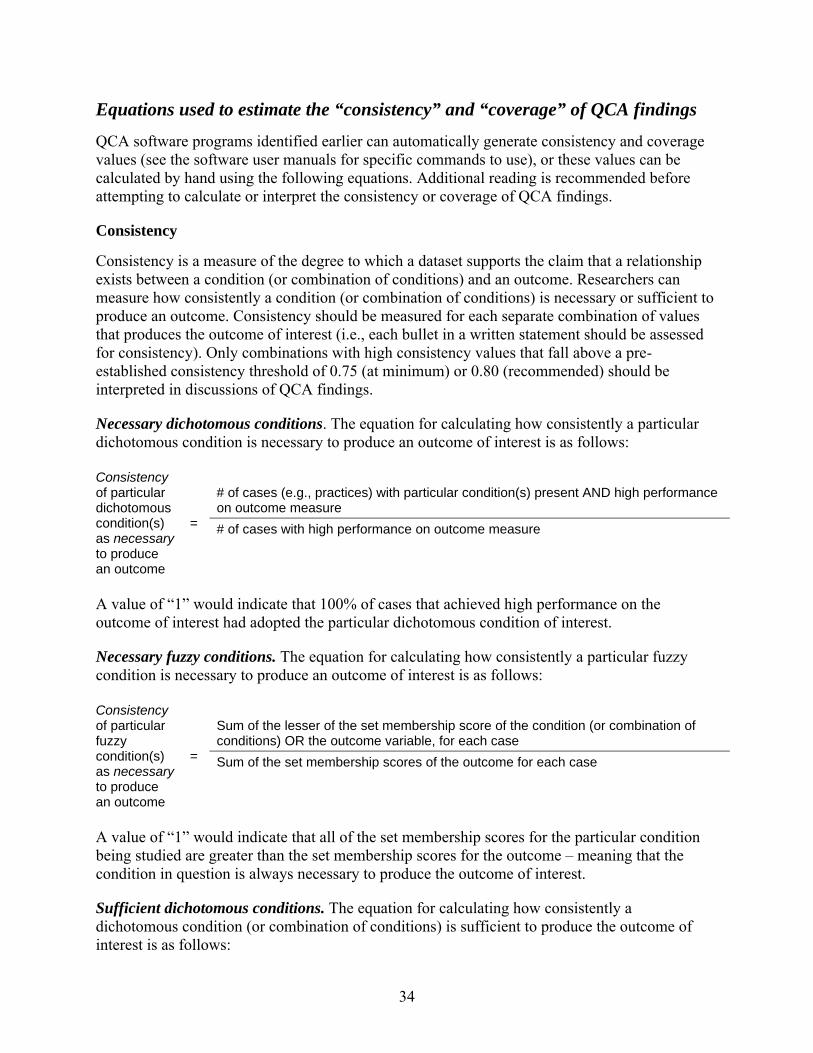
34
Equations used to estimate the “consistency” and “coverage” of QCA findings
QCA software programs identified earlier can automatically generate consistency and coverage values (see the software user manuals for specific commands to use), or these values can be calculated by hand using the following equations. Additional reading is recommended before attempting to calculate or interpret the consistency or coverage of QCA findings.
Consistency
Consistency is a measure of the degree to which a dataset supports the claim that a relationship exists between a condition (or combination of conditions) and an outcome. Researchers can measure how consistently a condition (or combination of conditions) is necessary or sufficient to produce an outcome. Consistency should be measured for each separate combination of values that produces the outcome of interest (i.e., each bullet in a written statement should be assessed for consistency). Only combinations with high consistency values that fall above a pre-established consistency threshold of 0.75 (at minimum) or 0.80 (recommended) should be interpreted in discussions of QCA findings.
Necessary dichotomous conditions. The equation for calculating how consistently a particular dichotomous condition is necessary to produce an outcome of interest is as follows:
Consistency of particular dichotomous condition(s) as necessary to produce an outcome
=
# of cases (e.g., practices) with particular condition(s) present AND high performance on outcome measure # of cases with high performance on outcome measure
A value of “1” would indicate that 100% of cases that achieved high performance on the outcome of interest had adopted the particular dichotomous condition of interest.
Necessary fuzzy conditions. The equation for calculating how consistently a particular fuzzy condition is necessary to produce an outcome of interest is as follows:
Consistency of particular fuzzy condition(s) as necessary to produce an outcome
=
Sum of the lesser of the set membership score of the condition (or combination of conditions) OR the outcome variable, for each case Sum of the set membership scores of the outcome for each case
A value of “1” would indicate that all of the set membership scores for the particular condition being studied are greater than the set membership scores for the outcome – meaning that the condition in question is always necessary to produce the outcome of interest.
Sufficient dichotomous conditions. The equation for calculating how consistently a dichotomous condition (or combination of conditions) is sufficient to produce the outcome of interest is as follows:
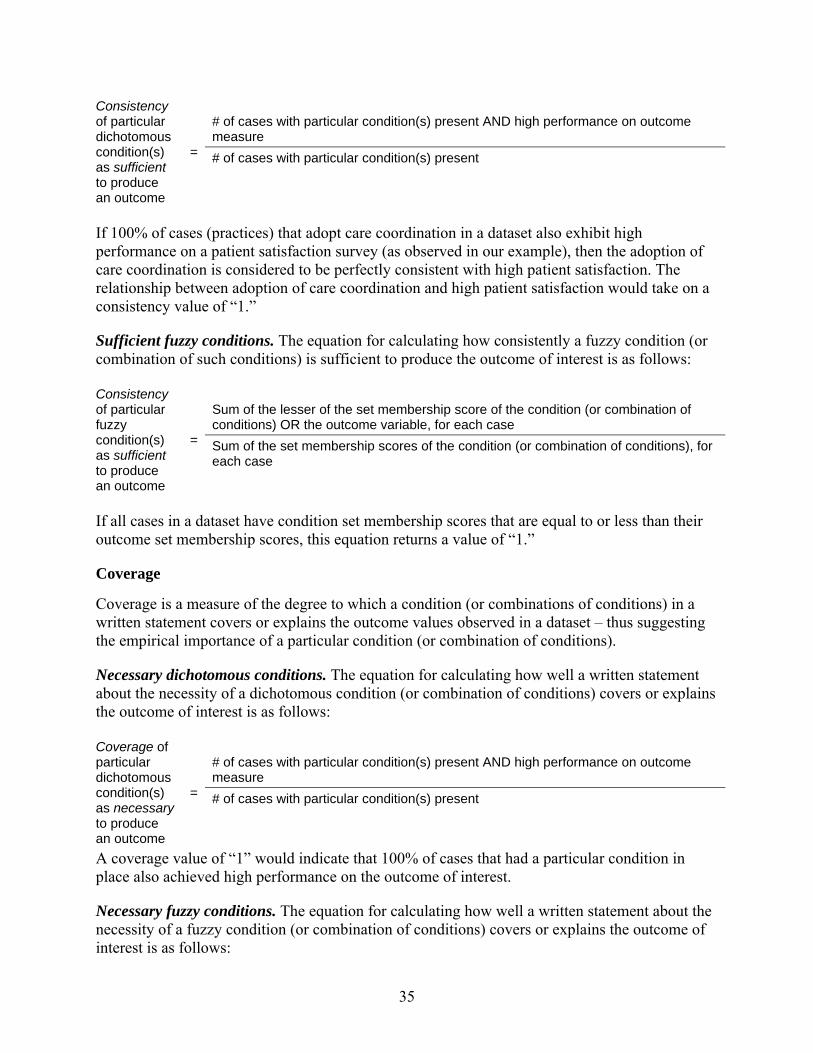
35
Consistency of particular dichotomous condition(s) as sufficient to produce an outcome
=
# of cases with particular condition(s) present AND high performance on outcome measure # of cases with particular condition(s) present
If 100% of cases (practices) that adopt care coordination in a dataset also exhibit high performance on a patient satisfaction survey (as observed in our example), then the adoption of care coordination is considered to be perfectly consistent with high patient satisfaction. The relationship between adoption of care coordination and high patient satisfaction would take on a consistency value of “1.”
Sufficient fuzzy conditions. The equation for calculating how consistently a fuzzy condition (or combination of such conditions) is sufficient to produce the outcome of interest is as follows:
Consistency of particular fuzzy condition(s) as sufficient to produce an outcome
=
Sum of the lesser of the set membership score of the condition (or combination of conditions) OR the outcome variable, for each case Sum of the set membership scores of the condition (or combination of conditions), for each case
If all cases in a dataset have condition set membership scores that are equal to or less than their outcome set membership scores, this equation returns a value of “1.”
Coverage
Coverage is a measure of the degree to which a condition (or combinations of conditions) in a written statement covers or explains the outcome values observed in a dataset – thus suggesting the empirical importance of a particular condition (or combination of conditions).
Necessary dichotomous conditions. The equation for calculating how well a written statement about the necessity of a dichotomous condition (or combination of conditions) covers or explains the outcome of interest is as follows:
Coverage of particular dichotomous condition(s) as necessary to produce an outcome
=
# of cases with particular condition(s) present AND high performance on outcome measure # of cases with particular condition(s) present
A coverage value of “1” would indicate that 100% of cases that had a particular condition in place also achieved high performance on the outcome of interest.
Necessary fuzzy conditions. The equation for calculating how well a written statement about the necessity of a fuzzy condition (or combination of conditions) covers or explains the outcome of interest is as follows:

36
Coverage of particular fuzzy condition(s) as necessary to produce an outcome
=
Sum of the lesser of the set membership score of the condition (or combination of conditions) OR the outcome variable, for each case Sum of the set membership scores of the condition (or combination of conditions), for each case
A coverage value of “1” would indicate that 100% of cases that had a particular condition in place also achieved high performance on the outcome of interest.
The equations for coverage of necessary conditions are the same as the equations for the consistency of sufficient conditions that appeared earlier in this step. Similarly, the equations for coverage of sufficient conditions that follow below are the same as the equations for the consistency of necessary conditions that appeared earlier.
Sufficient dichotomous conditions. The equation for calculating how well a written statement about the sufficiency of a dichotomous condition (or combination of conditions) covers or explains the outcome of interest is as follows:
Coverage of particular dichotomous condition(s) as sufficient to produce an outcome
=
# of cases with particular condition(s) present AND high performance on outcome measure # of cases with high performance on outcome measure
If 100% of practices that exhibited high performance on the patient satisfaction survey also adopted care coordination, then care coordination as an explanation of high patient satisfaction would take on a coverage value of “1.”
Sufficient fuzzy conditions. The equation for calculating how well a written statement about the sufficiency of a fuzzy condition (or combination of conditions) covers or explains the outcome of interest is as follows:
Coverage of particular fuzzy condition(s) as sufficient to produce an outcome
=
Sum of the lesser of the set membership score of the condition (or combination of conditions) OR the outcome variable, for each case Sum of the set membership scores of the outcome variable for each case
A coverage value of “1” would indicate that all cases with a particular condition present also exhibited high performance on the outcome of interest.