using public foodgrain stocks to enhance...
TRANSCRIPT

USING PUBLIC FOODGRAIN STOCKS TO ENHANCE FOOD SECURITY
Economic and Sector Work
July 2012 Report No. 71280-GLB

ECONOMIC SECTOR WORK
USING PUBLIC FOODGRAIN STOCKS TO ENHANCE FOOD SECURITY
July, 2012
Report Number 71280-GLB
i
© 2012 The International Bank for Reconstruction and Development / The World Bank
1818 H Street, NW
Washington, DC 20433
Telephone 202-473-1000
Internet www.worldbank.org/ard
All rights reserved:
This volume is a product of the staff of the International Bank for Reconstruction and Development/The World Bank, the Natural Resources Institute, United Kingdom, and the Food and Agriculture Organization of the United Nations (FAO). The findings, interpretations, and conclusions expressed in this paper do not necessarily reflect the views of the executive directors of The World Bank or the governments they represent.
The World Bank does not guarantee the accuracy of the data included in this work. The boundaries, colors, denominations, and other information shown on any map in this work do not imply any judgment on the part of The World Bank concerning the legal status of any territory or the endorsement or acceptance of such boundaries.
Rights and Permission
The material in this work is subject to copyright. Because The World Bank encourages dissemination of its knowledge, this work may be reproduced, in whole or in part, for noncommercial purposes as long as full attribution to this work is given.
Any queries on rights and licenses, including subsidiary rights, should be addressed to the Office of the Publisher, The World Bank, 1818 H Street NW, Washington, DC 20433, USA; fax: 202-522-2422; e-mail: [email protected].

ii
CONTENTS
ACRONYMS AND ABBREVATIONS ...................................................................................................... v
ACKNOWLEDGMENTS ........................................................................................................................... vi
EXECUTIVE SUMMARY ........................................................................................................................ vii
1. RENEWED ATTENTION TO FOODGRAIN STOCKS .................................................................... 1
2. HOW CAN PUBLIC STOCKS IMPROVE FOOD SECURITY? ....................................................... 5
3. EMPIRICAL EVIDENCE ON USING STOCKS FOR PRICE STABILIZATION .......................... 16
4. EMPIRICAL EVIDENCE ON FOOD EMERGENCY AND SAFETY NET STOCKS ................... 35
5. HOW REGIONAL FOODGRAIN RESERVES CAN HELP ............................................................ 41
6. RECOMMENDATIONS FOR MANAGING PUBLIC FOODGRAIN STOCKS ............................ 44
7. REFERENCES ................................................................................................................................... 48

iii
FIGURES Figure 1: Low inventory periods signal the potential for more volatile prices: U.S. real wheat prices, Jan 1990 - Aug 2009 ........................................................................................................................................... 2
Figure 2: Ending stocks of cereals declined in developed countries while rising in developing countries .. 3
Figure 3: Average annual program costs go up with more aggressive replenishment in MNA ................. 20
Figure 4: Wheat supply chain costs in MNA countries in 2009 were much higher than in benchmark countries (Netherlands and South Korea) ................................................................................................... 21
Figure 5: The rising gap between the Philippines’ NFA revenues and expenses ....................................... 22
Figure 6: Maize prices in Kenya and Zambia are typically well above prices in South Africa (the major exporter of white maize in the region) ........................................................................................................ 23
Figure 7: Rice prices in the Philippines and Indonesia are kept above international reference prices ....... 24
Figure 8: A large export/import parity price gap may lead to high local price volatility: the example of wheat in Addis Ababa ................................................................................................................................. 29
Figure 9: Rice prices are less volatile in Asian countries that use buffer stocks ........................................ 31
Figure 10: Farm-gate rice prices in the Philippines are volatile despite stable consumer prices ................ 32
Figure 11: Rice prices in Bangladesh have closely followed international reference prices ...................... 39
TABLES Table 1: Projects with cash transfers are more consistent in achieving objectives than those with in-kind transfers ....................................................................................................................................................... 13
Table 2: Public spending on stocks has often been larger than on agriculture and research ...................... 19
Table 3: Smaller reserves are cheaper and sufficient to achieve price stability .......................................... 19
Table 4: A breakdown of the total fiscal costs of managing maize stocks in Zambia is revealing ............. 21
Table 5: Food accounts for a large share of the CPI in developing countries ............................................. 25
Table 6: Rice marketing costs in Philippines are much higher than in Thailand, reducing the benefits to farmers of high consumer prices ................................................................................................................. 26
Table 7: Farmers tend to receive a higher share of the wholesale rice price in countries with lower consumer prices .......................................................................................................................................... 27
Table 8: Volatility of maize prices in selected SSA countries, Jan. 2005-May 2011 ................................. 28
Table 9: Maize price volatility is higher in African countries with high market interventions .................. 30
Table 10: Price volatilityversus predictability in selected SSA countries, 1994-2008 ............................... 30
Table 11: Stocks and market prices vary in Ethiopia under different rotation scenarios ............................ 34
Table 12: ESFRA stock age and storage costs, 2005-2008 ........................................................................ 36
Table 13: Food grain stocks, procurement, and policy in selected countries of South Asia ....................... 39
Table 14: All international agreements to stabilize commodity prices have failed .................................... 41

iv
BOXES Box 1: Empirical Estimates of Gains from Food Price Stabilization ............................................................ 8
Box 2: High Costs of Universal Food Transfer Programs .......................................................................... 38

v
ACRONYMS AND ABBREVATIONS
ASEAN Association of South-East Asian Nations APTERR ASEAN Plus Three Emergency Rice Reserve BULOG Badan Urusan Logistik, Indonesia CPI Consumer Price Index ECOWAS Economic Community of West African Countries EFSRA Emergency Food Security Reserve Administration, Ethiopia ESW Economic Sector Work EU The European Union FAO The United Nations Food and Agriculture Organization GDP Gross Domestic Product FRA Food Reserve Agency, Zambia GIEWS Global Information and Early Warning System of the FAO IFPRI International Food Policy Research Institute MNA Middle East and North Africa MPS Minimum Producer Price, India NCPB National Cereals and Produce Board, Kenya NEPAD New Partnership for Africa’s Development NFA National Food Authority, the Philippines NGO Non-Governmental Organization OECD Organization for Economic Cooperation and Development OP Operasi Pasar, Indonesia PFDS Public Foodgrains Distribution System, Bangladesh PRMC Programme de Restructuration des Marches Cerealiers, Mali PSD Production, Supply, and Disappearance PSNP Productive Safety Net Program, Ethiopia RASKIN Beras untuk Rakyat Miskin, Indonesia SAARC South Asian Association for Regional Cooperation SGR Strategic Grain Reserve, Malawi SSA Sub-Saharan Africa TFP Total Factor Productivity TPDS Targeted Public Distribution System, India USDA U.S. Department of Agriculture $ U.S. Dollar WFP World Food Programme

vi
ACKNOWLEDGMENTS
This report was prepared by the World Bank Agriculture and Rural Development (ARD) Department. The completion of the report was led by Sergiy Zorya, with substantive inputs from Christopher Delgado, Aparajita Goyal, Saswati Bora, Robert Townsend, and Iride Ceccacci. The background studies for Africa were prepared by Nicholas Minot from the International Food Policy Research Institute (IFPRI) and for Asia by Andrew Shepherd, previously with the United Nations Food and Agriculture Organization (FAO) and now a Senior Technical Advisor to the Technical Centre for Agricultural and Rural Cooperation in Wageningen.
This effort has benefited from the experiences and feedback of numerous World Bank staff through the Rural Policies Thematic Group. It also benefited from the shared experiences of participants from the World Bank, FAO and IFPRI at the Seminar “Role of Public Stocks in Food Security in Developing Countries,” organized by the World Bank in Washington, D.C., on December 6, 2011.
Don Larson, Stephen Mink, and Patrick Labaste from the World Bank and Carlo Cafiero from FAO served as peer reviewers. Mark Cackler (Sector Manager, ARD) and Juergen Voegele (Sector Director, ARD) supported the study and ensured that resources were available for its implementation. Amy Gautam and Julie Cannon edited the report, and Kaisa Antikainen provided logistical support.

vii
EXECUTIVE SUMMARY
The recurrent global food price spikes in 2008 and 2010 rekindled interest in the use of national foodgrain stockpiles (“stocks”) to enhance food security. They were a commonly used instrument in government responses to these food prices spikes. They were also widely considered as a useful tool after the 1974 food crisis and its associated food price volatility and supply disruptions. Large stocks became a reality at the global level in the 1980s and 1990s as a side-product of farm income support policies in the developed countries. However large “buffer” or “intervention” stocks, as the grain accumulations in developed countries came to be called, eventually proved to be very costly forms of producer income support and were drawn down for fiscal and other reasons starting in the late 1990s.
This report, prepared for government and development partner practitioners, revisits the issues and evidence concerning grain stocks. It starts with an open mind concerning stocks as policy tools and specifically seeks to avoid the polarization of views that grew up around the topic in the 1980s and 1990s. It takes the form of an evidence-based review of developing country experience.
Historically, grain stocks have been used for two main purposes. First, to stabilize domestic prices and second, to provide readily available emergency food and safety net reserves targeted at the most vulnerable. The assessment of actual experience of using grain stocks for these two purposes is summarized as follows.
Using grain stocks to stabilize domestic prices has generally not been an effective instrument to improve food security outcomes. Developed countries no longer use stocks to stabilize domestic prices due to the unpredictability and often unsustainably high budget costs. In Africa and Asia, where price stabilization programs are still frequently pursued, high fiscal costs are crowding out needed public investment in agricultural productivity and rural infrastructure. The often unpredictable grain purchases and releases of stabilization programs are discouraging private investment in both grain production and storage, which are the key to lowering both the level and volatility of food prices.
Using grain stocks to provide readily available emergency food reserves targeted to the most vulnerable has proven to be a more effective instrument to improve food security outcomes. This is especially the case where stocks schemes have been part of a more comprehensive safety net approach with considerable effort at targeting the poor and vulnerable (as in Bangladesh, Ethiopia, and Mali). Continued price transmission of higher prices to producers provides the incentive to increased domestic food supply that can subsequently help lower domestic food prices. Effective targeting provides emergency food to the most vulnerable, which is more cost-efficient than universal food distribution programs and has less negative impacts on producer prices and incentives for private storage. Effective early warning systems; compliance with rules and procedures; maintaining small reserves; good management and flexibility; and collaboration between donors, relief agencies, and government authorities all help minimize budget outlays, market distortions, and mis-targeting of beneficiaries.
A similar distinction between price stabilization and safety net backup applies to regional (multi-country) reserves, compared to national reserves. Price stabilization schemes through international agricultural commodity agreements have not been an effective instrument to stabilize prices. While small regional reserves for humanitarian purposes aimed at

viii
complementing national safety net programs, in theory, could be effective, in fact there are no working examples despite several attempts to set these up over the last 40 years. Regional reserves have required stock provision from multiple countries, and stocks releases to multiple countries. Coordination challenges and trust issues across national borders have complicated implementation. Strong ownership of participating countries and implementable arrangements are the likely key to success of regional reserve programs. Furthermore, improvements in communications, financial, and transportation technologies, and in regional integration efforts, may make regional options more feasible in the future.
In sum, the evidence suggests that public grain stocks can play a limited but important complementary role in improving food security, complementing a broader non-stock strategy that addresses both the resiliency of rural livelihoods and the functionality of overall safety nets. Public grain stocks as a food security intervention is most effective in the short term, especially for bridging the time needed to import food and targeting support to helping ensure the most vulnerable have food to eat in times of market shocks.
If used, public grain stocks need to be incorporated into a coherent longer-term strategy that combines the use of trade, investments in agricultural productivity, and well-managed, targeted safety net programs. Design details will vary from country to country, with stocks having a larger role in net food importing countries. A comprehensive strategy, not public stocks per se, is necessary to succeed in stabilizing domestic food prices in a way that induces agricultural growth and accelerates poverty alleviation.

1
1. RENEWED ATTENTION TO FOODGRAIN STOCKS
1 The purpose of this report is to analyze when and how public foodgrain stocks can be used to enhance food security. The concern is for food vulnerable poor people, who are at risk of becoming malnourished as a result of various shocks, such as the global food price spikes in 2007/08 and 2010/111. In the long term, what matters most for these people is their income growth, since the share of food expenditures declines as incomes grow, with the consequence that food price volatility does not present as much of a threat. Improved agricultural productivity, induced by good agricultural policy and investments in public goods, has been a driving force in increasing farm incomes, making food available at affordable prices and reducing poverty. However, further productivity gains will be needed in the future to keep pace with population and income growth and to overcome evolving supply constraints, evidenced by more expensive food since 2007 (World Bank, 2012b). In the short- to medium-term, however, public foodgrain stocks can be used as one of several policy instruments to protect vulnerable people from food price spikes. They warrant a separate review as there is a lack of clarity about when these stocks are useful and how they relate to alternative instruments and to long-run objectives of food security.
2 The discussion on the drivers of the recent increase in global food price volatility has brought renewed attention to foodgrain stocks. Stocks have played an important role in this discussion (G20, 2011; World Bank, 2012b), similarly to the situation after the 1974 food crisis and its associated food price volatility and supply disruptions when they were also widely considered as a useful tool. The focus has been on the low level of stocks. The global ending-stocks-to-use ratio2 for coarse cereals, for example, dropped from 18.6 percent in 2005/06 to 14.7 percent in 2010/11, according to the World Agricultural Supply and Demand Estimates of the U.S. Department of Agriculture (2012). This ratio is projected to decline further to 13.8 percent in 2011/12. The major exporters’ stocks to disappearance ratio3 experienced an even bigger decline, dropping from 19.1 percent in 2005/06 to 10.2 percent in 2010/11, and is projected to go down to 8.1 percent in 2011/12 (USDA, 2012).
3 Lower global stocks have made it harder to moderate the impact of global production shortfalls on prices given that short-term food demand is inelastic. Using the example of wheat prices in the U.S., which are the reference world market prices, Figure 1 shows that when the stocks-to-use ratio is below 15-20 percent, a 5 percent supply shortfall leads to a much larger price spike than when initial stocks are higher. In general, when global stocks fall to low levels the likelihood of price spike increases and food prices become highly linked to 1 This Report uses the definition of food security as spelled out in The State of Food Insecurity in the World 2001: “food security is a situation that exists when all people, at all times, have physical, social and economic access to sufficient, safe and nutritious food that meets their dietary needs and food preferences for an active and healthy life”, but focuses on food security of the most vulnerable poor individuals. Compared to households with more assets, poor households have fewer options for diversifying their production activities and must spend a larger share of their income on food. Large and sudden food price spikes are difficult for these households to adjust to, eroding their purchasing power, causing them to reduce their intake of calories and micronutrients, and pushing them further into poverty and hunger. 2 The ending-stocks-to-use ratio is estimated as ending stocks to domestic consumption. 3 This index is estimated as ending stocks of major exporters to their domestic consumption and exports (disappearance). These are stocks held by major exporting countries, mainly by private sector that can be quickly made available to respond to new demands.

2
information on stocks, especially to supply and demand disturbances that reduce the ending-stocks-to-use rate further (Prakash, 2011). Wright (2011) calls food price volatility a symptom of a structural problem of low stocks; i.e., "when supplies get to certain low levels the prices become vulnerable to volatility."
Figure 1: Low inventory periods signal the potential for more volatile prices: U.S. real wheat prices, Jan 1990 - Aug 2009
Source: Cafiero and Schmidhuber (2011), based on the storage model developed by Brian Wright.
4 The recent decline in global stocks occurred mainly due to stock reduction in developed countries (Figure 2). Total ending stocks in these countries decreased from 130 million tons in 2005/06 to 91 million tons in 2011/12, a continuation of the trend that began in early 1990s when the Organization for Economic Cooperation and Development (OECD) countries reformed their agricultural policies in order to comply with the Uruguay Round of the World Trade Organization but also to make them less costly to taxpayers and less distortive to the economy. Public stocks, which were often a side-product of farm support policies, were also reformed in this process and in most cases were abolished (Mercier and von Cramon-Taubadel, 2012). The mountains of butter and grains in the European Union (EU), butter and cheese in the U.S., and wool in Australia, the result of price stabilization schemes, were no longer maintained. Total ending stocks of cereals in developed countries were more than halved, from 224 million tons in 1986/87 to about 100 million tons during the 1990s (Figure 2).
5 Most stocks in OECD countries are now held by farmers, traders, and processors. In spite of recent concerns about low global stocks, ongoing discussions of the new U.S. Farm Bill and the EU’s Common Agricultural Policy do not indicate that these countries will return to subsidization of public stockholding and price intervention policies such as those of the 1970s and 1980s (Mercier and von Cramon-Taubadel, 2012). Thus, their stocks will remain relatively low.
6 Stocks in developing countries in contrast have been growing, particularly since the first global food price spike in 2008. Total stocks in developing countries as a group grew from 228 million tons in 2006/07 to 328 million tons in 2010/11 (up by 42 percent), and are projected

3
to increase further to 343 million tons in 2011/12 (up by 51 percent compared to 2006/07), according to the USDA. Grain stocks increased not only in China and India, the traditional holders of large public inventories, but also in other developing countries of Asia, Africa, and the Middle East (Figure 2). While there are no consistent data on private versus public stocks worldwide,4 country-level market reviews and studies indicate an increase in public stocks particularly.
Figure 2: Ending stocks of cereals declined in developed countries while rising in developing countries
Source: USDA PSD Online. Note: Cereals include maize, rice, and wheat. Developed countries include Australia, Canada, EU-27, Japan, New Zealand, Norway, South Korea, Switzerland, and the U.S.
7 Many developing countries intend to continue increasing their public stockholding. Countries in the Middle East and North Africa (MNA), for example, plan to double their wheat reserves from the current six months of domestic consumption to about twelve months (World Bank and FAO, 2012). Ethiopia is considering expanding its food security stocks from 407,000 tons to 1,500,000 tons (Rashid and Lemma, 2011), while Malawi intends to increase its stock size from 60,000 tons to more than 100,000 tons (Faruqee, 2009). India’s export bans in 2007 and 2008 have stimulated discussions in Bangladesh about increasing its rice stock level from 650,000 tons to 3,000,000 tons, essentially moving away from emergency and safety net assistance to price stabilization policies abandoned by the authorities in the 1990s (Rashid, 2011). Increases in regional reserves are also being considered. The Association of South-East Asian Nations (ASEAN) has been active in strengthening its Regional Rice Reserves (ASEAN Plus Three), while the Economic Community of West African Countries (ECOWAS), with the support of the World Food Programme (WFP), has been working to establish regional grain reserves for humanitarian purposes in West Africa.
8 The desire of some developing countries to use stocks to protect them against higher food price volatility is understandable. Episodes of extreme price volatility are a major threat to food security in these countries. When unpredictable, food prices undermine incentives for farmers to respond to high price levels with the critical increase in production needed to bring
4 One of the tasks of the recently-established Agricultural Market Information System (a global partnership between international organizations, including the World Bank, and the members of the G20 plus other large producing and consuming countries) is to get better data on public stocks. To obtain more information on AMIS, go to www.amis-outlook.org.

4
food prices back down. In practical terms, farmers deciding what to plant and countries deciding when to import face less certainty in the likely distribution of world food prices and perhaps greater consequences from using past price levels and distributions to guide current decisions. This uncertainty keeps food prices at high levels for a longer period, leading to fundamental food security risks for consumers and governments.
9 However, there is a lack of clarity about the role that stocks can play at the global level and what they can do at the national level. At the global level, periods of low global ending-stock-to-use ratios signal the higher likelihood for more volatile food prices. Higher stock levels available for release in large exporting countries can help reduce global price volatility. But most developing countries are price takers; while they need to worry about global prices, they also need plans to deal with high and volatile domestic prices. At the national level, public stocks can be useful in the short run. They can help mitigate the impact on prices of production shortfalls or global price spikes transmitted to domestic markets. They can be released onto domestic markets until imports arrive. Many countries, for example, released stocks onto the market as a response to the recent global food price spikes.5 But accumulating more public stocks alone does not guarantee more stable prices and food security in general.
10 The important question is how to make sure public stocks present a solution to food security problems. A key element to consider is the purpose of the stock. There are many cases where public stocks have failed to achieve their stated objectives and continue to place large costs on taxpayers and the economy (World Bank, 2006). The public stockholding policies in OECD countries were reformed because their high costs outweighed the benefits created by more stable prices. Less predictable global food prices now may provide a greater rationale for public stocks, but as in the past, their success will depend on many factors, including the objectives for holding stocks, their management, costs, targeting, enabling policy framework, and complementary public investments.
11 Although client demand for advice in this area is growing, the supply of accessible materials useful for advisory purposes is low and, in many cases, out of date. This report reviews lessons learned from around the world, focusing on successes achieved and mistakes made. It attempts to identify the kinds of public foodgrain stock programs that work and those that do not. Based on this review, the report makes recommendations on how to increase the impact of public stocks on food security.
12 The report is structured as follows. Chapter 2 discusses economic and social gains from using public stocks and how they have to be managed to ensure achievement of these gains. Chapter 3 presents empirical evidence on the results of price stabilization through the use of public stocks and explains why benefits rarely exceed costs. Chapter 4 presents empirical evidence on when public stocks produce the most benefits, which is mainly when they respond to food emergency situations and reach out to food vulnerable groups of the population without distorting economic incentives. Chapter 5 discusses how regional reserves can complement national programs. Chapter 6 summarizes good practice responses to maximize the use of public stocks to enhance food security.
5 The release of public stocks was one of the most frequent responses to the global price spikes in 2008 and 2010. Thirty-five out of 81 developing countries, mainly in Asia and Africa, released grain stocks at subsidized prices to protect poor consumers during that period (Demeke et al., 2008), yet, there has been no consistent assessment of the costs and benefits of these interventions.

5
2. HOW CAN PUBLIC STOCKS IMPROVE FOOD SECURITY?
13 There is general agreement that highly volatile and thus uncertain food prices and temporary problems with access to affordable food can impose significant economic and social costs on society. Potential costs can be broken down into: (i) economic inefficiency costs; and (ii) negative distributional outcomes (Newbery and Stiglitz, 1981). Public stocks can help reduce these costs. When credit, insurance, and forward markets are incomplete, as is the case in most low income developing countries, public stocks can add to private stocks, making food prices less sensitive to short-term shocks. They can also provide assistance during food emergencies or be part of social assistance programs for impoverished people.
14 Public stocks can help mitigate a number of risks faced by food vulnerable people, but alternatives should also be considered. As a group, the food vulnerable are at risk of: (i) global food price shocks; (ii) local supply shocks (failed harvests); (iii) income shocks (e.g., economic downturns, exchange rate shocks); and (iv) disruptions of domestic and international trade (e.g., export bans imposed by other countries, natural calamities, or logistical trade problems). The composition of aggregate risk will vary from country to country, but most vulnerable households face more than one type of risk. In turn, the relevance of public stocks in each country depends on the composition of risks prevalent and whether alternative policy instruments are available to address them. For example, food deliveries from public stocks can help when harvests fail, but investing in trade corridors or reducing regional trade restrictions can also be effective; cash transfers often work better than food transfers in the face of economic crises. These alternatives and their trade-offs are considered in the report.
15 This report analyzes three categories of public foodgrain stocks that can help address some of the above-mentioned risks. The first category is “buffer stocks,” which can help achieve efficiency gains through more stable short-term food prices. The second category is “emergency stocks,” kept as a precaution against food emergencies to improve distributional outcomes. Finally, “food safety net stocks” can be held to strengthen social assistance for the impoverished and thus can also improve distributional outcomes.
A. Efficiency gains from price stabilization
Objectives of buffer stocks
16 More stable prices can produce a number of efficiency gains.6 Stable prices can help farmers accelerate their supply response, for example through better access to finance, greater use of purchased inputs, and ultimately increased investments (World Bank, 2006; Dawe, 2009). They can encourage cereal producing farmers to diversify their cropping patterns to high-value crops if they could buy cereals for consumption at more predictable prices. Stable prices may also allow consumers to diversify their diets and increase their intake of proteins, vitamins, and minerals, crucial for reducing malnutrition (Timmer, 2004).
6 Stable prices do not mean fixed prices. Full price stabilization for agricultural products is neither achievable nor desirable. Seasonal and spatial price movements are natural for agriculture, as they are the key to fostering arbitrage and underlining storage and trade decisions. The concern is uncertain price movements, which are difficult to predict and very disruptive for economic decisions.

6
17 In addition, price stabilization can generate economy-wide gains. An accelerated supply response would bring the level of foodgrain prices down. In return, low foodgrain prices effectively increase real wages for employees without increasing nominal wages paid in the industrial and service sectors. In conjunction with other factors, this combination of low nominal wages and high real wages stimulates job creation and economic growth necessary for sustainable poverty alleviation. On the other hand, uncertain prices slow down farmers’ supply response, leading to longer periods of lower production and higher foodgrain prices. When food prices are rising, workers need higher wages to keep real incomes from falling as they pay for more expensive food (Timmer, 2004). As higher nominal wages discourage investments, the end result is often a slowdown in the productivity growth essential for food security and poverty alleviation.
18 The ultimate objective of public stockholding is not price stability per se, but the economic gains achieved by it. In other words, attaining more stable prices through buffer stocks does not automatically guarantee positive outcomes for growth and poverty alleviation, and how price stabilization is achieved can determine the quality of agricultural growth and eventually food security. Public stocks are most effective at mitigating short-term price fluctuations, not influencing longer-term prices. When stocks are used to stabilize longer-term prices at an artificially high level (above the export parity price for net exporters, or above the import parity price for net importers), the long-term agricultural growth may be either unachievable or of low quality, e.g., attributable more to higher use of inputs rather than to a greater efficiency of input use or a better mix of agricultural outputs, i.e. growth in total factor productivity (TFP). Without a continuous increase in output prices to match the rising input prices on international markets,7 such growth is usually short-lived, while the burden on the budget, the economy, and poor consumers is enormous. On the other hand, if public stocks seek to smooth out short-term fluctuations but permit domestic prices to follow the world market trend, agricultural growth will be driven by (i) higher efficiency of input use, and (ii) shifts from production of lower-value outputs to higher-value outputs, resulting in higher farm incomes and a continued supply response (Fuglie, 2009). In this case, public stocks would make a positive contribution to food security and poverty alleviation.
19 Efficiency gains from price stabilization also hinge on fiscal costs. Maintaining stocks is expensive, especially in countries with high interest rates, posing a recurrent expense on national budgets. Costs tend to be higher when multiple and unclear objectives are pursued, particularly when buffer stocks are used to support farmers and consumers at the same time. Poor targeting of food transfers also increases costs. Large fiscal costs can crowd out spending on other public goods, especially in poor countries, thus impairing their long-term economic growth. The mere existence of stocks and relatively stable prices does not necessarily induce long-term agricultural growth if the fiscal costs of keeping public stocks are high.
20 Achievement of efficiency gains also depends on whether the private sector is crowded in or out by a price stabilization program. Buffer stocks can distort markets because of their impact on prices. Stock programs are often combined with insulating trade policies, 7 Although there is considerable uncertainty about future energy prices, there is little doubt that energy prices will be higher than in the past twenty years and that this will increase agricultural production costs, requiring a continuous increase in output prices to maintain constant terms of trade for farmers. On the other hand, higher energy prices will also increase demand for agricultural commodities to produce biofuels, pushing output prices up. The net result will depend on commodity- and country-specific circumstances.

7
which together may better achieve price stabilization outcomes (as shown by Gouel and Jean (2012) in a study for small developing countries), but may also crowd out the private sector domestically and even internationally due to collective action problems.8 Even without a direct monopoly on trade, buffer stock programs can eliminate incentives for private sector engagement in profitable trade and storage activities when they aim either to smooth out seasonal fluctuations or eliminate pan-territorial price differences. Such programs discourage private investment in trade logistics and private storage, increasing the need for public sector to fill the gap. If the private sector is eventually crowded out of grain supply chains, long-term TFP growth is much more costly and difficult to achieve, and public outlays quickly escalate.
21 Thus, foodgrain price stabilization programs need to be carefully designed to support long-term agricultural growth by reducing short-term price volatility without distorting long-term prices. Even when stabilization programs are designed well, empirical studies have found that efficiency gains from price stabilization tend to be small (Box 1), pointing to the limitations of achieving short-term price stability without complementary investments in raising agricultural productivity. Investments in agricultural research, extension, irrigation, sustainable land management, rural infrastructure, and other programs are needed to influence the rate of agricultural TFP growth (WDR, 2007; World Bank, 2012b). Keeping budget allocations to buffer stocks under control will create fiscal space for these long-term investments, while the increase in agricultural TFP will not only permit farmers to remain profitable at lower food prices, but will also speed up structural transformation and poverty alleviation.
22 Some policy alternatives to buffer stocks can achieve similar outcomes and they need to be considered before investing in stoking programs. Investments in regional trade corridors and elimination of trade restrictions can facilitate the flow of food from surplus to deficit areas, reducing short-term food price volatility. Simulations of the impact of maize production shortfalls on food prices in Southern Africa, conducted by the World Bank (2008), illustrate that a 30 percent production shortfall would increase maize prices in Zambia by 163 percent without cross-border trade; but when cross-border trade is permitted, local prices would increase only by 36 percent. In Malawi, a 20 percent production shortfall would result in maize prices spiking up by 62 percent when trade with northern Mozambique is banned, and by 27 percent when cross-border trade takes place. Thus, the effects of alternative or complementary policies should be considered before making investments in buffer stocks.
8 A collective action problem occurs when trade measures used to stabilize domestic prices are ineffective when used by all countries at the same time, as this magnifies the international price instability associated with exogenous shocks to food markets. This happened in 2008, when insulating trade policies used simultaneously by many countries resulted in a 45 percent increase in international rice prices and a 30 percent increase in international wheat prices (Martin and Anderson, (2011)).

8
How to achieve the objectives?
23 Different strategies for managing stocks have differential impacts on resource allocation, investment, and consumption, and thus on efficiency gains. The transparent management of buffer stocks is a challenging task. The use of buffer stocks is often a political issue, making them a risky investment in terms of their potential to generate economic benefits. Transparency and the predictability of operational decisions regarding buffer stocks are therefore essential. Operational and technical decisions include, but are not limited to: which mechanisms to use to monitor market conditions; the size and composition of stocks; the locations of warehouses and buying stations; the price band for buying and selling; procurement and distribution rules; the rotation schedule; communication strategies; and how to finance the
Box 1: Empirical Estimates of Gains from Food Price Stabilization Most studies have concluded that the efficiency gains from agricultural commodity price stabilization are generally quite small when measured as a proportion of household incomes. They have also concluded that the gains are higher: (i) for risk-averse households; (ii) for large net sellers; (iii) when stabilizing prices of staple crops that tend to be more volatile than export crops; (iv) when stabilizing a bundle of multiple products rather than a single commodity; and (v) in countries where foodgrains account for a large share of gross domestic product and consumers’ spending. The first estimate of stabilization gains was undertaken by Newbery and Stiglitz (1981) who found the gains to farmers from complete price stabilization to range from 0 to 3 percent of household income, depending on assumptions of risk aversion. Srinivasan and Jha (2001) made similar estimates for the Indian economy as did Islam and Thomas (1996) for five Asian economies, and also found that the static gains to price stabilization were quite small, at about 1.5-3.5 percent of farm income. More recently, Myers (2006) applied the same model but distinguished between poor and affluent producers. Depending on the risk aversion of each group, affluent producers were estimated to gain the most from more stable prices (adding 9 percent to their income), while poor producers gained less (3 percent) because their sales were a smaller share of income. Bellemare et al. (2011) analyzed the impact of price stabilization in a multi-commodity framework in Ethiopia and found that larger farmers who have big surpluses can gain from 6 to 32 percent of household income from the stabilization of prices of seven commodities, depending on risk aversion assumptions and whether they produce coffee. At the same time, smaller poorer farmers and consumers gain little and even lose. While the multi-commodity integrated framework is superior to one-commodity estimates, it is difficult to imagine full price stabilization of one or two staple crops, much less seven of them. Investment in rural infrastructure to reduce the gap between export and import parity prices and promotion of trade is a necessary and more efficient way to achieve multiple crop price stabilizations, not public stocks. The vast majority of quantitative estimates of price stabilization have focused on export crops that typically comprise a very small proportion of domestic consumer expenditures, such as coffee, cocoa, cotton, jute, rubber, and wool. Studies of food crops are rare, though gains from the price stabilization of these crops are expected to be higher, given their higher price volatility, particularly in Africa, and their high share in household expenditures (World Bank, 2006). It is important to note that the economic gains of stabilization are diminishing as foodgrains become a smaller proportion of value added in developing economies and as a share of household expenditures. An econometric assessment of the 25-year period from 1970 to 1995 in Indonesia showed that rice price stabilization efforts paid very high dividends in fostering economic growth in the first two five-year plans, apart from the additional benefit provided by enhanced political stability (Timmer, 1996; 2004). By the mid-1990s, however, as the share of rice in value added and the consumption basket declined, benefits from market interventions diminished, requiring a much more market-oriented rice policy in Indonesia to bring about new efficiency gains.

9
reserve.9 All of these are important ingredients if buffer stocks are to achieve their stated objectives in a cost-efficient manner; some of them are discussed here.
24 The institutional framework for managing stocks matters. Public stocks should be managed with a level of autonomy similar to that of central banks, within a framework of clear and well-defined objectives and implementation arrangements. There is no need to build a bureaucracy around technical decisions. Clear triggers for market interventions and stock releases should be used to avoid market disruptions and politicization of stock management. Staff with skills appropriate for managing stocks and keeping accurate records of stock movements should be mobilized or recruited. An incentive structure to retain them and ensure a high standard of performance should be adopted10.
25 An important technical dimension of buffer stock rules is the price band for buying and selling stocks. Not all stocking programs use predetermined price bands for market decisions, but when they do, it is important to consider the following implications:
a. A price band set to match the gap between export and import parity prices, which is often quite wide in the poorer developing countries, would limit purchases or sales to cases of serious shortages or large surpluses. Most importantly, it would require little or no government intervention if the price parities are allowed to pass-through to markets. The role of stocks in such a case is primarily to hedge against the time it takes importers to import or exporters to export grain. Cost and storage requirements would be relatively small, and the degree of price stabilization beyond that provided by international trade would also be modest. Stocks in this case would basically speed up the influence of trade on domestic prices by filling any gap from the time it takes to move grain internationally. Such a band would also likely leave seasonal cycles largely unaffected, permitting the private sector to participate profitably in storage and trade within a wide range of prices.
b. A narrower price band at best would require costly large annual purchases during the harvest season when prices are lowest and large annual sales during the off-season when prices are highest. This approach would reduce both inter-annual and seasonal fluctuations in food prices, making seasonal storage of grain less profitable; the private sector would likely withdraw from seasonal storage, necessitating greater public storage to maintain a given level of total storage. If the price ceiling is set too low, the buffer stock will be sold more often than bought, so that eventually public stocks would be exhausted, making it impossible to impose price ceiling (Wright, 2009).
c. At the extreme, all price instability could be eliminated by setting the buying and selling prices arbitrarily close to each other. This would almost certainly be infeasible from both the cost and management points of view, as the buffer stock would be forced to purchase or sell a large share of annual production. Furthermore, complete stabilization is undesirable from an economic point of view, because seasonal and spatial price variations help farmers and consumers respond to surpluses and deficits, thus bringing the market to equilibrium.
9 Lynton-Evans (1997) provides good operational guidance on the establishment of strategic grain reserves in the context of Sub-Saharan Africa. 10 See more details in Minot (2011), a background paper prepared for this report.

10
26 The level at which the price band is set matters a lot. If a price floor is set artificially high (e.g., above the import parity level), farmers will gain in the short run but lose in the long run, especially if little is done to raise productivity and reduce production costs. Consumers will lose in any case, as they will pay higher prices, compromising their food security. If a price floor is set artificially low (e.g., below the export parity level), farmers will under-produce thereby providing consumers with less food. Artificially lowering food prices requires huge subsidies and has rarely been successful over the long run. The deadweight losses from enforcing large deviations between domestic and reference world market prices increase with the square of the deviation, so large deviations hurt more than small ones (Timmer, 2004; Dawe, 2009). At a minimum, if prices are stabilized through buffer stocks, it is essential to maintain long-term domestic prices along international market trends. Even so, history suggests that the effort will not be sustainable over time (see Section 3).
27 Another important dimension of buffer stock management is the rules of replenishment. When stocks are replenished through open tenders, all market players can participate and benefit from this additional sale channel. Open tenders also offer an opportunity to procure grain at competitive market prices, reducing the cost to the treasury and permitting the private sector to operate profitably. In contrast, if all buying and selling depots use the same administratively determined pan-territorial price, the incentives for private traders to move grain from one location to another will be reduced or eliminated. Depots in surplus zones will pay above-market prices and will be forced to purchase the entire surplus. Meanwhile, in deficit zones, depots will sell at below-market prices, and will be forced to supply large quantities of grain. The buffer stock will essentially become a grain marketing parastatal, responsible for all grain transport from surplus to deficit zones. Furthermore, this transport will be done at a loss, as the price difference will be less than the cost of transportation.
28 The number of buying and selling depots throughout the country affects costs. If the buffer stock has just one buying and selling depot, the effectiveness of the price stabilization will decline with distance from the depot. More specifically, the effective price floor will decline with distance from the depot at a rate determined by the cost of transportation, while the effective price ceiling will rise with distance from the depot at the same rate. A large number of buying and selling depots will provide price stabilization to a larger share of the population, but at a higher cost.
29 The mechanism for the release of grains is also important. The release mechanism needs to be designed carefully to ensure that the impact on prices is substantial and that the quantities released are adequate. Just having public stocks does not guarantee that they will be released when food prices are high; in other words, public stocks can often be illiquid. In some cases, releases are late due to political decision-making processes or non-compliance with the release rules; in others, the release mechanism is designed such that grains cannot be disbursed quickly enough to affect prices, as when grain is sold to a small number of millers or traders, or when too little stock is released.

11
B. Distributional gains
Objectives of emergency and food safety net stocks
30 The poor are the most vulnerable to food price instability. Compared to households with more assets, poor households have fewer options for diversifying their production activities and must spend a larger share of their income on food. Large and sudden food price spikes are difficult for these households to adjust to, eroding their purchasing power, causing them to reduce their intake of calories and micronutrients, and pushing them further into poverty and hunger (GMR, 2012). Supporting these people with more affordable food is an important public policy task.
31 Public foodgrain stocks are one option for helping the poor at times of food insecurity. Support via stocks can be provided with or without affecting food prices. As discussed in the previous Section A, setting prices artificially low to redistribute income from producers to consumers is not a fiscally and economically feasible strategy. When prices are low, producers tend to produce less, making it very expensive to keep prices low in the long run. Stabilizing food prices at a high level, the most frequent outcome of existing price stabilization schemes (see Chapter 3), explicitly taxes the poor net consumers, and thus cannot be considered a good social policy unless in rare cases when most of the poor net consumers are also net producers of food11. The smartest way to achieve distributional outcomes is to have cost-efficient transfer programs that are food- or cash-based, depending on circumstances, and that target the neediest groups of the population, without distorting food prices.
32 Well-targeted reserves can offer a real alternative to export bans. Reserves can be used to protect the poor while allowing price signals to be transmitted to producers. In contrast, export bans and other trade restrictions are a blunt subsidy to consumers, both poor and rich, at the expense of many poor farmers. Farmers forego the opportunity to benefit from higher output prices when export restrictions are put in place, which in turn slows down their supply response. Small reserves targeted to the poor are a much better solution in times of crises.
33 Public stocks designed as a precaution against food emergencies (i.e., as emergency reserves) are intended to provide a first line of defense. In designing emergency reserves, governments have to consider the kind of disasters they are likely to face and whether food transfers are the best option to help the poor. In Sub-Saharan Africa (SSA), for example, food emergencies typically result from drought, although floods have also become more common. Droughts cause enormous damage, but can be anticipated, giving governments time to look for alternatives to cover shortfalls (Lynton-Evans, 1997; NEPAD, 2004; Murphy, 2009). The lead time allows governments to make a reasonable estimate of how much additional food might be needed, providing a basis for decisions regarding the size of the reserve, and allowing planning officials to better manage costs. Delivery of food transfers can be outsourced to the private sector, including non-governmental organizations (NGOs). Since grain reserves are expensive, it is not cost-effective to hold stocks that are never used. Thus, a variable reserve that adjusts its stocks year-to-year based on updated needs assessments is more effective. Such a system relies on accurate and timely food security information. An emergency reserve system that includes
11 In most countries around the world, including those with low incomes, the number of net poor consumers always exceeds the number of net poor producers (WDR, 2007).

12
these elements is likely to satisfy the preconditions for efficient use of physical reserves (see Chapters 4 and 6).
34 An emergency food reserve is essentially used for humanitarian purposes and is therefore liable to incur financial losses. As such, governments must be prepared to provide the necessary financial support to enable reserves to sustain their activities. Accuracy and timeliness of information on market developments, on the one hand, and on vulnerable population for better and quick targeting during emergencies, on the other, are important to adjust stock size to the real needs and contain costs as mentioned above. Strong oversight and clear rules and procedures (e.g., operational manuals) can also help minimize costs. But a sustained commitment to finance reserves is absolutely necessary to maintain confidence in ability to provide timely humanitarian response.
35 In addition to responding to emergency situations, public stocks can also help strengthen social assistance to the destitute and impoverished. This type of redistributive reserves is often called food safety net reserves. In many developing countries, a significant portion of the population cannot meet even their most basic needs without help. Safety net reserves can transfer food to food-insecure households and individuals, in parallel with other forms of assistance.
How to achieve the objectives?
36 The first question to be answered is whether a food transfer program is even appropriate compared to cash transfers. Cash transfers have two main benefits over food transfers. First, they are less costly to distribute than physical commodities. And second, household welfare is increased via greater flexibility in allocating resources (i.e., consumer sovereignty). Program designers can take advantage of electronic cash transactions that reduce both costs and the opportunities for corruption; physical control over food is often more expensive and more difficult to audit, so corruption and leakage problems tend to be greater (Alderman, 2011). Multiple levels of physical transfer required for food distribution increase the opportunities for misappropriation, while innovations in cash transfer delivery systems have created more developmental opportunities for participants in social transfer programs, expanding their access to financial services, communications, and more productive livelihoods. Households have better information than policy makers about what they need, and cash payments harness that information more effectively than in-kind transfers. Cash provides households with the flexibility to allocate resources to their most critical needs. Finally, cash transfers may stimulate local economies and provide a multiplier impact with broader benefits than those generated by food transfers (Gentilini, 2007).
37 In most cases, cash transfers appear to be superior in terms of efficient achievement of objectives to any in-kind transfers in safety net programs. The Independent Evaluation Group’s review of 71 safety net projects supported by the World Bank found that projects that supported conditional cash transfers achieved their objectives more consistently than projects that supported other safety net instruments (Table 1). Projects supporting in-kind transfers, including food transfers, were among the lowest performing program type.

13
Table 1: Projects with cash transfers are more consistent in achieving objectives than those with in-kind transfers
Projects supporting safety nets instruments Substantial or higher efficacy rating (%) Conditional cash transfers 77 Education and health subsidies 76 Public work programs 70 Unconditional cash transfers 65 In-kind transfers 54 Energy, water, and housing subsidies 40
Source: IEG (2011).
38 Cash-based safety nets have also become more appealing due to agricultural policy reforms in developed countries. In the past, agricultural policies in the OECD countries created large surpluses of agricultural products that led to high levels of grain stocks. These public stocks were accessible for food aid programs in developing countries, for which the equivalent financial resources for cash-based safety nets would not necessarily have been available. For example, the U.S.’s Food for Peace resources and the EU’s Stabilization of Export Earnings Program made it possible for developing countries to receive physical stocks for emergency/safety net purposes and often allowed domestic sales receipts to finance other development activities. Elimination of the mountains of public stocks as discussed in Chapter 1, combined with donor countries’ changes to related food aid rules,12 has forced developing countries to seek other operating modalities for managing their domestic reserves for emergency/safety net purposes.
39 However, under certain circumstances, food transfers are preferable to cash transfers. In many remote areas, banking systems are not in place, and security risks may be too high to transport and distribute cash safely. In a country faced with severe market failures (caused by conflict, drought, or some other disruption of the market), particularly with respect to food, food transfers bolster food supply, at least in the short run. Particularly under circumstances of food price inflation and severe food shortages, when currency value is eroding rapidly, and there is little available in the market, direct delivery of food can provide an effective emergency response (Sabates-Wheeler and Devereux, 2010; Alderman, 2011). Food transfers are usually more politically acceptable than cash transfers in these cases. Moreover, if the objective is to improve the nutrition and health status of a target group, then direct transfers of fortified and more nutritious food are perhaps more effective than cash transfers.13
40 The effectiveness of food transfers in alleviating poverty depends on how good the program is at both identifying poor households and ensuring that transfers are delivered at low administrative cost. Targeting is the key to covering as many needy as possible and minimizing leakages to the non-poor (Coady et al., 2008; de la Briere, 2011). Designing and implementing a transfer program requires that some budget resources be devoted to these activities, thereby reducing the budget available for program beneficiaries. But allocating
12 Australia, Canada, and the EU have relaxed their domestic food aid procurement rules and moved toward more cash-based programming. More than half of the food aid provided by Australia and Canada is purchased locally by the World Food Programme (WDR, 2007). 13 Food fortification refers to the addition of micronutrients to processed food and is considered to be a valid technology to reduce malnutrition when people cannot consume a balanced diet adequate in every nutrient. Food fortification has a long history in developed countries, e.g., for the successful control of deficiencies in vitamins A and D, iodine, and iron.
14
resources to improving the design and implementation of a transfer program increases the likelihood of reaching the right beneficiaries.
41 Food transfer programs differ in terms of targeting efficiency. Subsidized food distributed through retailers (as is done in India, the Philippines until 2010, and some MNA countries) or directly to beneficiaries through village administrators (as in Indonesia) is rarely an efficient targeting strategy (see Box 2 in Chapter 4 for the empirical evidence). Such programs are characterized by high administrative and overall fiscal costs, and a high degree of leakage (Basu, 2010; Dawe et al., 2011; Shepherd, 2011). Universal food subsidy programs, therefore, should be avoided. The recent move by the Philippines to cease subsidized food distribution and use conditional cash transfers instead seems to be a recognition both of the failure of the subsidized food program in this regard, and of the relative success of targeted cash transfers in other parts of the world, particularly in Latin America.14
42 Other programs ensure better poverty targeting. Supplementary feeding programs, including maternal and child health feeding and school feeding, provide a direct transfer of food to target households or individuals. Their impacts are higher when food is fortified or combined with vitamins to improve nutritional outcomes. Food may be prepared and eaten on site (e.g., in child feeding centers or school programs) or given as a “dry ration” to take home. Even when targeted to individuals (e.g., children and pregnant or lactating mothers), supplementary food is often shared among household members. In the case of on-site feeding, the meal eaten on site may be substituted for a home-prepared meal. Supplementary feeding is often provided conditional on participation in other public services such as primary health care (pre- and post-natal and well-baby care) and education. Food-for-work programs provide wages in the form of food. Because they provide a source of guaranteed employment, they constitute a true safety net, but only households with able-bodied members can benefit. Effective food-for-work programs can build physical infrastructure that contributes to long-term food security (Yemtsov, 2011).
43 Where feasible, national reserves can be complemented by community-level stocks. Community cereal banks have a variety of forms and numerous purposes, including improving the food supply over the agricultural cycle, providing a locally-based, in-kind savings and loan facility, or maintaining a local emergency food stock. Cereal banks became popular in the 1970s, following a series of droughts in Sahelian countries, and are still operating in West Africa, mostly with the support of development agencies. Such projects are worth supporting as they can complement national-level stocks. But attention needs to be paid to their management and sustainability, given their high historical rate of failure (documented by the Catholic Relief Services (1998) and the World Bank et al. (2011)). The most frequent problems with community cereal banks include: (i) high losses when competing with commercial traders due to overestimation of profit margins and underestimation of costs; (ii) high defaults on loans of grain to local community members; (iii) stock management problems, including post-harvest losses; (iv) poor understanding of community ownership; and (v) effectively reaching target beneficiaries. Thus, in the context of emergency relief and safety nets, cereal banks can play an important role supplying food on favorable terms, but they require significant resource investment and continuous support to the communities.
14 Philippines’s Conditional Cash Transfer Program expanded to provide essential support to 2.3 million families (or 4.2 million people) at the end of 2011, from 6,000 households in February 2008.

15
44 With so many good things properly managed and targeted public stocks can do, it is still important to remember that they can help eradicate only some of the negative impacts of price spikes. Given the large number of poor people, and frequent and high price fluctuations in developing countries, raising agricultural productivity and diversifying their income and employment are needed to increase the income of the poor (Krandker et al., 2011). Safety nets and emergency reserves can be viewed as a short-term fix to reduce the severity of food deprivation but the longer-term solution still rests on promoting the income and productivity of the poor.

16
3. EMPIRICAL EVIDENCE ON USING STOCKS FOR PRICE STABILIZATION
45 A number of developing countries have used buffer stocks for price stabilization over the years. In Asia, the focus has been on stabilizing the price of rice (e.g., China, India, Indonesia, and the Philippines) and wheat (e.g., India and Pakistan). Eastern and Southern Africa have focused on white maize prices (e.g., Kenya, Malawi, and Zambia), while stabilization of wheat prices has been the focus in many MNA countries.15 Most countries that use buffer stocks are regular net importers, but in Africa there are examples of irregular net importers also trying this (e.g., Malawi and Zambia), posing additional challenges to stabilizing domestic prices. Large countries such as China and India are another exception to the net importer rule; they are self-sufficient in rice and wheat, and justify the use of buffer foodgrain stocks by their large size and the high risk that this would entail if they were to use world markets to import if the need arose.
46 This chapter reviews lessons learned from the management of buffer stocks in selected developing countries where information is available. While there is no consistent information on buffer stocks worldwide, there are several countries in SSA and Asia with a long history of managing reserves for which information is available. In SSA, the lessons learned cover Kenya, Malawi, and Zambia (Jayne et al., 2008; Chapoto and Jayne, 2009; Minot, 2011; World Bank, 2012a). In Asia, the lessons are taken from India, Indonesia, and the Philippines (Timmer, 2004; World Bank, 2007; Dorosh, 2009; Basu, 2010; Shepherd, 2011). Some lessons are also available for MNA countries (World Bank, 2011; Larson et al., 2012).
47 If buffer stock programs are judged by how well they have followed the rules described in Chapter 2, there are no clear success stories. Public stocks have rarely been managed in a way where resulting gains exceeded the cost of interventions. The causes of some failures are well known, and include: (a) a multiplicity and lack of clarity of objectives; and (b) fiscal costs that rise to unsustainable levels, crowding out other agricultural investments. Other causes of failure are less obvious. They are indirect and invisible, but are essential for understanding the reasons for the low value for money from investing in buffer stocks. They include: (c) the costs of stabilization achieved at high price levels; (d) the failure to bring down price volatility despite large expenditures on buffer stocks; and (e) crowding out of the private sector. Governments in many OECD countries abolished their buffer stock programs and price stabilization schemes in the 1990s and 2000s for many of these same reasons. Empirical evidence below is presented along this list of main failures.
A. A multiplicity and lack of clarity of objectives of public stocks lead to failures
48 Many established food reserves attempt to cover too many conflicting objectives. The underlying aim of maintaining price stability at levels affordable for urban populations has often been confused with the objectives of meeting urgent food needs arising from emergency situations and addressing the needs of populations suffering from chronic food insecurity. This 15 Buffer stocks are rarely, if at all, used in Latin America and Caribbean or Europe and Central Asia, two of the World Bank’s six Regions. They were used in the EU in the past, but were abolished during the series of reforms of the Common Agricultural Policy that started in the mid-1990s.

17
has led to complex management structures with overlapping and sometimes contradictory policy priorities, often resulting in inefficient and inappropriate use of resources.
49 Clarity of objectives is even more muted when buffer stocks seek to provide price incentives to farmers and urban consumers simultaneously. Enforcing pan-territorial prices, which many governments tried to do in the 1970s and 1980s (and some even in the recent years), not only increases budget costs associated with paying for the gap between buying expensive grain in remote areas and selling it cheaply in urban areas, but it also promotes monoculture farming, limits agricultural diversification, and crowds out private sector jobs in rural areas.
50 In Zambia, attempts to support smallholders and urban consumers simultaneously (even during two recent, consecutive bumper harvests) led to significant market distortions and large fiscal costs, but had little impact on poverty. In 2010 and 2011, Zambia’s Food Reserve Agency (FRA) bought the total maize surplus of about 2 million tons at import parity prices. Neither the FRA nor private traders could export to neighboring Zimbabwe or the DRC because domestic maize prices were about $100 above the export parity (World Bank, 2012a). To make things worse, consumers only partially benefited from the bumper harvests. Local food prices remained high because the FRA was able to sell only a small portion of its stocks, mainly through direct sales to several large mills that were slow to reduce maize prices for consumers. In February 2012, the FRA still had about 1.3 million tons of stock, and was unable to find buyers, while domestic prices remained well above export parity. The overall outcome is little impact, at large cost, on the 60 percent of the population in Zambia that still live below the poverty line.
51 When food self-sufficiency policies prevent timely food imports, implementation arrangements and triggers for buying and selling stocks are often compromised. In Indonesia, despite the existence of quantitative triggers for imports,16 uncertainty exists about importing rice for both government market interventions and for its safety net program, the Beras untuk Rakyat Miskin (RASKIN). The decision to import is made by the President on advice from the Cabinet, often a long, drawn out process. Because the government promotes self-sufficiency, some policy makers are reluctant to admit that any imports are required, so import requests to the public agency tasked with managing public stocks (Badan Urusan Logistik (BULOG)) are delayed, even when the domestic market price clearly signals the need for imports (Shepherd, 2011). It can be months before the Department of Trade grants approval, and before Indonesia signs an MOU for government-to-government transactions with Thailand or Vietnam. Delayed approval in 2010, for example, caused domestic prices in Indonesia to rise significantly (Shepherd, 2011). Therefore, mixed policy objectives can create uncertainty about the use of triggers, the timing of imports, and stock releases, substantially reducing the economic rates of return from investing in foodgrain stocks.
52 A similar problem with unclear triggers and intervention objectives exists in the Philippines. Its National Food Authority (NFA), the public agency tasked with managing public 16 Badan Urusan Logistik (BULOG) has three triggers to alert the need for imports. The first trigger is when the marketing margin goes above 25 percent, compared with the target margin of 17 percent. The second is when production levels are 10 percent under forecast levels, though this trigger is constrained by inadequate information. The third, and perhaps most important, is when the level of stocks goes below 1.5 million tons. This figure has not changed since the 1990s and has not been updated to reflect either increases in population or the growing Beras untuk Rakyat Miskin (RASKIN) distribution commitment, though there are plans to increase the minimum to 2 million tons.
18
stocks, has until recently pursued a “buy high, sell low, and store long” policy, trying simultaneously to: (i) promote self-sufficiency through high paddy prices; (ii) improve access of the poor to affordable rice through its low prices; and (iii) have sufficient stocks to release in an emergency. These conflicting objectives not only inflate fiscal costs but also increase uncertainty for market agents regarding the specific objective to be achieved during certain times. In the end, this uncertainty results in higher prices paid by consumers and little benefit to producers (e.g., see the analysis of impact of high output prices on farm profits in Section C).
B. Fiscal costs too frequently escalate to unsustainable level
53 Buffer stocks are expensive. They are a recurrent expenditure for national budgets. The cost of holding grain stocks can be as high as 15-20 percent of the value of the stock per year (Action Aid, 2011). Raising producer prices above market levels and lowering consumer prices below market levels add to fiscal costs, especially in poor countries. These costs can crowd out spending on public goods, thus impairing the long-term growth of the economy. The high fiscal costs of buffer stocks have opportunity costs in terms of growth that may offset the benefits of stable prices.
54 As a general rule, the greater the number of objectives a reserve has, the larger its size will need to be, and thus more financial resources will be required. Governments therefore have to balance the additional benefits that can be obtained from broadening the role of the reserve with the additional costs, including the cost of capital invested in stocks. In general, fiscal costs increase with the size of the reserve, higher procurement prices, more aggressive replenishment rates, and lower release prices. Total fiscal costs ranged from 0.5 percent of GDP in Indonesia to 1.5 percent of GDP in India and 1.9 percent of GDP in Zambia in recent years, the highest being in countries where higher procurement prices were not matched by higher sales prices.
55 These opportunity costs are not small. Table 2 illustrates that spending on stocking programs is often about the same or even exceeds spending on agricultural research and other agricultural programs, which are fundamental to increasing long-term agricultural TFP in these countries. In other words, high spending on public stocks does not leave much budget space for the long-term investments that are absolutely necessary to improve the food security of vulnerable populations.
56 An important determinant of fiscal costs is the size of stocks. The annual costs of storing and handling one ton of cereals range from $21 in Egypt and Bangladesh, $33 in Ethiopia, and $42-44 in Tunisia, Qatar, and Indonesia, to $49 in Malawi and $75 in Zambia (Cummings et al., 2006; Rohrbach et al., 2010; Rashid and Lemma, 2011; Shepherd, 2011; World Bank and FAO, 2012)17. In Malawi, a comparison of the operational costs of holding different levels of stocks showed that doubling reserves from their actual level of 60,000 tons would have increased operational costs by more than four times during 1988-2008, due to the need to carry over stock during years of surplus production and due to the high economic costs of rotation (Faruqee, 2009).
17 Note that these costs do not necessarily include the same expenses in all countries, which may cover handling, storage, fumigation, insurance, labor costs, and opportunity costs of tight capital.

19
Table 2: Public spending on stocks has often been larger than on agriculture and research Country Spending on public stock
programs (% of GDP)
Spending on agriculture (% of GDP
excluding [A])
Spending on agricultural R&D
(% of GDP)
[A] [B] [C] India 1.0% (2004/05) - 1.5% (2008/09) 1.2% (2008/09) 0.06% (2008/09) Indonesia 0.5% (2008-10) 0.8% (2008) 0.05% (2003) Philippines 0.4% (2005-06) – 1.0% (2009) 0.8% (2005) 0.06% (2002) Zambia 0.3% (2009) – 1.9% (2011) 0.6% (2010) 0.15% (2010)
Source: Data on public expenditure on public stocks [A] for India are from Rhee (2011), Dawe et al. (2011), and government statistics; for Indonesia from Rhee (2011); for the Philippines from the World Bank (2007) and Rhee (2011); and for Zambia from IMF and Nkonde et al. (2011). Spending on agriculture [B] is from World Bank country reports and government statistics. Spending on agricultural research and development [C] is from Pardey et al. (2006) and World Bank country reports.
57 The longer stocks are kept, the larger the fiscal costs. In Malawi and Zambia, maize stocks are often kept for more than a year without rotation. Larger stockholdings can help reduce volatility but often only to a point, after which increasing reserves does little. Larson et al. (2012) simulated the impact of different stock accumulation rates on price volatility and budget expenses in MNA countries and found a large trade-off between fiscal costs and the impact of larger stocks on price volatility (Table 3). After a certain point, the cost of building additional inventories greatly exceeds the rate of decline in price volatility. The increase of stock size from five to six, seven, or more months of consumption raises the budget costs significantly, while having little impact on price volatility. These simulations show that the cost of building up stocks increases rapidly and that programs based on smaller stock levels are much cheaper to implement, without necessarily weakening the impact of stocks on price volatility.
Table 3: Smaller reserves are cheaper and sufficient to achieve price stability
Months of storage to meet storage target
Annual costs (US$ Million)
Coefficient of variation of
prices
Marginal change of costs comp. to
no storage (%)
Marginal change of coefficient of variation
(%) 0 0.0 16.359
0.1 209 15.393 -5.91 0.2 451 14.847 116 -3.55 0.3 692 14.605 169 -1.63 0.4 929 14.505 203 -0.68 0.5 1,172 14.467 229 -0.26 0.6 1,410 14.467 249 0.00 0.7 1,649 14.461 266 -0.04 0.8 1,892 14.460 281 -0.01 1.0 2,389 14.460 307 0.00 1.2 2,838 14.461 326 0.00
Source: Larson et al. (2012). Note: The costs are presented for a 50 percent build-up replenishment rate.
58 The cost of the program also depends on decisions about the speed of replenishment. A more aggressive purchase strategy tends to increase budget costs. The simulated annual costs of keeping strategic grain reserves in MNA countries for the storage target of five months can
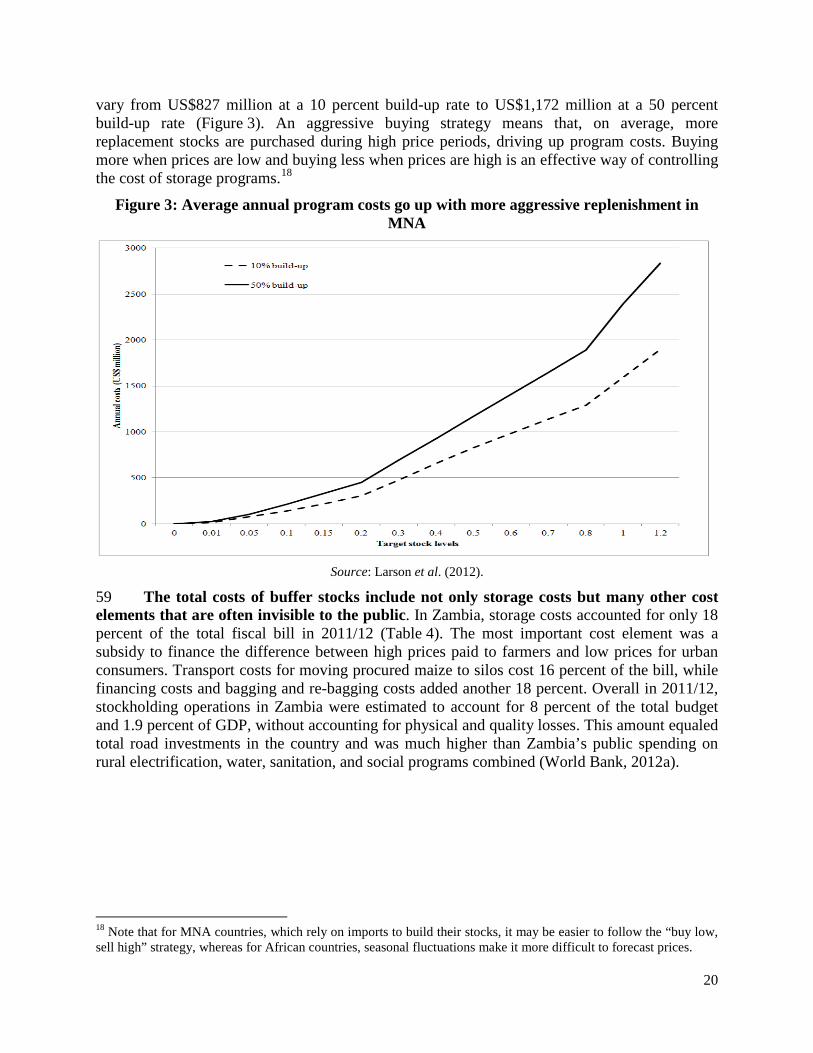
20
vary from US$827 million at a 10 percent build-up rate to US$1,172 million at a 50 percent build-up rate (Figure 3). An aggressive buying strategy means that, on average, more replacement stocks are purchased during high price periods, driving up program costs. Buying more when prices are low and buying less when prices are high is an effective way of controlling the cost of storage programs.18
Figure 3: Average annual program costs go up with more aggressive replenishment in MNA
Source: Larson et al. (2012).
59 The total costs of buffer stocks include not only storage costs but many other cost elements that are often invisible to the public. In Zambia, storage costs accounted for only 18 percent of the total fiscal bill in 2011/12 (Table 4). The most important cost element was a subsidy to finance the difference between high prices paid to farmers and low prices for urban consumers. Transport costs for moving procured maize to silos cost 16 percent of the bill, while financing costs and bagging and re-bagging costs added another 18 percent. Overall in 2011/12, stockholding operations in Zambia were estimated to account for 8 percent of the total budget and 1.9 percent of GDP, without accounting for physical and quality losses. This amount equaled total road investments in the country and was much higher than Zambia’s public spending on rural electrification, water, sanitation, and social programs combined (World Bank, 2012a).
18 Note that for MNA countries, which rely on imports to build their stocks, it may be easier to follow the “buy low, sell high” strategy, whereas for African countries, seasonal fluctuations make it more difficult to forecast prices.

21
Table 4: A breakdown of the total fiscal costs of managing maize stocks in Zambia is revealing
Cost elements US$ million % of total Storage costs 63.0 17.9 Financing costs 38.0 10.8 Transportation of procured maize 55.0 15.6 Bagging and re-bagging 25.1 7.1 Food subsidy (release price – procurement price) 150.0 42.5 Construction of hard standing slabs 15.0 4.3 Rehabilitation of grain silos 6.7 1.9 TOTAL COSTS 352.8 100.0 Total costs as a share of total budget expenditure 8.2% Total costs as a share of GDP 1.9%
Source: World Bank (2012a).
60 In countries that replenish stocks with imports, the costs of buffer stocks are greatly affected by the efficiency of supply chains. When the costs of transferring grains from exporting countries to ultimate consumers in importing countries are high, public stocks need to be larger. High costs in supply chains can result from: (i) under-investments in ports, storage, roads, or other infrastructure; and (ii) poor trade facilitation. In MNA countries in 2009, the logistic and management costs of importing wheat were estimated at $40 per ton compared to only $11 in the Netherlands and $16 in South Korea (World Bank and FAO, 2012). In Egypt and Jordan, costs were about four times higher than in the Netherlands (Figure 4), pushing these countries to import more and store longer to cover domestic requirements on time. All of these logistic costs increase the fiscal costs of maintaining stocks, reducing the amount of funds available for the long-term investments needed to generate economic growth.
Figure 4: Wheat supply chain costs in MNA countries in 2009 were much higher than in benchmark countries (Netherlands and South Korea)
Source: Larson et al. (2012).
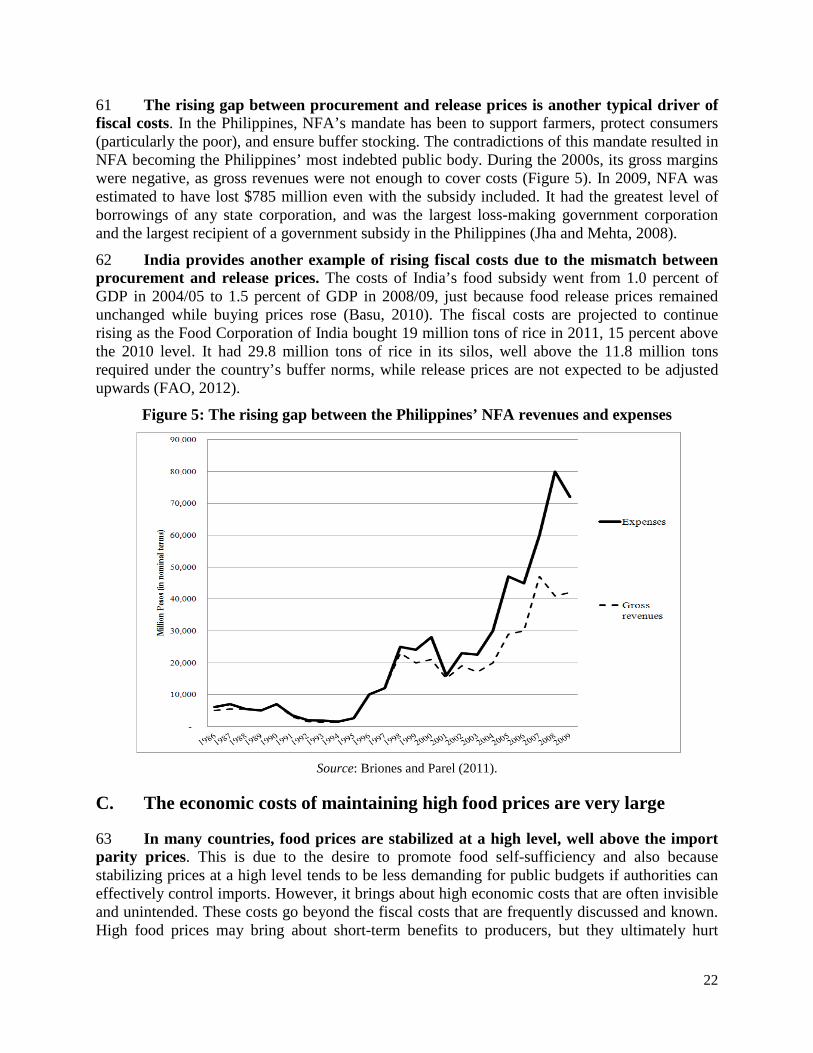
22
61 The rising gap between procurement and release prices is another typical driver of fiscal costs. In the Philippines, NFA’s mandate has been to support farmers, protect consumers (particularly the poor), and ensure buffer stocking. The contradictions of this mandate resulted in NFA becoming the Philippines’ most indebted public body. During the 2000s, its gross margins were negative, as gross revenues were not enough to cover costs (Figure 5). In 2009, NFA was estimated to have lost $785 million even with the subsidy included. It had the greatest level of borrowings of any state corporation, and was the largest loss-making government corporation and the largest recipient of a government subsidy in the Philippines (Jha and Mehta, 2008).
62 India provides another example of rising fiscal costs due to the mismatch between procurement and release prices. The costs of India’s food subsidy went from 1.0 percent of GDP in 2004/05 to 1.5 percent of GDP in 2008/09, just because food release prices remained unchanged while buying prices rose (Basu, 2010). The fiscal costs are projected to continue rising as the Food Corporation of India bought 19 million tons of rice in 2011, 15 percent above the 2010 level. It had 29.8 million tons of rice in its silos, well above the 11.8 million tons required under the country’s buffer norms, while release prices are not expected to be adjusted upwards (FAO, 2012).
Figure 5: The rising gap between the Philippines’ NFA revenues and expenses
Source: Briones and Parel (2011).
C. The economic costs of maintaining high food prices are very large
63 In many countries, food prices are stabilized at a high level, well above the import parity prices. This is due to the desire to promote food self-sufficiency and also because stabilizing prices at a high level tends to be less demanding for public budgets if authorities can effectively control imports. However, it brings about high economic costs that are often invisible and unintended. These costs go beyond the fiscal costs that are frequently discussed and known. High food prices may bring about short-term benefits to producers, but they ultimately hurt
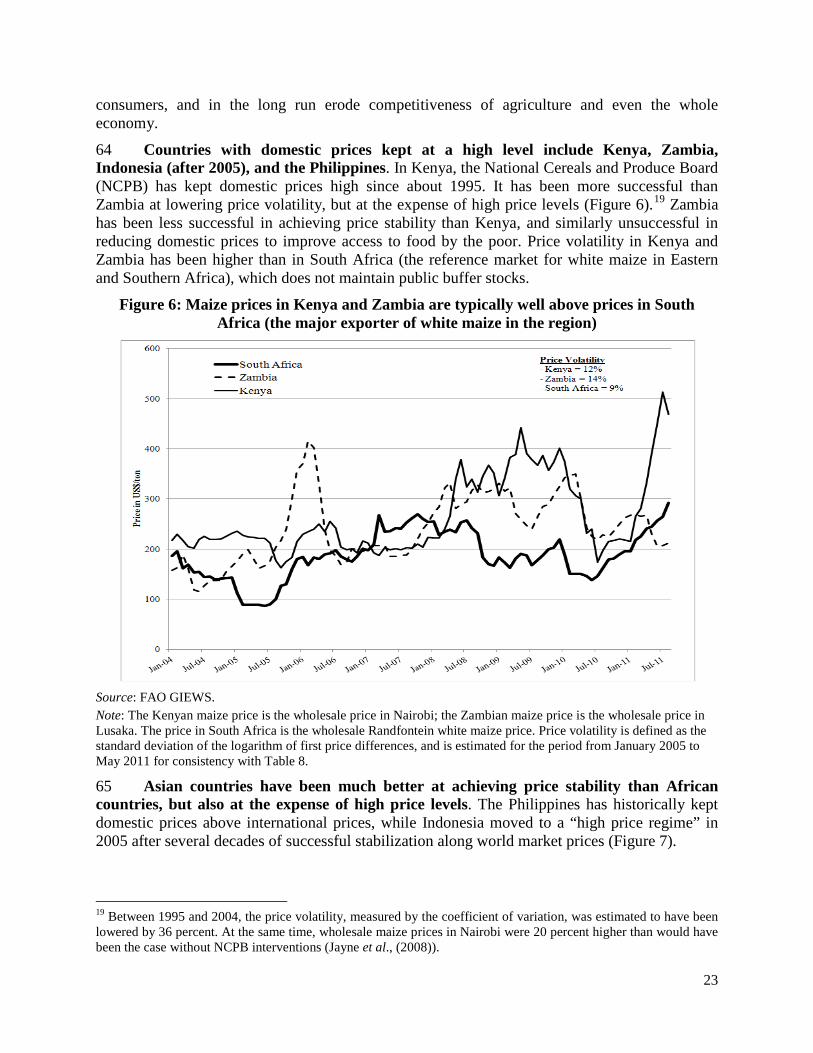
23
consumers, and in the long run erode competitiveness of agriculture and even the whole economy.
64 Countries with domestic prices kept at a high level include Kenya, Zambia, Indonesia (after 2005), and the Philippines. In Kenya, the National Cereals and Produce Board (NCPB) has kept domestic prices high since about 1995. It has been more successful than Zambia at lowering price volatility, but at the expense of high price levels (Figure 6).19 Zambia has been less successful in achieving price stability than Kenya, and similarly unsuccessful in reducing domestic prices to improve access to food by the poor. Price volatility in Kenya and Zambia has been higher than in South Africa (the reference market for white maize in Eastern and Southern Africa), which does not maintain public buffer stocks.
Figure 6: Maize prices in Kenya and Zambia are typically well above prices in South Africa (the major exporter of white maize in the region)
Source: FAO GIEWS. Note: The Kenyan maize price is the wholesale price in Nairobi; the Zambian maize price is the wholesale price in Lusaka. The price in South Africa is the wholesale Randfontein white maize price. Price volatility is defined as the standard deviation of the logarithm of first price differences, and is estimated for the period from January 2005 to May 2011 for consistency with Table 8.
65 Asian countries have been much better at achieving price stability than African countries, but also at the expense of high price levels. The Philippines has historically kept domestic prices above international prices, while Indonesia moved to a “high price regime” in 2005 after several decades of successful stabilization along world market prices (Figure 7).
19 Between 1995 and 2004, the price volatility, measured by the coefficient of variation, was estimated to have been lowered by 36 percent. At the same time, wholesale maize prices in Nairobi were 20 percent higher than would have been the case without NCPB interventions (Jayne et al., (2008)).

24
Figure 7: Rice prices in the Philippines and Indonesia are kept above international reference prices
Source: Philippines Bureau of Agricultural Statistics, Ministry of Trade of Indonesia, and the World Bank Pink Sheet Tables.
66 The most obvious consequence of stable yet high prices is immediate taxation of domestic consumption and increased poverty. Food constitutes a much larger share of the consumer price index in developing countries than in developed countries (Table 5), such that the poorest are hurt the most when prices rise and are not offset by higher incomes. In Kenya, several studies (carried out independently using the nationwide farm household survey implemented during the 1990s and early 2000s) found that a 20 percent increase in maize prices between 1995 and 2004 significantly increased the rural and urban poverty and transferred income from the majority of small-scale maize purchasing farmers to a very small number of larger maize-surplus farmers (Mghenyi, 2006; Mude and Kumar, 2006; Jayne et al., 2008). Warr (2005) found that higher rice prices increased poverty in Indonesia. In the Philippines, the World Bank (2007) estimated that if the wholesale rice prices had been reduced to the level of border prices during 2000-2005, the poorest 30 percent would have spent 10 percent less on food, and hunger amongst such families would have declined correspondingly. The proportion of households experiencing hunger in the Philippines rose from under 10 percent in 1998 to over 24 percent in 2009 (Tolentino et al., 2011), correlated with rises in the rice price in the poorest regions (Jha and Mehta, 2010).
67 Public food distribution programs cannot offset the effects of high food prices. India, Indonesia, and the Philippines (until 2010) have all distributed rice to vulnerable populations at subsidized prices through various programs, to partially compensate for the impact of their buffer stock policies, which have pushed food prices up. In the Philippines, subsidized rice covered only 10-12 percent of the rice purchases of the poorest households in 2007/08, with the remaining 80-90 percent purchased at prices well above the world market level (World Bank, 2007). In India, the impacts of food distribution programs on the poor are estimated not to have exceeded 5 percent of their incremental spending (Jha and Ramaswami, 2010). In Indonesia, the RASKIN food distribution program compensated for only 3 percent of total rice consumption of

25
the poor in 2010, with the remaining 97 percent of rice purchased in the market at artificially high prices (World Bank, 2012c).
Table 5: Food accounts for a large share of the CPI in developing countries Country Share (%) Bangladesh 58.8 Philippines 46.6 India 46.2 Pakistan 40.3 Vietnam 39.9 Indonesia 36.2 Thailand 33.0 Malawi 60.0 Zambia 55.0 United States 14.8 Euro zone 14.0 Japan 25.9 Source: ADB (2011) and the World Bank Development Indicators.
68 High food prices tend to lower wage competitiveness. In the Philippines, for example, where rice alone accounts for 20 percent of the food component of the CPI, high rice prices place upward pressure on wages. According to research carried out by Lasco (2005), in the short term, a 1 percent increase in rice prices causes a 0.35 percent increase in wages. In the longer run, the elasticity is above one. Minimum wage is significantly influenced by inflation: a 10 percent increase in the CPI induces a 12 percent increase in the minimum wage. When real wages in the Philippines increase by 10 percent, agricultural and service sector employment are estimated to decline by 4.3 percent and 2.8 percent, respectively (Brooks, 2002).
69 Thus, a high price policy for food staples can be very costly for the economy. It is counterproductive to raise prices for the main commodity consumed by laborers in a situation where labor-intensive growth in the non-farm economy is essential for poverty alleviation, and when neighboring countries enjoy a competitive advantage of lower food prices that translates into more competitive wages and higher consumption. Indeed, the pace at which countries are able to bring down their food prices sustainably, and thereby enhance labor competitiveness, will have a bearing on their capacity to expand into any internationally competitive, labor-intensive activity.
70 Ironically, high prices do not necessarily translate into benefits for net producers, as higher output prices inflate production costs.20 In the Philippines, where rice prices are the highest in East Asia, production costs are also the highest, due to high labor costs and perhaps also due to less pressure on inefficient producers. In Central Luzon, total production costs per ton of paddy were estimated at $96 per in 1999, compared to $59 in the Central Plain of Thailand, $74 in the Mekong Delta of Vietnam, and $69 in Indonesia (Moya and Dawe, 2006). Labor costs are the major driver of the cost difference, accounting for 60 percent of total production costs; labor costs in the Philippines are high due to high rice prices, creating a vicious cycle. To sum 20 This phenomenon is not unique for Asia and has also been observed in OECD countries, which have a long history of keeping food prices at high levels. The unintended cost-pushing effects of high output prices were among the main reasons for recent reforms in the U.S. and the EU that brought domestic prices into alignment with world market prices and shifted support to farm incomes rather than prices.
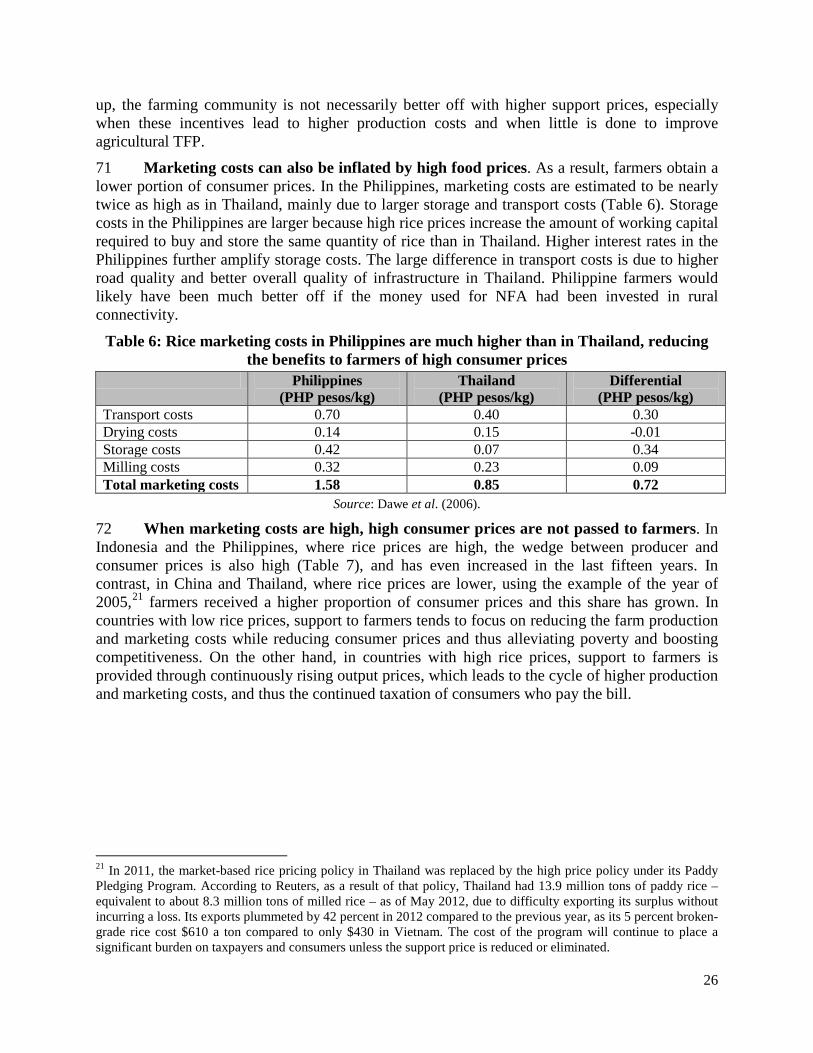
26
up, the farming community is not necessarily better off with higher support prices, especially when these incentives lead to higher production costs and when little is done to improve agricultural TFP.
71 Marketing costs can also be inflated by high food prices. As a result, farmers obtain a lower portion of consumer prices. In the Philippines, marketing costs are estimated to be nearly twice as high as in Thailand, mainly due to larger storage and transport costs (Table 6). Storage costs in the Philippines are larger because high rice prices increase the amount of working capital required to buy and store the same quantity of rice than in Thailand. Higher interest rates in the Philippines further amplify storage costs. The large difference in transport costs is due to higher road quality and better overall quality of infrastructure in Thailand. Philippine farmers would likely have been much better off if the money used for NFA had been invested in rural connectivity.
Table 6: Rice marketing costs in Philippines are much higher than in Thailand, reducing the benefits to farmers of high consumer prices
Philippines (PHP pesos/kg)
Thailand (PHP pesos/kg)
Differential (PHP pesos/kg)
Transport costs 0.70 0.40 0.30 Drying costs 0.14 0.15 -0.01 Storage costs 0.42 0.07 0.34 Milling costs 0.32 0.23 0.09 Total marketing costs 1.58 0.85 0.72
Source: Dawe et al. (2006).
72 When marketing costs are high, high consumer prices are not passed to farmers. In Indonesia and the Philippines, where rice prices are high, the wedge between producer and consumer prices is also high (Table 7), and has even increased in the last fifteen years. In contrast, in China and Thailand, where rice prices are lower, using the example of the year of 2005,21 farmers received a higher proportion of consumer prices and this share has grown. In countries with low rice prices, support to farmers tends to focus on reducing the farm production and marketing costs while reducing consumer prices and thus alleviating poverty and boosting competitiveness. On the other hand, in countries with high rice prices, support to farmers is provided through continuously rising output prices, which leads to the cycle of higher production and marketing costs, and thus the continued taxation of consumers who pay the bill.
21 In 2011, the market-based rice pricing policy in Thailand was replaced by the high price policy under its Paddy Pledging Program. According to Reuters, as a result of that policy, Thailand had 13.9 million tons of paddy rice – equivalent to about 8.3 million tons of milled rice – as of May 2012, due to difficulty exporting its surplus without incurring a loss. Its exports plummeted by 42 percent in 2012 compared to the previous year, as its 5 percent broken-grade rice cost $610 a ton compared to only $430 in Vietnam. The cost of the program will continue to place a significant burden on taxpayers and consumers unless the support price is reduced or eliminated.

27
Table 7: Farmers tend to receive a higher share of the wholesale rice price in countries with lower consumer prices
Share received Wholesale rice price (US$/ton in 2005) 1990-95 1995-00 2000-05
Indonesia 50% 45% 45% 304 Philippines 51% 47% 48% 381 China 61% 65% 64% 259 Thailand 50% 61% 63% 252
Source: Authors’ estimate based on price data from FAOSTAT and FAO GIESW.
73 In addition to providing low benefits, high food prices supported under buffer stock programs tend to increase disparity in agriculture. The wealthiest and largest farmers, who typically represent an absolute minority in low income countries, receive the bulk of the benefits of these programs. In Kenya, about 3 percent of all farmers sell 50 percent of the maize surplus and regularly benefit from NCPB procurements (Jayne et al., 2008). In Zambia, about 5 percent of all farmers account for half of the national maize surplus and benefit from high prices (Nkonde et al., 2011). In the Philippines, 40 percent of all rice farm households account for two-thirds of the marketed domestic rice, with relatively little accruing to poor rice farm households (Dawe, 2006). In Indonesia, the main beneficiaries of BULOG procurement (5-9 percent of total production in the country) are the 1.2 million better-off households (about 20 percent) with the largest holdings of rice lands, while the other 80 percent of farming households are net consumers of rice (McCulloch and Timmer, 2008). Thus, in most cases, public procurement benefits larger farms, not smallholders, increasing disparity within the sector.
74 Finally, artificially high prices offered by public reserve agencies tend to slow down diversification and thus reduce the value of agricultural output. Farmers respond to high prices offered by state agencies by producing more of the supported crops, even in areas not suitable for their production. In Zambia, offering incentive prices to producers of white maize on a pan-territorial basis encouraged its production in areas that were better suited to more drought-resistant crops, such as millet and sorghum,22 and in areas that were previously under cotton and sugar cane production. As a result, the value of total agricultural output per farming household in 2010/11 remained about the same as in 2001/02. The share of maize in total agricultural output increased from 48 percent in 2001/02 to 54 percent in 2005/06-2007/08 and further to 61 percent in 2010/11, with less and less of higher-value crops being produced in the country (Nkonde et al., 2011). Lower income per capita is the price paid by the majority of farmers for the high price incentives to maize net producers promoted by the Zambian FRA.
D. Countries fail to achieve price stability, despite having buffer stocks
75 Some countries using buffer stocks fail to achieve price stability even when it is an objective. This problem is particularly acute in Africa. In spite of the large budget resources spent on price stabilization, domestic price volatility in Kenya, Malawi, and Zambia exceeds that of the international market and that observed in many neighboring countries without buffer stocks (Table 8).
22 If the current policy towards maize remains in place, in years of poor rains, farmers in these areas will continue to experience disastrous reductions in production, which may lead to transitory food insecurity.

28
Table 8: Volatility of maize prices in selected SSA countries, Jan. 2005-May 2011 Country No. of
observations No. of markets Volatility
(%) Chad 223 3 13.2 Ethiopia 294 4 9.5 Kenya* 597 8 11.7 Malawi* 364 5 19.7 Mozambique 523 7 11.4 Niger 364 5 11.3 Nigeria 224 3 12.5 Tanzania 149 2 11.0 Zambia* 570 8 13.7 South Africa (international reference price for Eastern and Southern Africa) 77 1 9.1
Source: Authors’ calculations and Minot (2011), based on data from FEWSNET and FAO GIEWS (for South Africa). Note: Price volatility is defined as the standard deviation of the logarithm of first price differences. * Countries with buffer stocks.
76 Foodgrain stocks are not suitable for addressing the underlying causes of price volatility in these countries. Price volatility in Eastern and Southern Africa is high because of poor infrastructure and the low resilience of agricultural production to weather shocks, among other reasons. The former increases the wedge between export and import parity prices, within which domestic prices may fluctuate widely without triggering exports or imports. Private exports or imports remain unprofitable until domestic prices either drop below the export parity price or rise above the import parity price. In such countries, food prices tend to significantly drop in years of good harvest and spike in years of low harvest. For example, wheat prices in Addis Ababa, Ethiopia, fluctuate depending on domestic production outcomes, within the large wedge between export and import parity prices (Figure 8). The wedge increased from $150 per ton in the 1990s to $220 per ton in 2010.

29
Figure 8: A large export/import parity price gap may lead to high local price volatility: the example of wheat in Addis Ababa
Source: Rashid and Lemma’s (2011) calculations from Ethiopian Grain Trading Enterprise data. Note: Import and export parity figures are calculated using U.S. Hard Red Winter Wheat Price (fob Gulf of Mexico) plus international shipping ($30/ton in December 2008) and domestic handling and transport from Djibouti to Addis (1,350 Birr/ton in December 2008).
77 To achieve positive outcomes in stabilizing prices through stocks, these countries need to: (i) increase the resilience of their agricultural production to weather shocks by investing in agricultural research, extension, irrigation, land markets, and sustainable land measures; and (ii) reduce the gap between parity prices by investing in infrastructure and trade logistics and avoiding export and import restrictions, which further widen the price parity gap. Putting limited budget resources into buffer stocks instead of the above-described investments is a wasteful endeavor.
78 Due to the challenges in using stocks to stabilize prices, buffer stock programs can even amplify domestic price volatility. In a sample of countries from Eastern and Southern Africa, maize price volatility was much higher in the group of countries seeking to stabilize prices by using buffer stocks than in the group of countries without such programs. In countries with buffer stocks (e.g., Kenya, Malawi, and Zambia), the average price volatility from January 2005 to May 2011 was 14.6 percent, compared to 11.3 percent in the countries without buffer stocks, a difference statistically significant at the 1 percent level (Table 9). Low-intervention countries rely on trade, mainly cross-border, to stabilize food prices, while high-intervention countries limit cross-border trade and appear to implement stockholding programs in a way that amplifies volatility rather than reducing it.

30
Table 9: Maize price volatility is higher in African countries with high market interventions
Level of intervention No. of observations No. of markets Volatility (%) Low 1,850 25 11.3 High 1,531 21 14.6
Source: Minot (2011), based on data from FEWSNET. Note: Volatility is defined as in Table 8.
79 The problem is exacerbated when food prices not only remain volatile but also become less predictable. Malawi and Zambia not only had the highest degree of price volatility in the region between 1994 and 2008, but the uncertainty of this price volatility was also the highest (Table 10), as implementation arrangements for their buffer stocks and discretionary trade policies created uncertainty (Chapoto and Jayne, 2009; Faruqee, 2009; World Bank, 2012a). In contrast, after embracing an open borders policy with respect to regional trade in 2005, Kenya has lowered its price volatility and increased price predictability by entering a customs union with members of the East African Community. Overall, countries with fewer trade distortions and no buffer stocks have both lower absolute volatility and higher predictability of prices.
Table 10: Price volatility versus predictability in selected SSA countries, 1994-2008 Country/market Price volatility
(%) Price uncertainty
(%) Ethiopia/Addis Ababa 26.2 6.8 Kenya/Nairobi (1994-08) 22.5 5.6 Kenya/Nairobi (2005-08) 18.9 4.3 Malawi/Lilongwe 50.5 14.6 Mozambique/Maputo 24.2 7.7 South Africa/Randfontein 28.8 6.4 Tanzania/Dar es Salaam 27.8 8.0 Zambia/Lusaka 36.7 11.4
Source: Chapoto and Jayne (2009). Note: Price volatility is defined as the unconditional coefficient of variation of price over time; price unpredictability is defined as the unanticipated component of price instability; i.e., the conditional variance from a price forecast model.
80 Asian countries with rice buffer stocks performed much better than African countries with maize stocks in terms of stabilizing domestic prices. One of the reasons for more stable rice prices is that rice production in Asia is irrigated, and thus less variable than maize production in Africa. Another reason is lower export/import parity price gaps. Domestic rice prices in China, India, Indonesia, and the Philippines are much more stable than in Thailand (the major rice exporter), or Bangladesh and Cambodia (the two countries pursuing an open trade policy) (Figure 9).

31
Figure 9: Rice prices are less volatile in Asian countries that use buffer stocks
Source: Authors’ estimate based on prices from FAO GIEWS and World Bank. Note: * Countries known to use buffer stocks to stabilize rice prices. Price volatility is defined as in Table 8.
81 But there are two reasons to be cautious about this relative success. First, the high volatility of rice prices in Thailand is partially caused by the insulating price stabilization policies of other countries (Martin and Anderson, 2011). These policies may serve the short-term interests of the implementing countries in question, but not for those of the world at large or for those countries in the longer term, as they suppress the price signal necessary for their own efficient supply response.
82 Second, stabilization policies in some Asian countries tend to achieve stable consumer prices rather than producer prices. The economic gains from such stabilization are smaller given that stable farm prices are the key to inducing supply response. In the Philippines, where national average monthly price time series are available at farm, wholesale, and retail levels for the period between 1990 and 2011, the volatility of farm (paddy) prices was 11.6 percent compared to only 3 percent at both the wholesale and retail levels (Figure 10). Lower volatility of consumer prices has not trickled down to producers. Farm-gate prices are volatile due to ineffective management of irrigation systems, and under-investment in infrastructure, research and extension services, and other productivity-inducing activities, leading to high yield variability (World Bank, 2007). Unless public investments address the key causes of volatility at the farm-gate, stabilizing producer prices will require high budget outlays (to procure outputs from farmers) in addition to stabilizing consumer prices.

32
Figure 10: Farm-gate rice prices in the Philippines are volatile despite stable consumer prices
Source: Authors’ estimate based on data from the Philippines Bureau of Agricultural Statistics
Note: Price volatility is defined as in Table 8.
E. Buffer stocks often crowd out the private sector, weakening its contribution to economic growth and job creation
83 When private storage is not optimal due to market failures on credit, insurance and forward markets, buffer stocks can complement private storage. On the other hand, public stocks can crowd out private stocks, requiring even larger buffer programs. But the largest crowding out impact, that buffer stocks have, is often on private trade. When this is the case, private sector underperforms in terms of creating jobs and driving economic growth, which is so much needed for sustained poverty alleviation in developing countries.
84 In a majority of cases, private trade can achieve similar levels of price stability, as can large sums of public money spent on buffer stocks. Bangladesh opened its rice trade to the private sector in 1991, and since then its domestic price volatility has been about the same as in the Philippines (Figure 9). Indonesia had stable rice prices from 2000 to 2004, when it allowed private imports. Domestic prices were not only stable but followed the import parity level very closely (Timmer, 2004). Yet when the BULOG’s monopoly was restored in 2005, domestic prices rose and became more volatile as illustrated on Figure 7 (Shepherd, 2011). Similarly, the benefits of cross-border trade in Zambia and Malawi were described in Chapter 2. Overall, the effectiveness of buffer stocks depends on the co-existence of alternative or complementary policies, a factor that should be considered before investing in them.
85 Buffer stock programs have negative effects on the private sector when government actions are difficult to anticipate. Some actions are related to buffer stock operations, while others are related to trade policy, which usually complements buffer stock programs. Such actions include import and export bans, non-transparent licensing of importers, unrealistic import requirements in terms of price and quantity, release of subsidized food onto domestic markets, or failure to deliver on announced state-to-state contracts (Chapoto and Jayne, 2007; Nkonde et al., 2011). All of this creates uncertainty for the private sector and drives domestic food prices up
33
unnecessarily, sometimes even above the import parity price, when governments cannot afford to take over the import bill entirely.
86 When replenishments are not done through open tenders, private traders are also crowded out. The impact is particularly significant in cases when large procurements take place at high prices. In India, where the minimum procurement prices are well above market level and the procurement volume reaches 25-30 percent of domestic production, the private sector’s role in trading wheat and rice is very limited. In Zambia, where procurement prices have recently been kept above the import parity level in spite of two consecutive bumper harvests in 2010 and 2011, private sector activity has essentially stopped, as it is unable to compete with the FRA (World Bank, 2012a). This reduces the role of the private sector in efficiently moving goods from surplus to deficit areas.
87 Improper stock release mechanisms may also crowd out the private sector. The best way to make market interventions successful is to sell stocks through open tenders to the private sector. However, many countries do not organize open tenders, preferring to channel stocks directly to selected millers and traders. This reduces the efficiency of releases. In Zambia, for example, the FRA has been releasing maize at subsidized prices to a limited number of large mills. This approach not only reduces competition in the milling sector but also limits the extent and speed of transmission of lower release prices to the market prices of maize and maize flour (World Bank, 2012a).
88 Complex release arrangements create uncertainty and thus raise the costs of doing business for the private sector. In Indonesia, for example, the Operasi Pasar (OP) market intervention program is designed to dampen unacceptable upward price movements. This fairly complicated bureaucratic process involves a District Food Security Council proposing to the Provincial Food Security Council to implement OP. Provincial Governors then make a proposal to the Ministry of Economic Affairs and the Ministry of Trade. This proposal includes the target rice price and the location for distribution. The decision-making process is often delayed due to insufficiently reliable price data. In turn, the Ministries give instructions to BULOG regarding the price at which the rice should be sold and in which locations. Alternatively, decisions on OP implementation can be made at the national level without the intervention of the provinces, an option that induces uncertainty. OP should be implemented when prices are 25 percent higher than the three-month moving average, but in practice a much lower percentage (around 10 percent) seems to be used as the yardstick (Shepherd, 2011). Some regions in the country have resisted the use of OP to help protect farm prices. Others have resisted RASKIN supplies of lower quality imported rice, as they often meet consumer resistance.
89 Even stock rotations, if done improperly, can destabilize markets. To maintain stocks in good condition, it is necessary to periodically rotate them. In some locations, it is possible to hold grain satisfactorily for longer than a single marketing year, but in most areas, shorter periods are recommended (Lynton-Evans, 1997). In tropical conditions, even more frequent rotations are required. In Djibouti, for example, rotation is required every six months to minimize stock losses (Hanush, 2010). But if not carried out in an orderly and transparent fashion, rotations can disrupt markets and discount private trade.
90 Predictability of rotation is the key to minimizing negative impacts on the market. Larger amounts of rotated stocks affect markets and prices more than smaller releases, stressing the importance of having a small stock. Rotations that are carried out routinely every month are

34
less disruptive than those carried out during shorter periods of time, but they are more difficult to manage, as monthly releases require monthly replenishments. In Ethiopia, it is estimated that if the stock level was increased to 1,500,000 tons from the current 600,000 tons, distortions from releases and rotation would increase significantly, even if the releases were well managed. But if releases were not well targeted to the poor, and if the stocks were rotated during the six months of the lean season instead of in equal amounts each month of the year, market prices could decline by 37-55 percent, versus only 2-3 percent with a small stock size and a careful release policy (Table 11). In Djibouti, the establishment of buffer stocks would destabilize private trade and prices only due to the necessity of short-term rotations of stocks (Hanush, 2010). In Malawi, it is estimated that increasing the reserve from 60,000 tons to 200,000 tons would depress domestic prices in the short run by 11-17 percent if stocks were rotated/released monthly and by 23-34 percent if stocks were released during the six months of the lean period (Thangata and Lemma, 2010).
Table 11: Stocks and market prices vary in Ethiopia under different rotation scenarios
Estimates of Marginal Propensity to Consume (MPC)
Stock level
Grain price-depressing effect if prices are relatively elastic (0.6)
Grain price-depressing effect if prices are relatively inelastic
(0.4)
Distribute equal amounts every
month
Distribute equal amounts
in six lean months
Distribute equal amounts every month
Distribute equal amounts
in six lean months
(%) MPC = 0.0 407,000 tons 2.18 4.36 3.27 6.55
1,500,000 tons 18.42 36.84 27.69 55.26
MPC = 0.32 407,000 tons 1.48 2.97 2.23 4.45 1,500,000 tons 12.53 25.05 18.79 37.58
Source: Rashid and Lemma (2011).
91 The bottom line: The general performance of price stabilization schemes in developing countries has been ineffective in improving food security outcomes. Reasons vary by country, but they can be generalized as follows. Typically, problems arose from the scheme being used for a multiplicity of objectives with lack of clarity amongst them. This led to an escalation of fiscal costs to unsustainable levels, taxing poor consumers, crowding out spending on agricultural productivity and rural infrastructure, and discouraging private investment, which are key drivers to lowering both levels and volatility of food prices. Indirect costs of maintaining public stocks often outweigh direct, more visible costs.
35
4. EMPIRICAL EVIDENCE ON FOOD EMERGENCY AND SAFETY NET STOCKS
93 Public stocks contribute the most to the food security of poor vulnerable people when they are used to respond to food emergencies and support safety nets. Such reserves improve distributional outcomes and there are several good examples of such programs. The essential purpose of such reserves is to buy time until imports or food aid arrives and to ensure predictable and rapid access to sufficient food to people affected by emergencies and/or to those who cannot meet their basic needs without help.
94 Small reserves with clear pro-poor targeting have been successfully operating in a number of countries. Ethiopia’s Emergency Food Security Reserve Administration (EFSRA) has been successfully implemented. In Mali, Programme de Restructuration des Marches Céréaliers (PRMC) has been successful in integrating emergency responses by supporting the food insecure through safety nets as one element of a very comprehensive program of cereal market liberalization. In recent years, Ethiopia has also moved toward having integrated food-security reserves similar to those in Mali. In Bangladesh, the Public Foodgrain Distribution System (PFDS) has coexisted with private trade, focusing on safety nets while allowing private traders to address rice price volatility.
95 In most instances, success has been achieved through well-defined objectives and pro-poor targeting. Effective early warning systems, compliance with rules and procedures, good management and flexibility, and collaboration between donors, relief agencies, and government authorities all help minimize budget outlays, market distortions, and mis-targeting of beneficiaries. Furthermore, food transfer programs have been more successful where cash transfers are less effective; i.e. in remote areas and in countries with high inflation.
A. Food emergency reserves
96 Ethiopia’s emergency reserves are used to address recurrent production shocks and the need to import food and to compensate for weak infrastructure to protect the poor and vulnerable in times of scarcity.23 As was the case in many countries in the 1970s, an initial objective of EFSRA was price stabilization, in addition to food emergency response. Over time, the government shifted the program’s focus to respond to droughts and emergencies, effectively coordinating national and donor aid activities. ESFRA was the only immediate source of food supplies in the 1990/00 and 2002/03 drought periods, and both government and relief agencies relied on its reserves to combat the unusually sharp increase in food prices in 2008/09 and during the 2011 Horn of Africa drought.
97 ESFRA has several strengths. First, the objectives of the agency are clearly defined and followed. ESFRA focuses on targeting the poor and vulnerable at times of food emergences. Second, the size of its reserves is small, capped at 407,000 tons, just sufficient to meet the estimated immediate needs of the target group, pending commercial imports or food aid. Since 2005, actual stocks have not exceeded 302,000 tons (which is below 10 percent of total domestic consumption of maize), the amount estimated to cover the needs of food-insecure people with 400 grams of grain a day for a period of four months. The recurrent size of stocks is optimized
23 The analysis of Ethiopia’s ESFRA is derived from NEPAD (2004), Rashid and Lemma (2011), and Minot (2011).

36
through the use of a national early-warning system that provides timely and credible information about harvest prospects, potential food shortages, and the relief food needs of Ethiopia’s vulnerable population.
98 ESFRA is designed to be simple and flexible in its response to emergency needs. The agency is overseen by a Board composed of representatives from different ministries. To be responsive during emergencies, the general manager of ESFRA is given the authority to release up to 5,000 tons of grain at a time, for a total of up to 25,000 tons if requested by any recognized relief agency. For larger amounts, decisions are made by a technical committee consisting of government and donor representatives. Overall, the organizational structure and the management of ESFRA reflect the high level of commitment from the government, and are flexible enough to promptly respond to emergency needs of varying degrees.
99 ESFRA does not engage directly in buying and selling grains. The primary mechanism to respond to emergencies is the provision of inventory loans to well-established relief and rehabilitation agencies working in the country. These NGOs have their own implementation arrangements and mechanisms to reach out to target groups, and the government, satisfied with these targeting mechanisms, trusts NGOs to deliver food relief in times of crises. Delivery of subsidized food through ration shops or local government channels, was identified to be cost-ineffective at targeting the poor, and was hence rejected. Engagement with NGOs has ensured the minimal impact of the reserve on market prices, thus avoiding unnecessary distortions.
100 This effective collaboration with NGOs promotes successful, cost-efficient stock management. On average, from 2005 to 2008, none of ESFRA’s seven warehouses appears to have held stocks older than nine months. At the national level, 70 percent of stocks in 2005/06 and 62 percent in 2007/08 were not older than three months (Table 12). This is quite remarkable, as there are countries where foodgrains in public warehouses are held for more than a year. The resulting cost savings were large as ESFRA did not incur recurrent monthly storage costs. At average monthly storage costs of $2.7 per ton, cutting storage terms from six to three months implied a 70 percent cost savings (or about $1,100,000) in 2005/06. In summary, the efficiency of stock rotation and the associated cost reduction have been instrumental to the success of ESFRA in Ethiopia.
Table 12: ESFRA stock age and storage costs, 2005-2008 2005 to 2006 2007 to 2008
< 3 months
3-6 months
6-9 months
< 3 months
3-6 months
6-9 months
Quantity (tons) 147,778 69,452 8,308 67,440 26,184 7,996 Percentage 70.1 29.1 0.8 62.2 18.3 5.8 Storage costs ($) 1,216,000 1,143,000 205,000 921,000 715,000 327,000
Source: Rashid and Lemma (2011).
B. Food safety net reserves
101 Given the large number of people with chronic food insecurity, Ethiopia began to add safety nets to the emergency objectives of ESFRA in 2005. Its safety net programs include the Productive Safety Net Program (PSNP), food-for-work, and school feeding programs. Since 2005, withdrawals for safety net programs have accounted for 57 percent of

37
ESFRA’s budget (Rashid and Lemma, 2011). PSNP has targeted chronically poor households through public works and direct support using both food and cash transfers. Beneficiaries in locations with good market access receive cash for labor-intensive public projects, while beneficiaries in remote areas are paid in maize or wheat. High inflation in the second part of the last decade eroded the value of cash transfers, but the more stable macroeconomic environment in recent years has provided the foundation for continued provision of cash transfers and for the design of more flexible arrangements to make timely adjustments for inflation.
102 The oldest and most successful food safety net program (the PRMC) is in Mali. Its unique multi-partner program was piloted in 1981 as part of the structural reform process and was subsequently extended to several other Sahelian countries, such as Burkina Faso, Chad, and Niger. This integrated food security reserve system comprises a number of elements that enable it to operate efficiently in the context of private sector participation in markets, including: (i) an early-warning system; (ii) a market-information system; (iii) a small stock of between 30,000 and 35,000 tons; (iv) an emergency intervention unit; (v) a joint counterpart fund; and (vi) a food security fund (NEPAD, 2004).
103 Mali’s PRMC has both physical and cash reserves that help save money. The physical reserve is capped at 35,000 tons, financed through the joint counterpart fund. There is also a food security reserve fund comprised of financial contributions from the government and donors, sufficient to import and distribute 25,000 tons of cereals in the event of a major food emergency. This cash reserve generates significant budget savings as a result of not storing additional stocks, and by having access to funds to import food when needed.
104 As in Ethiopia, transfers in Mali are made through safety net channels. This is a much more efficient way of targeting the needy compared to selling subsidized food through retailers (as is done in India, the Philippines, and some MNA countries) or directly to beneficiaries through village administrators (as in Indonesia). Universal food distribution programs are criticized for their weak targeting, high administration costs, large fiscal costs, and high levels of leakage. The stylized facts from such programs are presented in Box 2.

38
Box 2: High Costs of Universal Food Transfer Programs In the Philippines, spending on rice-based social programs rose from 0.08 percent of GDP in 2007 to 0.58 percent of GDP in 2008 (Manasan, 2009), though the percentage of recipients who were non-poor was estimated at 39 percent in rural areas and 68 percent in urban areas (Jha and Ramaswami, 2010). The cost of reaching the poor was as high as $8 for each $1 disbursed when accounting for rice that simply disappeared or was sold to people other than the poor (Jha and Mehta, 2008). The recent move by the Philippines to cease subsidized food distribution and to instead use conditional cash transfers seems to be a recognition both of the failure of NFA in this regard and of the relative success of such cash transfers in other parts of the world.
Only 10 percent of India’s food subsidy transfer is estimated to have been received by the poor, with income transfer to the non-poor estimated at 19 percent, and illegal diversion at 42 percent of the total program. The cost of transferring one rupee worth of benefits under the Targeted Public Distribution System (TPDS) was estimated at Rs. 6.68, compared to Rs. 1.44 for Integrated Child Development Services and Rs. 1.85 for the Maharashtra Employment Guarantee Scheme. Even the Planning Commission’s estimate suggests that leakages fall within the range of 32-40 percent (Ganesh-Kumar et al., 2008). More recently, Khera (2011) showed that 67 percent of the wheat meant to reach the poor ended up missing the target, being pilfered or sold on the open market.
In Indonesia, the spending on the RASKIN food distribution program accounted for 53 percent of total social assistance expenditures in 2010. In contrast to India and the Philippines’ programs, RASKIN is a targeted program, but it has still been the least cost-efficient social assistance program in the country. About 40 percent of all benefits went to the 60 percent of richest households. The RASKIN had the highest administrative costs, about 35 percent per Rupiah of rice delivered, and provided the lowest-valued transfers to intended beneficiaries, compared to other programs based on cash transfers (World Bank, 2012c). Nearly all administrative expenditure was spent on logistics and management of physical stocks rather than on safeguarding and supporting operations crucial for effective service to beneficiaries.
105 Decisions in Mali regarding releases from the reserves are made by a joint donor-management board on the basis of information provided by the early-warning system. Periodic technical reports on food outlook and vulnerability assessments guide decision making, including on the size of stocks. If there is no call for food transfers, reserve managers may even export grains as part of the stock rotation process. Overall, technical procedures for managing stocks are clearly defined and adhered to, including: (i) regular quality control and rotation of stocks; (ii) open tendering of releases and procurement; (iii) recycling of grains towards the end of the marketing season when market supplies are running low and the prospects for the forthcoming harvest are becoming clear.
106 In the two decades since it was set up, the PRMC has proved its effectiveness in dealing with local and short-term food insecurity and has demonstrated its durability (NEPAD, 2004). A clear food security policy has ensured the PRMC’s effectiveness. Its reserves cover clearly identified population groups at greatest risk of food insecurity and target the food needs of the food insecure. Government commitment has been essential in promoting trade in food staples, so that food can be moved easily from surplus to deficit areas, while the reserves help groups of people with low purchasing power who cannot afford to buy sufficient food.
107 In Asia, Bangladesh’s public reserve system (the PFDS) is the one most integrated with safety nets. Until the early 1990s, Bangladesh’s food policy was similar to that of India and Pakistan, with government control of international trade and large-scale domestic procurement for the public foodgrain distribution system. However, since the early 1990s, Bangladesh has liberalized its domestic and international trade, while retaining a reduced PFDS (Table 13). Private sector imports have played a major role in price stabilization, particularly following major domestic production shortfalls such as those following the massive 1998 floods.

39
Table 13: Food grain stocks, procurement, and policy in selected countries of South Asia, average 2001-2007
Pakistan Wheat
India Wheat
India Rice
Bangladesh Wheat
Bangladesh Rice
Production (million tons) 20.33 70.51 87.23 1.21 25.68 Procurement (million tons) 3.89 16.09 22.52 0.11 0.88 Share of production (%) 19.2 23.0 25.7 6.7 3.4 Stocks (million tons) 1.16 17.06 16.40 0.23 0.54 Stocks (kg per capita) 7.6 16.2 15.4 1.7 3.8
Distribution channels Subsidized
sales to flour mills
Subsidized sales
through PDS
Subsidized sales
through PDS
Targeted distribution
Targeted distribution and sales
Source: Dorosh (2009).
108 The PFDS’s strength is that it focuses on areas where public stocks can make a difference. The role of price stabilization was given to the private sector, which has successfully stabilized domestic prices around the reference prices of India and Thailand (Figure 11). Liberalization of the rice trade induced massive imports of rice by hundreds of small traders. In 1998, private rice imports were six times larger than government rice distribution. If the government had imported this grain, the added cost of the imported rice, with delivery to local markets, would have been $50-100 million. And if the government had subsidized this rice by selling it at the price used for limited government sales in urban centers, the total fiscal cost would have been $160-210 million. The liberal trade policy helped the government stabilize prices without large government stocks and their associated fiscal costs (WDR, 2007).
Figure 11: Rice prices in Bangladesh have closely followed international reference prices
Source: FAO GIEWS.
40
109 The government instead used public funds to address natural disasters and to maintain safety nets and institutional distribution. It targeted beneficiaries directly through safety nets, not rationing shops. The broad set of reforms that started in the early 1990s included the reduction of stocks from about 2.0 million to 1.0 million tons, and subsequently to 0.65 million tons in 2003 (Rashid, 2011). All rationing systems were abolished, and targeted and conditional safety net programs, such as food for education, were introduced. This experience shows that market development and trade liberalization, providing another option for price stabilization, are potentially less costly and more effective, while permitting the government to focus on achieving positive food security outcomes.
110 The food price spike in 2008 changed the situation in Bangladesh. The government had been considering a sizeable increase in the size of its stocks since being cut off from food imports when India used an export ban in 2007 and 2008. The operating costs of PFDS have more than doubled compared to 2001/02, due to higher stock holding and larger rice subsidies in recent years (Rashid, 2011). While the government’s concerns are well founded, any further increase in the stock level in the country should be carefully considered, unless there are justifiable additional PFDS channels to control program costs and minimize the distortion of markets.
111 Despite the successes of these food emergency and safety net reserves, it should be noted that safety nets and food transfers can help eradicate only some of the negative impact of price spikes. Safety nets cost money and require good institutions, conditions not usually met in countries where hunger prevails. High food price variability and long, lean seasons are the reality in most parts of Africa and Asia. A recent assessment of safety nets in Bangladesh showed the positive, though limited, impact of government- and non-government-run safety net programs on mitigating both seasonal and non-seasonal food deprivation in the country’s highly vulnerable northwest region. But given the large number of the poor there and frequent and high price fluctuations, more programs are needed to increase the income of the poor by raising their agricultural productivity and diversifying their income and employment (Krandker et al., 2011). In summary, safety nets and food transfers can be viewed as a quick fix to reduce the severity of food deprivation, but the longer-term solution rests on promoting the income and productivity of the poor.
112 The bottom line: The most effective use of food stocks tends to be as part of a comprehensive safety net approach, with considerable effort at targeting the poor and vulnerable. Safety nets allow transmitting higher prices to producers, providing the incentive to increased domestic food supply that can subsequently help lower domestic food prices. Effective targeting provides emergency food to the most vulnerable, which is more cost-effective than universal food distribution programs and has less negative impacts on producer prices and incentives for private storage. Effective early warning systems; compliance with rules and procedures; maintaining small reserves; good management and flexibility; and collaboration between donors, relief agencies, and government authorities all help minimize budget outlays, market distortions, and mis-targeting of beneficiaries.

41
5. HOW REGIONAL FOODGRAIN RESERVES CAN HELP
113 There have been several ongoing efforts to establish regional food reserves in Asia and Africa in recent years. In East Asia, the ASEAN reformed its Emergency Rice Reserve System by adding resources from China, Japan, and South Korea to establish the ASEAN Plus Three Emergency Rice Reserve (APTERR). In 2007, the South Asian Association for Regional Cooperation (SAARC) re-launched a food bank to be tapped into during emergencies and serious food shortage periods (Action Aid, 2011). In West Africa, there have been efforts by ECOWAS, in partnership with the World Food Programme (WFP), to establish a regional humanitarian reserve (WFP, 2011).
114 What is the value-added of regional reserves compared to national ones? Major gains may arise from: (i) cost savings from economies of scale; (ii) independent management of regional reserves that prevents governments from using reserves for political gains, and ensures that they target vulnerable people through safety nets; and (iii) the existence of a forum for collective agreement to avoid trade restrictions during major food crises. These are not contentious issues and some studies suggest that there are gains to be made. It was estimated, for example, that for Southern and Eastern Africa countries to stabilize cereal consumption in each country in the late 1990s, regional stocks could theoretically be 41 percent less than the sum of national stocks needed if cooperation was lacking (Koester, 1986). Recently, the WFP estimated that regional stocks in ECOWAS countries would be 35 percent smaller than the sum of national stocks needed to provide thirty days of consumption for the most vulnerable (WFP, 2011).
115 When regional reserves aim to stabilize prices, the situation is more contentious. Many efforts to establish international reserves and commodity agreements to stabilize prices failed in the past. International Commodity Agreements with economic clauses and market interventions historically existed for six commodities (i.e., cocoa, coffee, natural rubber, sugar, tin, and wheat), but none of these price stabilization agreements have survived to the present day (Table 14). Although international stocks were envisaged, they were small and thus inadequate to mitigate price spikes, while their releases often required time-consuming bilateral negotiations (Tangermann, 2011; Larson et al., 2012). They also failed because they did not guarantee continued international collaboration during food emergencies. Trust and governance issues remain real hurdles.
Table 14: All international agreements to stabilize commodity prices have failed Sugar Tin Coffee Cocoa Rubber
Year of initial agreement 1954 1954 1962 1972 1980
Stabilization clause
Lapsed in 1963, revived, lapsed in 1983
Collapsed in 1985
Suspended in 1985
Suspended in 1998
Suspended in 1996, revived, suspended again in 1999
Source: Larson and Gouel (2011).
116 The largest effort to revitalize regional stocks is in East Asia. The ASEAN Emergency Rice Reserve, set up in 1979 as part of the implementation of the ASEAN Food Security Reserve Agreement in a delayed response to the 1972/73 rice crisis, never really functioned (Shepherd, 2011). Countries committed to voluntarily provide rice for a common regional stockpile to meet emergency requirements, but 25 years after its establishment, the ASEAN Emergency Rice Reserve stood at only 87,000 tons. The reserve provided little
42
meaningful support at the time of food emergencies in the region, due to onerous request and delivery procedures and its insignificant volume (Dano, 2006; Dano and Peria, 2006).
117 With support from Japan, proposals were made in the mid-2000s for the East Asian Emergency Rice Reserve, which would involve the “Plus Three.” This envisaged earmarked stocks of 787,000 tons, with 700,000 tons provided by China, Japan, and the Republic of Korea (the “Plus Three”). Again, this attracted relatively little support. Releases were planned under three “tiers.” Tier One involved a commercial transaction where the reserve functioned primarily as a supply-demand matching service. There has been just one transaction under Tier One, when Vietnam supplied 10,000 tons to the Philippines. Given that most of the Philippines’ commercial transactions are with Vietnam anyway, the added value of the reserve’s involvement is unclear. Under Tier Two, the release is governed by a loan or grant agreement from the earmarking country. Release under Tier Three is meant to meet acute emergency needs of disaster victims. Between 2005 and 2010, 3,000 tons were distributed as food relief in four countries, and Thailand donated 520 tons to the Philippines after a typhoon (Briones, 2011).
118 In response to the recent global food price spikes, steps are now underway to launch APTERR. In May 2011, the 18th ASEAN Summit expressed the desire that a formal agreement be reached. With technical support from the Asian Development Bank, steps are presently being taken to develop guidelines and standard operating procedures to govern the reserve’s operation in times of natural disasters. After the price rises of 2007/08, it was initially thought that APTERR could play a market intervention role, but it has since been decided that stockpiled reserves should be mainly aimed at providing humanitarian food relief for localized emergencies, although targeting “market-wide disruption, such as a sudden food availability gap at national level, or an extreme price spike” is not excluded (Briones, 2011). The size of the reserves will likely remain modest due to the high financial costs of maintaining them. The intention is that APTERR will move more aggressively than in the past to address emergencies. However, several issues remain to be resolved, including: broadening the base of contributions (there has been too much reliance to date on Japan and Thailand, APTERR’s major proponents); storage management; legal aspects; the extent to which futures markets (not used for rice at present) could be used instead of physical stockholding; and how to encourage potential countries in need to pay for handling and distribution of rice when they can still rely on the WFP to provide food aid in areas hit by natural calamities (particularly in Cambodia, Laos, Myanmar, and the Philippines).
119 The creation of a functional APTERR has also been constrained by the multiplicity of objectives. Some countries want the reserve to pursue market stabilization. Countries have different definitions of food security, and some equate it with national food self-sufficiency. Countries such as the Philippines and Indonesia are unwilling to open their markets to commercial imports due to political fears of being dependent on what is perceived as a “thin” world market; they are actively promoting food self-sufficiency. Having a sizeable reserve in place that could be used for market intervention purposes if prices rose would assuage some of those doubts and perhaps encourage greater market liberalization. Yet the same issues surrounding reserves at the national level (as discussed in Chapter 3) also characterize regional reserves. Both will likely fail if they attempt to manage prices rather than their causes or consequences. The domestic policies of individual countries are the underlying cause of high price uncertainty and the thinness of the world rice market in Asia. Without more disciplined trade and price support policies, export prices in Vietnam and Thailand will remain highly

43
volatile. However, at present it is not clear whether ASEAN is preparing to use its regional platform to impose more discipline on its Member States, particularly in avoiding export bans, commercializing trade, and moving from measures supporting farm prices to measures supporting farm incomes and agricultural TFP.
120 Some efforts to use regional stocks for emergencies have recently taken place in West Africa. With assistance from the WFP, ECOWAS has been designing a targeted, cost-effective emergency humanitarian food reserve system with small, regionally pre-positioned stocks, to be organized and operated with the active participation of the countries and regions concerned (WFP, 2011). The proposed regional reserve would give poor food-deficit countries rapid access to about 67,000 tons of cereals (rice, maize, millet, and sorghum sufficient to meet the 30 days consumption requirements of the vulnerable population) for distribution through targeted assistance schemes and other safety net programs. It intends to pilot the use of virtual stocks for an additional 60 days of consumption requirements and to work with national governments to strengthen systems of national and regional resilience, addressing a specific challenge to existing response mechanisms, and providing a critical additional line of defense and saving lives in emergencies.
121 This regional reserve’s strength is in its focus on a specific problem with clear objectives. It seeks to give low income, food-deficit countries predictable and rapid access to sufficient food to meet the humanitarian needs of their vulnerable population through safety nets and other targeted food assistance programs during periods of high and volatile prices. The proposed size of the reserve is too small to crowd out the private sector and distort market prices, but is sufficient to provide assistance to food vulnerable people at times of crises. The program details appropriate burden sharing among countries and donors, with participating countries playing a key role in governance and financing. The proposal also envisages a streamlined, accountable governance structure. The involvement of NGOs and donors in the governance and management of reserves will help limit potential interferences, ensure that clear operational and financial rules and controls are established and followed, build trust among stakeholders, and promote transparency (WFP, 2011). It remains to be seen how the proposed reserve will function in practice.
122 The bottom line: International price stabilization schemes through international agricultural commodity agreements have not been an effective instrument to stabilize prices. While small regional reserves for humanitarian purposes aimed at complementing national safety net programs, in theory, could be effective, there are no working examples despite several attempts to set these up over the last 40 years. Regional reserves have required stock provision from multiple countries, and stocks releases to multiple countries. Coordination challenges and trust issues across national borders have complicated implementation. Strong ownership of participating countries and implementable arrangements are the likely key to success of regional reserve programs. Furthermore, improvements in communications, financial, and transportation technologies, and in regional integration efforts, may make regional options more feasible in the future.

44
6. RECOMMENDATIONS FOR MANAGING PUBLIC FOODGRAIN STOCKS
124 Public stocks can play a limited but important complementary role in improving food security, complementing a broader non-stock strategy that addresses both the resiliency of rural livelihoods and the functionality of overall safety nets. Public grain stocks as a food security intervention are most effective in the short run, especially for bridging the time needed for food imports, and targeting support to helping ensure the most vulnerable have food to eat in times of market shocks.
125 If used, public grain stocks need to be incorporated into a coherent long-term strategy that combines the use of trade, investments in agricultural productivity, and well-managed targeted safety net programs. Design of details will vary from country to country, with stocks having a larger role in net food importing countries. A comprehensive strategy, not public stocks per se, is necessary to succeed in stabilizing domestic food prices in a way that induces agricultural growth and accelerates poverty alleviation.
126 If countries continue using public stocks for price stabilization, they are advised to align implementation arrangements with the objective to improve food security of vulnerable households. In this context, price stabilization can be successful only if addressing relatively rare price events in a way that crowds in private sector and stimulates agricultural growth, permitting a gradual long-term reduction of food prices; these are the keys to alleviating poverty and enhancing the long-term economic competitiveness of developing countries. The list of safeguards for managing public stocks is demanding but absolutely essential for ensuring high value for money and associated improvements in food security outcomes. The following features are critical in this respect:
a. Management structure: Stocks should be managed with a level of autonomy similar to that of central banks, within a framework of clear and well-defined objectives and implementation arrangements. There is no need to build bureaucracy around technical decisions. Clear triggers for market interventions and releases should be used to avoid market disruptions and politicization of stock management. Staff with appropriate skills should be mobilized or recruited, and an incentive structure put in place to retain them and ensure a high standard of performance.
b. Transparency, awareness creation, and communication strategy: Awareness creation and communication campaigns are the key to the predictability of public stock management and its successful co-existence with private storage and trade. Such campaigns are often neglected and underfunded, leading to failures, as described in detail in this report. Regardless of the methods used for buying and selling stocks, the associated procedures and triggers should be transparent and clearly specified in an operational procedure manual. Any change to the manual should be publicly announced in a timely manner to allow the private sector to adjust accordingly.
c. Size of reserves: A reserve should be limited in size to avoid a dominant position in the market, but should be sizable enough to affect prices. The size of stocks should be commensurate with their fiscal affordability, cost-effectiveness, and storage capacity.

45
d. Composition of the reserve: As a basic principle, public reserves should be comprised of cereals that are widely consumed, normally readily available in the domestic market, and preferably locally produced. In selecting the specific grain type, there will always be tradeoffs, but from an operational and budgetary standpoint, it would be advantageous to have only one type of grain in the reserve.
e. Location of the reserve: The reserve has to be held in locations where suitable facilities with adequate capacity for long-term storage of grain exist. Locating storage facilities in producing areas may save on transportation costs, but ready access to markets and targeted beneficiaries needs to be factored into the decision. While there could be advantages to spreading the reserve over several locations, consideration has to be given to the ability to maintain control over and supervise the physical stocks.
f. Financing the reserves: Financing is required to fund the purchase of grain and to cover operational costs; i.e., the administrative costs of the agency responsible for the reserve, storage, handling, transport, and maintenance costs of the grain. Costs are minimized when the agency buys low, sells high, and stores short. The agency should not attempt to maintain producer and consumer prices within a band narrower than the import/export parity price band (see below). Savings can also be made by: (i) outsourcing market monitoring systems (early warning systems, etc.); (ii) contracting the private sector to store the reserves; (iii) focusing on a single, locally available grain; and (iv) buying and selling stocks though existing market mechanisms (i.e., public open tenders or commodity exchanges).
g. Price band: If a price band is set, it should be around the export and import parity prices in a way that smoothes out occasional price spikes, not inter-seasonal fluctuations, through market interventions that only occur every few years. This will reduce inter-annual price instability but leave seasonal cycles largely unaffected, permitting the private sector to participate profitably in storage and trade.
h. Rules of replenishment: Replenishments need to be designed to ensure that the reserves minimize their costs. Purchases need to be made through open tenders when prices are low, in locations close to strategic storage facilities by using existing market participants in their normal marketing roles. While purchasing directly from farmers holds certain attractions, it has substantial practical and operational problems. To avoid having several tens of thousands of individual transactions of relatively small quantities, consideration needs to be given to introducing a minimum quantity which would be bought at a buying point or storage location. As an alternative to maintaining a network of buying points, purchases could be restricted to storage facilities in which reserves are to be held.
i. Rules of releases and rotation: Sales of stocks also need to be made through public open tenders at market prices. The results of these tenders should be published to maintain transparency and accountability in the tendering process. Commodity exchanges can be used to strengthen the price discovery mechanism and add to the integrity of the process. Different lot sizes can be offered to cater for different needs. A rotation strategy needs to be carefully designed to protect stocks from aging and to minimize price distortions during rotations. A rotation strategy needs to consider including sales and transfers to safety nets and careful rotation of grain towards the
46
end of the marketing season when market supplies are running low and when there should also be a good indication of the crop prospects for the following year, and hence the likely reserve needs.
127 Food emergency and safety net reserves are more practical and desirable for public investments to achieve food security outcomes than buffer stocks aiming at stabilizing prices. But even these public stock programs require careful design and implementation arrangements to produce results. In addition to the safeguards for buffer stocks described above, the following features are essential for the success of these types of public stocks:
a. Food vs. cash transfers: The option of food transfers needs to be compared with the often preferable choice of cash transfers. Foodgrain stocks should be used only for their main purpose of addressing food emergencies and chronic food insecurity.
b. Transfer mechanisms: When food transfers are deemed superior to cash transfers, efficient transfer mechanisms should be identified and designed. Food distribution at subsidized prices and universal subsidy in general are the least preferred options; food vouchers and stamps, food-for-work, school feeding, emergency relief, and other targeted safety net programs are more efficient.
c. Better promotion of nutritional outcomes: Food transfers have the potential to improve the nutritional outcomes of program beneficiaries by adding nutrients and minerals to food, including through bio-fortification. Food safety net programs should be more active in this area to generate greater benefits. Yet fortification can be hampered by a lack of proper government regulations or low incentives to processing sector to fortify food.
d. Effective targeting and clear, transparent procurement and release procedures: Strict targeting of vulnerable groups for food relief, open tendering of releases and procurements, and a careful rotation strategy would all help minimize possible adverse impacts on markets, and contribute to the efficient functioning of the reserve.
e. Size of the reserve: Emergency reserve stocks should be sufficient to meet urgent food needs resulting from emergency-induced food shortages until food imports or other domestic supplies can be mobilized and delivered. Normally, this amounts to a stock size equivalent to one to three months of estimated domestic consumption of the major cereal consumed in the country. Chronic food needs among poor and vulnerable populations should be met through programs designed specifically for that purpose. National food reserve stocks can be rotated through such safety net programs.
f. Early warning systems: For both emergency and safety net reserves, an early warning system and annual vulnerability assessments are needed to determine the level of stocks that will keep costs under control.
128 Regional reserves can complement national schemes. But clearly defined objectives and implementable arrangements are necessary to ensure successful functioning of such schemes. Importantly, countries need to avoid trade restrictions during major food crises. This is demanding, explaining why so little has been achieved so far with implementation of regional reserves in different parts of the world. But if cooperation agreements are reached and implementation details are worked out, regional reserves can provide substantial complementary

47
benefits to national-level programs. Improvements in communications, financial and transportation technologies are likely to make regional options more feasible in the future.

48
7. REFERENCES
Action Aid (2011): No More Food Crises: The Indispensible Role of Food Reserves. June 2011.
ADB (2011): Global Food Price Inflation and Developing Asia and World Bank. Asian Development Bank, Manila.
Alderman, H. (2011): "Food Transfers and Safety Nets." Presentation at the Role of Public Stocks in Food Security seminar held at The World Bank, Washington, D.C. on December 6.
Arezki, R. and M. Bruechner (2011): "Food Price and Political Instability." IMF Working Paper 11/62. Washington, D.C.
Basu, K. (2010): "The Economics of Foodgrain Management in India." Chief Economic Advisor, Ministry of Finance of India.
Bellemare, M., C. Barrett and D. Just (2011): "The Welfare Impacts of Commodity Price Volatility: Evidence from Rural Ethiopia." Working Paper.
Briones, R. (2011): "Regional Cooperation for Food Security: The Case of Emergency Rice Reserves in ASEAN Plus Three." Philippine Institute for Development Studies, Manila.
Briones, R. and D. Parel (2011): "Putting Rice on the Table: Rice Policy, the WTO, and Food Security." Policy Notes 2011-11, Philippine Institute for Development Studies.
Brooks, R. (2002): "Why Is Unemployment High in the Philippines?" IMF Working Paper No. 02/23, Washington, D.C.
Cafiero, C. and J. Schmidhuber (2011): "Stock and Price Data: Does Practice Match with Theory?" Presented at the AMIS Meeting in Rome, December 19, 2011.
Chapoto, A. and T. Jayne (2007): "How Does Regional Trade Affect Maize Price Unpredictability?" Presented at 2nd African Grain Trade Summit, Nairobi, Kenya, April 18-19.
Chapoto, A. and T. Jayne (2009): "The Impact of Trade Barriers and Market Interventions on Maize Price Predictability: Evidence from Eastern and Southern Africa." MSU International Development Working Paper 102, East Lasting, Michigan
Coady, D., P. Dorosh and B. Minten (2008): "Evaluating Alternative Approaches to Poverty Alleviation: Rice Tariffs versus Targeted Transfers in Madagascar." IMF Working Paper 08/9, Washington, D.C.
Catholic Relief Service (CRS) (1998): "Community-Level Grain Storage Projects (Cereal Banks): Why Do They Rarely Work and What are the Alternatives?" Workshop in Dakar, Senegal, sponsored by CRS with funding from USAID/OFDA.
Cummings, R., S. Rashid and G. Ashok (2006): "Grain Price Stabilization Experience in Asia: What Have We Learned?" Food Policy 31: 302-312.
Dano, E. (2006): "ASEAN’s Emergency Rice Reserve Schemes." Women in Action, <http://www.isiswomen.org/downloads/wia/wia-2006-3/03wia06_04aDano.pdf>

49
Dano, E. and E. Peria (2006): "Emergency or Expediency? A Study of Emergency Rice Reserve Schemes in Asia." A Joint Publication of AsiaDHRRA and AFA.
Dawe, D. (2006): "Rice Trade Liberalization Will Benefit Poor." In Why Does the Philippines Import Rice? Meeting the Challenge of Trade Liberalization. Eds. D. Dawe, P. Moya and C. Casiwan. Manila: Joint Publication of International Rice Research Institute (IRRI) and PhilRice.
Dawe, D. (2009): "Price Stabilization for Staple Foods: Costs and Benefits, Implications for Modeling, and Using Trade Policy as a Safety Net." FAO. Paper Prepared for the Meeting on Uncertainty and Price Volatility of Agricultural Commodities, Paris, June.
Dawe, D., S. Block, A. Gulati, J. Huang and S. Ito, Eds. (2011): "Domestic Rice Price, Trade, and Marketing Policies." Rice in the Global Economy: Strategic Research and Policy Issues for Food Security. International Rice Research Institute.
Dawe, D., P. Moya, C. Casiwan and J. Cabling (2006): "Better Banks and Paddy Wholesale Markets are the Key Reducing Rice Marketing Margins." In Why Does the Philippines Import Rice? Meeting the Challenge of Trade Liberalization. Eds. D. Dawe, P. Moya and C. Casiwan. Manila: Joint Publication of International Rice Research Institute and PhilRice: pp. 13-22.
de la Briere, B. (2011): "Targeting Social Safety Net Programs." Presentation for the SSN Core Course, World Bank, Washington, D.C.
Demeke, M., G. Pangrazio and M. Maetz (2008): "Country Responses to the Food Security Crisis: Nature and Preliminary Implications of the Policies Pursued." Agricultural Support Service, FAO, Rome.
Dorosh, P. (2009): "Price Stabilization, International Trade and National Cereal Stocks: World Price Shocks and Policy Response in South Asia." Food Security 1: 137-149.
FAO (2002): The State of Food Insecurity in the World 2011. Rome.
FAO (2012): "Rice Market Monitor." January 2012, Volume XV - Issue No. 1. Trade and Markets Division, UN Food and Agriculture Organization, Rome.
Faruqee, R. (2009): "Government Policy and Program for Strategic Grain Reserve in Malawi: Issues and Options." Report prepared for the World Bank., Washington, D.C.
Fuglie, K. (2009): "Agricultural Productivity in Sub-Saharan Africa." USDA, Economic Research Service. Paper presented at the Cornell University Symposium on the Food and Financial Crises and their Impact on the Achievement of the Millennium Development Goals, May 1-2, New York.
G20 (2011): "Price Volatility in Food and Agricultural Markets: Policy Responses." Policy Report for G20 with contributions by FAO, IFAD, IMF, UNCTAD, WFP, the World Bank, the WTO, IFPRI, and the UN HLTF. May 3.
Ganesh-Kumar, A., A. Gulati and R. Cummings (2008): "Reforming Foodgrains Management: Achieving Food Security with Cost-Effectiveness." Working Paper 27, Indira Gandhi Institute of Development Research, Mumbai.
Gentilini, U. (2007): Cash and Food Transfers: A Primer. The World Food Programme, Rome.

50
GMR (2012): Food Prices, Nutrition, and the Millennium Development Goals. Global Monitoring Report, World Bank, Washington, D.C.
Gouel, C. and S. Jean (2012): "Optimal Food Price Stabilization in a Small Open Developing Country." World Bank Policy Research Working Paper 5943, Washington, D.C.
Hanush, D. (2010): "A Possible Contribution of Food Reserves to Food Security in Djibouti." World Food Programme, Draft Report, October.
IEG (2011): "Social Safety Nets: An Evaluation of World Bank Support, 2000-2010." Independent Evaluation Group, World Bank, Washington, D.C.
Islam, N. and S. Thomas (1996): "Foodgrain Price Stabilization in Developing Countries." Food Policy Review 3, IFPRI, Washington, D.C.
Jayne, T., R. Myers and J. Nyoro (2008): "The Effects of NCPB Marketing Policies on Maize Market Prices in Kenya." Agricultural Economics 38: 313-325.
Jha, S. and A. Mehta (2008): "Effectiveness of Public Spending: The Case of Rice Subsidies in the Philippines." ADB Economic Working Paper Series, 138, Asian Development Bank, Manila.
Jha, S. and A. Mehta (2010): "Inclusiveness through Food Security: The Philippines’ National Food Program." In Poverty, Inequality and Inclusive Growth in Asia ed Zhuang, Juzhong. Asian Development Bank.
Jha, S. and B. Ramaswami (2010): "How Can Food Subsidies Work Better? Answers from India and the Philippines." Asian Development Bank Economics Working Paper Series 221, Manila.
Khera, R. (2011): "India's Public Distribution System: Utilization and Impact." Journal of Development Studies 47 (7).
Koester, U. (1986): "Regional Cooperation to Improve Food Security in Southern and Eastern African Countries." IFPRI Research Report 53, Washington, D.C.
Krandker, S., A. Khaleque and H. Samad (2011): "Can Social Safety Nets Alleviate Seasonal Deprivation? Evidence from Northwest Bangladesh." Policy Research Working Paper 5865, The World Bank, Washington, D.C.
Larson, D. and C. Gouel (2011): "Modeling Precautionary Storage." Presentation made at The Role of Public Stocks in Food Security seminar organized by the World Bank in Washington, D.C. on December 6.
Larson, D., J. Lampietti, C. Gouel, C. Cafiero and J. Roberts (2012): "Food Security and Storage in the Middle East and North Africa." Policy Research Working Paper 6031, The World Bank, Washington, D.C.
Lasco, M. C. (2005): "Dynamics of Agricultural Wages and Rice Prices in the Philippines." Master Thesis, Michigan State University.
Lynton-Evans, J. (1997): "Strategic Grain Reserves. Guidelines for their Establishment, Management and Operation." Agricultural Services Bulletin 126, Rome, http://www.fao.org/docrep/w4979e/w4979e00.htm.

51
Manasan, R. (2009): "Reforming Social Protection Policy: Responding to the Global Financial Crisis and Beyond." Philippine Institute for Development Studies, Discussion Paper Series 2008-22, Makati.
Martin, W. and K. Anderson (2011): "Export Restrictions and Price Insulations during Commodity Price Booms." American Journal of Agricultural Economics 94(2): 422-427.
McCulloch, N. and P. Timmer (2008): "Rice Policy in Indonesia: A Special Issue." Bulletin of Indonesian Economic Studies 44 (1): 33-44.
Mercier, S. and S. von Cramon-Taubadel (2012): "US and EU Farm Policies: What Happens Next?" Presentation sponsored by the Rural Policies Thematic Group at the World Bank in Washington, D.C. on February 16.
Mghenyi, E. (2006): "Food Pricing Policy, Rural Poverty, and the Distribution of Income: Insights from Maize in Kenya." Paper presented at the International Agricultural Economics Tri-Annual Meeting, Gold Coast, Australia, August 16.
Minot, N. (2011): "Food Price Volatility and the Management of Public Grain Stocks in Eastern and Southern Africa." Prepared for ARD, the World Bank, Washington, D.C.
Moya, P. and D. Dawe (2006): "Mechanization and Saving Labor Are the Keys to Making Rice More Competitive." In Why Does the Philippines Import Rice? Meeting the Challenge of Trade Liberalization Eds D. Dawe, P. Moya, and C. Casiwan. Manila: Joint Publication of International Rice Research Institute and PhilRice: 69-72.
Mude, A. and P. Kumar (2006): "Estimating the Welfare Impacts of Maize Price Policy in Kenya." Study presented at the World Bank Workshop on Poverty and Economic Growth, Washington, D.C.
Murphy, S. (2009): "Strategic Grain Reserves in an Era of Volatility." Institute for Agriculture and Trade Policy, October 2009.
Myers, R. (2006): "On The Costs of Food Price Fluctuations in Low-Income Countries." Food Policy 31(4): 288-301.
NEPAD (2004): "NEPAD Study to Explore Further Options for Food Security Reserve Systems in Africa." New Economic Partnership for Africa's Development with the technical support from the World Food Program.
Newbery, D. and J. Stiglitz (1981): The Theory of Commodity Price Stabilization: A Study in the Economics of Risk. Oxford: Clarendon.
Nkonde, C., N. Mason, N. Sitko and T. Jayne (2011): "Who Gained and Who Lost from Zambia's 2010 Maize Marketing Policies?" Food Security Research Project Working Paper 49, Lusaka, Zambia.
Pardey, P., J. Alston and R. Piggott, Eds. (2006): "Agricultural R&D in the Developing World: Too Little, Too Late?" International Food Policy Research Institute, Washington, D.C.
Prakash, A., Ed. (2011): "Safeguarding Food Security in Volatile Global Markets." FAO, Rome.
Rashid, S. (2011): "Public Foodgrain Stock Management Policies in Bangladesh." International Food and Policy Research Institute. Presentation made at The Role of Public Stocks in Food Security seminar organized by the World Bank in Washington, D.C., December 6.

52
Rashid, S. and S. Lemma (2011): "Strategic Grain Reserves in Ethiopia: Institutional Design and Operational Performance." IFPRI Discussion Paper 01054, Washington, D.C.
Rhee, C. (2011): "Food Price Inflation, Poverty, and Inclusive Growth in Asia." Presentation of the Chief Economist of ADB at the Commodity Price Volatility and Inclusive Growth in LICs workshop in Washington, D.C.
Rohrbach, D., R. Faruqee, M. Sadler and C. Baker (2010): "Optimal Grain Reserve Strategies for Malawi." Discussion Paper, World Bank, Washington, D.C.
Sabates-Wheeler, R. and S. Devereux (2010): "Cash Transfers and High Food Prices: Explaining Outcomes on Ethiopia's Productive Safety Net Program." Future Agricultures Working Paper, London.
Shepherd, A. (2011): "Lessons Learned from the Management of Public Stocks in East Asia." Background Paper for the Economic Sector World Managing Public Stocks for Food Security, World Bank, Washington, D.C.
Srinivasan, P. and S. Jha (2001): "Liberalized Trade and Domestic Price Stability: The Case of Rice and Wheat in India." Journal of Development Economics 65 (2): 2-24.
Tangermann, S. (2011): "Policy Solutions to Agricultural Market Volatility: A Synthesis." Issue Paper 33, International Centre for Trade and Sustainable Development.
Thangata, P. and S. Lemma (2010): "Price Stabilization and Strategic Grain Reserves: The Case of Malawi." Presentation at the Risk Management in African Agriculture: Taking Stock of What Has and Hasn't Worked African Agricultural Markets Program, Lilongwe, Malawi, November 5.
Timmer, P. (1996): "Does Bulog Stabilize Rice Prices? Should It Try?" Bulletin of Indonesian Economic Studies 32(2): 45-74.
Timmer, P. (2004): "Food Security in Indonesia: Current Challenges and the Long-Term Outlook." Working Paper 48, Center for Global Development, Washington, D.C.
Tolentino, V., J. Bruce and B. De La Pena (2011): "Stymied Reforms in Rice Marketing in the Philippines, 1980-2009." Chapter 7 in Built on Dreams: Grounded on Reality. Economic Policy Reform in the Philippines. The Asia Foundation.
USDA (2012): "World Agricultural Supply and Demand Estimates." March 9, 2012. The United States Department of Agriculture, Washington, D.C.
Warr, P. (2005): "Food Policy and Poverty in Indonesia: A General Equilibrium Analysis." Australian Journal of Agricultural Resource and Economics 49(4): 429-451.
WDR (2007): World Development Report 2008: Agriculture for Development. World Bank, Washington, D.C.
WFP (2011): "Emergency Humanitarian Food Reserves: Feasibility Study, Cost-Benefit Analysis and Proposal for Pilot Program." World Food Programme, September 14, Rome.
World Bank (2006): "Managing Food Price Risks and Instability in an Environment of Market Liberalization.' Agriculture and Rural Development Department, World Bank, Washington, D.C.

53
World Bank (2007): "Philippines: Agriculture Public Expenditure Review." Technical Working Paper, Manila and Washington, D.C.
World Bank (2008): "Regional Trade in Food Staples: Prospects for Stimulating Agricultural Growth and Moderating Food Security Crises in Eastern and Southern Africa." Agriculture and Rural Development, World Bank Africa Region, Report 46929-AFR, Washington, D.C.
World Bank (2011): "MNA Facing Challenges and Opportunities: Regional Economic Update." World Bank, Washington, D.C.
World Bank (2012a): "Food Reserves in Zambia: How to Use Them Better for Poverty Reduction and Diversification?" Presentation to the Government of Zambia as a part of the TA on Agricultural Policy Reforms, Washington, D.C., and Lusaka.
World Bank (2012b): "Responding to Higher and More Volatile Global Food Prices." Economic Sector Work, Agriculture and Rural Development Department, World Bank, Washington, D.C.
World Bank (2012c): "Targeting Poor and Vulnerable Households in Indonesia." Working Paper 67218, World Bank, Washington, D.C.
World Bank and FAO (2012): "The Grain Chain: Food Security and Managing Wheat Imports in Arab Countries." Washington, D.C. and Rome.
World Bank, NRI and FAO (2011): "Missing Food: The Case of Postharvest Losses in Sub-Saharan Africa." Report 60371-AFR, ARD/AFTAR World Bank, UK Natural Resource Institute, and UN FAO.
Wright, B. (2009): "International Grain Reserves and Other Instruments to Address Volatility in Grain Markets." Policy Research Working Paper 5028, World Bank, Washington, D.C.
Wright, B. (2011): "Price Volatility in Agricultural Commodities: Market Fundamentals." Presentation at the Forum for Agricultural Risk Management in Development in Zurich, June 9.
Yemtsov, R. (2011): "Weaving the SSN Poverty and Vulnerability Assessments: Overview of Concepts and Methods." Presentation for the SSN Core Course, World Bank, Washington, D.C.
