using oil fields for the disposal of concentrate · using oil fields for the disposal of...
TRANSCRIPT

Please Pass the Salt:Using Oil Fields for the Disposal
of Concentrate
Robert E. MaceTexas Water Development Board
Jean-Philippe NicotBureau of Economic Geology
September 29, 2004Bureau of Reclamation

The problem:
• Communities interested in desalination need a cost-effective and safe solution for disposing of concentrate.

A possible solution:
• Inject concentrate into depleted oil fields.

Goal of the project:To develop the scientific foundation upon which we cansupport recommended policy change to allow an easierapproval path for permitting concentrate injection wells in oil fields.
• Show location of oil fields across state that may be potential injection sites.
• Show through physical and geochemical modeling that oil fields can accept concentrate.
• Make a recommendation on how to streamline permitting.

TECHNICAL APPROACHTECHNICAL APPROACHIdentify depleted oil and gas fieldsIdentify depleted oil and gas fieldsHistorical perspective on fluid injection in Historical perspective on fluid injection in oil and gas fields in Texasoil and gas fields in TexasCharacteristics of analysis areasCharacteristics of analysis areasCharacteristics of concentratesCharacteristics of concentratesFormation damageFormation damage
ScalingScalingClay sensitivityClay sensitivity
Formation damage controlFormation damage controlInjection ratesInjection rates

IDENTIFYIDENTIFYDEPLETED OIL AND GAS DEPLETED OIL AND GAS
FIELDSFIELDS
0 100 200 300 mi
0 100 200 300 400 km
Major oil reservoirsMajor gas reservoirs
N
Aquifer
Injection Formation
Formation Pressure Head
Minimum 500-ft Separation
Depth to BUQW
WaterWell
OilWell Ground Surface
Aquifer
Injection Formation
Formation Pressure Head
Minimum 500-ft Separation
Depth to BUQW
WaterWell
OilWell Ground Surface
�����������
������ �����������
��������
�����������
���������
�����������
�������������
�����
�����
�����
����������
�������� ����������������������������������������
������ ���� ������ ������ ����
�������������
�� ��������������������������� ��������
�������� �� ��� �������� �� ��� �������� �� ���
������ � ����� ����� �����
�������� ��� ������ ��� �� ���
���� ���� ������ ����� ���
������������
���������
������������
��� ���������
���������
� ��� ���
��� �������
�����������
��� ������ ������ ���
������� ������� ������
����������������
����� ��
���
�����
��
���� �� ���
�����
�������
�����
������
���� �����
��������
����
���������
��������
�������
��������
�����
�� ��
��������
����������
!��
�� ���� ��
������
�����
�����
������ ������ ������
�� ��
��������
�������
���������
����� �����
��� " �������
�����
��
�������
���������
����
�����
���������� ����������"
���������������#
���� ������#
�� ��
������������
����� �����
�����
��
����
���
����"
��� �
����
�����
���
�����
�
������
�� � ������
������
����������
�������� ���
�� ����
�������
��� �������
�������� ���"����� �������� ��������
��� �������
��� �������
������� �������
�������� ��������$�������%
����������� ������
�������
��� ��������
�������� #
��� �������
����� ����� ������ �# �����
��� ������ ���
�� ���� �� ����
���� �������� ���
���� �������� �#
������ ������
������ ������ ����������
������������
�������� �������� �������� ��������
������
� �������
�� ��
�� � �������� � ��������� ���
������ � ������
�� � ��������� ���
����� ����� ����� �� ����� �����
������ ������
����������
�����
���
��
�����
����
�����
�����
���������
�������
���
����
���
���
���
��
����
�
����
���������
�����
�
�����
�
�������
�����
������
����
�
�� ������ ���������� ���������� ����
�������� �� ���
���� �������� ���
&&
�������� �� ��������� ����
�� ���
�� ����
� �
� ���''()'$�%*
&��������
�+!���,�-�+-.!�+!/+! !�� �+!.���0!���.�-121.���0!�/+�31-����
�����
�����
����
����
�����
����
Pressure Depletion and AORPressure Depletion and AORMinTOF - MaxBUQW; Permian Basin
0%
5%
10%
15%
20%
25%
30%
-5000
-3500-200
0-500100025
0040
00550070
0085
00
Separation (ft)
Per
cent
N=436
MinTOF - MaxBUQW; Anadarko Basin
0%
5%
10%
15%
20%
25%
30%
-5000-350
0-200
0-50010
00250040
0055
00700085
00
Separation (ft)
Per
cent
N=18
MinTOF - MaxBUQW; East Texas Basin
0%
5%
10%
15%
20%
25%
30%
-5000-350
0-200
0-50010
00250040
0055
00700085
00
Separation (ft)
Per
cent
N=139
MinTOF - MaxBUQW; Fort Worth Basin
0%
5%
10%
15%
20%
25%
30%
-5000-350
0-2000 -500100025
00400055
00700085
00
Separation (ft)
Per
cent
N=285
MinTOF - MaxBUQW; Maverick Basin
0%
5%
10%
15%
20%
25%
30%
-5000
-3500-200
0-500100025
0040
00550070
0085
00
Separation (ft)
Per
cent
N=121
MinTOF - MaxBUQW; Southern Gulf Coast Basin
0%
5%
10%
15%
20%
25%
30%
-5000
-3500-200
0-5
0010
00250040
005500700085
00
Separation (ft)
Per
cent
N=356
67% 50% 57%
63% 36% 56%% values represent percentage of fields candidates for a AOR variance

Why Do We Care about Pressure Why Do We Care about Pressure Depletion?Depletion?
Create opportunity to inject fluid with little Create opportunity to inject fluid with little risk of exceeding maximum pressure that risk of exceeding maximum pressure that can be sustained by reservoircan be sustained by reservoirSimplify Area of Review ProcessSimplify Area of Review ProcessField production history guarantees Field production history guarantees surface infrastructure needed to move surface infrastructure needed to move around fluidsaround fluids

Major Oil and Gas ReservoirsMajor Oil and Gas Reservoirs
0 100 200 300 mi
0 100 200 300 400 km
Major oil reservoirsMajor gas reservoirs
N
1
234
5
6
Analysis AreasAnalysis Areas
1 Anadarko1 Anadarko2 Permian2 Permian3 East Texas3 East Texas4 Fort Worth4 Fort Worth5 Maverick5 Maverick6 Southern 6 Southern
Gulf CoastGulf Coast

SelectedSelectedStratiStrati--
graphic graphic ColumnsColumnsin Texas in Texas with Oil with Oil
ProductionProduction��� ����
��''()'$�%*
��������
���� ��������
�� �������������
��������������
���� ������ ����
�������$��� ���% ��� ���
����� �����
�������������
������������
������� �������
����
�������
���� ���� ���� ����
4��� �� 4��� �������$�������%���� ������������������������������ �������������
����� ����� �������� ��� ���
�������� �������������������������� �����
�����5� �����5������5������6 �����6�����6
����� ����������
������� ������� ������������������������
�����������
������ ������������
��� ���
����
���������� ����������
�� ����� ��� �� ���
������
����� �������
�������
6��
���"���
������
��������� �� �������� ������
�������� ����������������
"���
"���
�� ��
�����
������������������������ ����
����6������������ ������� ����
�� ����������
�� ����
� ���
������ ������
��� ������ ���
�����$ ����%���� ���� ���� ����
�� ��� �� �������� ����$�� ���%
������������$ ����������� ��% ������������ ������������
����� ����� �������
������� ���������� ���
��������
������������� ������������� �������������
�������
������
������
�����
�������
����
��
��
������
�����
�����
��
���
�
�����
���
��������
��
������
������
!��
������
�����
�����
� �
������� �������
��������
���������
��"����� ����
����
� �����
��������� ���
4�� ��� ���
������ ������������ ������� �������
����
�
���������
&
���������
�����"���� ����
������� ��������������
�������
�������
2�..��+�� �.��!3+! !+0��+ ���.7
������������� �������� ���������� ����������� ��������� ����������
�����������
������ �����������
��������
�����������
���������
�����������
�������������
�����
�����
�����
����������
�������� ����������������������������������������
������ ���� ������ ������ ����
�������������
�� ��������������������������� ��������
�������� �� ��� �������� �� ��� �������� �� ���
������ � ����� ����� �����
�������� ��� ������ ��� �� ���
���� ���� ������ ����� ���
������������
���������
������������
��� ���������
���������
� ��� ���
��� �������
�����������
��� ������ ������ ���
������� ������� ������
����������������
����� ��
���
�����
��
���� �� ���
�����
�������
�����
������
���� �����
��������
����
���������
��������
�������
��������
�����
�� ��
��������
����������
!��
�� ���� ��
������
�����
�����
������ ������ ������
�� ��
��������
�������
���������
����� �����
��� " �������
�����
��
�������
���������
����
�����
���������� ����������"
���������������#
���� ������#
�� ��
������������
����� �����
�����
��
����
���
����"
��� �
����
�����
���
�����
�
������
�� � ������
������
����������
�������� ���
�� ����
�������
��� �������
�������� ���"����� �������� ��������
��� �������
��� �������
������� �������
�������� ��������$�������%
����������� ������
�������
��� ��������
�������� #
��� �������
����� ����� ������ �# �����
��� ������ ���
�� ���� �� ����
���� �������� ���
���� �������� �#
������ ������
������ ������ ����������
������������
�������� �������� �������� ��������
������
� �������
�� ��
�� � �������� � ��������� ���
������ � ������
�� � ��������� ���
����� ����� ����� �� ����� �����
������ ������
����������
�����
���
��
�����
����
�����
�����
���������
�������
���
����
���
���
���
��
����
�
����
���������
�����
�
�����
�
�������
�����
������
����
�
�� ������ ���������� ���������� ����
�������� �� ���
���� �������� ���
&&
�������� �� ��������� ����
�� ���
�� ����
� �
� ���''()'$�%*
&��������
�+!���,�-�+-.!�+!/+! !�� �+!.���0!���.�-121.���0!�/+�31-����
�����
�����
����
����
�����
����

Target FormationsTarget Formations
Anadarko B.: Anadarko B.: Granite Wash Fm.Granite Wash Fm.
Permian B.:Permian B.:San Andres Fm.San Andres Fm.
East Texas B.:East Texas B.:Woodbine Fm.
Fort Worth B.:Fort Worth B.:Atoka Fm.Atoka Fm.
Maverick B.:Maverick B.:San Miguel/San Miguel/OlmosOlmos Fm.Fm.
Southern Gulf Coast B.:Southern Gulf Coast B.:Frio Fm. Woodbine Fm. Frio Fm.

PressurePressure--depleted Fieldsdepleted FieldsSouthern Gulf Coast Basin
BHP = (1/465)DR2 = 0.975
0
1,000
2,000
3,000
4,000
5,000
6,000
7,000
8,000
0 500 1,000 1,500 2,000 2,500 3,000 3,500 4,000
Bottom Hole Pressure (psig)
Dep
th b
elow
Gro
und
Surf
ace
(ft)
East Texas Basin
D=(1/0.460)DR2 = 0.84
0
1,000
2,000
3,000
4,000
5,000
6,000
0 500 1,000 1,500 2,000 2,500 3,000
Bottom Hole Pressure (psig)
Dep
th b
elow
Gro
und
Surf
ace
(ft)
Permian Basin
BHP= (1/0.403)DR2 = 0.409
0
1,000
2,000
3,000
4,000
5,000
6,000
7,000
0 500 1,000 1,500 2,000 2,500 3,000
Bottom Hole Pressure (psig)
Dep
th b
elow
Gro
und
Surf
ace
(ft)

HISTORICAL HISTORICAL PERSPECTIVEPERSPECTIVE
ON OIL AND GAS ON OIL AND GAS FIELDS IN TEXASFIELDS IN TEXAS

Water Injection in Water Injection in Oil&GasOil&Gas FieldsFieldsReservoir drive mechanisms in Reservoir drive mechanisms in oil&gasoil&gas fields:fields:
Water driveWater driveGas cap driveGas cap driveSolution gas driveSolution gas drive
Pressure maintenance and Pressure maintenance and waterfloodingwaterflooding with with fresh, brackish, or produced watersfresh, brackish, or produced watersFresh water needs no treatment before Fresh water needs no treatment before injectioninjectionFresh water reduces or eliminates scaling in Fresh water reduces or eliminates scaling in pipes but could generate pipes but could generate downholedownhole scaling scaling and/or fine pluggingand/or fine plugging
Source for figure: http://www.kgs.ukans.edu/Publications/Oil

Injection Historical DataInjection Historical Data
Data compilation up to 1982Data compilation up to 1982
0
2
4
6
8
10
12
Anadark
o B.
Permian B
.
East Texa
s B.
Fort Wort
h B.
Maveric
k B.
Sth. Gulf C
oast B
.Cum
ulat
ive
Inje
ctio
n (b
illio
n bb
ls)
Water >3,500ppmWater <3,500ppm
0
5
10
15
20
25
30
35
Anadark
o B.Perm
ian B.
East Texa
s B.
Fort Wort
h B.
Maveric
k B.
Sth. Gulf C
oast B
.All D
istric
tsCum
ulat
ive
Inje
ctio
n (b
illio
n bb
ls)
Water >3,500ppmWater <3,500ppm
From RRC database (1982) – last year with data compilation

ConclusionsConclusions
Oil and Gas industry in Texas has an Oil and Gas industry in Texas has an extensive experience with fluid injectionextensive experience with fluid injectionFluids include fresh, brackish and saline Fluids include fresh, brackish and saline waterswaters
Source: Hycal.com

SELECTSELECTANALYSIS AREASANALYSIS AREAS
0 100 200 300 mi
0 100 200 300 400 km
Major oil reservoirsMajor gas reservoirs
N
0 100 200 300 Miles
Injection Well Depth
<3450 ft
3451 - 6100 ft
>6100 ft
Counties with unmet needs
§
0 250 500125 Miles

Analysis Area Selection CriteriaAnalysis Area Selection Criteria
Counties with depleted oil/gas fieldsCounties with depleted oil/gas fieldsCounties with a predicted shortfall of water Counties with a predicted shortfall of water supply over the next 50 yearssupply over the next 50 yearsCounties with brackish ground water Counties with brackish ground water resourcesresourcesCounties with injection wells not too deepCounties with injection wells not too deep

County Water NeedsCounty Water Needs
Cities
County Water NeedsMetUnmet
0 100 200 300 Miles
Target Locations
Source: TWDB, 2002 Water for Texas
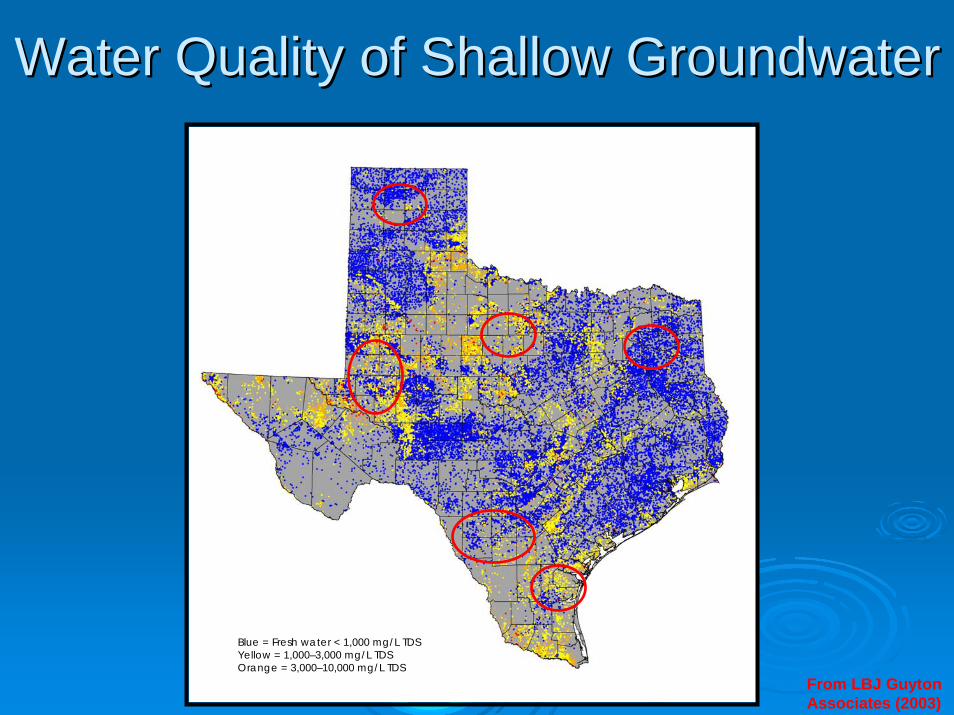
Water Quality of Shallow GroundwaterWater Quality of Shallow Groundwater
Blue = Fresh water < 1,000 mg/L TDSYellow = 1,000–3,000 mg/L TDSOrange = 3,000–10,000 mg/L TDSRed = > 10,000 mg/L TDS From LBJ Guyton
Associates (2003)

Target Brackish Water SourcesTarget Brackish Water Sources
Anadarko B.: Anadarko B.: Ogallala Ogallala AqAq..DockumDockum AqAq..Permian B.:Permian B.:Ogallala Ogallala AqAq..DockumDockum AqAq..East Texas B.:East Texas B.:CarrizoCarrizo--Wilcox Wilcox AqAq.
Fort Worth B.:Fort Worth B.:Trinity Trinity AqAq..
Maverick B.:Maverick B.:CarrizoCarrizo--Wilcox Wilcox AqAq..
Southern Gulf Coast B.:Southern Gulf Coast B.:Gulf Coast Gulf Coast AqAq.. .

CHARACTERISTICSCHARACTERISTICSOFOF
ANALYSIS AREASANALYSIS AREAS

Important ParametersImportant ParametersLithologyLithology/Mineralogy:/Mineralogy:
Rock typeRock typeMineral in contact with flowing fluidsMineral in contact with flowing fluidsClay content and natureClay content and nature
Formation water compositionFormation water compositionFlow properties:Flow properties:
Porosity, permeabilityPorosity, permeabilityOther fluid present (relative permeability)Other fluid present (relative permeability)
Field characteristicsField characteristicsPay thicknessPay thicknessGeothermal gradientGeothermal gradientAverage pressure and depthAverage pressure and depth

Mineralogical CharacteristicsMineralogical Characteristicsof Analysis Areasof Analysis Areas
BasinBasin Rock TypeRock Type Important MineralsImportant Minerals
AnadarkoAnadarko SilicoSilico--clasticclastic Feldspars, quartz, claysFeldspars, quartz, clays
PermianPermian CarbonateCarbonate Calcite, dolomiteCalcite, dolomite
East TexasEast Texas SilicoSilico--clasticclastic Feldspars, quartz, claysFeldspars, quartz, clays
Fort WorthFort Worth SilicoSilico--clasticclastic Quartz, feldsparsQuartz, feldspars
MaverickMaverick SilicoSilico--clasticclastic Quartz, feldsparsQuartz, feldspars
S. Gulf CoastS. Gulf Coast SilicoSilico--clasticclastic Feldspars, quartz, claysFeldspars, quartz, clays

Porosity/PermeabilityPorosity/Permeabilityof Analysis Areasof Analysis Areas
East Texas Basin
10
100
1000
10000
15 20 25 30 35 40
Porosity (%)
Perm
eabi
lity
(md)
Permian Basin
0.1
1
10
100
1000
0 5 10 15 20 25
Porosity (%)
Perm
eabi
lity
(md)
Southern Gulf Coast Basin
10
100
1000
10000
15 20 25 30 35 40
Porosity (%)
Perm
eabi
lity
(md)
Fort-Worth Basin
1
100
10000
0 5 10 15 20 25 30
Porosity (Percent)
Perm
eabi
lity
(mD
)

Median and Range of Median and Range of Porosity/PermeabilityPorosity/Permeability
BasinBasin Porosity (%)Porosity (%) Permeability Permeability ((mDmD))
AnadarkoAnadarko ~12 (4 ~12 (4 -- 20)20) ~20 (6 ~20 (6 –– 65)65)
PermianPermian ~9.3 (<3 ~9.3 (<3 -- >20)>20) ~5 (1 ~5 (1 -- >100)>100)
East TexasEast Texas ~25 (20 ~25 (20 -- >35)>35) ~500 (15 ~500 (15 -- >3,000)>3,000)
Fort WorthFort Worth ~14.5 (6 ~14.5 (6 –– 28)28) ~20 (1 ~20 (1 -- >1,000>1,000
MaverickMaverick ~25 (19 ~25 (19 --32)32) ~30 (3 ~30 (3 -- >2,000)>2,000)
S. Gulf CoastS. Gulf Coast ~25 (<15 ~25 (<15 -- >35)>35) ~305 (20 ~305 (20 -- >1,000)>1,000)

CHARACTERISTICSCHARACTERISTICSOFOF
CONCENTRATESCONCENTRATES
2 MGD Oceanside, CA RO Installation
12 MGD Sarasota, FL EDR plantFrom R.W. Beck

ConcentrateConcentrateMost feed water TDS between 1,000 and Most feed water TDS between 1,000 and 3,000 mg/L3,000 mg/LConcentration factor of 4 (all ions have the Concentration factor of 4 (all ions have the same rejection rate)same rejection rate)Closed system (no equilibration with COClosed system (no equilibration with CO22))Two cases:Two cases:
Addition of Addition of antiscalantantiscalantAddition of Addition of antiscalantantiscalant and sulfuric acid to a and sulfuric acid to a pH=6pH=6
Difficulty in obtaining minor element (Difficulty in obtaining minor element (SiSi, , Fe, Fe, BaBa, , SrSr) concentrations) concentrations

FORMATION DAMAGEFORMATION DAMAGE

Formation Damage DefinitionsFormation Damage Definitions
A condition that occurs when barriers to A condition that occurs when barriers to flow develop in the nearflow develop in the near--wellborewellbore region. region. Results in lower than expected production Results in lower than expected production rate from (or injection rate into) rate from (or injection rate into) Any process causing a reduction in the Any process causing a reduction in the natural inherent productivity or natural inherent productivity or injectivityinjectivity of of a producing or injection wella producing or injection well

Mechanical Formation DamageMechanical Formation DamageOrigin: injected suspended solids, formation Origin: injected suspended solids, formation fine migration plugging pore throatsfine migration plugging pore throats
Fines bridgedat pore
restrictions
Fluid flowMobilefines
Mod. From Michael DixonOMNI Laboratories, Inc.

Chemical Formation DamageChemical Formation Damage
Origin1: Origin1: deflocculationdeflocculation of clays, swelling of of clays, swelling of clays due to chemical changes (pH, ionic clays due to chemical changes (pH, ionic makeup) makeup) Origin2: formation of Origin2: formation of scales due to mixing of scales due to mixing of incompatible water and incompatible water and change in environmental change in environmental conditionsconditions
Pore throats
Pore
Pore throats
Pore
Flocculated
Deflocculated
Mod. From Michael DixonOMNI Laboratories, Inc.

SCALINGSCALING
UCLA, Cohen et al

What is scaling?What is scaling?
Precipitation of minerals in the Precipitation of minerals in the wellborewellbore or or in the formation.in the formation.Calcite, gypsum, barite, silica (iron oxides, Calcite, gypsum, barite, silica (iron oxides, brucitebrucite, siderite, anhydrite, , siderite, anhydrite, strontianitestrontianite))Term also applies to corrosion productsTerm also applies to corrosion productsFluid injection is typically less scaleFluid injection is typically less scale--prone prone than productionthan production
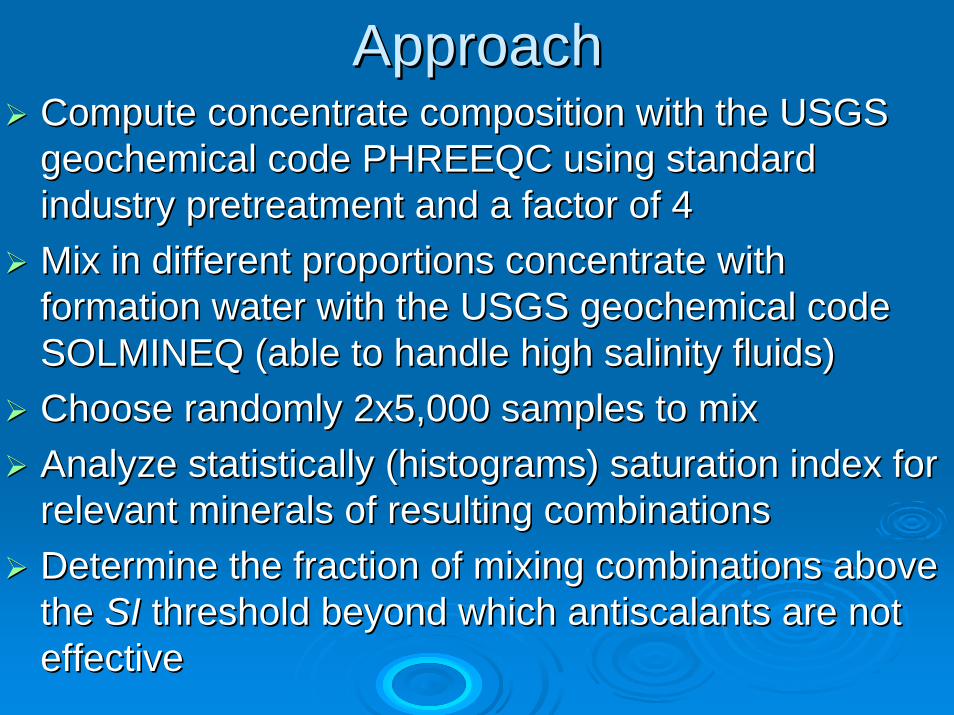
ApproachApproachCompute concentrate composition with the USGS Compute concentrate composition with the USGS geochemical code PHREEQC using standard geochemical code PHREEQC using standard industry pretreatment and a factor of 4industry pretreatment and a factor of 4Mix in different proportions concentrate with Mix in different proportions concentrate with formation water with the USGS geochemical code formation water with the USGS geochemical code SOLMINEQ (able to handle high salinity fluids)SOLMINEQ (able to handle high salinity fluids)Choose randomly 2x5,000 samples to mixChoose randomly 2x5,000 samples to mixAnalyze statistically (histograms) saturation index for Analyze statistically (histograms) saturation index for relevant minerals of resulting combinationsrelevant minerals of resulting combinationsDetermine the fraction of mixing combinations above Determine the fraction of mixing combinations above the the SISI threshold beyond which threshold beyond which antiscalantsantiscalants are not are not effectiveeffective

Examples of Examples of SISI HistogramsHistogramsPermian Basin - Mixed Water - Calcite SI
0.00
0.02
0.04
0.06
0.08
0.10
0.12
0.14
0.16
-1 -0.5 0 0.5 1 1.5 2 2.5 3Saturation Index
Number of bins: 41; Bin size: 0.1; Number of data points: 20,000
Prob
abili
ty
East Texas Basin - Mixed Water - Calcite SI
0.00
0.05
0.10
0.15
0.20
0.25
0.30
-2 -1.5 -1 -0.5 0 0.5 1 1.5 2Saturation Index
Number of bins: 41; Bin size: 0.1; Number of data points: 19,580
Prob
abili
ty
South. Gulf Coast Basin - Mixed Water - Calcite SI
0.00
0.02
0.04
0.06
0.08
0.10
0.12
0.14
-2 -1.5 -1 -0.5 0 0.5 1 1.5 2Saturation Index
Number of bins: 41; Bin size: 0.1; Number of data points: 19,999
Prob
abili
ty
South. Gulf Coast Basin - Mixed Water - Gypsum SI
0.00
0.02
0.04
0.06
0.08
0.10
0.12
-2 -1.5 -1 -0.5 0 0.5 1 1.5 2Saturation Index
Number of bins: 41; Bin size: 0.1; Number of data points: 19,999
Prob
abili
ty
Permian Basin - Mixed Water - Gypsum SI
0.00
0.05
0.10
0.15
0.20
0.25
0.30
0.35
-1 -0.5 0 0.5 1 1.5 2 2.5 3Saturation Index
Number of bins: 41; Bin size: 0.1; Number of data points: 19,990
Prob
abili
ty
East Texas Basin - Mixed Water - Gypsum SI
0.00
0.05
0.10
0.15
0.20
0.25
-2 -1.5 -1 -0.5 0 0.5 1 1.5 2Saturation Index
Number of bins: 41; Bin size: 0.1; Number of data points: 19,349
Prob
abili
ty
Permian Basin - Mixed Water - Barite SI
0.00
0.00
0.00
0.01
0.01
0.01
0.01
0.01
-2 -1.5 -1 -0.5 0 0.5 1 1.5 2Saturation Index
Number of bins: 41; Bin size: 0.1; Number of data points: 2,300
Prob
abili
ty
East Texas Basin - Mixed Water - Barite SI
0.000.000.000.000.000.000.000.000.000.000.00
-1 -0.5 0 0.5 1 1.5 2 2.5 3 3.5 4Saturation Index
Number of bins: 51; Bin size: 0.1; Number of data points: 320
Prob
abili
ty
South. Gulf Coast Basin - Mixed Water - Barite SI
0.00
0.00
0.00
0.01
0.01
0.01
0.01
-3 -2.5 -2 -1.5 -1 -0.5 0 0.5 1 1.5 2 2.5 3Saturation Index
Number of bins: 61; Bin size: 0.1; Number of data points: 4,128
Prob
abili
ty
South. Gulf Coast Basin - Mixed Water - Silica SI
0.00
0.02
0.04
0.06
0.08
0.10
0.12
0.14
0.16
-3 -2.5 -2 -1.5 -1 -0.5 0 0.5 1Saturation Index
Number of bins: 41; Bin size: 0.1; Number of data points: 18,043
Prob
abili
ty
East Texas Basin - Mixed Water - Silica SI
0.00
0.02
0.04
0.06
0.08
0.10
0.12
0.14
-2 -1.5 -1 -0.5 0 0.5 1 1.5 2Saturation Index
Number of bins: 41; Bin size: 0.1; Number of data points: 14,232
Prob
abili
ty
Permian Basin - Mixed Water - Silica SI
0.00
0.02
0.04
0.06
0.08
0.10
0.12
-2 -1.5 -1 -0.5 0 0.5 1 1.5 2Saturation Index
Number of bins: 41; Bin size: 0.1; Number of data points: 17,692
Prob
abili
ty
With acidified concentrate

Summary of Summary of SISI’’ss of Mixing of Mixing CombinationsCombinations
Most Most SISI are <1 are <1 including including amorphous amorphous (colloidal) silica(colloidal) silicaBarite may be a Barite may be a problem locally (problem locally (SISIis also higher is also higher because of Hbecause of H22SOSO44))
-2-1.5
-1-0.5
0
0.51
1.52
Cal
cite
Anad
arko
G
ypsu
mBa
rite
Cal
cite
Perm
ian
Gyp
sum
Barit
eC
alci
teEa
st T
exas
G
ypsu
mBa
rite
Cal
cite
Fort
Wor
th
Gyp
sum
Barit
eC
alci
teM
aver
ick
Gyp
sum
Barit
eC
alci
teSo
ut.G
ulf C
oast
G
ypsu
mBa
rite
Satu
ratio
n In
dex
Median and 95th percentileWith acidified concentrate

Scaling DiscussionScaling Discussion
Previous results assume thorough mixing Previous results assume thorough mixing between concentrate and formation waterbetween concentrate and formation waterThis is conservative because mixing is This is conservative because mixing is likely to be less than thorough owing to likely to be less than thorough owing to ~piston flow of concentrate displacing ~piston flow of concentrate displacing formation water formation water

CLAY SENSITIVITYCLAY SENSITIVITY
Source: hycal.com

What is Clay Sensitivity?What is Clay Sensitivity?Clay sensitivity is due to the ability of clays to Clay sensitivity is due to the ability of clays to exchange ions with surroundings and/or to exchange ions with surroundings and/or to absorb water (swelling)absorb water (swelling)A change in environmental conditions (ionic A change in environmental conditions (ionic makeup, salinity, pH) may also disperse clay makeup, salinity, pH) may also disperse clay particles (particles (deflocculationdeflocculation))
Before injection, two Before injection, two questions need to be questions need to be answered:answered:
Is there any clay?Is there any clay?What type of clay?What type of clay?
High salinityHigh DivalentLow pH
Low salinityLow DivalentHigh pH
Flocculation
++
+
+
++
----- -
+
+
+
+
+
+
+
-- -
---
Deflocculation
Mod. From Michael Dixon OMNI Laboratories, Inc.

Clay Types in Analysis AreasClay Types in Analysis Areas
BasinBasin Clay Clay AbundanceAbundance Clay TypeClay Type
AnadarkoAnadarko Chlorite, Chlorite, illiteillite , , kaolinitekaolinite
PermianPermian RareRare KaoliniteKaolinite
East TexasEast Texas CommonCommon SmectiteSmectite, , illiteillite, chlorite, , chlorite, kaolinitekaolinite
Fort WorthFort Worth Chlorite, Chlorite, illiteillite, , kaolinitekaolinite
MaverickMaverick AbundantAbundantMxMx--layer layer illiteillite--smectitesmectite,,chlorite, chlorite, kaolinitekaolinite
S. Gulf CoastS. Gulf Coast AbundantAbundant MxMx--layer layer illiteillite--smectitesmectite, , smectitessmectites, , kaolinitekaolinite

Clay Sensitivity PrinciplesClay Sensitivity Principles
10
100
1,000
10,000
0% 10% 20% 30%
Divalent Cations (% of TCC)
Tota
l Cat
ion
Con
cent
ratio
n (m
eq/L
)
SmMxIlKa
Ka=kaoliniteIl=illiteMx=mixed layers; Sm=smectiteTCC=Total Cation Conc.
Any water inside the delineated domain will deflocculate the corresponding clay at equlibrium.
Possible cation stripping and deflocculation in the transient stage
Frio Formation - South Texas - San Patricio Cty
1
10
100
1000
10000
0% 5% 10% 15% 20% 25% 30%
Divalent Cations (% of TCC)To
tal C
atio
n C
once
ntra
tion
(meq
/L)
SmMxIlKa
<4,000ft <5,000ft <6,000ft <7,000ft<9,000ft <11,000ft >11,000ft no depth data
Plot mod. from Scheuerman and Bergersen, 1990, SPE Paper No. 18461

MAR Study: East TX B. Analysis A.MAR Study: East TX B. Analysis A.Carrizo-Wilcox and Woodbine Formations
1
10
100
1000
10000
0% 10% 20% 30% 40% 50% 60% 70%
Divalent Cations (% of TCC)
Tota
l Cat
ion
Conc
entra
tion
(meq
/L)
East Texas Basin - CZWX Concentrate MAR / Woodbine Fm. MAR
0.00
0.05
0.10
0.15
0.20
0 0.5 1 1.5 2 2.5 3Mass Action Ratio (MAR) Ratio
Number of bins: 31; Bin size: 0.1; Number of trials: 100,000P
roba
bilit
y
MAR Ratio =MAR Ratio ={[Na]{[Na]22/[Ca]}/[Ca]}concconc/ {[Na]/ {[Na]22/[Ca]}/[Ca]}formformIf MAR Ratio <0.5, problems areIf MAR Ratio <0.5, problems areexpected for expected for smectitesmectite clayclay

FORMATION DAMAGE FORMATION DAMAGE CONTROLCONTROL

Chemical and Physical SolutionsChemical and Physical SolutionsMatrix Matrix acidizingacidizing by by HClHCl, H, H22SOSO44 (both for (both for carbonates), HF (for silicates), organic acids carbonates), HF (for silicates), organic acids Treatment with KOH and Treatment with KOH and NaOHNaOH (for calcium (for calcium sulfate)sulfate)CaClCaCl22 brine treatment (to limit clay sensitivity). brine treatment (to limit clay sensitivity). NaClNaCl and and KClKCl. Clay stabilizers that bind clays . Clay stabilizers that bind clays to the substrateto the substrate
Hydraulic fracturingHydraulic fracturingHeat treatment (?)Heat treatment (?)
Damaged Zone
Mod. From Michael Dixon, OMNI Laboratories, Inc.
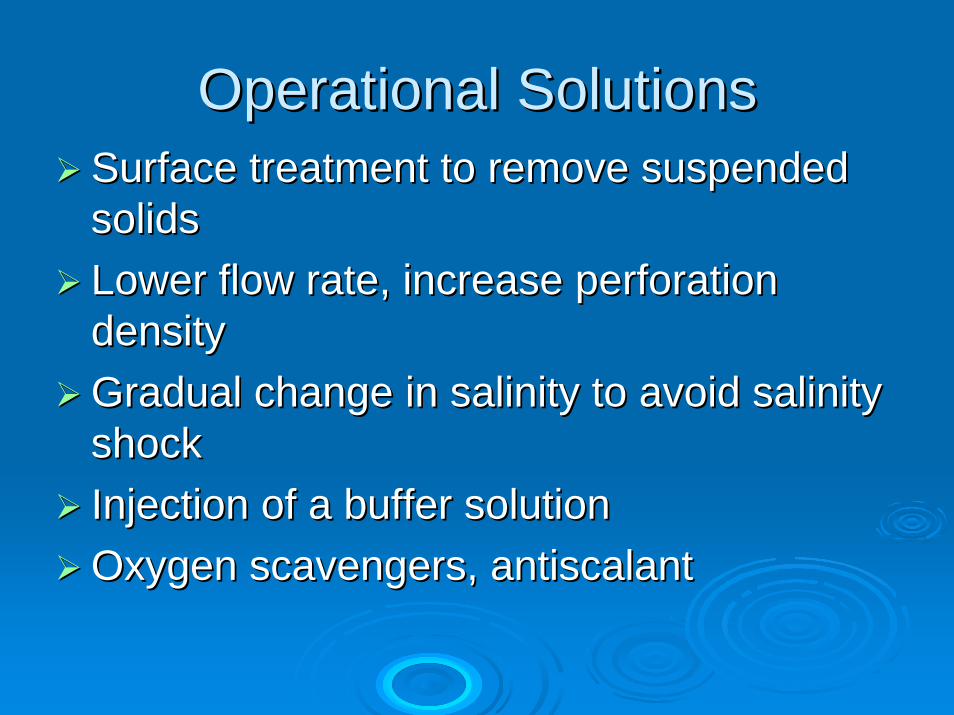
Operational SolutionsOperational SolutionsSurface treatment to remove suspended Surface treatment to remove suspended solidssolidsLower flow rate, increase perforation Lower flow rate, increase perforation densitydensityGradual change in salinity to avoid salinity Gradual change in salinity to avoid salinity shockshockInjection of a buffer solutionInjection of a buffer solutionOxygen scavengers, Oxygen scavengers, antiscalantantiscalant

INJECTION RATESINJECTION RATES

Injection Rate IssuesInjection Rate Issues
Maximum injection Maximum injection rate controls number rate controls number of wells neededof wells neededInjection rate is Injection rate is dependent on dependent on formation parameters:formation parameters:
Average Injection Rate Distribution
0
25
50
75
100
125
150
175
200
<25 150 275 400 525Average Injection Rate (gpm)
Number of bins: 22; Bin size: 25 gpm; Number of data points: 390
Freq
uenc
y
Maximum Injection Rate Distribution
0
25
50
75
100
125
150
175
200
<25 150 275 400 525Maximum Injection Rate (gpm)
Number of bins: 22; Bin size: 25 gpm; Number of data points: 437 including 10 points >525 gpm
Freq
uenc
y
⎟⎟⎠
⎞⎜⎜⎝
⎛= 2
2.25lnb4π
∆rckt
kQP
µφµ
(Limited sampling of injection wells)
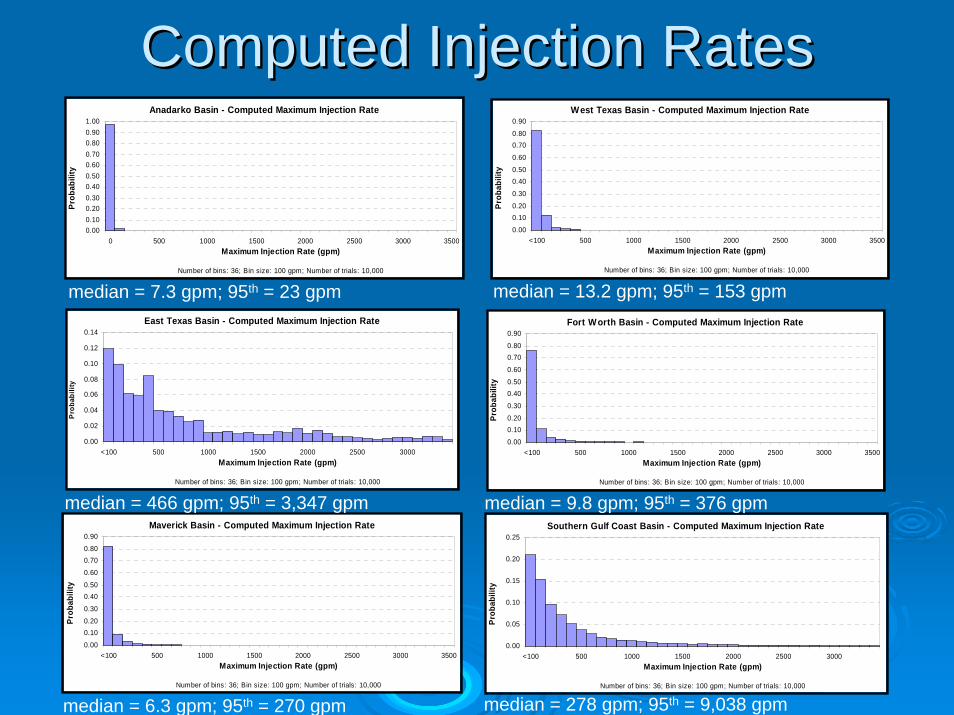
Computed Injection RatesComputed Injection RatesAnadarko Basin - Computed Maximum Injection Rate
0.000.100.200.300.400.500.600.700.800.901.00
0 500 1000 1500 2000 2500 3000 3500Maximum Injection Rate (gpm)
Number of bins: 36; Bin size: 100 gpm; Number of trials: 10,000
Prob
abili
ty
West Texas Basin - Computed Maximum Injection Rate
0.00
0.100.20
0.30
0.400.50
0.60
0.700.80
0.90
<100 500 1000 1500 2000 2500 3000 3500Maximum Injection Rate (gpm)
Number of bins: 36; Bin size: 100 gpm; Number of trials: 10,000
Prob
abili
ty
East Texas Basin - Computed Maximum Injection Rate
0.00
0.02
0.04
0.06
0.08
0.10
0.12
0.14
<100 500 1000 1500 2000 2500 3000Maximum Injection Rate (gpm)
Number of bins: 36; Bin size: 100 gpm; Number of trials: 10,000
Prob
abili
ty
Fort Worth Basin - Computed Maximum Injection Rate
0.00
0.100.20
0.30
0.400.50
0.60
0.700.80
0.90
<100 500 1000 1500 2000 2500 3000 3500Maximum Injection Rate (gpm)
Number of bins: 36; Bin size: 100 gpm; Number of trials: 10,000Pr
obab
ility
Maverick Basin - Computed Maximum Injection Rate
0.00
0.100.20
0.30
0.400.50
0.60
0.700.80
0.90
<100 500 1000 1500 2000 2500 3000 3500Maximum Injection Rate (gpm)
Number of bins: 36; Bin size: 100 gpm; Number of trials: 10,000
Prob
abili
ty
Southern Gulf Coast Basin - Computed Maximum Injection Rate
0.00
0.05
0.10
0.15
0.20
0.25
<100 500 1000 1500 2000 2500 3000Maximum Injection Rate (gpm)
Number of bins: 36; Bin size: 100 gpm; Number of trials: 10,000
Prob
abili
ty
median = 13.2 gpm; 95th = 153 gpm
median = 9.8 gpm; 95th = 376 gpm
median = 278 gpm; 95th = 9,038 gpm
median = 7.3 gpm; 95th = 23 gpm
median = 466 gpm; 95th = 3,347 gpm
median = 6.3 gpm; 95th = 270 gpm

Injection Rate ConclusionsInjection Rate Conclusions1 MGD of concentrate:1 MGD of concentrate:
Is equivalent to 695 Is equivalent to 695 gpmgpmWould require a couple of wells in the eastern Would require a couple of wells in the eastern half of the state in recent formationshalf of the state in recent formationsWould require one or several well clusters in Would require one or several well clusters in the the paleozoicpaleozoic formationsformations
Injection rate can be augmented by Injection rate can be augmented by screening the pay thickness and screening the pay thickness and stimulating the wellstimulating the well
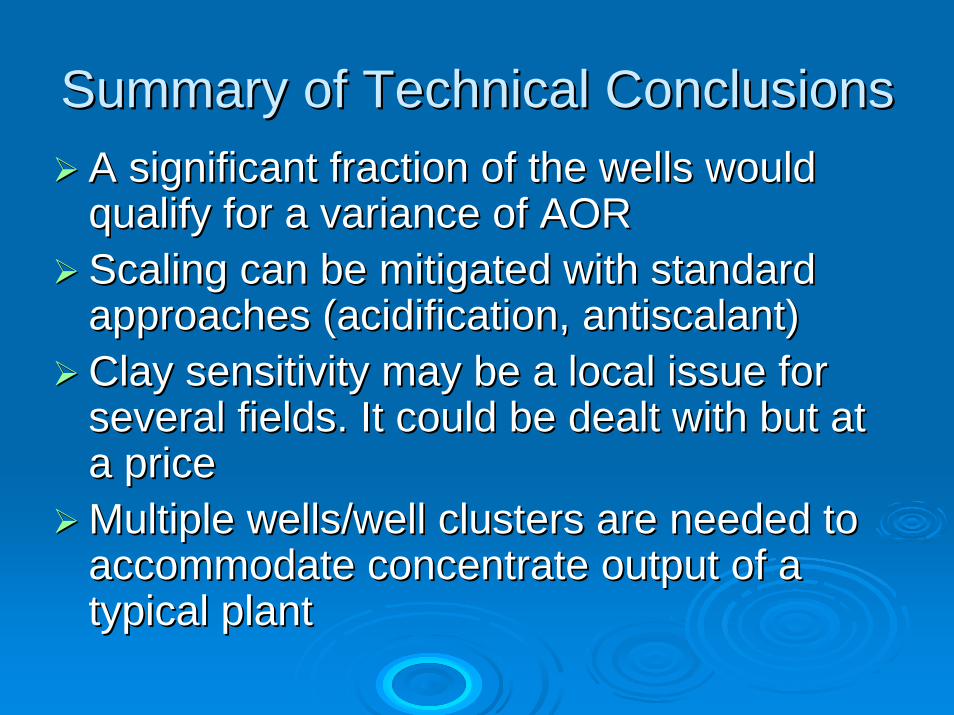
Summary of Technical ConclusionsSummary of Technical ConclusionsA significant fraction of the wells would A significant fraction of the wells would qualify for a variance of AORqualify for a variance of AORScaling can be mitigated with standard Scaling can be mitigated with standard approaches (acidification, approaches (acidification, antiscalantantiscalant))Clay sensitivity may be a local issue for Clay sensitivity may be a local issue for several fields. It could be dealt with but at several fields. It could be dealt with but at a pricea priceMultiple wells/well clusters are needed to Multiple wells/well clusters are needed to accommodate concentrate output of a accommodate concentrate output of a typical planttypical plant
Policy procedures:
• Met with RRC and TCEQ• Met with EPA Region 6 and headquarters• Talked with other states about their
solutions• Researched permitting and permitting
options

Current permitting process:
• History• Class I• Class II• Class V

Possible permitting paths:
• Non-hazardous Class I• Class II• Class V• Dual-permitted wells• General permit, Class I• Special Class I• Change Federal regulations
