using of optimal simulation modelling to reduce
TRANSCRIPT

Proceedings of the International Conference on Industrial Engineering and Operations Management
Toronto, Canada, October 23-25, 2019
© IEOM Society International
Using of Optimal Simulation Modelling to Reduce
Radiotherapy Cancer Waiting Time and Improve Survival
Malakeh Saberi, Anjali Awasthi
Concordia Institute for Information Systems Engineering (CIISE)
Concordia University
1455 De Maisonneuve Blvd. West, EV 7.640, Montreal, QC
[email protected], [email protected]
Abstract
Standard indicators of the quality of cancer radiotherapy treatment not only includes accuracy of treatment process,
but also the patient wait time to go under treatment. A common cause of anxiety for patients who are diagnosed with
cancer and prescribed for radiation therapy is how long they should wait for their radiation sessions to begin. This
waiting time estimation either remains unclear or is longer than it is originally planned. One of the major attempts for
radiotherapy cancer centers to improve their quality of services is to try to keep the patient waiting time under control
and as low as reasonably possible. In this paper, the aim is to understand the magnitude of bottlenecking in the
fundamental steps of the radiation therapy treatment process in order to simulate a model that can be used further on
by cancer centers to develop their quality program. The result of this optimal simulation model would be a reduction
of the delay between the time that the oncology recommends a patient for undergoing radiotherapy and the time that
patients actually starts the radiation treatment sessions.
Keywords
Radiotherapy Treatment Process, Patient Wait Time, Cancer Center Quality Program and Optimal Simulation Model.
1. Introduction
Radiotherapy involves the use of radiation to treat cancer tumors while minimizing damage to healthy tissue. The
radiation may be delivered in different methods from a source at a distance from the patient’s body in or near the
tumor. These methods involve several steps before the actual treatment commences.
Oncology centers aim to immediately treat patients recommended for radiotherapy. However, some patients wait for
a long time before undergoing treatment. These prolonged waiting times has negative impacts on immediate cure or
palliation of the disease. An estimated 120 000 people lose their lives to cancer annually in England (The NHS cancer
plan 2000). Thus, several waiting time standards have been framed by the Joint Council for Clinical Oncology (JCCO)
and the Department of Health (DH) to reduce further loss of life through the disease (Burke et al. 2011), (Kapamara
et al. 2007). These standards are difficult to meet because of bottlenecks created by the interactions between the
patients and human or machine resources in the treatment system. Oncology centers face the challenge of reducing
these patient waiting times to improve their quality of service. Their aim is to reduce waiting times and maximize
patient throughput while utilizing their available resources to full capacity. This could be difficult to achieve because
of disturbances in the system like patients not attending sessions, staff shortages, unavailability of doctors, machine
breakdowns, and or continual surge in cancer patients. Therefore, a simulation model of the treatment system would
help to understand the magnitude of bottlenecking in the fundamental steps of the process. The simulation model is
developed with this respect, and as a first step towards development of radiotherapy patient scheduling algorithms.
1.1 Objective of Simulation
Waiting times for radiation therapy (RT) are of a global concern. Emerging evidence indicates that a wait for RT may
be a threat to patient outcomes, and that waiting times for RT should therefore be as short as reasonably achievable
(Mackillop 2007), (Chen et al. 2008). In some cases, additional resources are required to reduce waiting times while
in other cases, process changes or better use of existing resources will be enough. Therefore, waiting times may be
1289

Proceedings of the International Conference on Industrial Engineering and Operations Management
Toronto, Canada, October 23-25, 2019
© IEOM Society International
improved by the application of modern management techniques such as mathematical programming, simulation
modelling, and statistical analysis aimed at improving processes.
The patient treatment time allocation of the radiation therapy treatment process within oncology cancer department is
always crucial and essential in-patient care pathway but nevertheless contains room for improvement which effect
both on tumor growth as well as survival outcome. The purpose of this study is to show how different simulation and
optimization models can be used to represent this complex process and to suggest improvements that may reduce the
cancer patient treatment time and ultimately reduce overall waiting times which effect on patient quality care. In this
paper, the application of discrete-event simulation (DES) modelling of cancer radio therapy planning processes is
described, and how such a model can be constructed, validated and used to recommend improvements to waiting times
is also demonstrated.
2. Literature Review
Simulation is a problem-solving methodology that resembles a real-world system over a period of time (Banks 1998).
Literature has considerable spectra of real-world problems analyzed and solved using simulation models. These
models provide invaluable information for decision making and also increase the problem solver’s understanding of
the system through experimentation (Chen et al. 2002), (Pidd 2004). Simulation models can be continuous or discrete
event. Discrete-event simulation involves modelling a system whose state changes instantaneously whereas in
continuous simulation, state changes continuously with respect to time (Chen et al. 2002), (Pidd 2004).
This paper discusses a discrete-event simulation of patient radiotherapy treatment at a cancer center. Numerous articles
have been published on the application of discrete-event simulation on healthcare problems. There is different
literature on simulation of single or multi-facility health care clinics. However, it seems a few researchers have
attempted to model cancer clinics. The radiotherapy treatment processes could be viewed as a multi-facility healthcare
environment that shares key resources such as doctors and radiographers.
Lowery (1996) presents an introduction to simulation in healthcare and clearly outlines the barriers to modelling in
this environment. One important issue is how the simulation model would be developed and implemented. Numerous
computer simulation software packages are available on the market. Some of these include Arena, eM-Plant, Micro
Saint, ProcessModel, SimScript, Simul8, and or Visual Simulation Environment (McGinley 2005). In this paper,
Arena, a discrete-event simulation computer package, is used in the development of the model.
2.1 Statistic Review
The report of Barua et al. (2015) shows that many Canadians are waiting for some form of medical treatment. In
particular, Canadian cancer patients have experienced long waiting times in radiotherapy for many years (Kavanagh
et al. 2008), (Mackillop et al. 1995). Lengthy waiting times for radiation treatment may have a negative clinical impact.
For example, delayed radiation treatment may increase the risk of local recurrence (Hebert-Croteau et al. 2004), (Chen
et al. 2008) and poor survival (Do et al. 2000), (Dahrouge et al. 2005).
Several population-based studies have been conducted to investigate waiting times for radiotherapy and to determine
the predictors of long waits. A higher incidence of cancer, together with an increase in the demand for radiotherapy,
insufficient resources and certain patient characteristics represent some of the predictors for longer waiting times
(Fortin et al. 2006), (Benk et al. 1998). Conversely, radiotherapy waiting times decrease with an increase in the number
of radiation therapists, medical physicists, radiation oncologists and radiation planning and therapy equipment (Cooke
et al. 2009).
Discrete-event simulation (DES) is a valuable tool for investigating system capacity and throughput. The use of DES
models with healthcare application includes hospitals, outpatient clinics, emergency departments and pharmacies
(Günal and Pidd 2010), (Jacobson et al. 2006). DES can help decision makers to carry out a ‘what- if?’ analysis to
determine good policies for scheduling patients, optimising resources, reducing waiting times of patients in clinics
and improving workflows (Santibanez et al. 2009), (VanBerkel and Blake 2007). DES models have also been used to
investigate patient scheduling challenges (Everett 2002), waiting time bottlenecks, overall system throughput and
1290
Proceedings of the International Conference on Industrial Engineering and Operations Management
Toronto, Canada, October 23-25, 2019
© IEOM Society International
system configuration in emergency rooms (Duguay and Chetouane 2007), optimal intensive care unit size (Kim et al.
1999), as well as staffing levels and bed requirements (Akkerman and Knip, 2004) in various healthcare settings.
Simulation modelling has been applied in the field of radiation therapy to explore target waiting times through varying
capacities (Munro and Potter 1994), (Thomas et al. 2001) and to analyse the number of linear accelerators to achieve
shorter waiting times (Thomas 2003). Kapamara et al. (2007) and Proctor et al. (2007) used DES modelling to
understand the treatment process, complexities, patient flow and bottlenecks at the radiotherapy unit. More recently,
Werker et al. (2009) modelled a portion of the planning process of the radiation therapy at the British Columbia Cancer
Agency, with the aid of a DES model.
In this paper, the work extends the study of Werker et al. (2009) by modelling the entire radiation therapy planning
process, from patient arrival to treatment completion. This is a model to analyse the entire radiotherapy planning
process at a cancer treatment facility. The primary objectives are to understand how to improve the radiotherapy
planning process, to understand which resources are the most important in decreasing waiting times, and to provide
an optimal strategy for deploying existing and new resources.
3. Input Modelling
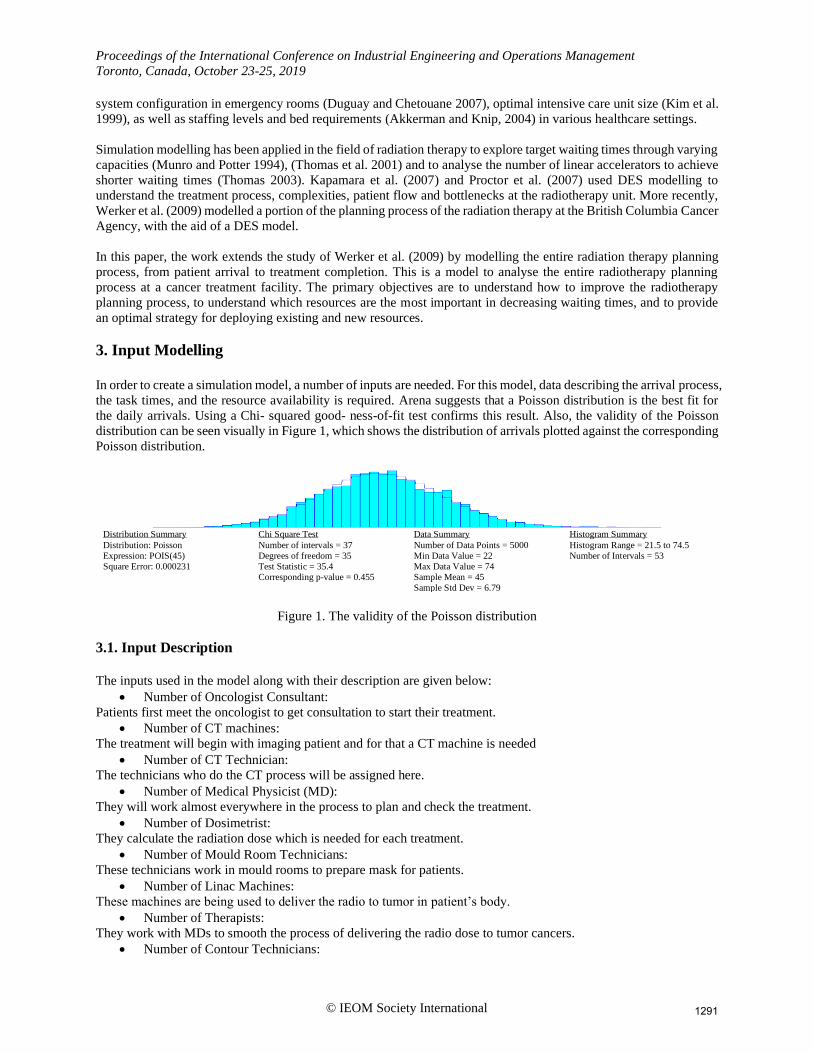
In order to create a simulation model, a number of inputs are needed. For this model, data describing the arrival process,
the task times, and the resource availability is required. Arena suggests that a Poisson distribution is the best fit for
the daily arrivals. Using a Chi- squared good- ness-of-fit test confirms this result. Also, the validity of the Poisson
distribution can be seen visually in Figure 1, which shows the distribution of arrivals plotted against the corresponding
Poisson distribution.
Distribution Summary
Distribution: Poisson
Expression: POIS(45)
Square Error: 0.000231
Chi Square Test
Number of intervals = 37
Degrees of freedom = 35
Test Statistic = 35.4
Corresponding p-value = 0.455
Data Summary
Number of Data Points = 5000
Min Data Value = 22
Max Data Value = 74
Sample Mean = 45
Sample Std Dev = 6.79
Histogram Summary
Histogram Range = 21.5 to 74.5
Number of Intervals = 53
Figure 1. The validity of the Poisson distribution
3.1. Input Description
The inputs used in the model along with their description are given below:
• Number of Oncologist Consultant:
Patients first meet the oncologist to get consultation to start their treatment.
• Number of CT machines:
The treatment will begin with imaging patient and for that a CT machine is needed
• Number of CT Technician:
The technicians who do the CT process will be assigned here.
• Number of Medical Physicist (MD):
They will work almost everywhere in the process to plan and check the treatment.
• Number of Dosimetrist:
They calculate the radiation dose which is needed for each treatment.
• Number of Mould Room Technicians:
These technicians work in mould rooms to prepare mask for patients.
• Number of Linac Machines:
These machines are being used to deliver the radio to tumor in patient’s body.
• Number of Therapists:
They work with MDs to smooth the process of delivering the radio dose to tumor cancers.
• Number of Contour Technicians:
1291

Proceedings of the International Conference on Industrial Engineering and Operations Management
Toronto, Canada, October 23-25, 2019
© IEOM Society International
For outlining the tumor these technicians will work with MDs and Therapists.
• Different Waiting Time for each Process Task:
Table 1 shows how tasks are timing.
Table 1. Different Waiting Time for each Process Task
Task Name Dealy Type Units Min Value Max
Meet Oncologist Consultant Triangular Minutes 60 90 120
Prepare Mask in Mould Room Triangular Hours 5 5.5 6
Outline Tumor and Contour Triangular Hours 1 2 3
OAR Outline Triangular Hours 1 3 5
Check Outline Triangular Hours 2 3 4
Dose Calculation Triangular Hours 2 3 4
Physics QA Triangular Hours 3 3.5 4
Schedule Patient for Treatment Expression UNIF (90,120) Minutes 40 60 80
Treatment Triangular Minutes 30 45 60
CT and Chemo Triangular Minutes 80 90 100
4. Model Design
4.1. Simulation Method: Discrete Event Simulation using Arena
Discrete Event Simulation Parameters:
Entities: Patients
Attributes: Waiting time, Service time
Queues: Patients wait in various queue to meet the specialists
System State variables: Patient wait time, Total time spent by patients in the system, Resource utilization
Events: Arrival and Departure of Patients
Resources: It is shown in Table 2.
Activities and Delays: The various activities/process and the corresponding delays are given in Table 3.
Table 2. Resources
Resources Used Capacity Resources Used Capacity
Oncologist Consultant 1 Technician 2
CT machine 1 Therapist 2
Linac machine 2 CT Technician 1
Medical Physicist 2 Contour Tech 2
Dosimetrist 2 Technician 2
Table 3. Activities and Delays
Name Action Delay Type Units Min Value Max
Meet Oncologist Consultant Seize Delay Release Triangular Minutes 60 90 120
Prepare Mask in Mould Room Seize Delay Release Triangular Hours 5 5.5 6
Outline Tumor and Contour Seize Delay Release Triangular Hours 1 2 3
OAR Outline Seize Delay Release Triangular Hours 1 3 5
Check Outline Seize Delay Release Triangular Hours 2 3 4
Dose Calculation Seize Delay Release Triangular Hours 2 3 4
Physics QA Seize Delay Release Triangular Hours 3 3.5 4
Schedule Patient for Treatment Seize Delay Release Expression UNIF (90,120) Minutes 40 60 80
Treatment Delay Triangular Minutes 30 45 60
CT and Chemo Seize Delay Release Triangular Minutes 80 90 100
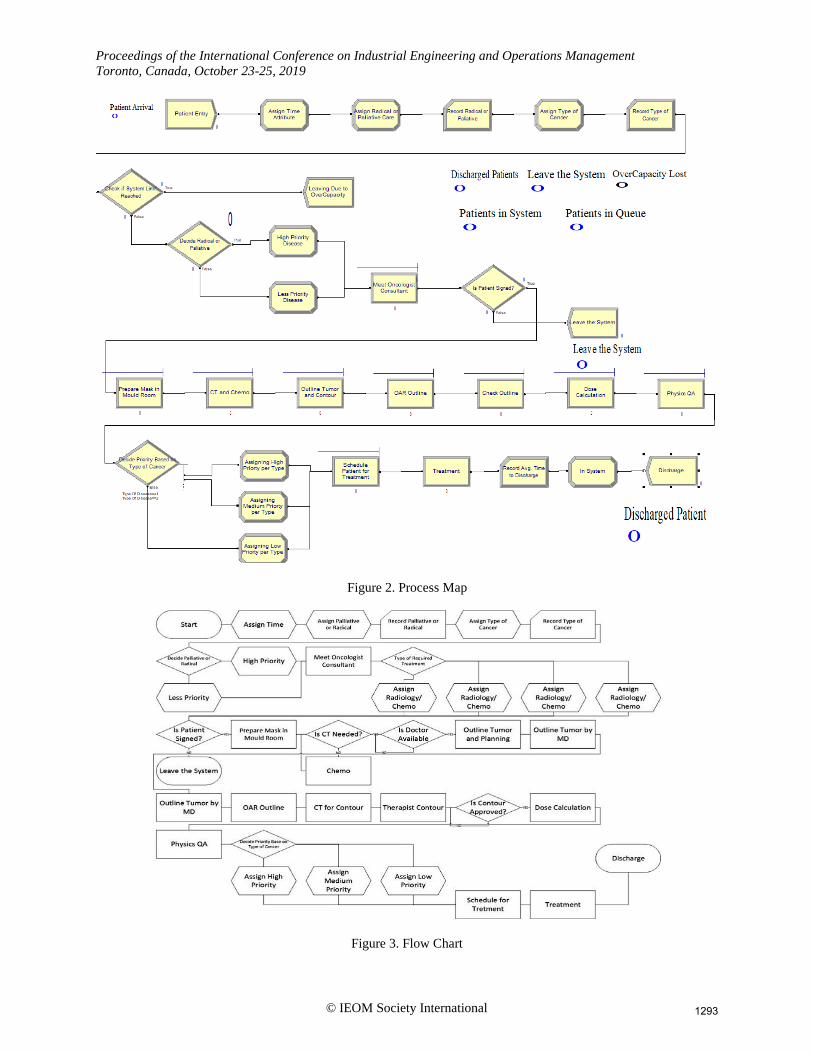
4.2. Process Map
1292
Proceedings of the International Conference on Industrial Engineering and Operations Management
Toronto, Canada, October 23-25, 2019
© IEOM Society International
Figure 2. Process Map
Figure 3. Flow Chart
1293

Proceedings of the International Conference on Industrial Engineering and Operations Management
Toronto, Canada, October 23-25, 2019
© IEOM Society International
Process map is represented in Figure 2. The purpose herein is to understand how series of action in a cancer center are
taking place from the time patients are coming to the center until they are discharged. Through brainstorming the idea
of how the process works, before drawing a process map a flow chart given in Figure 3 is drawn. By looking at the
activities, it is found that the state of the system changes at a discrete set of points. All the process in order to prepare
the treatment plan were completed at discrete times. For example, the first activity which is “Meet the Oncologist
Consultant” is getting done between 60 to 90 minutes. The further activities are going to be completed in the same
manner.
4.3. System Visualization
To help visualizing how every and each components of the systems are related, Causal-Loop Diagram, Stock Flow
Diagram, Class Diagram, and Sequence Diagram were generated by software. These diagrams are respectively shown
in Figure 4, 5, 6, and 7. The principal of accumulation is very important to such a complicated system so that these
diagrams are illustrated to have a reasonable output.
Figure 4. Causal-Loop Diagram
Figure 5. Stock Flow Diagram
1294

Proceedings of the International Conference on Industrial Engineering and Operations Management
Toronto, Canada, October 23-25, 2019
© IEOM Society International
Figure 6. Class Diagram
Figure 7. Sequence Diagram
5. Output Analysis Output analysis is the process of analyzing output results generated by the simulation model. The Arena output result
description is represented in Figure 8. The responses to Sensitivity analysis (Monte Carlo analysis) by considering six
scenarios are shown in Figure 9. The sensitivity analysis is used to see the stability of result to the input parameter
variations.
Patient• PatientName: string
• PatientSex: string
• PatientAge: int
• PostalCode: varchar
• Phone: int
• PatientReceptionDate: timestamp
• ProfileLastUpdate: timestamp
Doctor• DoctorName: string
• DoctorID: int
• IDVerification: boolean
Plan• PlanCode: int
• PatientName: string
• DiagnosisCode: int
• ProrityCode: int
• PlanCreationDate: timestamp
• Status: varchar
• LastUpdate: timestamp
Priority• PatientName: string
• PriorityID: int
• CancerType: string
• LastUpdate: timestamp
Appointment• PatientName: string
• AppointmentID: int
• PlanCode: int
• DiagnosisCode: int
• PriorityID: int
• AppointmentDate: varchar
• AppointmentDuration: int
• LastUpdate: timestamp
Diagnosis• DiagnosisCode: int
• PatientName: string
• PriorityID: int
• CancerType: string
• Discription: string
• LastUpdate: timestamp
Document• DocumentID: int
• PatientName: string
• DiagnosisCode
• PriorityID
• PatientName: string
• ApprovalStatus: Boolean
• DateOfService: varchar
• Printed: varchar
• LastUpdate: timestamp
Treatment• TeatmentID: int
• PatientName: string
• DiagnosisCode: int
• ProrityCode: int
• CrationDate: varchar
• DueDate: varchar
• TreatmentDuration: int
• LastUpdate: timestamp
Record Audition
1295

Proceedings of the International Conference on Industrial Engineering and Operations Management
Toronto, Canada, October 23-25, 2019
© IEOM Society International
Figure 8. Arena Output Result Description
Figure 9. Sensitivity Analysis (Monte Carlo Analysis)
5.3. Optimization Using Arena – OptQuest
Simulation optimization is defined as the process of finding the best input variable values from among all possibilities
without explicitly evaluating each of the possibilities, Figure 10. The summery of the work done by optimization
method is brought in figure 11.
Figure 10. Optimization-based Simulation
1296

Proceedings of the International Conference on Industrial Engineering and Operations Management
Toronto, Canada, October 23-25, 2019
© IEOM Society International
Objective:
Constraints:
Controls:
Best solution:
Figure 11. Optimization Process
6. Model Verification and Validation
The verification and validation are answers to the following questions,
Verification: “Was the model made right? “
Validation: “Was the right model made?”
There are different ways for performing verification and validation. From these different ways, four categories were
defined namely a. Informal b. Static c. Dynamic and d. Formal Methodology Used: Informal Verification and
Validation Methods. Informal verification is more qualitative in nature than quantitative. It also relies heavily on
subjective human evaluation rather than detailed mathematical analysis. Experts will examine some of the artifacts of
the simulation project and access the model based on the examination and their reasoning and expertise.
Validation method:
Face Validation, which is a validation method that compared the system behavior to the model results. In this method,
observers who may be potential users or subject matter experts with respect to the system review or observe the results
1297

Proceedings of the International Conference on Industrial Engineering and Operations Management
Toronto, Canada, October 23-25, 2019
© IEOM Society International
of the system. By investigating through knowledgeable expert whose name are acknowledged in this paper, the face
validity is done. They are asked whether the model and its behavior are reasonable in terms of the design and the
results. This is the question to which the response is affirmative. Hence, the model is considered validated.
Verification method:
Inspection, which is a verification method that compares the project artifacts. In this method, the various project
artifacts and results and analyzed and compared for its correctness. From the simulation model, it could be found that
if the number of Oncologists (resources) are increased, then the overall time spent by patients in the system and the
wait time decreases. Comparing the 2 graphs in Figure 12 and 13 says that the number of patients discharged increases.
Figure 12. Verification
Figure 13. Verification Continuing
7. Conclusion
Waiting time for getting a treatment plan ready is an important standard within the subjects going on the research area
in cancer radiation therapy. The numerous options can affect waiting time which would be the number of resources
used in the system, the quality of care that a patient receives, the breakdown of machines especially Linac equipment,
and the availability of patients. In this matter, there are too many examples of different waiting time in which a cancer
treatment process can be defined. A typical cancer center considering that having 3 Linac machines, 4 to 5 Oncologists,
5 MDs, 7 Dosimetrists, 14 Therapists, 4 CT Technicians, and 1 CT machines would calculate the radio dose needed
to go through patient’s body in almost 2 weeks if the patient has breast cancer.
Werker et al., Radiotherapy and Oncology, vol. 92, pp. 76-82
Figure 6. Cancer Category Breakdown; Breast Cancer Category Breakdown
1298
Proceedings of the International Conference on Industrial Engineering and Operations Management
Toronto, Canada, October 23-25, 2019
© IEOM Society International
One of the suggestions of this paper is the idea of including the Palliative and Radical priority in the beginning of the
process, which helps to start the process treatment sooner for the patients who are palliative and close to highest stages
of cancer. The other result which helped the project in Monte Carlo Sensitivity Analysis is considering the different
types of cancer based on population. This gives higher priority to the patients who have the most diagnosed rate in a
cancer category breakdown like one illustrated by Werker et al. (2009) shown in Figure 6.
As the idea of assigning priority to some patient is brought up by the authors, a big amount of time is spent on reading
related papers and consulting with specialists to have a reasonable result, which is a positive point that the simulated
result is close to a real true system as the average time gotten from the Arena process map to discharge a patient is
almost 73 hours which is almost 9 days if the center works for 8 hours per day. However, by increasing the number
of resources and availability of the machines, this even can go below one month as resulted in the sensitivity analysis.
In patient scheduling algorithms, different factors can affect the patient waiting time to receive their radiotherapy
treatment. The simulated model offered by this paper can be considered as an example model to find the bottlenecks
of the treatment process in a cancer center to reduce the patient waiting time and get better service quality.
Acknowledgements
Special thanks to Dr. Mehdi Saberi, Clinical Medical Physicist at The Rutherford Cancer Centre, for his assistance,
the time he spent explaining the treatment process, and all the help during data collection.
References
Akkerman, R., Knip, M., Reallocation of beds to reduce waiting time for cardiac surgery. Health Care Management
Science Journal, vol. 7, pp. 119-126, 2004.
Banks, J., Hand of Simulation: Principles, Methodology, Advances, Applications, and Practice, John Wiley & Sons
Inc., New York, 1998.
Barua, B., Waiting Your Turn: Wait times for health care in Canada, Fraser Institute, report, 2015, Available:
https://www.fraserinstitute.org/sites/default/files/waiting-your-turn-2015.pdf
Benk, V., Ho, V., Fortin, P. R., Zhang, G., Levinton, C., Freeman, C. R., Predictors of delay in starting radiation
treatment for patients with early stage breast cancer, International Journal of Radiation Oncology Biology
Physics, vol. 41, pp. 109-115, 1998.
Burke, E. K., Leite-Rocha, P., and Petrovic, S., An Integer Linear Programming Model for the Radiotherapy
Treatment Scheduling Problem, 2011, Available: https://arxiv.org/abs/1103.339.
Chen, E. J., Lee, Y. M., Selikson, P. L., A simulation study of logistics activities in a chemical plant, Journal of
Simulation Modelling Practice and Theory, vol. 10, pp. 235–245, 2002.
Chen, Z., King, W., Pearcey, R., Kerba, M., Mackillop, W. J., The relationship between waiting time for radiotherapy
and clinical outcomes: A systematic review of the literature, Journal of Radiotherapy and Oncology, vol. 87, pp.
3-16, 2008.
Cooke, A. L., Appell, R., Suderman, K., Fradette, K., Latosinsky, S., Radiation treatment waiting times for breast
cancer patients in Manitoba: 2001 and 2005, The Canadian-based and Internationally respected Journal of
Current Oncology, vol. 16, pp. 58-64, 2009.
Dahrouge, S., Samant, R., Mirzaei, A., Price, J., Radical radiotherapy for cervix cancer: the effect of waiting time on
outcome, International Journal of Radiation Oncology Biology Physics, vol. 61, pp. 1071-1077, 2005.
Do, V., Gebski, V., Barton, M. B., The effect of waiting for radio- therapy for grade III/IV gliomas, Journal of
Radiotherapy and Oncology, vol. 57, pp. 131-136, 2000.
Duguay, C., Chetouane, F., Modeling and improving emergency department systems using discrete event simulation,
Journal of Simulation, vol. 83, pp. 311-320, 2007.
Everett, J. E., A decision support simulation model for the management of an elective surgery waiting system. Health
Care Management Science Journal, vol. 5, pp. 89-95, 2002.
Fortin, B., Goldberg, M. S., Mayo, N. E., Valois, M. F., Scott, S. C., Hanley, J., Waiting time for radiation therapy in
breast cancer patients in Quebec from 1992 to 1998: a study of surgically treated breast cancer patients in Quebec
documents and helps to explain increased waiting times for radiation therapy, The Canadian Journal of
Healthcare Policy, vol. 1, pp. 152-167, 2006.
Günal, M. M., Pidd, M. Discrete event simulation for performance modelling in health care: a review of the literature,
1299

Proceedings of the International Conference on Industrial Engineering and Operations Management
Toronto, Canada, October 23-25, 2019
© IEOM Society International
Journal of Simulation, vol. 4, pp. 42-51, 2010.
Hebert-Croteau, N., Freeman, C. R., Latreille, J., Rivard, M., Brisson, J., A population-based study of the impact of
delaying radiotherapy after conservative surgery for breast cancer, Scientific Journal of Breast Cancer Research
and Treatment, vol. 88, pp. 187-196, 2004.
Jacobson, S. H., Hall, S. N. Swisher, J. R., Discrete-event simulation of health care systems, Patient flow: reducing
delay in healthcare delivery, Springer New York LLC, pp. 212-252, 2006, Available:
http://eknygos.lsmuni.lt/springer/345/211-252.pdf
Kapamara, T., Sheibani, K., Petrovic, D., Haas, O., Reeves, C., A simulation of a radiotherapy treatment system: A
case study of a local cancer centre, Proceedings of ORP3 EURO Meeting Conference on Operational Research,
Guimares, Portugal, September 12-15, 2007.
Kavanagh, A. G., Lee, J. C., Donnelly, B., Time to treatment of prostate cancer through the Calgary Prostate Institute
rapid access clinic, The Canadian Journal of Urology, vol. 15, pp. 3975-3979, 2008.
Kim, S. C., Horowitz, I., Young, K. K., Buckley, T. A., Analysis of capacity management of the intensive care unit in
a hospital, European Journal of Operational Research, vol. 115, pp. 36-46, 1999.
Lowery J. C., Introduction to simulation in health care, Proceedings of the 28th Conference on Winter Simulation,
Eds. Charnes, J. M., Morrice, D. J., Brunner, D. T., Swain, J. J., Coronado, United State, pp. 78-84, December
08-11, 1996.
Mackillop, W. J., Killing time: The consequences of delays in radiotherapy, Journal of Radiotherapy and Oncology,
vol. 84, pp. 1–4, 2007.
Mackillop, W. J., Zhou, Y., Quirt, C. F., A comparison of delays in the treatment of cancer with radiation in Canada
and the United States, International Journal of Radiation Oncology Biology Physics, vol. 32, pp. 531-539, 1995.
McGinley, P., Simulation Software Survey, Lionheart Publishing Inc., report, 2005, Available:
https://www.informs.org/ORMS-Today/OR-MS-Today-Software-Surveys/Simulation-Software-Survey
Munro, A., Potter, S., Waiting times for radiotherapy treatment: not all that mysterious and certainly preventable,
Journal of Clinical Oncology, vol. 6, pp. 314-318, 1994.
Pidd, M., Computer Simulation in Management Science, 5th Edition, John Wiley & Sons Ltd., Chichester, 2004.
Proctor, S., Lehaney, B., Reeves, C., Khan, Z., Modelling patient flow in a radiotherapy department, Academic Journal
of OR Insight, vol. 20, pp. 6-14, 2007.
Santibanez, P., Chow, V. S., French, J., Puterman, M. L., Tyldesley, S., Reducing patient wait times and improving
resource utilization at British Columbia Cancer Agency’s ambulatory care unit through simulation, Health Care
Management Science Journal, Vol. 12, pp. 392-407, 2009. The NHS cancer plan, Department of Health, London, 2000, Available:
https://www.thh.nhs.uk/documents/_departments/cancer/nhscancerplan.pdf, 23 Sep. 2019.
Thomas, S., Capacity and demand models for radiotherapy treatment machines. Journal of Clinical Oncology, vol. 15,
pp. 353-358, 2003.
Thomas, S., Williams, M., Burnet, N., Baker, C., How much surplus capacity is required to maintain low waiting
times?, Journal of Clinical Oncology, vol. 13, pp. 24-28, 2001.
VanBerkel, P. T., Blake, J. T., A comprehensive simulation for wait time reduction and capacity planning applied in
general surgery. Health Care Management Science Journal, vol. 10, pp. 373-385, 2007.
Werker, G., Saure, A., French, J., Shechter, S., The use of discrete-event simulation modelling to improve radiation
therapy planning processes. Journal of Radiotherapy and Oncology, vol. 92, pp. 76-82, 2009.
Biographies
Malakeh Saberi is a PhD Student in the field of Information and Systems Engineering studying in Concordia Institute
for Information Systems Engineering (CIISE) at Concordia University, Montreal, Canada. After doing a year of
Second BEng in Computer Engineering, she switched programs and received her MEng in Quality Systems
Engineering from Concordia University. She earned her first BEng in Software Engineering from Azad University in
Iran. She did research projects under supervision of CIISE professors whose aim were reducing cost and saving energy
while improving quality. Her research interests include quality-based systems modelling and simulation, optimization,
cancer radiotherapy risk analysis.
Anjali Awasthi is an Associate Professor and Concordia University Research Chair (Tier-II) in Connected Sustainable
Mobility Systems at Concordia Institute for Information Systems Engineering (CIISE) in Concordia University,
Montreal. She received a PhD in industrial engineering and automation from INRIA Rocquencourt and University of
Metz, France. She worked at University of British Columbia and University of Laval where she was involved in
1300

Proceedings of the International Conference on Industrial Engineering and Operations Management
Toronto, Canada, October 23-25, 2019
© IEOM Society International
several projects on industrial applications of operations research. In France, she was involved in many European
projects aimed at improving urban mobility in cities, city logistics and on cybernetic transportation systems. Her areas
of research are modeling and simulation, data mining, Information Technology and decision making, sustainable
logistics planning, quality assurance in supply chain management and sustainable supply chain management. She
authored several journal and conference papers more than 10 year. She is currently serving as the Education Chair for
CORS (Canadian Operations Research Society), a senior member of ASQ (American Society for Quality), associate
of LSRC (Loyola Sustainability Research Center), and regular member of CIRRELT (Centre Interuniversitaire de
Recherche sur les Reseaux d'Entreprise, la Logistique et le Transport). She is the recipient of Eldon Gunn service
award offered at 60th CORS Annual conference, Halifax, Canada in 2018.
1301