using new tools to detect and characterise plant viruses
TRANSCRIPT

1
Using new tools to detect and characterise
plant viruses
by
Mr Hao Luo
This thesis is submitted in fulfillment of the requirements for the
degree of Doctor of Philosophy of Murdoch University
School of Biological Sciences and Biotechnology
Murdoch University, Perth, Western Australia
2012

2
DECLARATION
The work described in this thesis was undertaken while I was an enrolled student for the degree
of Doctor of Philosophy at Murdoch University, Perth, Western Australia. I declare that this
thesis is my own account of my research and contains as its main content work which has not
previously been submitted for a degree at any tertiary education institution. To the best of my
knowledge, it contains no material or work performed by others, published or unpublished
without due reference being made within the text.
SIGNED_____________________ DATE___________________
3
ABSTRACT
Executive summary:
The overall aim of this study was to develop new methods to detect and characterise plant
viruses. Generic methods for detection of virus proteins and nucleic acids were developed to
detect two plant viruses, Pelargonium zonate spot virus (PZSV) and Cycas necrotic stunt virus
(CNSV), neither of which were previously detected in Australia. Two new approaches, peptide
mass fingerprinting (PMF) and next-generation nucleotide sequencing (NGS) were developed to
detect novel or unexpected viruses without the need for previous knowledge of virus sequence
or study. In this work, PZSV was found for the first time in Australia and also in a new host
Cakile maritima using one dimensional electrophoresis and PMF. The second new virus in
Australia, CNSV, was first described in Japan and then in New Zealand. In this work it was
detected and characterised as a new strain in Australia using NGS analysis and was found in a
lily plant (Lilium. longiflorum) with symptoms. Patterns of infection of a native virus
Hardenbergia mosaic virus (HarMV) and the introduced virus Cucumber mosaic virus (CMV)
were studied in natural and recent host plants using real-time reverse transcription polymerase
chain reaction. For different virus isolates and symptoms, the virus concentration in plants
varied and interaction between two co-infected viruses (such as HarMV and CMV) altered the
accumulations of both viruses. Field studies were done to measure the potential impact of
natural infection by HarMV on an economically-important legume crop plant, Lupinus
4
angustifolius (narrow-leafed lupin). In field studies, HarMV was spread by naturally occurring
aphids, with up to 31% of the lupin plants infected. Grain yield of affected lupin plants was
substantially reduced, but seed-borne infection of HarMV was not detected.
Summary
Peptide mass fingerprint (PMF) analysis of plant viruses
A generic assay to detect and partially characterise viruses from plants was developed. Proteins
extracted from virus-infected and uninfected plants were separated by one dimensional SDS
polyacrylamide gel electrophoresis. Expressed coat protein bands not presented in uninfected
plants were eluted after trypsin digestion and resulting peptide fragments separated according
to their masses by matrix-assisted laser-desorption ionization time-of-flight (MALDI-TOF) mass
spectrometry (MS). Resulting PMFs were compared with those present or predicted in protein
databases. This assay strategy was used to identify four known viruses: the potyviruses Zucchini
yellow mosaic virus (ZYMV) and Turnip mosaic virus (TuMV), an alfamovirus Alfalfa mosaic virus
(AMV), and a cucumovirus (CMV). It was also used to identify a virus that manifested symptoms
in wild C. maritima plants, tentatively identified as PZSV (genus Anulavirus) by its PMF, which
was subsequently confirmed by Reverse transcription polymerase chain reaction (RT-PCR) and
nucleotide sequencing. The detection of PZSV constitutes a first record of this virus in Australia
and in this host. It is proposed that this simplified assay is a useful approach for analysis of plant
samples known to harbour viruses, particularly for viruses which cannot be identified readily
using antisera or nucleic acid-based assays. Although five viruses from different families and
genera were identified successfully by this method, it was not a high-throughput and low cost
5
technique for sample screening, since protein extraction procedures were time-consuming, and
protein identification based on PMF requires access to a high quality MALDI-TOF mass
spectrometer. Nevertheless, this assay is a valuable complementary detection technique to
support the identification of unexpected viruses to the species level, with further
characterisation by other methods.
Detection and characterisation of CNSV by NGS
A lily plant (L. longiflorum), growing locally in Perth, Western Australia, with symptoms of
chlorosis and streaking of leaves, was collected. Total RNA was extracted and sequenced using
Illumina GA IIx technology. After assembly of reads, contigs representing the partial genome of
CNSV RNA 1 and RNA2 were identified using Blastn and Blastx software. This virus was also
found in bulb tissues of infected lily plants by RT-PCR and nucleotide sequencing (primers
designed from the NGS sequences). This indicates that the virus can be transmitted through
vegetatively propagated plant materials. Phylogenetic analysis suggested that the virus was a
new strain of CNSV (family Secoviridae, genus Nepovirus). Comparison of the sequences of this
virus to the CNSV (cycas strain) showed homology with identity of 88% and 96% at the
nucleotide and amino acid levels, respectively, and to CNSV (gladiolus strain) of 88% and 94%,
respectively; also provided in this work is a new strain of CNSV (lily strain). Another ten lily
plants and nineteen cycas plants were tested for the virus by RT-PCR but none appeared to be
infected. This virus has been recorded to be transmitted by seeds, nematodes and vegetative
propagation, and has a very wide host range in ornamental and crop plants. This result is the

6
first record of this virus in Australia, which indicates that screening for CNSV and other
nepoviruses in imported ornamental plants is essential to protect the Australian horticulture
industry from incursion of new non-indigenous viruses.
Natural spread of HarMV to narrow-leafed lupin
Two field experiments were undertaken to study the potential threat of the Australian
indigenous potyvirus, HarMV, to spread from its natural host, Hardenbergia comptoniana into
narrow-leafed lupin (L. angustifolius) crops. Plants were grown in field conditions in two
different years. Field plots of narrow-leafed lupin were established and interplanted with H.
comptoniana plants infected with HarMV. Wild aphids were allowed to colonise the plots and
spread the virus. Plants were monitored for aphids and symptoms of virus infection. Infection
was confirmed by enzyme-linked immunosorbent assay (ELISA), RT-PCR and nucleotide
sequencing. The first year established a pilot study, and this showed that HarMV spread
naturally to 4.7% of L. angustifolius plants in the field. All infected lupin plants died within 20
days after virus symptoms became visible. In the second year a full field experiment was
undertaken, and 30.7% of lupins became infected with HarMV. The majority of infected plants
remained alive during this growing season, but showed symptoms of stunting, necrotic stem
streaking and tip wilting. Three species of aphids were identified on plants during the
experiment, including Myzus persicae (green peach aphid), Acyrthosiphon kondoi (bluegreen
aphid) and Rhopalosiphon padi (oat aphid). A total of 761 seeds collected from infected plants
were sown, and seedlings were tested for virus infection by ELISA. However, none of them were
7
found to be infected with HarMV, indicating that the virus was possibly not seed-borne in L.
angustifolius. This aspect should be verified further by testing more seeds for HarMV from
infected plants. The conclusion is that HarMV, a virus confined largely to a single native wild
host, is capable of naturally extending its host range to an introduced grain legume under field
conditions. Since adaption to an alternative host, as the case of HarMV invading lupin crops, is
likely to be a driver of virus evolution, this pathosystem represents an ideal opportunity to
study evolution of this virus in real time as it encounters new hosts, at the interface between an
ancient ecosystem and a recent agroecosystem.
Virus quantification using real-time quantitative PCR
In this study, virus quantification by real-time quantitative PCR was used to titrate HarMV
(isolate WHP-1, WHP-2 and MU-4) and CMV (Sn strain, subgroup II) expression in host L.
angustifolius, H. comptoniana and Nicotiana benthamiana. A glasshouse experiment was done
that showed HarMV isolate WHP-1 induced a non-necrotic (NN) response, while WHP-2
induced systemic necrosis (N) on lupin plants. Lupin cv Belara infected with WHP-2 isolate
harboured a virus at a concentration of 1.34×10⁸ copies/µl, approximately 18% higher than
WHP-1 (1.13×10⁸ copies /µl). Although typical symptoms caused by HarMV on wild H.
comptoniana include: chlorosis, leaf mosaic, leaf distortion, yellow spots and blotches, the
symptom severity is variable on different plants, and even different branches of the same plant
show inconsistent symptoms. Their within-plant titres varied, and the highest concentration
(1.75×10⁸ copies /µl) was more than 19-fold that of the lowest (9.16×10⁶ copies /µl). The
interaction between two co-infecting viruses (HarMV and CMV) infecting N. benthamiana
8
plants was studied. In doubly-infected N. benthamiana plants there was a strong synergistic
increase in symptoms, with severe yellowing, stunting and chlorosis, and a higher overall virus
titre (2.24×10⁸ copies/µl) than for single virus infected plants (at 6.89×10⁷ copies/µl for HarMV
single infection and 4.05×10⁷ copies/µl for CMV single infection). Compared to the single
infection, CMV accumulation was enhanced (at 2.18×10⁸ copies/µl in doubly-infected plants
and 4.05×10⁷ copies/µl in single-infected plants four weeks after inoculation), while HarMV was
suppressed (at 5.66×10⁶ copies/µl in doubly-infected plants and 6.89×10⁷ copies/µl in single-
infected plants four weeks after inoculation) in mixed infection. This study used real-time
quantitative PCR to investigate the virus within-plant titre, and showed that the virus
concentrations were variable in hosts depending on the virus isolate, symptoms and interaction
with co-infected viruses.
The following papers and abstracts were published from this work:
Luo, H., Wylie, S. J., & Jones, M. G. K. (2010). Identification of plant viruses using one-
dimensional gel electrophoresis and peptide mass fingerprints. Journal of Virological Methods,
165, 297-301.
Luo, H., Wylie, S. J., Coutts, B., Jones, R. A. C., & Jones, M. G. K. (2011). A virus of an isolated
indigenous flora spreads naturally to an introduced crop species. Annals of Applied Biology
159:339-347 DOI: 10.1111/j.1744-7348.2011.00496.x.
Wylie, S. J., Luo, H., Li, H., & Jones, M. G. K. (2011). Multiple polyadenylated RNA viruses
detected in pooled domestic and wild plant samples. Archives of Virology 157:271-284
Jones, M.G.K., Wylie, S.J., Saqib, M., Gill, R., Cakir, M., Luo. H., Zhang, J. Nicol, J., Iqbal, S.,Tan, J.,
Tan, M. , Herath, M, Chamberlain, D., Quader, M., Francisco, P., Ong, J., Agrez, V and Fosu-
Nyarko, J. (2011). Applications of ‘Next Generation’ sequencing in plant pathology. Combined
Biological Sciences Meeting, Perth, August 2011, Abstract no 75.

9
TABLE OF CONTENTS
DECLARATION ........................................................................................................................................................ 2
ABSTRACT .............................................................................................................................................................. 3
TABLE OF CONTENTS.............................................................................................................................................. 9
LIST OF ABBREVIATIONS ...................................................................................................................................... 12
ACKNOWLEDGEMENTS ........................................................................................................................................ 19
CHAPTER 1 LITERATURE REVIEW .......................................................................................................................... 21
1.1 OVERVIEW OF PLANT VIRUSES ............................................................................................................................. 22
1.2 PLANT VIRUSES IN AUSTRALIA ............................................................................................................................. 24
1.3 DETECTION, IDENTIFICATION AND CHARACTERISATION OF PLANT VIRUSES ....................................................................... 28
1.3.1 Experimental host plants ..................................................................................................................... 28
1.3.2 Transmission electron microscopy (TEM) .............................................................................................. 29
1.3.3 ELISA and TBIA .................................................................................................................................... 31
1.3.4 Reverse transcription PCR and Real time PCR ....................................................................................... 33
1.3.5 Detection and characterisation of plant viruses by MS.......................................................................... 34
1.3.6 Other techniques for plant virus detection ............................................................................................ 39 1.3.6.1 NGS: 454 sequencing/illumina sequencing......................................................................................................39 1.3.6.2 Microarrays ...................................................................................................................................................43
1.4 TRANSMISSION OF PLANT VIRUSES AND THEIR VECTORS ............................................................................................. 44
1.4.1 Insects ................................................................................................................................................. 44
1.4.2 Nematodes .......................................................................................................................................... 46
1.4.3 Fungi ................................................................................................................................................... 47
1.4.4 Seed- and pollen- borne viruses ............................................................................................................ 48
1.4.5 Transmission through soil .................................................................................................................... 50
1.4.6 Mechanical inoculation and grafting .................................................................................................... 50
1.5 IMPACT OF PLANT VIRUSES ON AGRICULTURAL PRODUCTION AND NATURAL ECOSYSTEMS ................................................... 52
1.5.1 Losses caused by plant viruses ............................................................................................................. 52
1.5.2 Climate change and plant virology ....................................................................................................... 54
1.6 AIMS AND OBJECTIVES OF THIS RESEARCH .............................................................................................................. 56
1.6.1 Optimising Mass Spectroscopy-based methods to detect viruses .......................................................... 56
1.6.2 Investigating natural spread of an indigenous virus to an introduced crop plant in the field .................. 58
1.6.3 Symptom responses of lupin genotypes to infection by a range of isolates of HarMV ............................ 58
1.6.4 Detecting viruses using next generation sequencing ............................................................................. 59
1.6.5 Quantify virus in single or doubly-infected hosts using real-time PCR .................................................... 60
CHAPTER 2 GENERAL MATERIALS AND METHODS ............................................................................................... 61
10
2.1 INTRODUCTION ............................................................................................................................................... 62
2.2 INOCULATIONS................................................................................................................................................ 62
2.2.1 Mechanical inoculation ........................................................................................................................ 62
2.2.2 Graft inoculation ................................................................................................................................. 63
2.3 RNA EXTRACTION ........................................................................................................................................... 63
2.4 REVERSE TRANSCRIPTION ................................................................................................................................... 65
2.5 PCR REACTION ............................................................................................................................................... 66
2.5.1 Promega GoTaq® Flexi DNA Polymerase .............................................................................................. 66
2.5.2 KAPA HiFiTM HotStart DNA Polymerase ................................................................................................. 67
2.6 AGAROSE GEL ELECTROPHORESIS ......................................................................................................................... 69
2.7 PURIFICATION OF PCR PRODUCTS........................................................................................................................ 69
2.7.1 Ethanol precipitation ........................................................................................................................... 69
2.7.2 Cleanup using MinElute PCR Purification Kit ......................................................................................... 70
2.8 DNA QUANTIFICATION ..................................................................................................................................... 71
2.9 DNA EXTRACTION FROM AGAROSE GEL ................................................................................................................. 71
2.10 CLONING OF PCR PRODUCTS ............................................................................................................................ 71
2.11 SCREENING FOR RECOMBINANT PLASMIDS............................................................................................................ 72
2.12 PLASMID EXTRACTION ..................................................................................................................................... 72
2.13 CLONE STORAGE ............................................................................................................................................ 73
2.14 DNA SEQUENCING REACTION ........................................................................................................................... 74
2.15 PROTEIN POLYACRYLAMIDE GEL ELECTROPHORESIS ................................................................................................. 75
CHAPTER 3 DEVELOPING UNBIASED VIRUS DETECTION ASSAYS .......................................................................... 78
3.1 INTRODUCTION ............................................................................................................................................... 79
3.1.1 Mass Spectrometry in detection of plant viruses ................................................................................... 79
3.1.2 Second generation sequencing used in plant virus identification ........................................................... 81
3.2 MATERIALS AND METHODS ................................................................................................................................ 83
3.2.1 Detection of plant viruses using PMF.................................................................................................... 83 3.2.1.1 Plant and virus samples ..................................................................................................................................83 3.2.1.2 Extraction of plant and virus proteins .............................................................................................................84 3.2.1.3 One-dimensional polyacrylamide gel electrophoresis......................................................................................88 3.2.1.4 Protein in-solution digestion and PMF analysis ...............................................................................................88 3.2.1.5 Protein in-gel digestion and peptide recovery .................................................................................................90 3.2.1.6 In-gel digested PMF analysis using prOTOF 2000 MALDI O-TOF mass spectrometer .........................................93 3.2.1.7 Detection and characterisation of viral CP by Voyager mass spectrometry ......................................................94 3.2.1.8 Virus protein sequencing................................................................................................................................95
3.2.2 Second generation sequencing ............................................................................................................. 96 3.2.2.1 Virus detection using NGS ..............................................................................................................................96 3.2.2.2 Detection of virus using PCR ...........................................................................................................................96
3.3 RESULTS ........................................................................................................................................................ 98
3.3.1 Detection of plant viruses using PMF.................................................................................................... 98 3.3.1.1 In-solution digestion and optimising PMF using MS ........................................................................................98 3.3.1.2 Identification of RuBisCO from polyacrylamide gel ........................................................................................ 100 3.3.1.3 Identification of viruses ................................................................................................................................ 103 3.3.1.4 Non-viral protein Peptide Mass Fingerprinting analysis ................................................................................. 124 3.3.1.5 MS/MS sequencing of the coat protein of Pelargonium zonate spot virus ...................................................... 128

11
3.3.2 Detection of plant viruses using Next Generation Sequencing ............................................................. 130
3.4 DISCUSSION ................................................................................................................................................. 140
3.4.1 Using Peptide Mass Fingerprinting to identify plant viruses ................................................................ 140 3.4.1.1 Selection of propagation hosts for virus and protein extraction protocols ..................................................... 140 3.4.1.2 Visualisation of viral proteins using one-dimensional PAGE ........................................................................... 143 3.4.1.3 Peptide Mass Fingerprinting and tandem MS/MS sequencing ....................................................................... 146 3.4.1.4 Pelargonium zonate spot virus ..................................................................................................................... 147
3.4.2 Using Next Generation Sequencing to identify plant viruses ............................................................... 148
CHAPTER 4 A NEW ENCOUNTER BETWEEN A VIRUS AND A GRAIN LEGUME AT THE INTERFACE OF AN ANCIENT
‘BIODIVERSITY HOTSPOT’ AND A RECENT AGROECOSYSTEM ............................................................................. 152
4.1 INTRODUCTION ............................................................................................................................................. 153
4.2 METHODS AND MATERIALS.............................................................................................................................. 158
4.2.1 Virus resource, inoculation and grafting ............................................................................................. 158
4.2.2 Field plot layout, field data collection, seed transmission .................................................................... 160
4.2.3 Interactions of three HarMV isolates against four lupin cultivars ........................................................ 165
4.3 RESULTS ...................................................................................................................................................... 166
4.4 DISCUSSION ................................................................................................................................................. 175
CHAPTER 5 DETECTION AND QUANTIFICATION OF VIRUSES IN SINGLE OR MIXED INFECTED PLANTS USING REAL-
TIME PCR ........................................................................................................................................................... 180
5.1 INTRODUCTION ............................................................................................................................................. 181
5.2 METHODS AND MATERIALS.............................................................................................................................. 187
5.2.1 Quantifying necrotic and non-necrotic HarMV isolates in lupin plants ................................................ 187
5.2.2 Quantification of HarMV from wild H. comptoniana leaves showing symptom variation ..................... 189
5.2.3 Quantification of CMV/HarMV in leaf tissues of single/double infected N. benthamiana plant ............ 190
5.3 RESULTS ...................................................................................................................................................... 193
5.3.1 Quantitation of necrotic and non-necrotic isolates of HarMV in lupin ................................................. 193
5.3.2 HarMV WHP-2 quantification in wild H. comptoniana ........................................................................ 196
5.3.3 CMV/ HarMV quantification in single/ double infected N. benthamiana ............................................. 201
5.4 DISCUSSION ................................................................................................................................................. 209
CHAPTER 6 GENERAL DISCUSSION ..................................................................................................................... 215
6.1 OVERVIEW OF MAJOR OUTCOMES ...................................................................................................................... 216
6.2 TECHNIQUES TO IDENTIFY AND CHARACTERISE PLANT VIRUSES ................................................................................... 219
6.3 INFECTION RATE AND SPREAD PATTERN OF HARMV IN FIELD TRIALS............................................................................ 224
6.4 FUTURE RESEARCH ......................................................................................................................................... 227
APPENDIX 1 ....................................................................................................................................................... 230
APPENDIX 2 ....................................................................................................................................................... 231
REFERENCES ....................................................................................................................................................... 232
12
LIST OF ABBREVIATIONS
Viruses:
AMV Alfalfa mosaic virus
ApVY Apium virus Y
ArMV Arabis mosaic virus
BaMMV Barley mild mosaic virus
BaYMV Barley yellow mosaic virus
BBMV Broad bean mottle virus
BCMNV Bean common mosaic necrotic virus.
BCMV Bean common mosaic virus
BMV Brome mosaic virus
BMYV Beet mild yellowing virus
BNYVV Beet necrotic yellow vein virus
BWYV Beet western yellows virus
BYDV Barley yellow dwarf virus
BYMV Bean yellow mosaic virus
BYV Beet yellows virus
CABMV Cowpea aphid-borne mosaic virus
CarVY Carrot virus Y
CBSV Cassava brown streak virus
CCMV Cowpea chlorotic mottle virus
CeMV Celery mosaic virus
CerMV Ceratobium mosaic virus
CliVY Clitoria virus Y

13
CLBV Citrus leaf blotch virus
CLCuV Cotton leaf curl virus
CLRV Cherry leaf roll virus
CMV Cucumber mosaic virus
CMV-Mi Cucumber mosaic virus (Mi isolate)
CMV-Z Cucumber mosaic virus (Z strain)
CNSV Cycas necrotic stunt virus
CRLV Cherry rasp leaf virus
CTV Citrus tristeza virus
CYBV Cassia yellow blotch virus
CYVV Clover yellow vein virus
DiVY Diurus virus Y
DsMV Dasheen mosaic virus
EAPV East Asian passiflora virus
EmoV Elm mottle virus
EVY Eustrephus virus Y
GCMV Grapevine chrome mosaic virus
GFLV Grapevine fanleaf virus
HarMV Hardenbergia mosaic virus
HiVY Hibbertia virus Y
JGMV Johnsongrass mosaic virus
MCMV Maize chlorotic mottle virus
MStV Maize stripe virus
MYFV Melandrium yellow fleck virus
OLV-2 Olive latent virus 2

14
OrMV Ornithogalum mosaic virus
PClV Passiflora chlorosis virus
PFVY Passiflora foetida virus Y
PleVY Pleione virus Y
PRMV Peach rosette mosaic virus
PRSV Papaya ringspot virus
PSbMV Pea seed-borne mosaic virus
PStV Potato spindle tuber virus
PSV Peanut stunt virus
PtVY Pterostylis virus Y
PVX Potato virus X
PVY Potato virus Y
PWV Passionfruit woodiness virus
PZSV Pelargonium zonate spot virus
PZSV-T Pelargonium zonate spot virus (Tomato strain)
PZSV-W Pelargonium zonate spot virus (Woodman point isolate)
RGMV Ryegrass mosaic virus
RhoVY Rhopalanthe virus Y
RpRSV Raspberry ringspot virus
RYMV Rice yellow mottle virus
S1VY Siratro 1 virus Y
S2VY Siratro 2 virus Y
SarVY Sarcochilus virus Y
SBLV Spring beauty latent virus
SDV Satsuma dwarf virus

15
SLRSV Strawberry latent ringspot virus
SLV Shallot latent virus
SMV Soybean mosaic virus
SPFMV Sweet potato feathery mottle virus
SPVY Sweet potato virus Y
TBRV Tomato black ring virus
TMV Tobacco mosaic virus
ToMV Tomato mosaic virus
ToRSV Tomato ringspot virus
TRSV Tobacco ringspot virus
TSV Tobacco streak virus
TSWV Tomato spotted wilt virus
TuMV Turnip mosaic virus
WCCV White clover cryptic virus
WMV Watermelon mosaic virus
WSMV Wheat streak mosaic virus
WVMV Wisteria vein mosaic virus
ZYMV Zucchini yellow mosaic virus
Other abbreviations used in the text:
ABC ammonium bicarbonate
ACN acetonitrile
BLAST Basic Local Alignment Search Tool
bp base pairs
BSA bovine serum albumin
16
cCP coherently evolving capsid
cDNA complementary DNA
CHCA α-Cyano-4-hydroxycinnamic acid
CLCuD Cotton leaf curl disease
CP coat protein
Ct threshold cycle
cv cultivar
CysPro cysteine protease
Da Dalton
DCL Dicer-like
dNTPs nucleotide mix
DTT Dithiothreitol
dsDNA double-stranded DNA
dsRNA double-stranded RNA
ELISA Enzyme-linked immunosorbent assay
ESI Electrospray Ionization
GFC gel filtration chromatography
HC helper components
HPLC-MS/MS High Performance Liquid Chromatography-Tandem Mass Spectrometry
HR hypersensitive response
ICTV International Committee on Taxonomy of Viruses
LB Luria Broth
MALDI Matrix-assisted Laser Desorption-Ionization
miRNAs microRNAs
MP movement protein
17
mRNAs messenger RNAs
MS mass spectrometry
MS/MS tandem mass spectrometry
N necrotic
NGS next generation sequencing
NN non-necrotic
NTB nucleotide-binding protein
PAGE polyacrylamide gel electrophoresis
PCR polymerase chain reaction
PMF peptide mass fingerprinting
PMSF phenylmethylsulfonylfluoride
PP1 protein phosphatase 1
PP2 protein phosphatase 2
PVPP polyvinylpolypyrrolidone
RACE rapid-amplification of cDNA ends
RdRp RNA-dependent RNA polymerase
RT reverse-transcribing
RT-PCR reverse transcription polymerase chain reaction
RT-qPCR reverse transcription quantitative polymerase chain reaction
RuBisCO ribulose-1,5-bisphosphate carboxylase oxygenase
SA sinapinic acid
SBS sequencing by synthesis
SD standard deviation
siRNA small interfering RNA
ssDNA single-stranded DNA
18
ssRNA- negative sense single-stranded RNA
ssRNA+ positive sense single-stranded RNA
TAE Tris-acetate acid-EDTA
TBIA Tissue blot immunoassay
TCA trichloroacetic acid
TEM Transmission electron microscopy
TFA trifluoroacetic acid
UTRs untranslated regions
VPg viral protein genome-linked
WCM wheat curl mite

19
ACKNOWLEDGEMENTS
I wish to express my gratitude to my principle supervisor Dr Steve Wylie for the opportunity to
undertake my PhD under his supervision. I would like to thank him for his continued patience,
support, guidance and encouragement. I also thank him for choosing the symptomatic Easter lily
(Lilium longiflorum) and for doing the RNA extraction for next generation sequencing. Many thanks
are due for the large amount of time and energy spent on the papers and thesis manuscript
correction, and finally thanks are due for his help in the field trial and sharing his wide
knowledge of plant virology.
I thank Prof. Mike Jones for giving me the opportunity to undertake my PhD under his
supervision in the Plant Biotechnology Research Group. All the advice, support and guidance
throughout the project are much appreciated. Thanks for his patience and time spent on the
papers and thesis manuscript correction.
My thanks also go to Dr Roger Jones, Brenda Coutts, and Mingpei You (Department of
Agriculture and Food Western Australia, Perth) for their advice on the field trial and providing
isolates of ZYMV, TuMV, CMV and AMV. I would also like to thank to Monica Kehoe and Eva
Gajda (Agriculture and Food Western Australia, Perth) for testing many lupin samples using
ELISA.

20
I would like to give my appreciation to Melvin Gay and Dr. David Berryman for their help when I
operated the prOTOFTM 2000 MALDI orthogonal time-of-flight Mass Spectrometer
(PerkinElmer). I also thank Liyan Gao for help when I used the Voyager-DE™ PRO Workstation
(Applied Biosystems). I would also like to thank Dr. Sheila Mortimer-Jones, Dr. John Fosu-
Nyarko and Dr. Muhammad Saqib for useful advice on real-time PCR experiments and special
thanks to Dr. Hua Li (UWA) for her encouragement and advice on protein extraction protocols.
All my colleagues in the SABC are much appreciated for their kind help. The project was funded
under the Australian Research Council Linkage Grant LP0882671 and the Murdoch University
Research Institutes of Sustainable Ecosystems, and Crops and Plant Science Research.
And finally, I would like to give special thanks to my parents and Fei Yuan for their unwavering
love and support throughout my life, and for keeping me motivated to complete this work.

21
CHAPTER 1 LITERATURE REVIEW
22
1.1 Overview of plant viruses
This study aims to develop new tools, peptide mass fingerprinting (PMF) and next-generation
nucleotide sequencing (NGS), to detect novel or unexpected viruses without prior knowledge of
them. Two field experiments were undertaken to study the potential threat of the Australian
indigenous potyvirus, Hardenbergia mosaic virus (HarMV), to spread from its natural host,
Hardenbergia comptoniana into narrow-leafed lupin (Lupinus angustifolius) crops. Real-time
quantitative PCR was used to titrate the necrotic (N) and non-necrotic (NN) isolates of HarMV,
and study the interaction between two co-infecting viruses, HarMV and Cucumber mosaic virus
(CMV) in lupin plants.
Plant viruses are nucleoproteins which can only multiply in living plant cells or their vectors.
Their particle sizes range from 20 - 950 nm. A complete virion consists of nucleic acid
surrounded by a protecting capsid (coat) protein (CP) which is encoded by the genome of the
virus. Viruses are traditionally considered to be parasites, which employ host cell machinery to
replicate their own genomes. Plant viruses in the genus Tospovirus (family Bunyaviridae) and
family Rhabdoviridae also have an outer bilayer envelope containing lipid, resembling
envelopes of animal viruses (Whitfield et al., 2005).
23
Viruses are classified into six groups based on the nature of their genome: double-stranded
DNA (dsDNA) viruses, single-stranded DNA (ssDNA) viruses, reverse-transcribing viruses (RT),
double-stranded RNA (dsRNA) viruses, negative sense single-stranded RNA (ssRNA-) viruses and
positive sense single-stranded RNA (ssRNA+) viruses. The only plant viruses in the group of
dsDNA viruses are the Caulimoviridae family, classified in reverse-transcribing viruses. Two
plant virus families, the Geminiviridae and Nanoviridae constitute the group of ssDNA viruses.
Their genomes often consist of two or more circular components (Chasan, 1995; Vetten, 2008).
Two plant virus genera in virus family Partitiviridae, Alphacryptovirus and Betacryptovirus, have
dsRNA genomes. The majority of plant viruses are included in the ssRNA+ group with fewer in
the ssRNA- group (such as viruses in the families Bunyaviridae and Rhabdoviridae). dsRNA and
ssRNA viruses all use a template-specific RNA-dependent RNA polymerase (RdRp), also known
as RNA replicase, for genome replication. The difference between ssRNA+ and ssRNA- viruses is
that ssRNA- viruses translate genes into proteins from an RNA strand complementary to that of
the genome while ssRNA+ viruses translate directly from RNA sequences of the genome.
Reverse-transcribing virus replication includes the synthesis of DNA from RNA by the enzyme
reverse transcriptase (via an RNA intermediate), such as viruses in family Caulimoviridae, with
genomes arranged with a single molecule or two segments of open circular dsDNA (Hull, 1999).
The International Committee on Taxonomy of Viruses (ICTV) is the committee which authorises
and organises the taxonomic classification of viruses. The objective of the ICTV is to
communicate taxonomic decisions to the international community of virologists and develop an

24
internationally agreed taxonomy for viruses, which classify viruses on levels of order, family,
subfamily, genus and species. According to the most recent report of the ICTV (8th) published in
2005 (Fauquet et al., 2005), plant viruses are divided into 16 families, with 61 genera in these
families, and 17 unassigned genera, giving a total of 797 recognized species. There are two
families of the circular ssRNA viroids, with 7 genera and 28 species, and 4 satellite virus species
(Rybicki, 2005). New taxonomic proposals are always kept open, discussed and accepted by
ICTV, especially for creating novel virus species, genera and families (Carstens, 2009).
1.2 Plant viruses in Australia
Since prehistoric times wild plants have been used for food, fibre, ornaments and medicine by
mankind. As wild plants were domesticated ten to fifteen thousand years ago, human activities
impacted both on plant evolution by plant selection, and on the plant viruses that infect them.
Unlike the situation that existed in most other continents, agriculture was not developed by the
original human inhabitants of Australia. Cultivated plants were introduced into Australia only
about 200 years ago when Europeans and others colonised the continent. Plant viruses of the
native flora, therefore, have not had a long duration to evolve with introduced crops, and many
of them have not yet been shown to invade cultivated plants and remain restricted to wild
plants (Gibbs & Guy, 1979; Cooper & Jones, 2006). Therefore Australia provides a unique model
for research on virus evolution and the effects of human intervention, providing an ideal

25
environment to study encounters between endemic viruses and introduced crops, and vice-
versa (Webster et al., 2007).
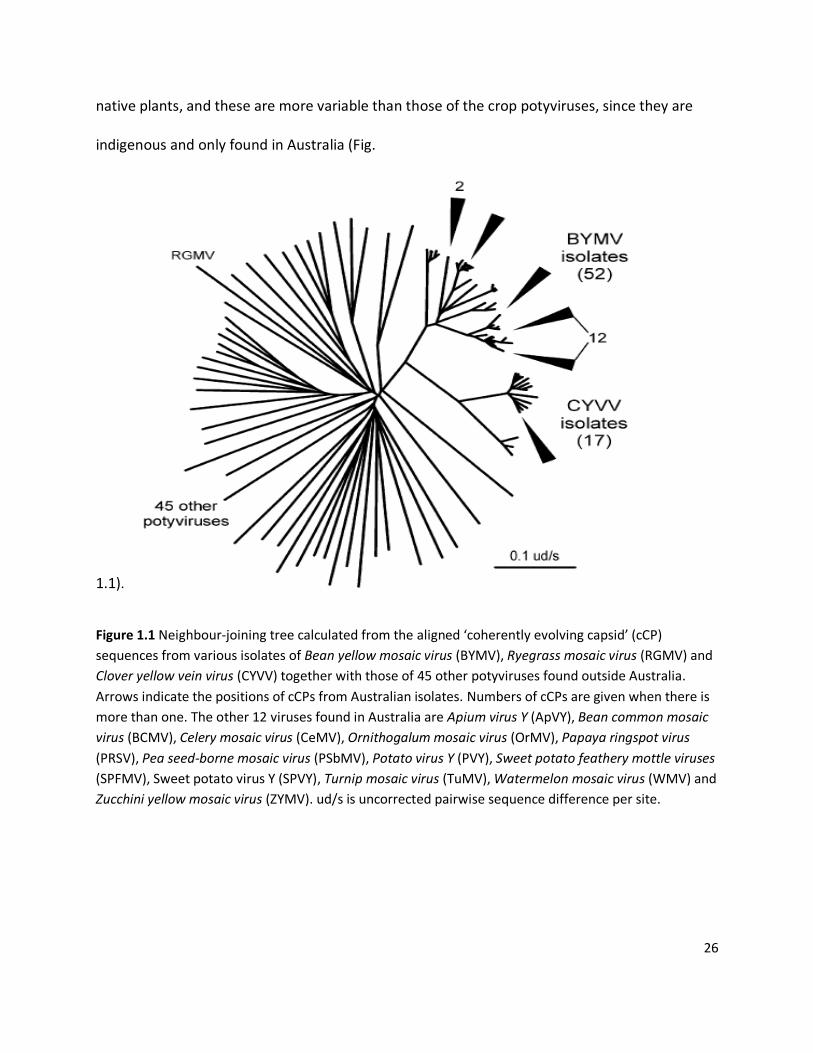
The greatest genetic diversity of an organism is normally present at the location where the
organism first evolved (Stenger et al., 2002; Webster et al., 2007; Gibbs et al., 2008) (Fig. 1.1).
Potyviruses native to Australia are a case in point. The genetic diversity of Australian endemic
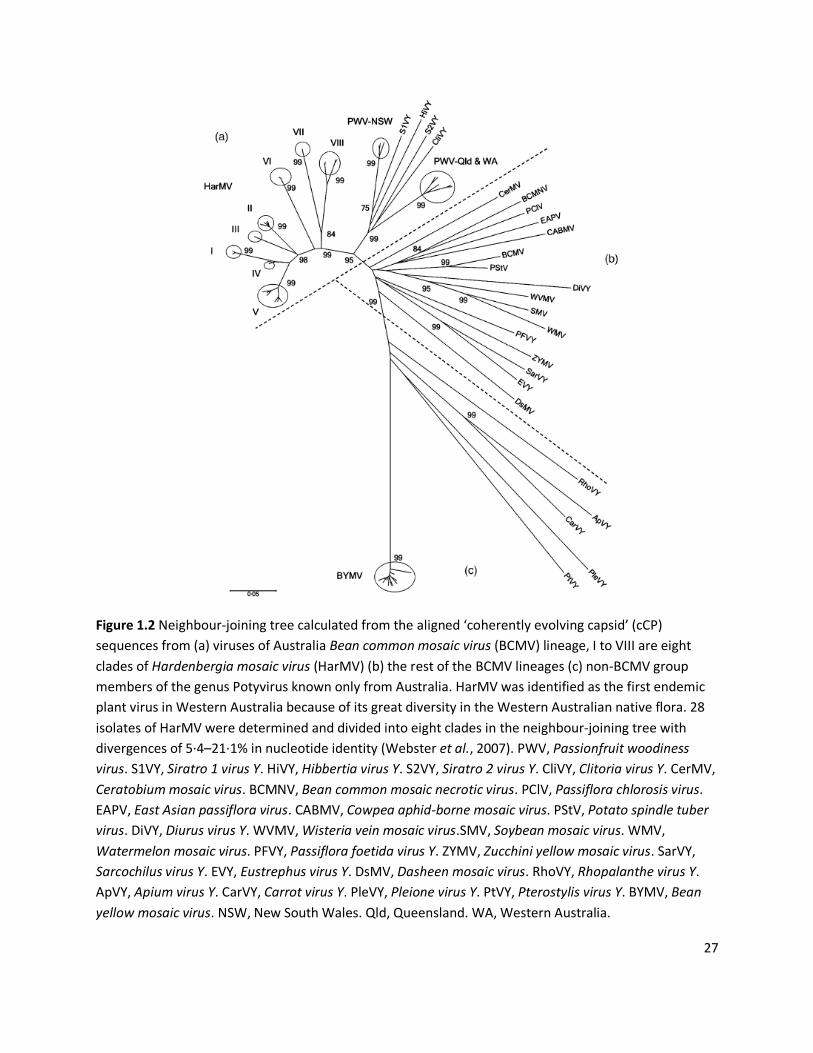
potyviruses is greater within Australia (Gibbs et al., 2008). In 2007, Webster et al. characterised
a previously undescribed potyvirus from a native legume H. comptoniana and named it HarMV.
The nucleotide sequences of CP genes of 28 HarMV isolates showed up to 21% diversity and
clustered into eight distinct clades (Fig. 1.2). In contrast, most potyviruses isolated from crops in
Australia originated from other regions of the world, and this is confirmed by phylogenetic
analysis, which shows that for such introduced viruses, their genetic diversity is much lower in
Australia. This tendency can be explained by the fact that plant viruses that affect domesticated
plants in other parts of the world have evolved for up to ten thousand years, in the centres of
origin of cultivated crop species in other continents (Cooper & Jones, 2006), while both the
crops and crop viruses were introduced into Australia only within the last 200 years, and grown
on a large scale only since the 1920s. Gibbs et al. (2008) suggested that the potyviruses in
Australia were divided into two groups: one group was introduced to Australia only two
centuries ago by European migrants, and the constituent viruses are genetically closely related
to, but less variable than potyviruses present in other regions of the world. For the other group,
all members belong to the Bean common mosaic virus (BCMV) lineage, mostly isolated from
26
native plants, and these are more variable than those of the crop potyviruses, since they are
indigenous and only found in Australia (Fig.
1.1).
Figure 1.1 Neighbour-joining tree calculated from the aligned ‘coherently evolving capsid’ (cCP)
sequences from various isolates of Bean yellow mosaic virus (BYMV), Ryegrass mosaic virus (RGMV) and
Clover yellow vein virus (CYVV) together with those of 45 other potyviruses found outside Australia.
Arrows indicate the positions of cCPs from Australian isolates. Numbers of cCPs are given when there is
more than one. The other 12 viruses found in Australia are Apium virus Y (ApVY), Bean common mosaic
virus (BCMV), Celery mosaic virus (CeMV), Ornithogalum mosaic virus (OrMV), Papaya ringspot virus
(PRSV), Pea seed-borne mosaic virus (PSbMV), Potato virus Y (PVY), Sweet potato feathery mottle viruses
(SPFMV), Sweet potato virus Y (SPVY), Turnip mosaic virus (TuMV), Watermelon mosaic virus (WMV) and
Zucchini yellow mosaic virus (ZYMV). ud/s is uncorrected pairwise sequence difference per site.
27
Figure 1.2 Neighbour-joining tree calculated from the aligned ‘coherently evolving capsid’ (cCP)
sequences from (a) viruses of Australia Bean common mosaic virus (BCMV) lineage, I to VIII are eight
clades of Hardenbergia mosaic virus (HarMV) (b) the rest of the BCMV lineages (c) non-BCMV group
members of the genus Potyvirus known only from Australia. HarMV was identified as the first endemic
plant virus in Western Australia because of its great diversity in the Western Australian native flora. 28
isolates of HarMV were determined and divided into eight clades in the neighbour-joining tree with
divergences of 5·4–21·1% in nucleotide identity (Webster et al., 2007). PWV, Passionfruit woodiness
virus. S1VY, Siratro 1 virus Y. HiVY, Hibbertia virus Y. S2VY, Siratro 2 virus Y. CliVY, Clitoria virus Y. CerMV,
Ceratobium mosaic virus. BCMNV, Bean common mosaic necrotic virus. PClV, Passiflora chlorosis virus.
EAPV, East Asian passiflora virus. CABMV, Cowpea aphid-borne mosaic virus. PStV, Potato spindle tuber
virus. DiVY, Diurus virus Y. WVMV, Wisteria vein mosaic virus.SMV, Soybean mosaic virus. WMV,
Watermelon mosaic virus. PFVY, Passiflora foetida virus Y. ZYMV, Zucchini yellow mosaic virus. SarVY,
Sarcochilus virus Y. EVY, Eustrephus virus Y. DsMV, Dasheen mosaic virus. RhoVY, Rhopalanthe virus Y.
ApVY, Apium virus Y. CarVY, Carrot virus Y. PleVY, Pleione virus Y. PtVY, Pterostylis virus Y. BYMV, Bean
yellow mosaic virus. NSW, New South Wales. Qld, Queensland. WA, Western Australia.
28
1.3 Detection, identification and characterisation of plant viruses
Although some beneficial viruses have been discovered in plant hosts (Roossinck, 2011), most
plant viruses cause a range of diseases, which are detrimental both to ecosystems and to
agricultural production. Identification of virus pathogens is often a first step in control. Two or
more techniques are often required to identify viruses, especially for unexpected or novel
viruses. The main methods available to detect and identify plant viruses currently include
symptom diagnosis and host range studies of experimental host plants, transmission electron
microscopy (TEM), antisera-based immunoassay (e.g. enzyme-linked immunosorbent assay -
ELISA and tissue blot immunoassay - TBIA), nucleic acid hybridization (e.g. microarray), reverse
transcription polymerase chain reaction (RT-PCR) or polymerase chain reaction (PCR) for DNA
viruses, cloning and nucleic acid sequencing, mass spectrometry (MS) and NGS.
1.3.1 Experimental host plants
Experimental host plants are often chosen because they are susceptible to a range of viruses, or
they permit high titre infections or are species which are readily infected and maintained
(propagation hosts), or they show a strong physical response to infection, such as local lesions
(local lesion hosts). Many commonly-used experimental host plants are found in the genera
Nicotiana, Solanum, Chenopodium, Cucumis, Phaseolus, Vicia and Brassica (Hull, 2002).

29
The selection of an indicator plant for a virus is based mainly on the ease of infection after
inoculation or after exposure to the vectors, the time taken to show symptoms and the
consistency of visual symptoms on the leaves. For instance, Allen & Matteoni (1991) tested
eight species for use as indicator plants for the thrips transmitted Tomato spotted wilt virus
(TSWV), genus Tospovirus, family Bunyaviridae. They found petunia and gloxinia developed the
most viral lesions in the shortest time, i.e. 2-3 days after exposure to thrips. Petunia
consistently showed the highest percentage of infection. Symptoms of plants infected by
different viruses in the field are usually inadequate to distinguish one virus responsible for the
disease from another, although some virus infections have characteristic symptoms (e.g. sugar
beet infected with Beet necrotic yellow vein virus (BNYVV)). Viruses often induce very similar
symptoms, such as the yellowing symptoms on beet (Beta vulgaris) caused by Beet yellows virus
(BYV), Beet mild yellowing virus (BMYV), and Beet western yellows virus (BWYV) (Mouhanna et
al., 2002). Bean yellow mosaic virus (BYMV) and HarMV both induce necrotic stem streaking
and leaf downcurling in infected narrow-leafed lupin (L. angustifolius). In other cases different
virus isolates in a species could result in completely different symptoms and susceptibility, such
as CMV isolate LY2 does not systemically infect two commonly-used propagation hosts for CMV,
tomato and cucumber plants (Francki & Hatta, 1980; Lee et al., 2007).
1.3.2 Transmission electron microscopy (TEM)

30
Since the size, shape, pattern of symmetry and other surface features are basic criteria that
distinguish one virus particle from another, it is valid first to attempt to identify viruses by
particle morphology. TEM is a standard approach to identify some viruses based on their
morphological characteristics. For examination of virus particles in crude extracts or purified
preparations, a negative-staining procedure is usually used. The most commonly used electron
dense negative stains are sodium phosphotungstate, ammonium molybdate or uranyl acetate,
depending on the stability of the virus to these stains.
One of the keys to identifying viruses according to morphological characteristics is to determine
particle dimensions, especially for rod-shaped viruses. However, this can be influenced by
preparation and stain. Thus when researchers define the size of a specific kind of virus the
method of preparing and staining samples must be stated as well. The structure of the virus CP
is another indicator used to identify or characterise virus particles. According to the appearance
and organisation of the CP there are four virus morphologies: helical, icosahedral, enveloped
and complex. The CPs of helical particles consist of identical subunits which lie outside the
central coiled RNA forming a helix structure. The virions of this kind of virus are rod like or
filamentous (e.g. Potexvirus and Potyvirus, respectively). There are two kinds of rod-shaped
viruses: those with rigid rod viruses, such as Tobacco mosaic virus (TMV), and flexible rod
viruses, such as Potato virus Y (PVY). Flexible rod virus particles are often longer but narrower
than rigid rod viruses. The subunits of viruses with icosahedral symmetry are constructed in an
optimum way to form a closed sphere (e.g. Cucumovirus). Some virus species envelope

31
themselves in membrane of host-origin, such as the outer cell membrane or nuclear membrane.
This type of virus is called an enveloped virus (e.g. Tospovirus).
Apart from observation of particle characteristics, the recording of ultrastructural alterations in
host plant cells induced by virus infection is another way to use TEM to diagnose diseases. For
example, characteristic pinwheel inclusion bodies are present in cells infected by potyviruses
(Roberts et al., 1998). However, preparation of samples for ultrastructural studies using TEM
takes several days. A microwave irradiation method was developed to reduce the preparation
time to shorten this whole procedure to less than half day (Zechmann & Zellnig, 2009). They
investigated two cases: Nicotiana tabacum infected with TMV, and Cucurbita pepo infected
with Zucchini yellow mosaic virus (ZYMV). Large regions of virions aligned parallel in the cytosol
of TMV-infected leaf cells, and cylindrical inclusions induced by ZYMV in the cytosol of infected
leaf cells were clearly observed. Virions were also detected by negative stain. This research
contributed to a rapid virus diagnostic method using TEM.
1.3.3 ELISA and TBIA
Before the ELISA method had been developed, immunoassays were done mainly using
radioactively labeled antigens and antibodies (Yalow & Berson, 1960). The principle of ELISA is
to use the specific binding of antibodies to antigens, with an enzyme linked to the antibodies.
From a subsequent enzyme-substrate reaction, colour or fluorescence is generated, which can

32
be interpreted both qualitatively and quantitatively. ELISA has been used widely as a diagnostic
tool in medicine and plant pathology because it is versatile, relatively sensitive, specific and
easy to automate.
Since ELISA was first described as a detection tool for plant viruses it has become one of the
most widely used and reliable techniques in plant virus research (Clark & Adams, 1977). In this
approach, a labeled secondary antibody is used to bind the specific one, which avoids the
expensive process of linking every specific probe selected to detect different antigens with
enzyme, but instead enables the use of the same secondary antibody, in a process called
‘sandwich ELISA’. Since then, researchers have developed many plant virus antibodies specific
to various levels: isolates, species, strains, sub-groups and genera (e.g. potyvirus) (Jordan &
Hammond, 1991).
TBIA shares the principle of ELISA, in which one of the reactants (usually the antigen) is bound
to a membrane, such as nitrocellulose, and then detected by a labeled antibody probe. TBIA
requires simple equipments and is sensitive (especially with application of a secondary antibody)
and fast. However, it cannot provide quantitative information on the test samples, and
background colour may lead to confusion (Garnsey et al., 1993).

33
1.3.4 Reverse transcription PCR and Real time PCR
PCR is the most widely used method to amplify particular DNA for subsequent analysis (e.g.
sequencing). Most plant virus genomes are RNA based so that viral RNA is first reverse
transcribed into complementary DNA (cDNA) by reverse transcription. Primers used in PCR are
designed from known sequences of the target viral genome, most of which are highly species-
specific. A few group-specific primers are available, such as potyvirus degenerate primers
(Langeveld et al., 1991; Webster et al., 2007). (RT) PCR is in general a much more sensitive
diagnostic method than ELISA, although care must be taken to prevent contamination. New
PCR primers are also much easier to design and synthese than novel antibodies.
RT-PCR is used to detect and quantify a targeted DNA or RNA molecule. Both non-specific
fluorescent dyes (e.g. SYBR Green) that bind with any double-stranded DNA and sequence-
specific DNA probes are used to detect the amplification. Compared with conventional PCR it
allows the detection of PCR amplification during the early phases of the reaction. It is much
more sensitive and the amplified DNA is detected as the reaction progresses in real time.
Multiplex RT-PCR was developed to detect different RNA targets simultaneously in a single
reaction (Osiowy, 1998), which makes this approach a useful detection tool because plants are
often infected with more than one virus. A multiplex RT-PCR assay was developed to detect six
RNA viruses in olive trees (Bertolini et al., 2001). Real-time RT-PCR can be used to detect a small
amount of viral nucleic acid in various biological backgrounds, such as in irrigation waters
34
(Boben et al., 2007), vectors (Boonham et al., 2002) or seeds (Zhang et al., 2010), because of its
high sensitivity. Mortimer-Jones et al. (2009) detected and quantified four potato viruses from
tuber tissue extracts in a multiplex quantitative real-time RT-PCR asssay. Apart from virus
detection, real-time PCR has also been applied to investigate the influence of virus infection on
host gene expression by quantifying messenger RNAs (mRNAs) and microRNAs (miRNAs) in host
plants (Feng et al., 2009). Immunology is sometimes used in combination with RT-PCR to
enhance its sensitivity, such as in immunocapture RT-PCR used in plant virus detection (Žižytė et
al., 2006).
1.3.5 Detection and characterisation of plant viruses by MS
MS has become more widely used in biological research primarily because of the development
of matrix-assisted laser desorption-ionization (MALDI) and electrospray ionization (ESI) MS,
which enable accurate analysis of large biomolecules, such as proteins, peptides, nucleic acids
and carbohydrates. MS is widely used in research on protein-protein interactions, protein-DNA
interactions (Kriwacki & Siuzdak, 2000), post-transcriptional modification of biomolecules
(Taniguchi & Hayashi, 1998), protein mapping (Manabe et al., 2007) and protein identification
(Webster & Oxley, 2005).
Most current virus detection tools require some previous knowledge of the virus, and this is a
drawback for identifying unknown or unexpected viruses. For antisera-based techniques such
35
as ELISA and TBIA a wide range of species-specific antibodies are commercially available, as well
as some antisera that are group-specific (Kiratiya-Angul & Gibbs, 1992). However, such
antibodies are not available for all known viruses, and certainly not for unknown viruses. The
most widely used nucleic acid-based assay for virus identification is enzymatic amplification of
fragments of the virus genome by PCR (preceded by RT in the case of RNA viruses), often
followed by nucleotide sequencing. Microarrays are less commonly used because of inherent
sensitivity and reliability issues (Boonham et al., 2007). In both cases primer/probes are
designed from known sequences of the target genome to be either highly species/strain-
specific or group-specific, depending on the whether identification of one specific virus or a
group of related viruses is desired (Gibbs & Mackenzie, 1997; Webster et al., 2007; Wylie et al.,
2008). Where primer sets amplify a range of viruses, restriction fragment length polymorphisms
within PCR amplicons can be used to identify specific genotypes by electrophoresis or MS
(Michael et al., 2009). Traditional diagnostic methods of symptom evaluation, vector specificity,
host range studies, and electron microscopy to visualise particle and inclusion size and shape
tend to be more generic than molecular methods. Often, two or more assays are combined as
part of the diagnostic process (Cooper et al., 2003). In most plant virology research MS provides
complementary information to plant virus identification. For instance, Seifers et al. (2005)
found a novel virus in sorghum that weakly reacted with Johnsongrass mosaic virus (JGMV)
antiserum. Tandem mass spectrometry (MS/MS) analysis of the CP sequence suggested that it
was a new strain of JGMV, and explained the weak binding to antiserum: the CP sequence of
the new virus strain was rather different from other strains at the position of the antigen-
antibody interaction.
36
MS has been used to study a wide range of biological processes of viruses, including virus-
antibody binding (Siuzdak, 1998), virus-host interactions (Di Carli et al., 2010), protein–protein
interactions (Brizard et al., 2006) and protein dynamics (Lan et al., 2010). Application of MS to
characterise CPs of plant viruses is based on its wide mass measurement range (She et al., 2001;
Padliya & Cooper, 2006), and on PMF (Lewis et al., 1998) and protein sequencing (She et al.,
2001). MS has been used accurately and rapidly to identify viruses based on the molecular
weight of their CPs, especially for prevalent viruses of specific hosts (Thomas et al., 1998; Tan et
al., 2000; Padliya & Cooper, 2006). However, not all CP masses are well characterised for plant
viruses, and the actual protein mass can differ from that predicted from its genomic sequence
because of post-translational modifications. To achieve better sensitivity and specificity, PMF
was developed as a reliable technique to identify different proteins (Pappin et al., 1993). A
protein is digested by a site-specific proteolytic enzyme, such as trypsin or chymotrypsin, to
generate a profile of peptides each with unique masses. The mass data obtained by MS is
subsequently compared with theoretical mass data of proteolytic fragments from a protein
database, which then gives the protein identity (Fig. 1.3). This technique can be used to identify
CPs of plant viruses and therefore resolves different species or mutants of the virus (Lewis et al.,
1998). We have demonstrated its application for detection of unknown viruses in a host using
one-dimensional electrophoresis to separate virus proteins followed by PMF analysis (Luo et al.,
2010) or peptides sequencing (Blouin et al., 2010). Search engines and databases are available,
with which to search for homologous proteins : SEQUEST (MacCoss et al., 2002), MOWSE

37
(Savitski et al., 2005), Mascot (Hirosawa et al., 1993) and Profound (Zhang & Chait, 2000).
Unknown viruses whose sequence is not in a protein database will still remain unidentified, and
such viruses require further analysis by peptide sequencing. MS/MS peptide sequencing can be
used to detect and characterise strains, isolates and minor mutants of virus CPs. Compared to
PMF analysis, sequencing of proteins or peptides provides more accurate information on a
specific virus. For example, She et al. (2001) reported deviations of several Brome mosaic virus
(BMV) isolates in CP amino acid sequences, when these isolates multiplied in different host.

38
Figure 1.3 The principle of identifying plant virus proteins using peptide mass fingerprinting (PMF). Comparison between infected and uninfected plant protein composition indicates suspected coat protein band, which is cut from the polyacrylamide gel and digested by trypsin or other proteinase. Mass spectrometry (MS) is used to accurately measure the peptides’ masses. The masses matching those in protein databases are analysed by an algorithm.

39
1.3.6 Other techniques for plant virus detection
1.3.6.1 NGS: 454 sequencing/illumina sequencing
Recently, competing new ‘massively parallel’ DNA sequencing platforms have been developed.
They are based on attaching hundreds of thousands of relatively short DNA sequences to beads
or slides, and then measuring addition of sequential bases to DNA strands from primers
complementary to target sequences. DNA sequencing technology developed by 454 Life
Sciences (now Roche) called 454 sequencing (Fig. 1.4) has been used in research on human
genomes, metagenomics, genomic structure, ecology, evolution and paleobiology. There have
been routine improvements in library preparation, template preparation and sequencing, and
this technology enables massive parallel sequencing reactions to be done at relatively low cost
(Rothberg & Leamon, 2008). This high throughput pyrosequencing system has been used to
sequence approximately 400-600 megabases of DNA per run, with the latest upgrade providing
reads that average 800 megabases. The second more widely used NGS platform is the
Illumina/Solexa Genome Analyzer by ‘sequencing by synthesis (SBS) technology’. This
technology is based on adding specific nucleotides complementary to target DNA sequences. As
each base is added to each DNA fragment, a highly sensitive camera is used to take the images
of the flash of the fluorescence as the nucleotide is added to record the nucleic sequences. The
Illumina sequencer is able to generate 20 – 25 Gb of high quality data per run and 2.5 Gb per
day. Recent improvements, such as in base-calling approaches (the process of bases being

40
recorded from light signals), makes this technology more accurate, high throughput and cost-
effective (Ledergerber & Dessimoz, 2011).
Several projects have demonstrated the utility of the NGS in detecting and classifying
unexpected pathogens, such as viruses, from a complex biological background. For instance, a
new arenavirus transmitted through solid-organ transplantation was identified using NGS from
three patients who received visceral-organ transplants from a single donor and died 4 to 6
weeks after transplantation (Palacios et al., 2008). The metagenomic analysis of healthy and
infected hives using NGS indicated that Israeli acute paralysis virus presented in unhealthy
honeybees with colony collapse disorder (Cox-Foster et al., 2007). However, Israeli acute
paralysis virus was found not to be the causative agent of colony collapse disorder. It is
essential to have fully biological understanding of the studied disease when using
metagenomics.
Unknown viruses are readily sequenced and detected in complex backgrounds using 454 or
Illumina sequencing without cloning and pre-amplification. Continuous improvements make
these techniques easier to use and less costly (Rothberg & Leamon, 2008). NGS was usually
used with metagenomic analysis to produce a large amount of viral cDNA sequences in complex
background. A previously uncharacterised cucumovirus Gayfeather mild mottle virus was
detected in plant Liatris spicata and its full genome was obtained, developing a routine assay
41
for new viral pathogens (Adams et al., 2009). Roossinck et al. (2010) analysed thousands of
plant samples from northeastern Oklahoma and northwestern Costa Rica for viruses in
metagenomic studies. They discovered a few thousand new plant viruses and linked all of them
to their hosts by using molecular tags at the end of each virus cDNA. By searching using BlastN
and BlastX they concluded that 70% of the samples had putative virus sequences in 11 families.
Most virus sequences were classified to the family level, but it was hard to specify them all to a
known strain or species. Wylie et al. (2010) applied Illumina NGS to analyse infected plants,
both domesticated and wild, and characterised several novel full virus genomes from them by
subsequent bioinformatics analysis. These included Passionfruit woodiness virus (PWV) (full
genome 9,858 nucleotides) (Wylie & Jones, 2011b), Hardenbergia virus A (full genome 6,936
nucleotides) (Wylie & Jones, 2011c) and Shallot latent virus (SLV) (full genome 8,371
nucleotides) (Wylie et al., 2011), and the genomes of another 19 viruses were partially
characterised.
42
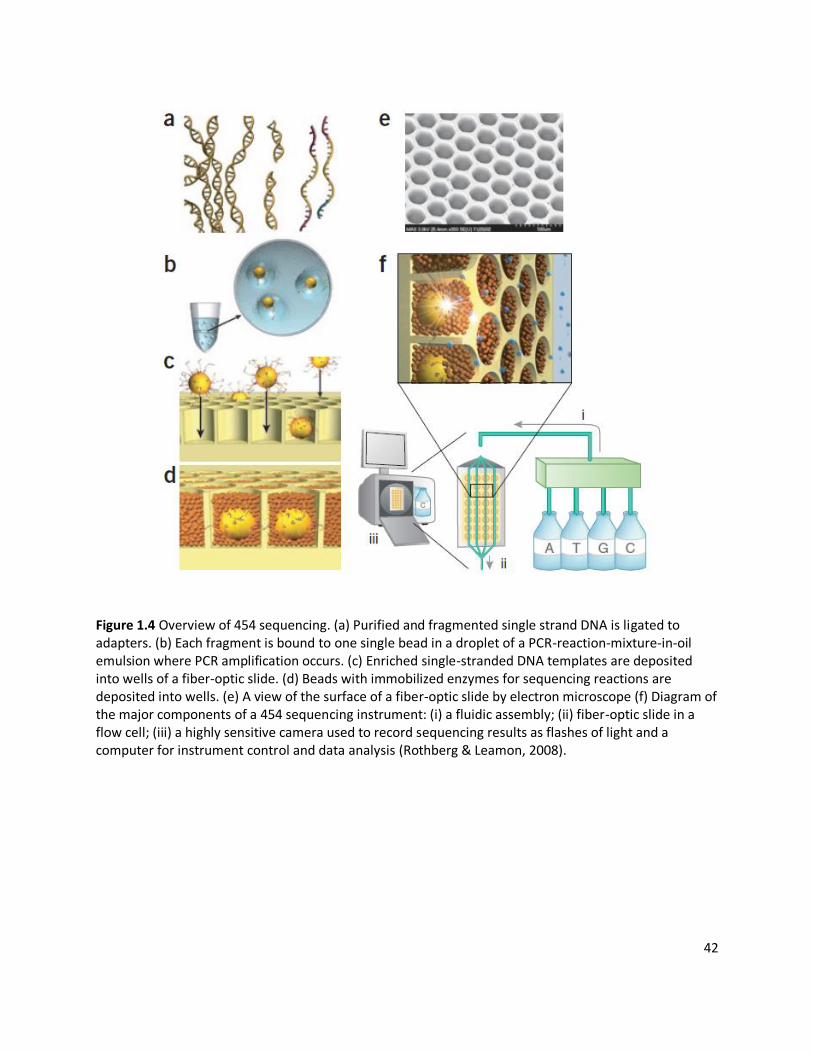
Figure 1.4 Overview of 454 sequencing. (a) Purified and fragmented single strand DNA is ligated to adapters. (b) Each fragment is bound to one single bead in a droplet of a PCR-reaction-mixture-in-oil emulsion where PCR amplification occurs. (c) Enriched single-stranded DNA templates are deposited into wells of a fiber-optic slide. (d) Beads with immobilized enzymes for sequencing reactions are deposited into wells. (e) A view of the surface of a fiber-optic slide by electron microscope (f) Diagram of the major components of a 454 sequencing instrument: (i) a fluidic assembly; (ii) fiber-optic slide in a flow cell; (iii) a highly sensitive camera used to record sequencing results as flashes of light and a computer for instrument control and data analysis (Rothberg & Leamon, 2008).
43
1.3.6.2 Microarrays
Microarrays provide parallel, specific and high-throughput tests for various viruses at different
levels, strains, species, genera or families depending on the specificity of the immobile probes.
Each probe can be bound to the solid support at an individual small spot on the chip, allowing
different DNA fragments to be investigated simultaneously in a highly parallel fashion. In
practice this is useful for screening material for the presence of viruses, for example, from a
quarantine list, or against a list of viruses that should be absent from the material (Boonham et
al., 2007).
One improvement in microarray technology was that synthetic oligonucleotides could be used
to substitute for PCR products as probes, to enhance the sensitivity and specificity for plant
virus identification. For instance, Deyong et al. (2005) successfully distinguished sub-groups of
CMV, with only 8% nucleoide sequence difference between them. Microarrays have been used
to rapidly screen common viruses infecting important crops (Boonham et al., 2003; Call et al.,
2003; Vora et al., 2004; Call, 2005). Microarrays have also been used to provide information on
interactions between host plants and their pathogens, including plant defense responses, by
measuring gene expression via cDNA, i.e. by expression analysis or expression profiling (Wan et
al., 2002). In addition, with improved automation, sensitivity and high-throughput of
microarrays, they are a powerful tool for virus detection (Bystricka et al., 2005; Boonham et al.,
2007). However, NGS is likely to supercede microarray technology as the costs are reducing.

44
Some NGS systems provide both in depth sequence data and quantification of viruses present
in a sample. In addition, the complexities of microarray production and control of hybridisation
conditions make microarrays technically more difficult to use for virus diagnostics.
1.4 Transmission of plant viruses and their vectors
Viruses are described as ‘molecular parasites’ in cells, using bio-molecules and energy of the
hosts for replication, and whose spread and transmission from one host to another is necessary
for survival. However, the presence of cell walls and the immobility of plants are the two main
barriers to plant virus transmission. Some viruses are transmitted in seeds or via pollen and
spread by wind. However, most plant viruses are spread by vectors that can introduce viruses
across cell walls and also aid dispersal of viruses. These include fungi, nematodes, arthropods
and arachnids (Hull, 2002). Mechanical inoculation and grafting are the most convenient and
commonly used methods for virus transmission in laboratory or glasshouse studies (Dijkstra &
de Jager, 1998).
1.4.1 Insects
Insects are the most common vectors of plant viruses. Seven orders of the Class Insecta
transmit plant viruses, most in Thysanoptera and Hemiptera. They have piercing and sucking

45
mouthparts. Other vectors are in Orthoptera, Dermaptera, Coleoptera , Lepidoptera and
Diptera, which have chewing mouthparts (Raccah & Fereres, 2009).
Depending on the way they are transmitted, plant viruses are divided into three groups:
nonpersistent, semipersistent and persistent. Nonpersistent viruses have a short retention time
(usually a few minutes to hours) in the vector, in which virus particles are attached to the stylet
of the insect and are transmitted to the next plant it probes or feeds on. Persistent viruses
remain viable in the insect salivary gland to either replicate (propagative) or not (circulative).
Semipersistent viruses have an intermediate retention time in their vector.
The CP is usually important for virus transmission by insects. Mutations in the CP gene can
often change the transmissibility of the virus (Perry et al., 1998). Many viruses encode helper
components (HC) to facilitate the interaction between virions and their vectors (Kassanis &
Govier, 1971). Pure virions of potyviruses and caulimoviruses cannot be transmitted by their
vectors unless they are present in the mixture of nonstructural virus-encoded protein (HC)
(Raccah & Fereres, 2009).
Piercing and sucking mouthparts, their polyphagous nature and global distribution, make
aphids vectors of many plant viruses. Fifty percent of insect-vectored plant viruses were
reported to be transmitted by aphids (Nault, 1997; NG & Perry, 2004), such as the majority of
46
potyviruses. Thrips are considered to be pests not only because they feed on many commercial
crops but also because they transmit some damaging viruses, such as TSWV, one of the most
damaging viruses of horticultural crops (Martinez, 2005). Leafhoppers feed on a wide range of
plants and are vectors of plant pathogens, including viruses (Todd et al., 2010), phytoplasmas
(Weintraub & Orenstein, 2004) and bacteria (Almeida et al., 2005). Some mastreviruses and
curtoviruses (family Geminiviridae) are spread by different leafhopper species, and affect
several important crops, such as maize, chickpea and cotton (Redinbaugh et al., 2002; Akhtar et
al., 2011).
1.4.2 Nematodes
Although four orders of nematodes feed on plants, only a few species in the migratory
ectoparasitic families Longidoridae and Trichodoridae are vectors of plant viruses. Since 1958,
several nepoviruses of the family Comoviridae were reported to be transmitted by Longidorid
nematodes in America and Europe, including Arabis mosaic virus (ArMV), Tomato black ring
virus (TBRV) and Grapevine fanleaf virus (GFLV) (Brown et al., 1995). So far, of the 38 known
nepoviruses, 13 have been shown to be naturally transmitted by Longidoridae, seven by
Longidorus species, one by Paralongidorus and nine by Xiphinema species, while all
tobraviruses are transmitted by Trichodoridae vector species (Decraemer & Robbins, 2007).
47
With the availability of molecular techniques, research on nematodes that transmit viruses has
focused on mechanisms of plant-nematode-virus interactions. The CPs of nematode
transmitted viruses play an important role in nematode-virus interactions, and there is a high
degree of specificity between vector species and their associated viruses, but CPs are not the
sole determinant for transmission. All the nematode vectored nepoviruses and tobraviruses
have bipartite genomes consisting of two single - stranded RNAs. CP and other proteins
encoded by the RNA-2 are involved in the transmission process (Brown et al., 1995).
Nematodes are widely distributed worldwide, including in Australia. Some are capable of
transmitting harmful viruses to a wide range of fruit and vegetable crops. Since some nematode
species may have long life-cycles or quiescent stages (2 to 5 years) (Lamberti et al., 1975) they
might act as another resevoir of crop viruses apart from wild plants present in fields or their
vicinity.
1.4.3 Fungi
Fungal species of three genera are virus vectors: genus Olpidium in family Olpidiaceae, genus
Polymyxa and genus Spongospora in family Plasmodiophoraceae. These fungi survive as
obligate parasites in the roots of plants, and produce and release zoospores to infect other
healthy plants. The zoospores present at healthy roots withdraw their flagellae and start to
generate cysts whose infection tube can penetrate root cell walls to introduce both fungal

48
material and infective viruses (Kakani et al., 2003). Sometimes zoospores form thick walls and
act as resting spores, remaining in root debris for a substantial time. They can germinate
subsequently and release new zoospores, depending on environmental conditions. Some
viruses enter the resting spores when they form and remain infective. Viruses can then be
transmitted to host plants via zoospores produced by the reactivated virus-containing resting
spores (Dijkstra & de Jager, 1998), making them a long-term repository of crop viruses.
The fungus species Polymyxa graminis, genus Polymyxa, family Plasmodiophoraceae, transmits
cereal viruses causing crop production losses worldwide, including viruses that infect rice,
barley, oats and wheat. For example, Barley yellow mosaic virus (BaYMV) and Barley mild
mosaic virus (BaMMV) cause barley disease that is widespread in Europe and East Asia, which is
of great concern to the agricultural industry (Kanyuka et al., 2003). In one study, the yield of
barley crops infected with BaYMV was reduced by 15% for cv. Maris Otter and 50% for cv. Igri
(Plumb et al., 1986).
1.4.4 Seed- and pollen- borne viruses
In the order of 20% of plant viruses can be transmitted from generation to generation in seeds
either via infected gametes or invasion by the embryo via the ovule. Virus testing is destructive
to seeds and only samples can be tested, giving an infection incidence. It is more difficult to
detect viruses in contaminated seeds, but seed infection is significant because viruses can

49
rapidly extended their geographic distribution through international trade of virus infected
seeds.
It is usually the case that seed-borne viruses are not lethal to the hosts which produce the
seeds in which they are transmitted, and this facilitates virus spread through the crop by
providing an ‘internal infection source’, such as when CMV infects narrow-leaf lupin (L.
angustifolius) (Jones, 2005). Lupin seeds infected with CMV were tested initially using ELISA for
large-scale samples and this was superceded by using RT-PCR for more sensitive detection (to
0.1% infection rate) (Wylie et al., 1993). Testing farmers’ samples and removing this source of
infection from the field is an effective way to reduce crop losses. However, some seed-borne
viruses do not necessarily cause obvious symptoms, such as Pea seed-borne mosaic virus
(PSbMV), which does not produce characteristic symptoms on peas, but nevertheless causes
production loss (Khetarpal & Maury, 1987).
Virus invasion of the embryo via the ovule is related to the host maternal genotype (Wang &
Maule, 1992). Virus invasion of embryo cells occurs via the transient suspensor cells, whose
function is nutritional support of the growing embryo, and which become a route for virus
invasion. Multiple host genes are involved in resistance to seed transmission of PSbMV, such as
maternal genes which prevent the virus from reaching the suspensor before its programmed
degeneration (Wang & Maule, 1994). In addition, pollen transmitted viruses sometimes cause
50
fertilisation failure. For instance, Tobacco ringspot virus (TRSV)-infected soybean produces less
pollen than virus-free plants and germ tubes do not grow normally (Yang & Hamilton, 1974).
1.4.5 Transmission through soil
Plant viruses can be transmitted through soil both in a biotic or an abiotic manner. Biotic
transmission is mainly by nematodes and fungi living in the soil (1.4.2 and 1.4.3). Although it is
not a major pathway for virus spread, some plant viruses are physically held in the soil or in soil
water and can infect healthy roots through wounds (Cadman, 1963; Dijkstra & de Jager, 1998).
Only a few viruses have been found to be transmitted in this way (Harrison, 1960). For example,
Rice yellow mottle virus (RYMV) was detected from guttation fluid collected from infected rice
plants and irrigation water collected at the base of infected plants. RYMV containing soil
remained infective two weeks after soil contamination (Traoré et al., 2008).
1.4.6 Mechanical inoculation and grafting
Spread of plant viruses by direct contact between infected and healthy plants rarely takes place
in nature, and is mainly found in roots. TMV can infect healthy tomato seedlings from infected
tomato debris through contact to the roots (Gergerich, 2004). However, in glasshouse studies,
mechanical inoculation is the method used more often for plant virus diagnosis, host range
tests, assessment of infectivity, characterising symptoms and so on. The infected plant tissues

51
are ground in phosphate buffer (Chapter 2). The sap is mixed with diatomaceous earth (celite)
and rubbed manually against healthy plants to cause wounds on leaves, which provide a route
for virus invasion. Effective and quick manipulation during inoculation is important since viruses
do not remain infective for a long period after isolation.
Grafting is another method that is often used for virus inoculation, especially for viruses that
are unstable in sap or for which no biological vector is available, such as for phloem-limited
viruses (e.g. Citrus tristeza virus (CTV) (Rocha-Peña et al., 1993)). Methods include bud grafting,
wedge grafting and tuber grafting. Grafting can be used as a complementary inoculation
method to mechanical inoculation. It also provides a greater inoculation ‘pressure’, in which a
continuous supply of virus inoculum is delivered from the graft. Grafting with an infective scion
is therefore the most comprehensive method to test whether the stock is susceptible or
resistant to infection by a particular virus.

52
1.5 Impact of plant viruses on agricultural production and natural ecosystems
1.5.1 Losses caused by plant viruses
With the increasing globalisation of trade, particularly over the last 20 to 30 years, plant
products, including edible produce, propagules, ornamental plants and other plant materials
have become widely traded internationally. Inevitably, plant pathogens infecting them are also
spread to distant regions and continents. Plant viruses and phytoplasmas were identified as the
cause of 51% of the emerging infectious diseases of plants worldwide during the period of
1996–2002 (Rodoni, 2009).
The main motivation for the study of plant viruses is the impact of diseases they cause to crops
and native plants. It is difficult to obtain reliable data on global economic losses from plant virus
diseases because much of the data is from small scale experiments rather than comprehensive
global surveys (Hull, 2002). Furthermore, visual symptoms of virus infection do not necessarily
correlate with yield losses or product quality, because effects can be caused by indirect and
more subtle means, which are often not considered. For example, some pollen-borne viruses
can prevent normal germination and growth of the germ tube, which then results in failure to
fertilise the egg, for example in soybean, which results in a reduction of soybean yield without
obvious external symptoms (Yang & Hamilton, 1974).
53
TSWV is the most well studied virus in the genus Tospovirus, family Bunyaviridae, and is
transmitted by the western flower thrips (Frankliniella occidentalis), tobacco thrips (F. fusca)
and some other thrip species. It can infect a range of crops, including tomato, peanut, tobacco
and pepper. As the most damaging disease of peanut crops in America, TSWV caused a 7.5%
loss of peanut production in 2005 in Georgia, valued at $ 31.7 million (Martinez, 2005), and
annual losses for all crops caused by TSWV infection are estimated at $ 100 million in Georgia
(Jain et al., 1998).
Western Australia produces about 80% of the world production of lupin seed, which amounted
to 920,000 t produced on 650,000 ha area in 2005 (Palta et al., 2008), although production has
dropped considerably since then. Of viruses infecting the lupin crop in Australia, BYMV is one of
the most significant (Jones & McLean, 1989). Narrow-leafed lupins show two distinct responses
to BYMV infection, either systemic necrosis (N) or non-necrotic reactions (NN). Infection by the
common N strain of BYMV kills young lupin plants quickly, while infection of older plants
decreases their yields by 55-80% (Jones et al., 2003), depending on the stage of maturity at
infection. Total crop yield losses resulting from the NN strain of BYMV were higher (27-98%)
because affected plants remained infective for the growing season resulting in a polycyclic
spread pattern (McKirdy & Jones, 1995; Cheng & Jones, 2000; Jones, 2005). CMV, transmitted
through lupin seeds, is another economically important virus of lupins. Seedlings infected from
seed planted amongst healthy plants act as the major source of CMV infection in lupin crops,

54
and act as foci for spread of this virus via aphid vectors to the current season’s previously
healthy plants.
Although most viruses are regarded to be detrimental to their hosts, viruses can also be
mutualists and beneficial to their hosts (Roossinck, 2011). In some cases, virus infection
improves plant tolerance to drought and freezing. For example, CMV improved drought
tolerance of various host plants and enhanced freezing tolerance of beet plants (Xu et al., 2008).
A persistent plant virus, White clover cryptic virus (WCCV), encodes a gene that can help
nodulation of its legume plant host (Nakatsukasa-Akune et al., 2005).
1.5.2 Climate change and plant virology
Climate change, a feature of the earth’s periodic cycles of warming and cooling that is
accelerated by human activities (Cox et al., 2000), such as increasing greenhouse gas emission
since the mid-twentieth century, will have a substantial impact on plant-virus interactions.
Climate change results in altered and more extreme climates including changes in temperature
(both warmer and cooler), rainfall (both drier and wetter), and wind patterns.
Temperature and rainfall patterns both affect virus multiplication. Some viruses, their vectors,
and hosts grow in tropical zones, whereas others grow in temperate or cooler zones. With

55
altered temperatures, viruses adapted to warmer climates will establish in regions that are now
cooler, and this will generate encounters between new hosts and viruses. Some resistance
genes are only effective in temperate zones, but are ineffective with warmer temperatures,
which may reduce the effectiveness of resistance genes in warmer climates (Jones, 2009). For
example, the N gene is a single dominant gene conferring a hypersensitive response (HR) to
TMV infection. It develops necrotic local lesions that prevent a systemic necrotic response
when the temperature is below 28 °C, but fails in higher temperatures (Kang et al., 2005). Both
plant density and the duration of leaf water films, with the latter affected by rainfall patterns,
influence host infection, mainly by influencing the behavior of virus vectors (Garrett et al.,
2006). Other changes to climate, such as more frequent drought and higher wind speeds, will
also have an impact on virus epidemics (Jones, 2009). For example, drought reduces soil
moisture, which in turn decreases the activity of zoospores of fungal vectors. Wheat curl mite
(WCM; Aceria tosichella) is the vector of Wheat streak mosaic virus (WSMV), and the wind
speed affects its movement in crops. The spread of plant viruses is not only affected directly by
climate change, but also in indirect ways, such as by changes of virus vector distribution. Aphid
vectors are predicted to increase in numbers, expand their geographical distributions and
advance the timing of spring migrations as a result of climate change (Harrington et al., 1995;
Norse & Gommes, 2003), thus facilitating aphid-borne virus spread.
Early on in the domestication of crops, such crops stayed at their original locations together
with their wild relatives, most within the eight major crop domestication centers (Jones et al.,
56
2003). Over the years, world trade in plant products has expanded the original geographical
range of crops and their pathogens. New encounters of plants and viruses present a significant
threat for both agricultural production and ecological diversity. An aggressive virus that a crop
has not previously encountered before could result in a new damaging disease. In addition,
native flora could be destroyed by new introduction of a virus to a new area, systematically
threatening local biodiversity, especially for those places with there is a delicate ecosystem
which has been geographically isolated from external pathogens for long time (Anderson et al.,
2004). For example, whitefly-borne geminiviruses had been found mainly in East and West
Africa infecting Cassava (Manihot esculenta) in the 1970s (Fondong et al., 2000). There have
now been serious geminivirus diseases in the Western Hemisphere since the 1990s, and these
viruses now widely infect tomato, cotton, cassava, cucurbits, and beans. This is attributed to
worldwide expansion of its vector, and has caused substantial economic losses (Polston &
Anderson, 1997). Geminiviruses destroyed 95% of the tomato harvest in the Dominican
Republic, and caused $140 million loss for tomato production in 1992 in Florida (Moffat, 1999).
Cotton leaf curl disease (CLCuD), caused by a geminivirus Cotton leaf curl virus (CLCuV), became
the major limitation to cotton production in Pakistan in the early 1990s, and it has now spread
into India (Briddon & Markham, 2000).
1.6 Aims and Objectives of this research
1.6.1 Optimising Mass Spectroscopy-based methods to detect viruses

57
Many methods are available that can be used to detect and identify plant viruses in plant
tissues, including symptom diagnosis, host range studies, electron microscopy, serology
hybridization, PCR and DNA sequencing techniques. However, there is no single method that
can be used to identify novel viruses reliably. For example, PCR-based methods, conventional
virus genome sequencing, and ELISA require some prior knowledge of the virus to be detected.
Virologists often have to apply many procedures in order to identify an unknown virus. It is
valuable, therefore, to develop generic approaches to characterise both known and unknown
viruses.
MS provides a new approach to virus detection, identification and characterisation. Detection
of viral proteins, their identification by peptides mass fingerprinting (PMF) and characterisation
with MS/MS protein sequencing are the three most common strategies to detect plant virus
using MS. However, most plant virus research is focused on further characterising known
viruses rather than the detection of new viruses (Tan et al., 2000; She et al., 2001; Padliya &
Cooper, 2006).
Aim 1: A primary aim of this project was to optimise plant virus detection using MS. The
strategy used was one-dimensional gel electrophoresis to separate proteins extracted from
infected plant tissues, to isolate one or more extra protein bands, and to identify novel viruses
in virus infected plants using PMF and MS/MS protein sequencing.

58
1.6.2 Investigating natural spread of an indigenous virus to an introduced crop plant in the
field
HarMV was recently identified and characterised in Western Australia (Webster et al., 2007;
Wylie & Jones, 2011a). Its principle wild host is believed to be H. comptoniana. In glasshouse
experiments HarMV infects L. angustifolius (narrow-leafed lupin), L. cosentinii (sandplain lupin)
and L. luteus (yellow lupin). No research has been done to investigate natural spread of HarMV
to lupins in the field by vectors.
Aim 2: The aim of this experiment was to investigate whether wild aphid vectors can transmit
HarMV to lupins under field conditions, and to find out whether this virus is a potential threat
to the lupin crop.
1.6.3 Symptom responses of lupin genotypes to infection by a range of isolates of HarMV
HarMV infection of narrow-leafed lupin (L. angustifolius) was thought to induce a NN response
similar to that of the NN strain of BYMV (Webster et al., 2007). Isolate MU-4 of HarMV was not
one of the isolates used in the previous glasshouse study by Webster et al. (2007). Isolate MU-4
induced necrotic response in the 2009 pilot field experiment and it belongs to phylogenetic

59
group V of HarMV, none of whose members caused a necrotic reaction in narrow-leafed lupin
in the glasshouse study.
Aim 3: The aim of this experiment was to assess responses of four different genotypes of
narrow-leafed lupin (cvs Mandelup, Belara, Tanjil and Tallerack) infected with three HarMV
isolates (WHP-1, WHP-2 and MU 4) to characterise the responses on the host plants.
1.6.4 Detecting viruses using next generation sequencing
NGS is a new approach to nucleic acid sequencing (Margulies et al., 2005). Because of its power,
NGS has rapidly become a major new technology for genomics research in biology, with the
potential to detect plant pathogens in complex backgrounds. This technique has been used
recently to detect novel viruses, and single or multiple infection of plants (Adams et al., 2009;
Roossinck et al., 2010). Lily plants growing locally were observed to have virus-like symptoms,
including mosaic and chlorotic streaking on the leaves, and they were chosen as a source for
application of NGS.
60
Aim 4: The aim of this experiment was to identify the virus in a symptomatic lily plant using
NGS and bioinformatic analysis, and to characterise the detected virus further by determining
its host range and species distribution in the Perth region.
1.6.5 Quantify virus in single or doubly-infected hosts using real-time PCR
Narrow-leafed lupin (L. angustifolius) cv Belara infected with HarMV isolate WHP-1 showed NN
symptom, and when infected with WHP-2 showed systemic necrosis 22 days after inoculation.
The major host of HarMV is H. comptoniana and infected plants show variable symptoms with
differing severity. N. benthamiana plants with mixed infections of CMV and HarMV exhibit a
strongly synergistic increase in severity of viral symptoms.
Aim 5: The aim of this experiment was to investigate whether HarMV is present in different
titres in plants with differing symptoms, and to determine how plants react to double infection
with HarMV and CMV by quantification of virus presence using real-time PCR.

61
CHAPTER 2 GENERAL MATERIALS AND
METHODS
62
2.1 Introduction
To obtain virus-infected plants and retain the virus in indicator plants in the glasshouse,
mechanical inoculation and graft inoculation was used. DNA sequencing analysis of viruses was
done by extracting total RNA from plant tissues, RT to obtain cDNA, PCR to amplify target
regions and nucleic acid sequencing. For PCR amplicons with more than one component or
where low sequencing quality was obtained using direct sequencing reactions, DNA cloning or
extraction from agarose gels was done. Protein components from infected or uninfected plant
tissues were separated using one-dimensional polyacrylamide gel electrophoresis and stained
by Coomassie blue.
2.2 Inoculations
2.2.1 Mechanical inoculation
Virus indicator hosts and cultivated plants were grown in insect-proof and temperature-
controlled glasshouses (23 °C). When the experimental hosts were in two-leaf stage, infected
leaf tissue was ground in cold (4 °C) 0.05 M potassium phosphate buffer (pH 7.2) with a mortar
and pestle, which was mixed with the diatomaceous earth ‘Celite’ (10 g per 200 ml buffer)
before being rubbed onto young leaves of indicator plants. Inoculated plants were covered by
plastic bags for one or two days to maintain humidity for the plants to recover.
63
2.2.2 Graft inoculation
Wedge-grafting of H. comptoniana was used as a more potent method of inoculation for plants
that were not infected by mechanical inoculation. Stems were cut and a 1 cm vertical incision
was made in the center of the stem. Fresh scions were collected from young infected plants,
primary leaves were cut off to reduce evaporation. The lower end of the scion was cut into a
wedge shape with a length of approximately 1 cm. The scion was inserted into the rootstock
incision and an elastic tape was wound around the graft site tightly so that the combined layer
of scion and rootstock were in close contact. Grafted plants were enclosed with plastic bags to
keep them humid for at least one week.
2.3 RNA extraction
Plant and virus total RNA in infected plants was extracted using a RNeasy Plant MiniTM
extraction kit (Qiagen, # (catalog number) 74904) according to the manufacturer’s instructions
as described below:
Weigh the amount of plant material (usually less than 100 mg for leaves) and put it in a
2 ml tube.
Place the tube in liquid nitrogen and grind the tissue thoroughly into a fine powder.
Before tissue thaws add 450 µl buffer RLT (supplied by the kit) and vortex vigorously.

64
Transfer the entire lysate to a QIAshredder spin column and centrifuge for 2 min at
20,000 × g.
Transfer the supernatant of the flow-through to a new RNase-free tube.
Add 220 µl 100% ethanol to the lysate and pipette to mix.
Transfer the sample to an RNeasy spin column with collection tube. Close the lid gently
and centrifuge for 15 s at 20,000 × g.
Discard the flow-through. Add 700 µl buffer RW1 (supplied by the kit) to the RNeasy
spin column, close the lid gently and centrifuge for 15 s at 20,000 × g.
Discard the flow-through. Add 500 µl buffer RPE (supplied by the kit) to the RNeasy spin
column, close the lid gently and centrifuge for 15 s at 20,000 × g.
Discard the flow-through. Add 500 µl buffer RPE to the RNeasy spin column, close the lid
gently and centrifuge for 15 s at 20,000 × g.
Discard the flow-through together with the collection tube. Place the RNeasy spin
column in a new 2 ml collection tube, close the lid gently and centrifuge for 1 min at
20,000 × g.
Discard the collection tube. Place the RNeasy spin column in a new 2 ml collection tube.
Add 40 µl RNase-free water directly to the spin column membrane. Close the lid gently
and centrifuge for 1 min at 20,000 × g to elute the RNA.
RNA is stored at -80 °C.
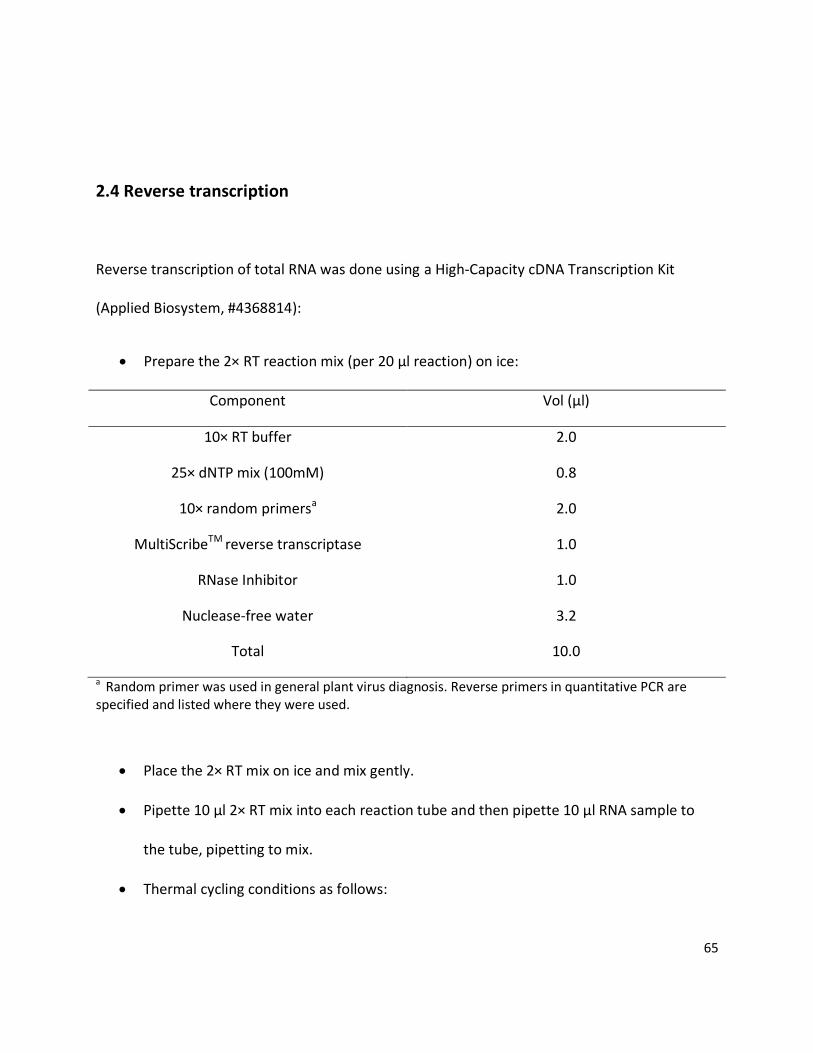
65
2.4 Reverse transcription
Reverse transcription of total RNA was done using a High-Capacity cDNA Transcription Kit
(Applied Biosystem, #4368814):
Prepare the 2× RT reaction mix (per 20 µl reaction) on ice:
Component Vol (µl)
10× RT buffer 2.0
25× dNTP mix (100mM) 0.8
10× random primersa 2.0
MultiScribeTM reverse transcriptase 1.0
RNase Inhibitor 1.0
Nuclease-free water 3.2
Total 10.0
a Random primer was used in general plant virus diagnosis. Reverse primers in quantitative PCR are specified and listed where they were used.
Place the 2× RT mix on ice and mix gently.
Pipette 10 µl 2× RT mix into each reaction tube and then pipette 10 µl RNA sample to
the tube, pipetting to mix.
Thermal cycling conditions as follows:

66
Step 1 Step 2 Step 3 Step 4
Temperature 25 °C 37 °C 85 °C 12 °C
Time 10 min 90 min 5 min ∞
cDNA was stored at -20 °C.
2.5 PCR reaction
2.5.1 Promega GoTaq® Flexi DNA Polymerase
PCR was carried out using Veriti® Thermal Cycler PCR ABI (Applied Biosystems), GoTaq® Flexi
DNA Polymerase (Promega, #M8291), 5× Colourless GoTaq® Flexi Buffer (Promega, #M890A),
Nucleotide Mix (dNTPs) (10 mM each dNTP) (Promega, #C1141), Nuclease-Free Water
(Promega, # P1193) and Magnesium Chloride Solution 25 mM (Promega, #A351B), following
recommended conditions (for each 25 µl reaction):
Component Vol (µl) Final Concentration
5× Colourless GoTaq® Flexi
Buffer
5 1×
Magnesium Chloride Solution
25mM
1 1.0 mM

67
dNTPs, 10 mM each 0.5 0.2 mM each dNTP
Forward primer, 10µM 1 0.4 µM
Reverse primer, 10µM 1 0.4 µM
GoTaq® DNA Polymerase
(5u/μL)
0.125 0.625 u/25 µl
Template DNA 1.0-3.0 < 0.25 µg/25 µl
Nuclease-Free Water to 25
Thermal cycling conditions as follows:
Step Temperature Time Cycles
Initial Denaturation 94 °C 5 min 1
Denaturation 94 °C 10 s
Annealinga 50-55 °C 30 s 30
Extension 72 °C 30 s/kb
Final extension 72 °C 5 min 1
Hold 4 °C hold 1
a Annealing temperature was determined by melting temperature of primers, specified below.
2.5.2 KAPA HiFiTM HotStart DNA Polymerase
KAPA HiFiTM HotStart Kit (KAPA, #KK2501) was used to amplify DNA product as well, following
the manufacturer’s instructions (for each 25 µl reaction):

68
Component Vol (µl) Final concentration
PCR grade water to 25.0
5× KAPA HiFi GC buffer 5.00 1×
dNTP mix, 10 mM each 0.75 0.3 mM
Forward primer, 10 µM 0.75 0.3 µM
Reverse primer, 10 µM 0.75 0.3 µM
Template DNA 1.00-3.00 <50 ng/25 µl
KAPA HiFi HotStart DNA
Polymerase (1 u/µl)
0.5
0.5 u/25 µl
Final vol 25
The thermocycling conditions for KAPA HiFiTM HotStart PCR was as follows:
Step Temperature Time Cycles
Initial Denaturation 95 °C 5 min 1
Denaturation 98 °C 20 s
Annealinga 50-55 °C 15 s 30
Extension 72 °C 30 s/kb
Final extension 72 °C 5 min 1
Hold 4 °C hold 1
a Annealing temperature was determined by melting temperature of primers, specified where they were
used.

69
2.6 Agarose gel electrophoresis
Tris- acetic acid-EDTA (TAE) electrophoresis buffer (50× TAE: 2 M Tris-Acetate; 0.05 M EDTA; pH
8.0 (Sambrook et al., 1989)) was used to make 1% or 2% agarose gels and used as running
buffer. SYBR Safe DNA Gel Stain (Invitrogen, #S33102) was added to agarose gel solution 1
µl/100 ml to visualize DNA amplicons. Each gel well was loaded with 5 µl PCR products with 1 µl
glycerol loading buffer (30% glycerol; 0.25% bromophenol blue). 5 µl 100bp DNA molecular
ladder (Promega, #G2101) was loaded to estimate the size of DNA product. The gel was run on
Bio-Rad Mini-Sub CellsTM or Bio-Rad Wide Mini-Sub CellsTM at 80 V for 20 min or until products
were separated. DNA components were then visualized on a UV transilluminator.
2.7 Purification of PCR products
2.7.1 Ethanol precipitation
PCR products were purified and concentrated using ethanol precipitation:
Add 2.5 vol of ice cold ethanol and 0.1 vol of 3 M Sodium acetate (pH 5.2) to PCR
product. Vortex to mix.
Place the PCR product on ice for 20 min to precipitate DNA.
Centrifuge for 10 min at max speed at 4 °C.
Pipette out the supernatant without touching the bottom of tube.

70
Add 100 µl 70% ethanol and remove it without touching the bottom of tube.
Dry pellet at 37 °C for 10 min and resuspend in Milli-Q water (purified by Milli-Q
Advantage A10 Ultrapure Water Purification System).
2.7.2 Cleanup using MinElute PCR Purification Kit
PCR product was cleaned up for subsequent analysis, using MinElute PCR Purification Kit
(QIAGEN, #28004) as follow:
Add 5 vol of PB buffer (supplied by the kit) to the PCR reaction and mix.
Check that the colour of the mixture is yellow. If not, add 10 µl of 5 M sodium acetate
(PH 5.2) and mix.
Apply the sample to MinElute column and centrifuge for 1 min at 13,000 ×g to bind DNA.
Discard the flow-through.
Add 750 µl PE buffer (supplied by the kit) to the MinElute column and centrifuge for 1
min at 13,000 ×g to wash. Discard the flow-through.
Centrifuge for additional 1 min at 13,000 ×g and discard the flow-through with
collection tube.
Place the MinElute column in a clean tube. Add 10 µl water to the center of the
membrane.
Let the column stand for 1 min and centrifuge for 1 min at 13,000 ×g to elute DNA.

71
2.8 DNA quantification
DNA products were quantified using a Nanodrop UV-Vis spectrophotometer (Nanodrop
Technologies) following the manufacturer’s instructions.
2.9 DNA extraction from agarose gel
PCR products with more than one component were separated by agarose gel electrophoresis.
The target band was excised and the DNA was extracted and purified by MinElute PCR
Purification Kit (QIAGEN, #28004) as described in 2.7.2.
2.10 Cloning of PCR products
For sequencing PCR amplicons containing two or several components with similar molecular
size, they were ligated into a plasmid and transformed into E. coli using pGEM-T easy cloning kit
(Promega, #A1380):
Mix 5 µl 2× rapid ligation buffer, 1 µl T4 DNA ligase, 1 µl pGEM-T easyTM vector and 3 µl
purified PCR amplicon. Incubate for 1-2 h at room temperature or overnight at 14 °C
water bath.
Add 50 µl competent E. coli cells suspension to 2 µl ligated plasmid. Pipette to mix and
incubate on ice for 15 min.

72
Transfer to water at exactly 42 °C for exactly 45 s.
Transfer to ice bath for 1-2 min.
Add 500 µl Luria Broth (LB) media (1.0% Tryptone, 0.5% Yeast Extract, 1.0% NaCl, pH 7.0)
and incubate with shaking at 37 °C for 1 h.
Plate 200 µl transformed E. coli cells on LB agar plates containing 100 mg/ml ampicillin.
Incubate at 37 °C overnight.
2.11 Screening for recombinant plasmids
The colonies on the agar plate were screened for recombinant plasmids using PCR:
Cells were marked and picked up from individual colonies and introduced to 20 µl clean
water.
PCR reactions were carried out using GoTaq® Flexi DNA Polymerase (see 2.5.1).
PCR amplicons with expected sizes were visualized and selected using agarose gel
electrophoresis (see 2.6).
2.12 Plasmid extraction
5 ml LB media with 100 mg/ml ampicillin was used to culture the cells from a selected colony at
37 °C overnight. The plasmids with target fragments were purified using QIAprep Spin Miniprep
Kit (Qiagen, #27104):

73
Transfer 1.5 ml culture to centrifuge tube and pellet the cells at 15,000 ×g for 2 min.
Pipette out the supernatant and resuspend the cells in 250 µl P1 buffer (supplied by the
kit).
Add 250 µl P2 buffer (supplied by the kit) and mix by inverting 6 times.
Add 350 µl N3 buffer (supplied by the kit) and mix by inverting 6 times.
Centrifuge at 15,000 ×g for 10 min.
Apply supernatant to QIAprep spin column and centrifuge for 1 min at 15,000 ×g .
Discard the flow-through.
Add 500 µl PB buffer (supplied by the kit) to wash. Centrifuge at 15,000 ×g for 1 min
and discard the flow-through.
Add 750 µl PE buffer (supplied by the kit) and centrifuge at 15,000 ×g for 1 min. Discard
the flow-through.
Centrifuge at 15,000 ×g additional 1 min to remove residual wash buffer. Discard the
flow-through with collection tube. Place the column in a new clean centrifuge tube.
Add 50 µl water directly to the column membrane and let it stand for 1 min. Centrifuge
1 min at 15,000 ×g to elute the DNA.
2.13 Clone storage
E. coli cells transformed with plasmid containing a target fragment were stored as glycerol
stocks:
Add equal vol of 30% glycerol to 0.5 ml fresh liquid culture.

74
Incubate at room temperature for 30 min to allow glycerol to be taken up by cells.
Liquid nitrogen was used to freeze the mixture rapidly.
Cells were stored at -80 °C.
2.14 DNA sequencing reaction
DNA products purified from PCR reaction, agarose gel or transformed cloning cells were used to
carry out subsequent sequencing reaction. Reaction mix was prepared as follows using BigDye®
Terminator v3.1 Cycle Sequencing Kit (Applied biosytems, # 4337455) (for each 10 µl reaction):
Components Vol
5× sequencing reaction buffer 2.0 µl
Primera, 3.2 pmoles/µl 1.0 µl
BigDye® version v3.1 terminator mix 1.0 µl
DNA product 100 ng
Water to 10 µl
a For sequencing directly from PCR amplicons primers used in PCR reaction were used as a dilute. Sequencing was done from both directions (forward and reverse) or sequencing only from one side was used for diagnostic purpose. Primers M13R and M13F (Promega) were used in plasmid sequencing.
The thermocycling set for sequencing reaction was follows:
Step Temperature Time Cycles

75
a Annealing temperature was determined by melting temperature of primers, specified where they were
used.
Sequencing reactions were cleaned up using ethanol precipitation as follows:
Add 25 µl ethanol, 1µl 3 M sodium acetate (pH 5.2) and 1 µl 125 mM EDTA to each 10 µl
sequencing reaction.
Leave at room temperature for 20 min to precipitate DNA.
Centrifuge at 13,000 ×g for 30 min at 4 °C.
Pipette out the supernatant without disturbing the pellet at the bottom.
Rinse pellet with 125 µl 70% ethanol.
Centrifuge at 13,000 ×g for 5 min at 4 °C.
Remove the supernatant and incubate at 37 °C to evaporate ethanol.
Stored in -20 °C before capillary electrophoresis.
2.15 Protein polyacrylamide gel electrophoresis
Initial Denaturation 96 °C 2 min 1
Denaturation 96 °C 10 s
Annealinga 50-55 °C 5 s 25
Extension 60 °C 4 min
Hold 14 °C hold 1

76
Polyacrylamide gel electrophoresis was used to separate protein components extracted from
plant tissues and visualize differential expressed proteins between infected and uninfected
plants. Gel solution preparation and electrophoresis procedure was as follows:
Prepare separating gel solution as follows:
Component Vol (ml)
40%Acrylamide/Bis Solution 37.5:1 (Bio-Rad,
#161-0148)
15.0
1.5 M Tris-HCl (pH 8.8) 12.5
10% SDS 0.5
Water 21.75
Mix the gel solution. To remove bubbles degas the solution for 60min.
Set up the vertical gel slab apparatus (Bio-Rad PROTEANTM II, # 351084)
Before casting separating gel add 250 µl 10% ammonium persulfate and 25 µl TEMED
(MP Biomedicals, # 04805615). Mix gently and pour the gel solution to the apparatus.
Prepare the stacking gel solution as below:
Component Vol
40%Acrylamide/Bis Solution 37.5:1 (Bio-Rad,
#161-0148)
3.0 ml
1M Tris-HCl (pH 6.8) 3.0 ml
10% SDS 240 µl
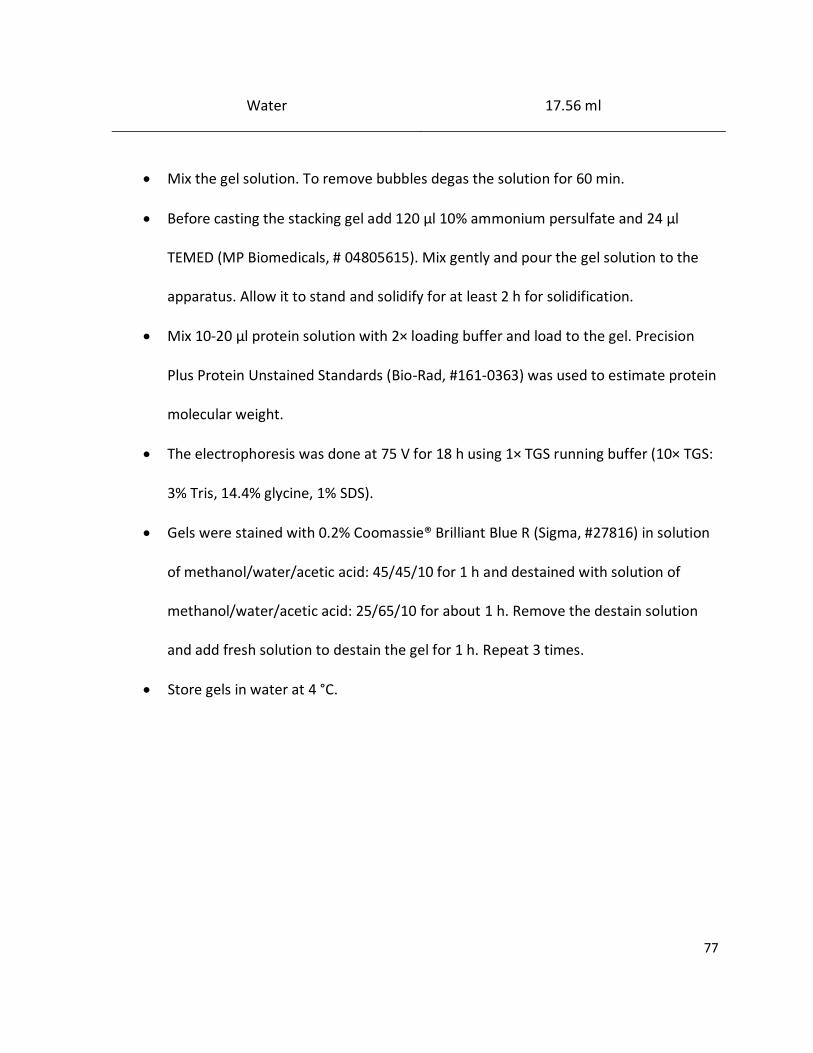
77
Water 17.56 ml
Mix the gel solution. To remove bubbles degas the solution for 60 min.
Before casting the stacking gel add 120 µl 10% ammonium persulfate and 24 µl
TEMED (MP Biomedicals, # 04805615). Mix gently and pour the gel solution to the
apparatus. Allow it to stand and solidify for at least 2 h for solidification.
Mix 10-20 µl protein solution with 2× loading buffer and load to the gel. Precision
Plus Protein Unstained Standards (Bio-Rad, #161-0363) was used to estimate protein
molecular weight.
The electrophoresis was done at 75 V for 18 h using 1× TGS running buffer (10× TGS:
3% Tris, 14.4% glycine, 1% SDS).
Gels were stained with 0.2% Coomassie® Brilliant Blue R (Sigma, #27816) in solution
of methanol/water/acetic acid: 45/45/10 for 1 h and destained with solution of
methanol/water/acetic acid: 25/65/10 for about 1 h. Remove the destain solution
and add fresh solution to destain the gel for 1 h. Repeat 3 times.
Store gels in water at 4 °C.

78
CHAPTER 3 DEVELOPING UNBIASED VIRUS
DETECTION ASSAYS

79
3.1 introduction
3.1.1 Mass Spectrometry in detection of plant viruses
Plant viruses are widespread in plants grown as agricultural crops and in native ecosystems, and
some cause damaging diseases. Since the disease management strategy used depends on the
virus species responsible, it is crucial to accurately identify the virus(es) causing the disease and
then to implement appropriate management strategies.
The assays used most widely to detect plant viruses are based on antiserum affinity and nucleic
acid hybridization, amplification and sequencing. For both approaches, some previous
knowledge of the virus is required and this has been a serious drawback to identifying unknown
or unexpected viruses. MS-based protein profiling has been applied to diagnose various plant
pathogens and pests including aphids (Perera et al., 2005a), nematodes (Perera et al., 2005b),
and viruses (Blouin et al., 2010). A possible output of MS analysis of virus proteins includes the
total mass and resolution of amino acid sequences using MS/MS (Padliya & Cooper, 2006). She
et al. (2001) determined the complete amino acid sequence of the CP of BMV using MS/MS and
distinguished four isolates of the virus. TMV and Potato virus X (PVX) were identified using two-
dimensional SDS polyacrylamide gel electrophoresis (PAGE) to compare proteomes of infected
and uninfected plant tissues. Differential spots were excised, digested by trypsin, sequenced by
High Performance Liquid Chromatography-Tandem Mass Spectrometry (HPLC-MS/MS) (Cooper
et al., 2003). Blouin et al. (2009) partially purified plant virus particles using ultra-centrifugation,

80
visualized viral protein bands on one-dimensional electrophoresis, digested the viral proteins
with trypsin and applied HPLC-liquid chromatography electrospray tandem MS system to
determine peptide sequences. Using this approach, they identified four common and two novel
viruses.
The major limitation of this approach is the amount of purified target peptide needed, which
may require chromatographic purification. PMF is a more rapid MS-based analytical technique
for protein identification (Henzel et al., 1993; James et al., 1993; Mann et al., 1993; Pappin et
al., 1993; Yates et al., 1993). Trypsin cleaves proteins at specific sites (the carboxyl side of the
amino acids lysine or arginine), thereby generating a unique series of peptides whose masses
can be determined by MS analysis. The mass values are then compared to entries in a protein
sequence database with calculated mass values obtained by applying cleavage rules. By using
an appropriate scoring algorithm, the closest match or matches are identified.
In this chapter, identification of known and unknown plant viruses was done by one-
dimensional electrophoresis coupled with PMF. ZYMV, Turnip mosaic virus (TuMV), PWV,
Alfalfa mosaic virus (AMV), TSWV, CMV which are regarded to exist in abundance in their hosts,
were used to optimise this identification assay. Four protein extraction methods were used to
optimise the identification of virus protein bands on polyacrylamide gel. Two protein in-gel
digestion and peptides recovery protocols were tried to maximise the performance of PMF
81
identification. Bovine serum albumin (BSA) (Sigma, #A7906) was digested in solution and
identified by PMF using a prOTOF 2000 MALDI O-TOF mass spectrometer (PerkinElmer) in order
to optimise protein identification by PMF. An unknown virus originated from Cakile maritima
was detected by this assay
3.1.2 Second generation sequencing used in plant virus identification
In 2005 publication of the sequencing-by-synthesis technology developed by 454 Life Sciences
(Margulies et al., 2005) presented a revolutionary change to sequencing compared with the
chain-termination method (Sanger et al., 1977). This second - generation sequencing has been
used in several areas of biological research, including novel virus detection, and is becoming a
more economical sequencing technology since the development of short read method by
Solexa, and later aquired by Illumina. NGS has already shown enormous potential for detecting
unexpected and novel viruses in complex backgrounds. Adams et al. (2009) isolated a new
cucumovirus in L.spicata (Gayfeather) named ‘Gayfeather mild mottle virus’ using NGS (GS-FLX
Genome Sequencer) coupled with metagenomic analysis. Roossinck et al. (2010) analysed
individual plant sample for virus in metagenomic studies by NGS (454 GS-FLX) data and
concluded that ~60% of samples from a Costa Rican rainforest community had sequences with
identity to viruses of fungi. Recently, small interfering RNA (siRNA) derived from viruses was
characterised by NGS to identify plant viruses in a complex background (Kreuze et al., 2009; Yan
et al., 2010). NGS was used as a high-throughput and low-cost method for viromics study
82
(Harris et al., 2008). Wylie and Jones (2011a, b, c) applied Illumina NGS to both domesticated
and wild plants, characterising several novel viral genome sequences from them by subsequent
bioinformatics analysis. They characterised the full genomes of PWV (full genome 9,858
nucleotides) (Wylie & Jones, 2011b), Hardenbergia virus A (full genome 6,936 nucleotides)
(Wylie & Jones, 2011c) and SLV (full genome 8,371 nucleotides) (Wylie et al., 2011), and
another 19 viruses were characterised for part of their genomes. These examples show that
NGS is now one of the cutting edges of plant virus diagnostics. Aim 4 of this project was to use
NGS and bioinformatics to characterise a virus previously unidentified in Australia. Raw data of
NGS consists of millions of short reads (each one 25 to 300 bp or more depending on the
platform used). Bioinformatic analysis of NGS enables assembling and identifying the origins of
sequences, and obtaining the full genomes of the viruses. NGS can also be used to quantify
virus levels in hosts (Wylie & Jones, 2011a).
In international plant trade quarantine is an important issue, and application of quarantine
principles is required in Australia to protect farming systems and native biodiversity from
introduction of exotic viruses. The nepoviruses, a group of viruses in the family Secoviridae,
include 46 species, are nematode transmitted polyhedral viruses that infect a wide range of
plant families, and may be viewed as the most serious virus diseases of horticultural crops by
quarantine authorities worldwide. Nine exotic nepoviruses have been listed as strict quarantine
pathogens and strategies to control nepovirus-infected plant materials entering or spreading
within Australia are in place (http://ictvdb.bio-mirror.cn/Aussi/ausiname.htm (2002)).
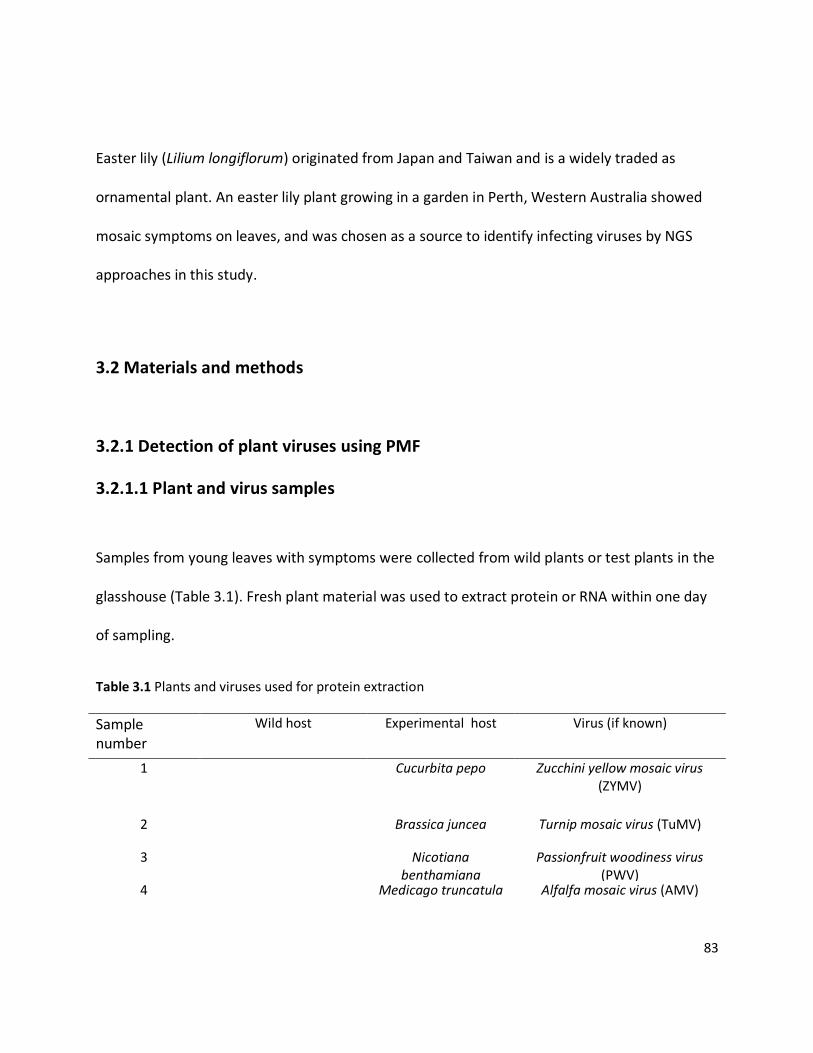
83
Easter lily (Lilium longiflorum) originated from Japan and Taiwan and is a widely traded as
ornamental plant. An easter lily plant growing in a garden in Perth, Western Australia showed
mosaic symptoms on leaves, and was chosen as a source to identify infecting viruses by NGS
approaches in this study.
3.2 Materials and methods
3.2.1 Detection of plant viruses using PMF
3.2.1.1 Plant and virus samples
Samples from young leaves with symptoms were collected from wild plants or test plants in the
glasshouse (Table 3.1). Fresh plant material was used to extract protein or RNA within one day
of sampling.
Table 3.1 Plants and viruses used for protein extraction
Sample number
Wild host Experimental host Virus (if known)
1 Cucurbita pepo Zucchini yellow mosaic virus (ZYMV)
2 Brassica juncea Turnip mosaic virus (TuMV)
3 Nicotiana benthamiana
Passionfruit woodiness virus (PWV)
4 Medicago truncatula Alfalfa mosaic virus (AMV)

84
5 Solanum lycopersicum Tomato spotted wilt virus (TSWV)
6 Hardenbergia comptoniana
Hardenbergia mosaic virus (HarMV)
7 Cakile maritima Nicotiana glutinosa Unknown
8 N. glutinosa Unknown
9 Kennedia coccinea Unknown
10 Anigozanthos manglesii Unknown
11 Phaseolus vulgaris Unknown
12 M. truncatula N. benthamiana Cucumber mosaic virus (CMV)
13 H. comptoniana N. benthamiana HarMV
3.2.1.2 Extraction of plant and virus proteins
Four extraction protocols were tested to determine the best method for extracting proteins
from uninfected and infected plants.
Method 1: Methanol/ chloroform precipitation of proteins
Method modified from Tan et al. (2000)
Weigh 200 mg fresh leaves, freeze in liquid nitrogen and grind thoroughly in a mortar
and pestle.

85
Add 1.5 ml SDS-Tris buffer (125 mM Tris, 7% SDS, pH 7.0, with 0.5%
polyvinylpolypyrrolidone (PVPP) (Sigma, #P6755) added immediately before extraction
and 1 mM dithiothreitol (DTT) (Sigma, #D9779)) and vortex vigorously.
Incubate at room temperature for 30 min and centrifuge at 10,000 × g for 5 min.
Transfer the supernatant (usually 1 ml) to a new centrifuge tube.
Add 4 vol methanol and vortex. Add 1 vol chloroform and vortex. Add 2.5 vol water and
vortex.
Centrifuge at 10,000 × g for 5 min and discard the upper phase.
Add 2.5 vol methanol and vortex to break up protein pellet. Centrifuge at 10,000 × g for
10 min.
Discard the supernatant and let the pellet dry at room temperature. Resuspend the
protein pellet using 250-500 µl MSS solution (5 M urea, 2 M thiourea, 2% SDS, 2% Triton
X-100 (Sigma, #X100), immediately before use add 2 mg/ml DTT (Sigma, #D9779)).
Method 2: Acetone/β- mercaptoethanol precipitation
Method modified from Cooper et al. (2003)
Weigh 100 mg fresh leaves, freeze in liquid nitrogen and grind thoroughly to a fine
powder by mortar and pestle.
Add 10 vol of ice-cold acetone containing 10% wt/vol trichloroacetic acid (TCA) (Sigma,
#T8657) and 0.07% vol/vol β-mercaptoethanol (BioRad, #161-0710).
Incubate at -20 °C for 1 h.

86
Centrifuge at 14,000 × g for 30 min and discard the supernatant.
Wash pellet three times with 10 vol of ice-cold acetone containing 10% wt/vol TCA,
0.07% vol/vol β-mercaptoethanol, 1 mM phenylmethylsulfonylfluoride (PMSF) (Sigma,
#P7626), and 2 mM EDTA, and dried at room temperature.
Resuspend the protein pellet using 150-300 µl MSS solution, immediately before use
add 2 mg/ml DTT (Sigma, #D9779)).
Method 3: Acetone/DTT precipitation
Method modified from Jacobs et al. (2001)
Prepare 20% TCA (Sigma, #T8657) in acetone, stored at -20 °C.
Weigh 3 g fresh leaves, freeze in liquid nitrogen and grind to a fine powder by mortar
and pestle. Transfer the powder into a centrifuge tube.
Add 0.2% DTT (Sigma, #D9779) to acetone containing 20% TCA before use (precipitation
solution).
Add 10 ml of precipitation solution to the centrifuge tube and keep at -20 °C overnight
to allow complete protein precipitation.
Centrifuge at 30,000 × g for 20 min at 4 °C.
Carefully remove the supernatant and wash the pellet in cold acetone (-20 °C)
containing 0.2% DTT.
Centrifuge at 30,000 × g for 20 min at 4 °C. Repeat to wash 2 more times.

87
Dry pellet at room temperature for 3 h to overnight.
Resuspend pellet in 2 ml rehydration buffer (7 M urea, 2 M thiourea, 2% CHAPS (Sigma,
#C9426), immediately before use add 1% DTT). The sample was vortexed and
maintained on an orbital shaker for overnight.
Centrifuge at 30,000 × g for 60 min at 20 °C.
Transfer supernatant to a clean tube, stored at -20 °C.
Method 4: Methanol/acetone precipitation
Method based on plant total protein extraction kit (Sigma, #PE0230) protocol, with
modifications
Grind 200-300 mg fresh leaves in liquid nitrogen to a fine powder in centrifuge tube.
Add 1.5 ml freshly prepared methanol solution (1% protease inhibitor cocktail in
methanol).
Briefly vortex and incubate at -20 °C for 10 min with vortexing every 1 min.
Centrifuge at 20,000 × g for 5 min at 4 °C.
Remove the supernatant without disturbing the pellet.
Repeat washing with methanol for 2 more times.
Dry pellet at room temperature for 1 h. Any visible methanol on the pellet should be
avoided.
Add 1.5 ml ice-cold acetone and vortex.

88
Incubate 10 min at -20 °C and centrifuge at 20,000 × g for 10 min at 4 °C.
Remove the supernatant without disturbing the pellet.
Dry pellet at room temperature for 1 h.
Add 300-500 µl reagent type 2 working solution in the kit to resolve protein. The pellet
should be completely broken up by vortexing. Incubate at room temperature for 2 h.
Centrifuge at 20,000 × g for 30 min and remove the supernatant to a clean tube.
3.2.1.3 One-dimensional polyacrylamide gel electrophoresis
One-dimensional polyacrylamide gel electrophoresis was done using the voltage described in
Chapter 2 and 10 to 20 µl protein extract was mixed with an equal volume of 2× loading buffer
(0.5 M Tris-HCl pH 8.8, 10% SDS 20% glycerol 1% bromophenol blue, 0.2% DTT) and loaded into
each well. Gel photos were taken by ProXPRESS™ 2D Proteomic Imaging System (PerkinElmer).
3.2.1.4 Protein in-solution digestion and PMF analysis
BSA (Sigma, #A7906) was used as a test protein for digestion in solution and identification by
PMF using a prOTOF 2000 MALDI O-TOF mass spectrometer (PerkinElmer) in order to optimise
PMF identification parameters using this mass spectrometer.
89
250 µl 0.01% trifluoroacetic acid (TFA) (MP Biomedicals, #152166) was added to a Roche trypsin
vial (Roche, #11418475001) to a final concentration of 0.1 µg/µl. 10 mg BSA was dissolved in 10
ml 100 mM Tris-HCl pH 8.5 to make the BSA solution. 50 µl of BSA solution was mixed with 10
µl trypsin solution (pH 8.2) and incubated at 37 °C for 4 h.
A solution of α-Cyano-4-hydroxycinnamic acid (CHCA) (Sigma, #C2020) was used as the matrix
to assist in molecular desorption and ionization of peptides. 10 mg CHCA was added in 500 µl
0.1% TFA and 500 µl acetonitrile (ACN) to make the matrix solution. 1 µl peptide solution was
mixed with 9 µl matrix solution and 1 µl of the mixture was loaded for each spot on the plate.
The samples were allowed to dry and crystallise for 10 min at room temperature.
When using the prOTOFTM 2000 MALDI O TOF Mass Spectrometer (PerkinElmer) to generate
PMF profiles, calibration was done following instructions of ProteoMass™ Peptide MALDI-MS
Calibration Kit (Sigma, # MSCAL2).The parameter sets for acquiring data were as follows: 100
laser shots, laser energy 75%, laser rate 100.0 Hz, declustering 30.0 V, and cooling Nitrogen gas
flow 190.0 ml/m. Binning size was set to 4 for peak analysis. The resulting PMFs generated were
used to search NCBInr and Swiss-Prot databases for proteins sharing identity using ProFound
(Zhang & Chait, 2000). The search parameters were as follows: taxonomic category, all taxa;
protein mass, 0.0–3,000.0 kDa; protein pI, 0.0–14.0; missed cleavages, 3; enzyme, trypsin;
tolerance average, 30 ppm, mono, 30 ppm; charge state, MH+.

90
3.2.1.5 Protein in-gel digestion and peptide recovery
Two protocols were used for in-gel digestion and peptide recovery. One of the most abundant
enzymes in plants - ribulose-1,5-bisphosphate carboxylase oxygenase (RuBisCO) - was used to
optimise in-gel digestion and peptide recovery protocols compatible with the prOTOFTM 2000
MALDI O-TOF mass spectrometer before analysing bands of interest.
Protocol 1 Sonication/lyophilisation
The band of interest was excised using a clean razor blade and cut into 1mm2 fragments.
Fragments were placed into a clean tube.
Add 100 µl destain solution (25 mM ammonium bicarbonate (ABC) in 50% ACN) to gel
pieces. Briefly vortex and incubate at 37 °C for 20 min.
Remove the destain solution and add another 100 µl of destain solution. Repeat this
procedure untill the gel is colourless.
Dry the gel pieces using lyophilisation for 30 min.
100 µl 0.01% TFA (MP Biomedicals, #152166) was added to Roche trypsin vial (Roche,
#11418475001) to final concentration of 0.25 µg/µl.
20 µl trypsin solution was added to 40 µl ACN, 50 µl 200 mM ABC (pH 8.5) and 290 µl
water to make the trypsin working solution.

91
Add 50-100 µl trypsin working solution to the dried gel pieces according to the size of
the band.
Incubate the digestion solution at 37 °C for 16 h.
Pipette the digestion solution to tube A.
Crush the gel pieces using a pestle and add 100 µL 5% TFA/50% ACN.
Incubate in sonication bath (frequency 20 kHz) for 15 min.
Pipette the solution to tube A.
Add 100 µL 1% TFA in ACN to the gel and incubate for 20 min and transfer the solution
to tube A.
Add 100 µL 0.1% TFA to the gel and incubate at -20 °C for 20 min until frozen
Incubate at 37 °C for 10 min to thaw. Repeat freeze-thaw cycle 3 times.
Transfer the solution to tube A.
Use lyophilisation to completely dry tube A.
Add 10 µL 0.1% TFA to the tube to resuspend the peptides.
The peptides can be stored at -20 °C for 2-3 days.
Protocol 2 Ziptip
This protocol is based on the Trypsin Profile IGD Kit (Sigma, #PP0100) protocol, with
modifications.

92
Use clean razor blade to excise the gel band of interest and cut into 1 mm2 fragments.
All fragments were placed into a clean tube.
Add 100 µL destain solution (25 mM ABC in 50% ACN) to gel pieces. Briefly vortex and
incubate at 37 °C for 20 min.
Remove the destain solution and add another 100 µL destain solution. Repeat this
procedure until the gel was colourless.
Remove the destain solution, add 100 µL ACN to shrink the gel piece for 20 min and
remove it.
Add 100 µL Trypsin Solubilization Reagent (1 mM HCl, provided by the kit) to one vial of
trypsin (20 µg trypsin for each vial, provided by the kit). Add 1 part of acidic trypsin
solution to 9 parts of Trypsin Reaction Buffer (40 mM ABC, 9% ACN, pH 8.2, provided
with the kit) to make the trypsin working solution (trypsin final concentration 20 µg/mL).
Add 20-30 µL trypsin working solution to the gel according to its size. Incubate on ice 20
min to let the enzyme reach the protein in gel.
Add 50-70 µL Trypsin Reaction Buffer to gel. Make sure the gel was covered by the
buffer.
Incubate at 37 °C for 4-16 h.
After digestion collect the liquid to a new clean tube. Add 0.5 µL TFA and vortex. Make
sure sample solution pH<4.
Use ZipTip (Millipore, #ZTC18P096) to concentrate and desalt the peptide solution using
supplied protocol.

93
The peptides can be stored at -20 °C for 2-3 days.
3.2.1.6 In-gel digested PMF analysis using prOTOF 2000 MALDI O-TOF mass
spectrometer
The matrix CHCA (Sigma, #C2020) was used to help molecular desorption and ionization. 10 mg
CHCA was added in 500 µL 0.1% TFA and 500 µL ACN to make matrix solution. 1 µL peptide
solution was mixed with 9 µL matrix solution and 1 µL of the mixture was added to each spot on
the plate. Allow to crystallise for 10 min at room temperature.
Use the prOTOFTM 2000 MALDI O TOF MS to generate PMF profiles. Calibration was done
following the instructions of the ProteoMass™ Peptide MALDI-MS Calibration Kit (Sigma, #
MSCAL2) or MALDI Calibration Kit (PerkinElmer, #6771000). The general parameters set for
acquiring data were as follows: 100 laser shots, laser energy 75%, laser rate 100.0 Hz,
declustering 30.0 V, and cooling Nitrogen gas flow 190.0 ml/m (minor adjustment for some
samples were specified in results). Binning size was set to 4 for peaks analysis.
The resulting PMFs generated were used to search NCBI nr and Swiss-Prot databases for
proteins sharing identity using ProFound (Zhang & Chait, 2000) general search parameters:
taxonomic category, all taxa; protein mass, 20.0–50.0 kDa; protein pI, 0.0–14.0; missed
94
cleavages, 1; enzyme, trypsin; tolerance average, 30 ppm, mono, 30 ppm; charge state, MH+
(minor adjustment for some samples were specified in result).
3.2.1.7 Detection and characterisation of viral CP by Voyager mass spectrometry
Intact viral CP was characterised on a mass spectrometer: Voyager-DE™ PRO Workstation
(Applied Biosystems). 1 µL protein extract using method 3 (see 3.2.1.2) was diluted with 100 µL
50% ACN/0.1% TFA to make it compatible with the matrix and voyager. Sinapinic acid (SA)
(Sigma, #S8313) was used as matrix to assist in molecular desorption and ionization. 40 mg SA
was added to 360 µL methanol, 80 µL water and 600 µL ACN. 1 µL diluted protein solution was
mixed with 9 µL SA matrix solution.
Add 1 µL of the mixture to each spot on the plate. Allow crystallization for 5 min at room
temperature. Parameters were as follows: accelerating, 25000 v; grid, 92%; guide wire, 0.2%;
delay time, 700 nsec; matrix, sinapinic acid; shots, 100; mass range set was according to the
target protein.
95
3.2.1.8 Virus protein sequencing
Virus CP PMF analysis was based on generating unique peptide mass spectra that matched
sequences in the database. The analysis is accurate as long as accurate masses can be
determined for each tryptic peptide fragment that ionizes. MS/MS peptide sequencing was
done to verify that the peptide sequences predicted by PMF were accurate.
Differentially expressed protein bands (Fig. 3.10) were excised and sent to Proteomics
International Pty Ltd in Western Australia to be sequenced. Protein samples were trypsin
digested and peptides extracted according to standard techniques (Bringans et al., 2008).
Peptides were analysed by MALDI TOF/TOF mass spectrometer using a 4800 Proteomics
Analyzer (Applied Biosystems). Spectra were analysed to identify proteins of interest using
Mascot sequence matching software (Matrix Science) with the Ludwig NR Database and
Taxonomy set to ’all’. Search parameters were set as follows: variable modifications: oxidation
(M); mass values: monoisotopic; protein mass: unrestricted; peptide mass tolerance: ± 0.6 Da;
fragment mass tolerance: ± 0.6 Da; max missed cleavages: 1; instrument type: default; number
of queries: 60.

96
3.2.2 Second generation sequencing
3.2.2.1 Virus detection using NGS
A L. longiflorum plant with symptoms of mottle on the leaves was collected and used to extract
total RNA using a RNeasy Plant Mini extraction kit (Qiagen, #74904). The RNA, stored in ethanol,
was sent to Macrogen Inc (Seoul, S. Korea) to synthesise cDNA, construct libraries, and
sequence 78 nt reads using an Illumina GAIIx platform. Geneious v5.3.4 (Drummond et al., 2010)
was used to assemble contigs de novo using the ‘Assembly’ program (sensitivity was medium
sensitivity/ fast). The preliminary contig sequences were compared with those in GenBank
using BlastN (National Centre for Biotechnology Information, Bethesda, MD) (Altschul et al.,
1997). Where virus related sequences were found, the sequence of that virus was used as
scaffold against which to assemble all sequence reads with medium sensitivity. The resulting
consensus sequence was used as scaffold to do a second assembly with all reads using the
‘Assembly’ program (sensitivity was medium sensitivity/ fast; the consensus sequence was set
as reference sequence).
3.2.2.2 Detection of virus using PCR
Presence of a virus detected using NGS was confirmed by RT-PCR of RNA from the host plant
using specific primers. Total RNA was extracted from bulb material of the infected lily plant
using the NucleoSpin RNA Plant Kit (Macherey-Nagel, #740949).
Grind 80 mg of bulb tissue in clean tube using pestle.

97
Add 350 µl RA1 and 3.5 µl β-mercaptoethanol to the ground tissue, and vortex
vigorously.
Place NucleoSpin Filter units in collection tubes, apply the mixture, and centrifuge for 2
min at 11,000 × g. Transfer the filtrate to a new tube without disturbing the pellet at the
bottom.
Add 350 µl 70% ethanol and mix by pipetting up and down.
Apply the mixture to NucleoSpin RNA Plant column and centrifuge for 1 min at 11,000 ×
g. Discard the flow-through.
Add 350 µl MDB and centrifuge at 11,000 × g for 2 min to dry the membrane. Discard
the flow-through.
Add 200 µl RA2 to the NucleoSpin RNA Plant column and centrifuge for 1 min at 11,000
× g. Discard the flow-through.
Add 600 µl RA3 to the NucleoSpin RNA Plant column and centrifuge for 1 min at 11,000
× g. Discard the flow-through.
Add 250 µl RA3 to the NucleoSpin RNA Plant column and centrifuge for 4 min at 11,000
× g. Discard the flow-through.
Place the column into a nuclease-free tube. Elute the RNA in 50 µl RNase water and
centrifuge at 11,000 × g for 2 min. RNA was stored under -80 °C.
Reverse transcription of total RNA was done using High-Capacity cDNA Transcription Kit
(Applied Biosystem, #4368814) by random primers. Primers for PCR reactions were designed

98
according to the sequence obtained from NGS. The annealing temperature used was 58 °C and
others PCR sets were described in chapter 2. Sanger sequencing of the amplicon was done
using both primers.
Phylogenic relationships were determined as follows: the most conserved region of nepoviruses
RdRps (Han et al., 2002) was used to undertake phylogenetic analysis of Cycas necrotic stunt
virus (CNSV) (cycas strain/lily strain), seven nepoviruses reported in Australia and other five
nepoviruses, by Geneious v5.3.4 using program Tree Builder. The parameters of Tree Builder
were set as follows, genetic distance model: jukes-cantor; tree build method: neighbour-joining;
outgroup: Satsuma dwarf virus (SDV) was set as outgroup.
3.3 Results
3.3.1 Detection of plant viruses using PMF
3.3.1.1 In-solution digestion and optimising PMF using MS
BSA was digested by trypsin in solution and resulting peptides were analysed using the
prOTOFTM 2000 MALDI O TOF MS to optimise the trypsin digestion conditions, matrix used and
MS parameter settings for PMF analysis (Fig. 3.1). The peaks that matched those in the protein
database are listed in Table 3.2.
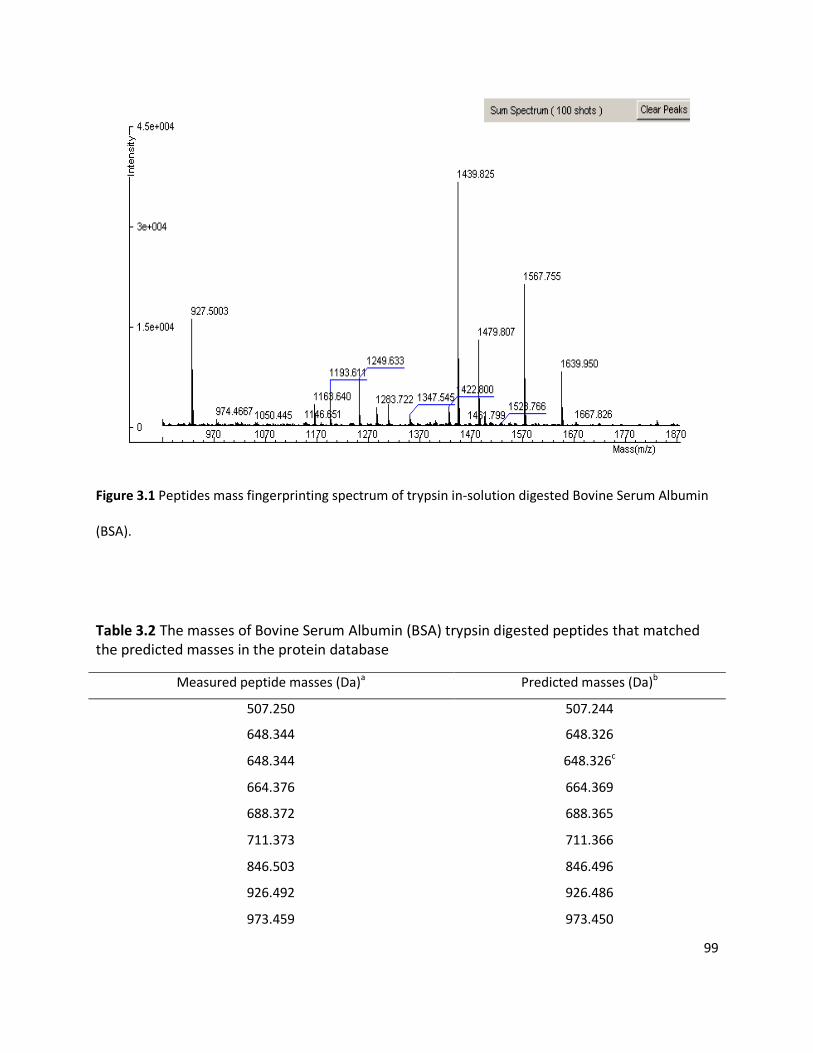
99
Figure 3.1 Peptides mass fingerprinting spectrum of trypsin in-solution digested Bovine Serum Albumin
(BSA).
Table 3.2 The masses of Bovine Serum Albumin (BSA) trypsin digested peptides that matched the predicted masses in the protein database
Measured peptide masses (Da)a Predicted masses (Da)b
507.250 507.244
648.344 648.326
648.344 648.326c
664.376 664.369
688.372 688.365
711.373 711.366
846.503 846.496
926.492 926.486
973.459 973.450
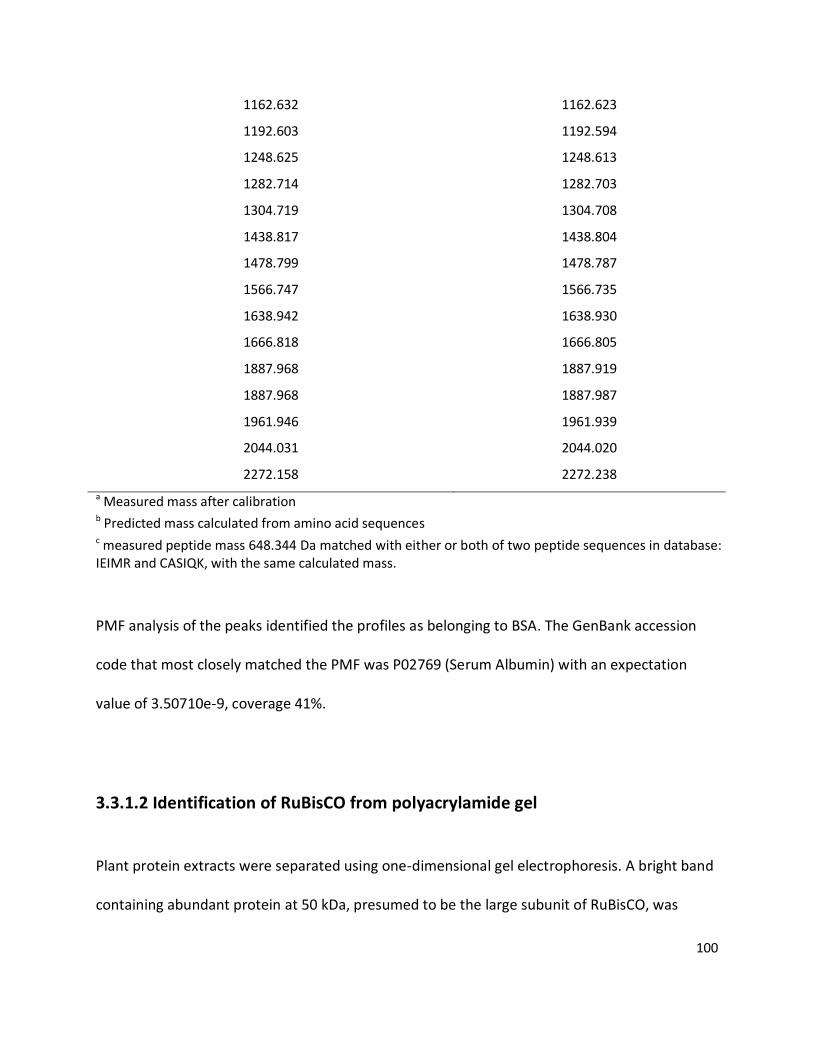
100
1162.632 1162.623
1192.603 1192.594
1248.625 1248.613
1282.714 1282.703
1304.719 1304.708
1438.817 1438.804
1478.799 1478.787
1566.747 1566.735
1638.942 1638.930
1666.818 1666.805
1887.968 1887.919
1887.968 1887.987
1961.946 1961.939
2044.031 2044.020
2272.158 2272.238
a Measured mass after calibration b Predicted mass calculated from amino acid sequences c measured peptide mass 648.344 Da matched with either or both of two peptide sequences in database: IEIMR and CASIQK, with the same calculated mass.
PMF analysis of the peaks identified the profiles as belonging to BSA. The GenBank accession
code that most closely matched the PMF was P02769 (Serum Albumin) with an expectation
value of 3.50710e-9, coverage 41%.
3.3.1.2 Identification of RuBisCO from polyacrylamide gel
Plant protein extracts were separated using one-dimensional gel electrophoresis. A bright band
containing abundant protein at 50 kDa, presumed to be the large subunit of RuBisCO, was
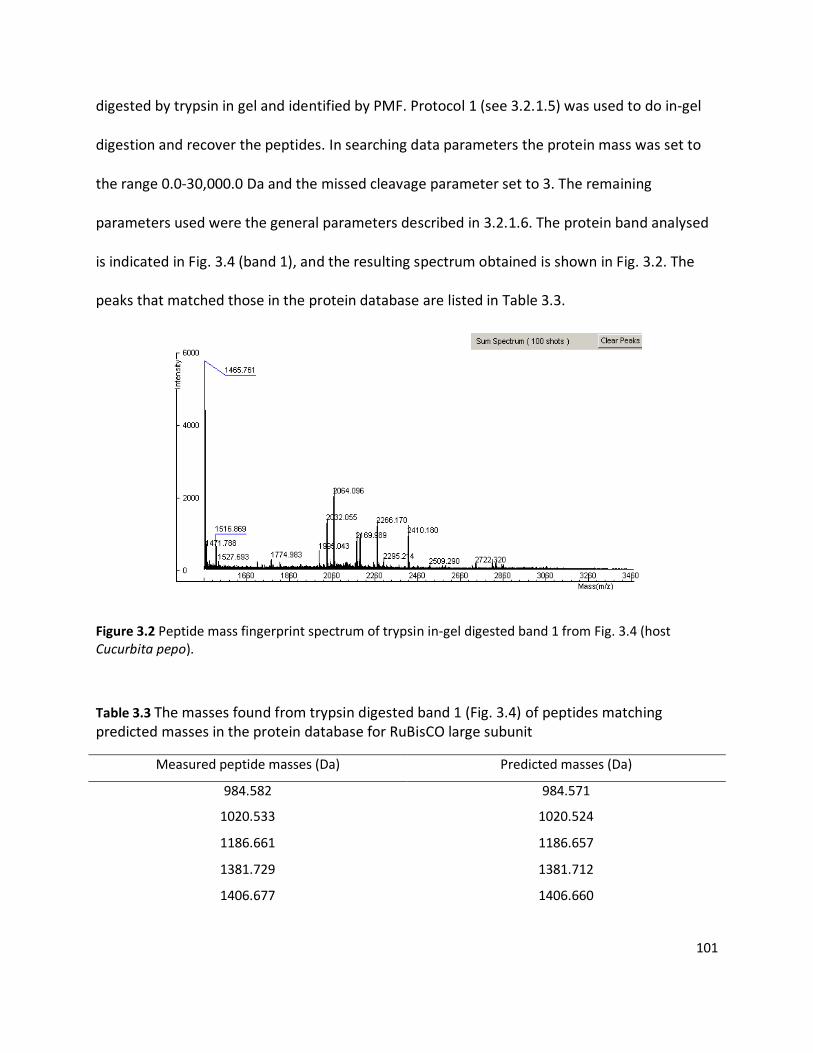
101
digested by trypsin in gel and identified by PMF. Protocol 1 (see 3.2.1.5) was used to do in-gel
digestion and recover the peptides. In searching data parameters the protein mass was set to
the range 0.0-30,000.0 Da and the missed cleavage parameter set to 3. The remaining
parameters used were the general parameters described in 3.2.1.6. The protein band analysed
is indicated in Fig. 3.4 (band 1), and the resulting spectrum obtained is shown in Fig. 3.2. The
peaks that matched those in the protein database are listed in Table 3.3.
Figure 3.2 Peptide mass fingerprint spectrum of trypsin in-gel digested band 1 from Fig. 3.4 (host Cucurbita pepo).
Table 3.3 The masses found from trypsin digested band 1 (Fig. 3.4) of peptides matching predicted masses in the protein database for RuBisCO large subunit
Measured peptide masses (Da) Predicted masses (Da)
984.582 984.571
1020.533 1020.524
1186.661 1186.657
1381.729 1381.712
1406.677 1406.660

102
1446.771 1446.757
1464.761 1464.767
1515.869 1515.859
1994.043 1994.035
2031.054 2031.049
2063.096 2063.090
2168.989 2168.979
2265.170 2265.163
2409.180 2409.173
2508.290 2508.296
2508.290 2508.235
2799.426 2799.415
2815.366 2815.358
The GenBank accession code that most closely matched peptide mass fingerprints of the
proteins tested was AAK71006 (RuBisCO large subunit) with expectation 1.707943e-2, coverage
36%. This result indicated the molecular mass of the most closely matched protein to be 51 kDa,
which was approximately the same mass that was estimated by protein mass standards on the
protein gel. The other nine matches were RuBisCO large subunits from a range of plant species.
In conclusion, the in-gel digestion and PMF analysis assay based on prOTOFTM 2000 MALDI O
TOF Mass Spectrometer successfully identified both the BSA and RuBisCO test samples.

103
3.3.1.3 Identification of viruses
Five known viruses infecting their hosts were used to test and optimise this assay strategy.
Three of them were successfully identified. An unknown virus was then identified using PMF
and confirmed by RT-PCR and MS/MS protein sequencing. Double infection of CMV and HarMV
was also used to test the assay.
Zucchini yellow mosaic virus
Zucchini (C. pepo) leaves infected with ZYMV showed symptoms of severe stunting, yellowing
and distortion (Fig. 3.3). Infected and uninfected leaves were used to extract protein
bymethanol/ chloroform precipitation of protein (method 1 in 3.2.1.2), acetone/β-
mercaptoethanol precipitation (method 2 in 3.2.1.2), acetone/DTT precipitation (method 3 in
3.2.1.2). The gel image of proteins extracted from the zucchini leaves are shown in Fig. 3.4.
Comparison of the protein bands on the gel suggested that these three methods extracted
different protein components, for example an additional band is seen only in lane 1 (arrow 3)
and another one is present only in lane 5 (arrow 2). Extraction method 3 acetone/DTT
precipitation generated the most protein bands, especially in the size range between 25-50 kb.
Putative viral proteins were visualised by comparison of gels loaded with protein extracts from
uninfected and infected plants.
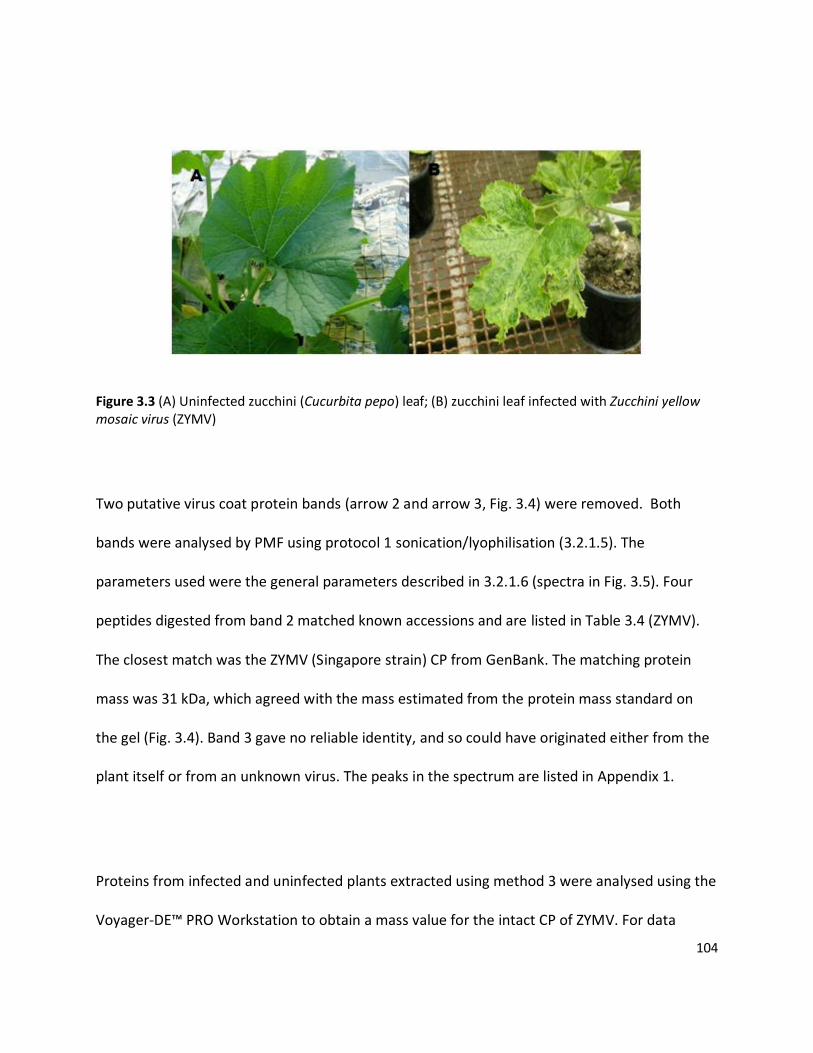
104
Figure 3.3 (A) Uninfected zucchini (Cucurbita pepo) leaf; (B) zucchini leaf infected with Zucchini yellow mosaic virus (ZYMV)
Two putative virus coat protein bands (arrow 2 and arrow 3, Fig. 3.4) were removed. Both
bands were analysed by PMF using protocol 1 sonication/lyophilisation (3.2.1.5). The
parameters used were the general parameters described in 3.2.1.6 (spectra in Fig. 3.5). Four
peptides digested from band 2 matched known accessions and are listed in Table 3.4 (ZYMV).
The closest match was the ZYMV (Singapore strain) CP from GenBank. The matching protein
mass was 31 kDa, which agreed with the mass estimated from the protein mass standard on
the gel (Fig. 3.4). Band 3 gave no reliable identity, and so could have originated either from the
plant itself or from an unknown virus. The peaks in the spectrum are listed in Appendix 1.
Proteins from infected and uninfected plants extracted using method 3 were analysed using the
Voyager-DE™ PRO Workstation to obtain a mass value for the intact CP of ZYMV. For data
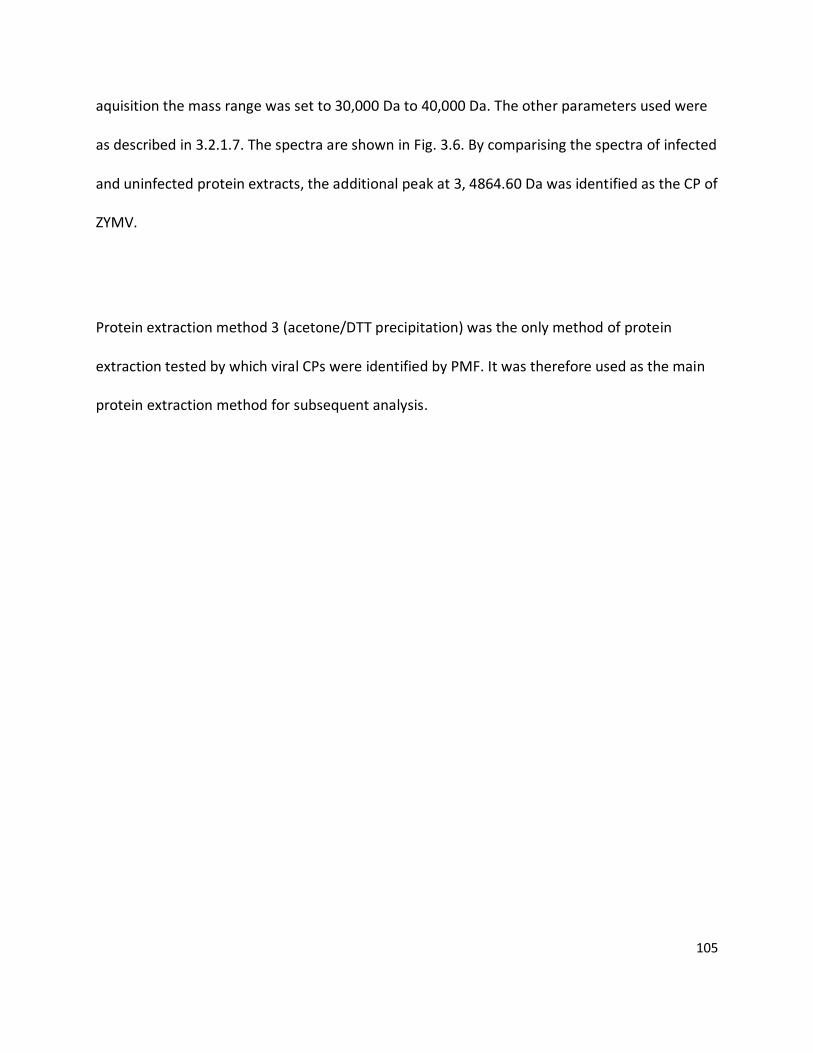
105
aquisition the mass range was set to 30,000 Da to 40,000 Da. The other parameters used were
as described in 3.2.1.7. The spectra are shown in Fig. 3.6. By comparising the spectra of infected
and uninfected protein extracts, the additional peak at 3, 4864.60 Da was identified as the CP of
ZYMV.
Protein extraction method 3 (acetone/DTT precipitation) was the only method of protein
extraction tested by which viral CPs were identified by PMF. It was therefore used as the main
protein extraction method for subsequent analysis.
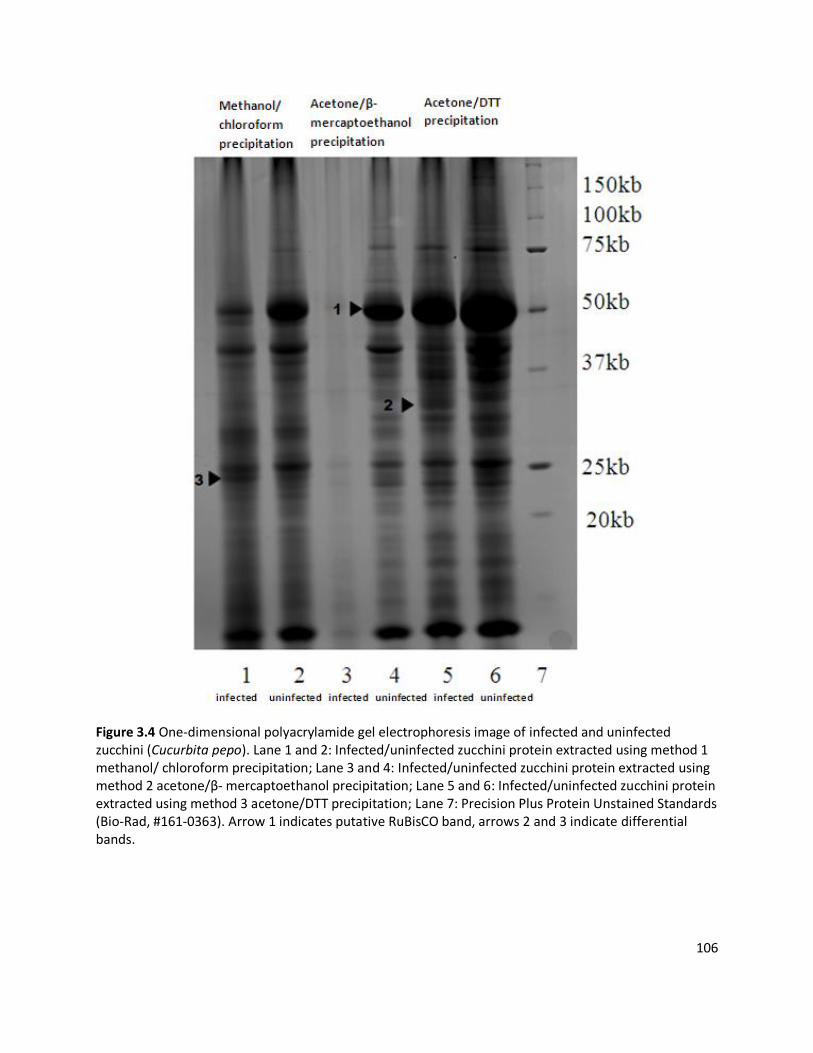
106
Figure 3.4 One-dimensional polyacrylamide gel electrophoresis image of infected and uninfected zucchini (Cucurbita pepo). Lane 1 and 2: Infected/uninfected zucchini protein extracted using method 1 methanol/ chloroform precipitation; Lane 3 and 4: Infected/uninfected zucchini protein extracted using method 2 acetone/β- mercaptoethanol precipitation; Lane 5 and 6: Infected/uninfected zucchini protein extracted using method 3 acetone/DTT precipitation; Lane 7: Precision Plus Protein Unstained Standards (Bio-Rad, #161-0363). Arrow 1 indicates putative RuBisCO band, arrows 2 and 3 indicate differential bands.
107
Table 3.4 Peptide mass data for three known viruses (ZYMV, TuMV and AMV) and an unknown
virus
Virus tested (host plant)
Measured peptide
massesa (Da)
Predicted masses (Da)
Predicted identityb
CP mass (kDa)c
Coverage (%)
Expectation valued
ZYMV
(Cucurbita pepo)
1381.615 1381.619 ZYMV 31 12 1.70971e−007
1823.856 1823.853
1850.846 1850.847
2289.094
2289.098
TuMV
(Brassica juncea)
1175.555 1175.550 TuMV 33 36 2.83567e−007
1428.610 1428.601
1895.890 1895.887
2006.986 2006.988
2291.083 2291.077
2525.313 2525.311
2681.411 2681.412
2773.381
2773.373
AMV
(Medicago truncatula)
921.468 921.466 AMV 26 24 7.09133e−005
1077.528 1077.524
1205.617 1205.619
1777.880 1777.873
1914.936 1914.936
2383.156
2383.141
Unknown
(Nicotiana glutinosa)
1240.576 1240.575 PZSV 23 11 1.78929e−004
1623.886 1623.882
1885.004 1884.998
2007.113 2007.110 a Measured peptide masses after calibration. b GenBank accession codes of viruses that most closely matched peptide mass fingerprints of the proteins tested: Alfalfa mosaic virus (AMV) P03591, Turnip mosaic virus (TuMV) CAA70331, Zucchini yellow mosaic virus (ZYMV) CAA44529, and Pelargonium zonate spot virus (PZSV) NP 619773. c CP masses predicted from amino acid sequences. d According to default settings in ProFound, expectation value <1e-003 is a high confidence identification while an expectation value <1e-001 is a marginal match. An expectation value >1e-001 is considered to be a failed search.
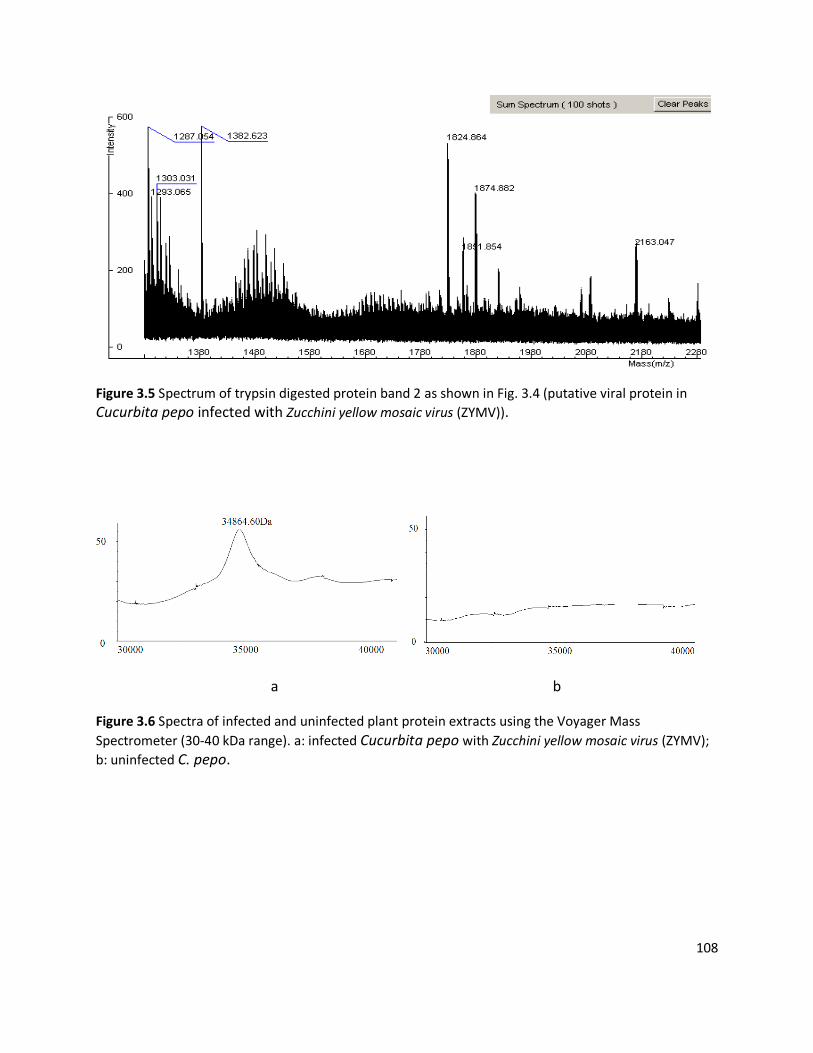
108
Figure 3.5 Spectrum of trypsin digested protein band 2 as shown in Fig. 3.4 (putative viral protein in
Cucurbita pepo infected with Zucchini yellow mosaic virus (ZYMV)).
a b
Figure 3.6 Spectra of infected and uninfected plant protein extracts using the Voyager Mass
Spectrometer (30-40 kDa range). a: infected Cucurbita pepo with Zucchini yellow mosaic virus (ZYMV);
b: uninfected C. pepo.
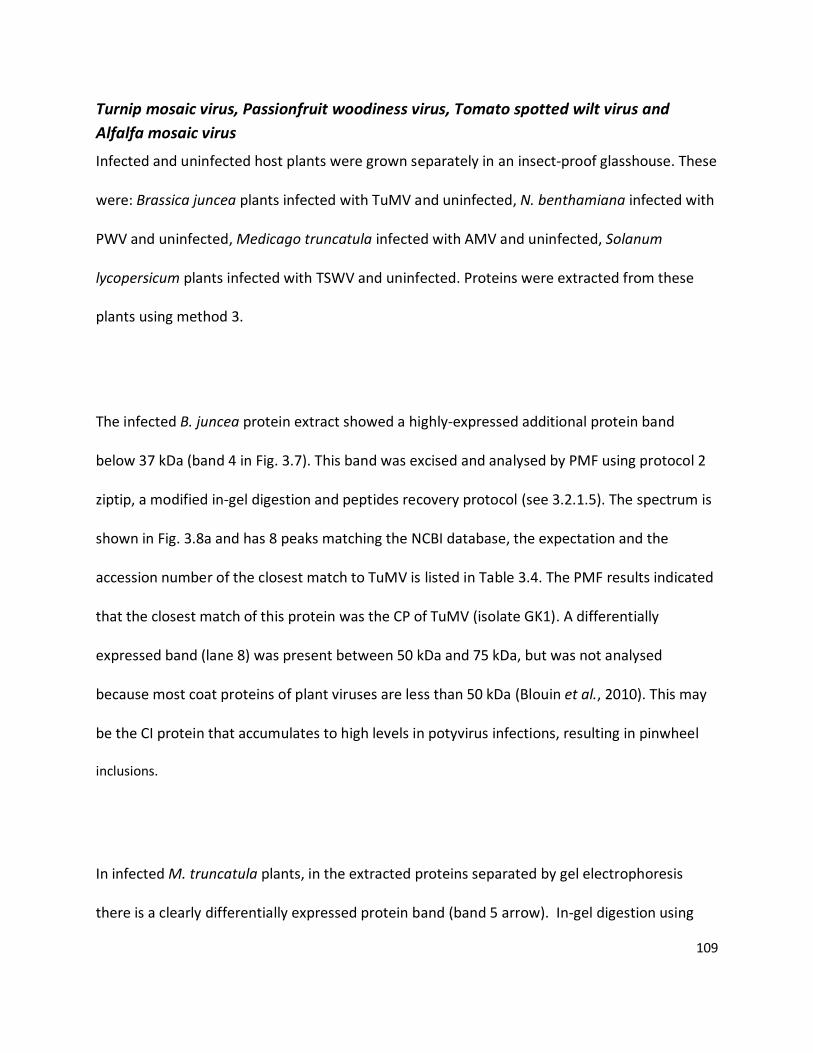
109
Turnip mosaic virus, Passionfruit woodiness virus, Tomato spotted wilt virus and
Alfalfa mosaic virus
Infected and uninfected host plants were grown separately in an insect-proof glasshouse. These
were: Brassica juncea plants infected with TuMV and uninfected, N. benthamiana infected with
PWV and uninfected, Medicago truncatula infected with AMV and uninfected, Solanum
lycopersicum plants infected with TSWV and uninfected. Proteins were extracted from these
plants using method 3.
The infected B. juncea protein extract showed a highly-expressed additional protein band
below 37 kDa (band 4 in Fig. 3.7). This band was excised and analysed by PMF using protocol 2
ziptip, a modified in-gel digestion and peptides recovery protocol (see 3.2.1.5). The spectrum is
shown in Fig. 3.8a and has 8 peaks matching the NCBI database, the expectation and the
accession number of the closest match to TuMV is listed in Table 3.4. The PMF results indicated
that the closest match of this protein was the CP of TuMV (isolate GK1). A differentially
expressed band (lane 8) was present between 50 kDa and 75 kDa, but was not analysed
because most coat proteins of plant viruses are less than 50 kDa (Blouin et al., 2010). This may
be the CI protein that accumulates to high levels in potyvirus infections, resulting in pinwheel
inclusions.
In infected M. truncatula plants, in the extracted proteins separated by gel electrophoresis
there is a clearly differentially expressed protein band (band 5 arrow). In-gel digestion using
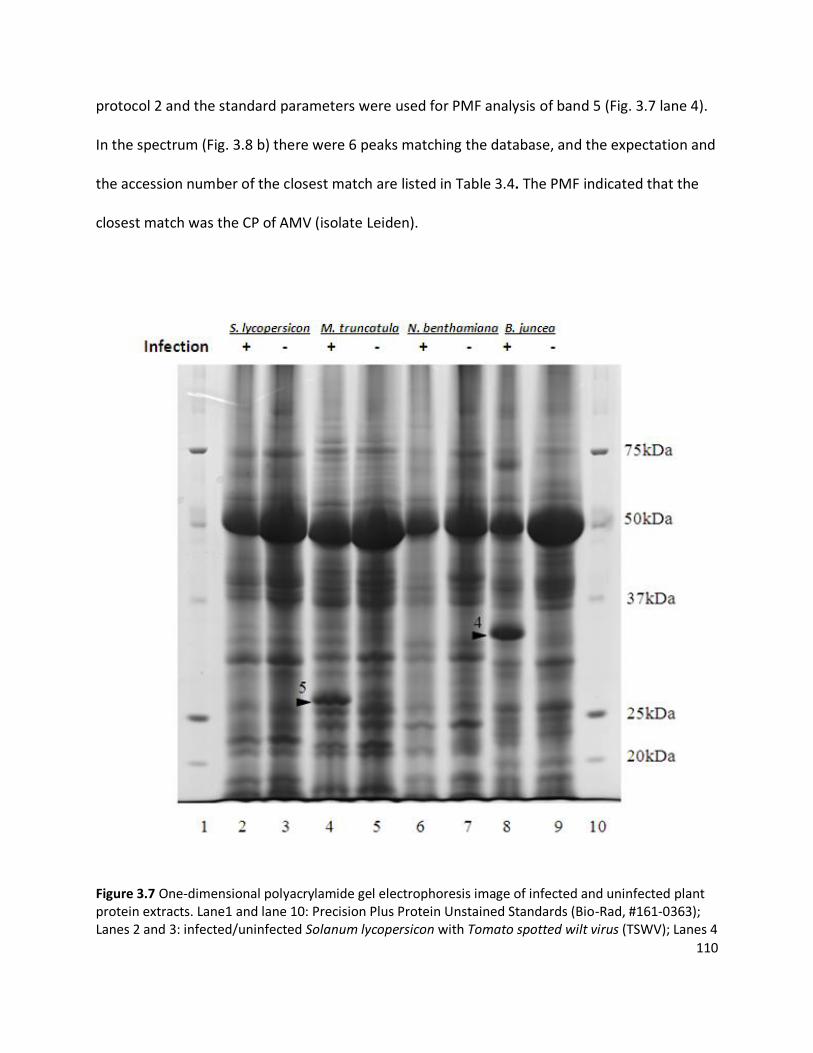
110
protocol 2 and the standard parameters were used for PMF analysis of band 5 (Fig. 3.7 lane 4).
In the spectrum (Fig. 3.8 b) there were 6 peaks matching the database, and the expectation and
the accession number of the closest match are listed in Table 3.4. The PMF indicated that the
closest match was the CP of AMV (isolate Leiden).
Figure 3.7 One-dimensional polyacrylamide gel electrophoresis image of infected and uninfected plant protein extracts. Lane1 and lane 10: Precision Plus Protein Unstained Standards (Bio-Rad, #161-0363); Lanes 2 and 3: infected/uninfected Solanum lycopersicon with Tomato spotted wilt virus (TSWV); Lanes 4
111
and 5: infected/uninfected Medicago truncatula with Alfalfa mosaic virus (AMV); Lanes 6 and 7: infected/uninfected Nicotiana benthamiana with Passionfruit woodiness virus (PWV); Lanes 8 and 9: infected/uninfected Brassica juncea with Turnip mosaic virus (TuMV). Band 4 and 5 were analysed by peptide mass fingerprinting (PMF).
When the infected and uninfected S. lycopersicon and infected and uninfected N. benthamiana
protein extracts were compared, most plant proteins in infected plant leaves accumulated at
slightly lower levels than in uninfected plants (e.g. RuBisCO), but there was no obvious virus CP
band. The reason for this could be that the virions were not present at a high enough
concentration in the plant tissues to be visualised on the gel, or that the extraction method was
suitable to extract CPs from some viruses but not for others, or the virus CP band could have
been masked by a plant protein. In addition, there were some other differences in bands
between lane 6 and 7 in Fig. 3.7 at about 75 kDa. These differences may reflect other virus
proteins, or plant responses to virus infection.
The Voyager-DE™ PRO Workstation was also used to characterise the intact CP of TuMV and
AMV. Comparison of spectra (Fig. 3.9) of infected and uninfected plant extracts indicated that
the additional peak at 33295.98 Da was from the CP of TuMV (Fig. 3.9 1a) and that at 24329.51
Da was from the CP of AMV (Fig. 3.9 2a). Peaks common to infected and uninfected extracts
were probably plant proteins, such as the peaks at 26437.23 Da and 26472.18 Da (Fig. 3.9 2a
and 2b respectively). The Voyager MS accurately determined the CP mass, which was close to
that estimated from comparison with the protein standard on the gel.

112
a
b
Figure 3.8 Spectra of trypsin in-gel digested bands (a) Profile of trypsin digested protein band 4 from Fig.
3.7 (putative viral protein in infected Brassica juncea); (b) Profile of trypsin digested protein band 5 from
Fig. 3.7 (putative viral protein in infected Medicago truncatula).
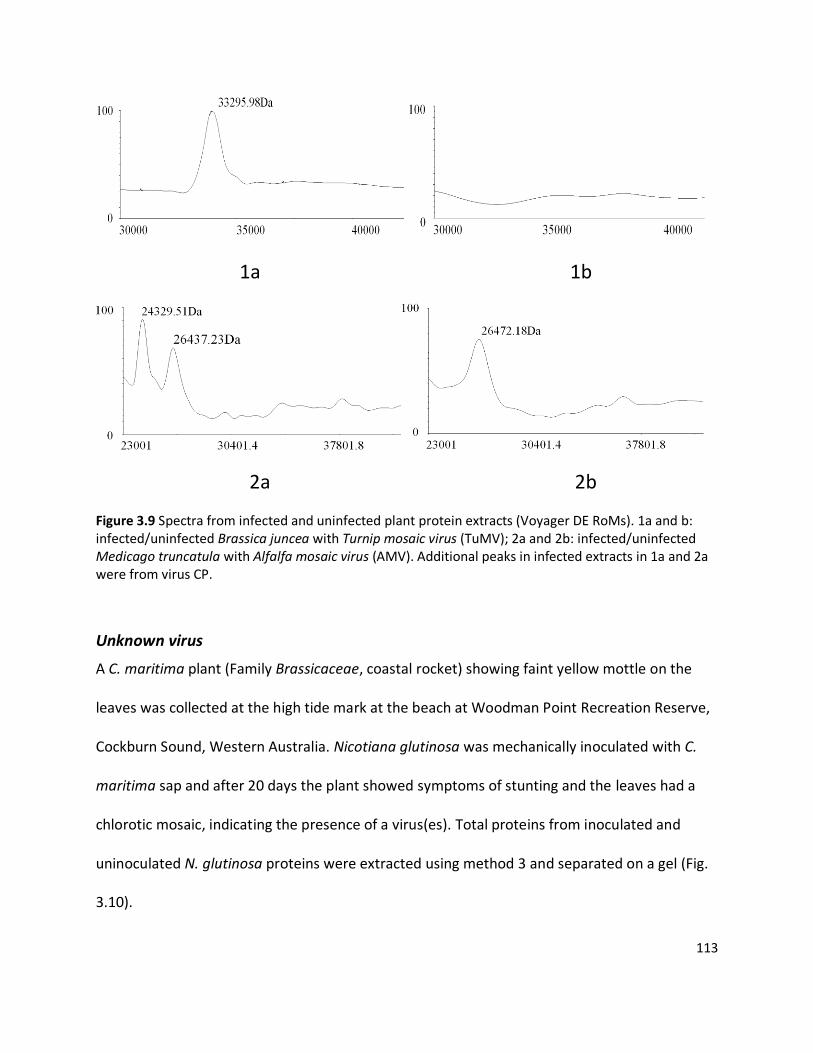
113
1a 1b
2a 2b
Figure 3.9 Spectra from infected and uninfected plant protein extracts (Voyager DE RoMs). 1a and b: infected/uninfected Brassica juncea with Turnip mosaic virus (TuMV); 2a and 2b: infected/uninfected Medicago truncatula with Alfalfa mosaic virus (AMV). Additional peaks in infected extracts in 1a and 2a were from virus CP.
Unknown virus
A C. maritima plant (Family Brassicaceae, coastal rocket) showing faint yellow mottle on the
leaves was collected at the high tide mark at the beach at Woodman Point Recreation Reserve,
Cockburn Sound, Western Australia. Nicotiana glutinosa was mechanically inoculated with C.
maritima sap and after 20 days the plant showed symptoms of stunting and the leaves had a
chlorotic mosaic, indicating the presence of a virus(es). Total proteins from inoculated and
uninoculated N. glutinosa proteins were extracted using method 3 and separated on a gel (Fig.
3.10).
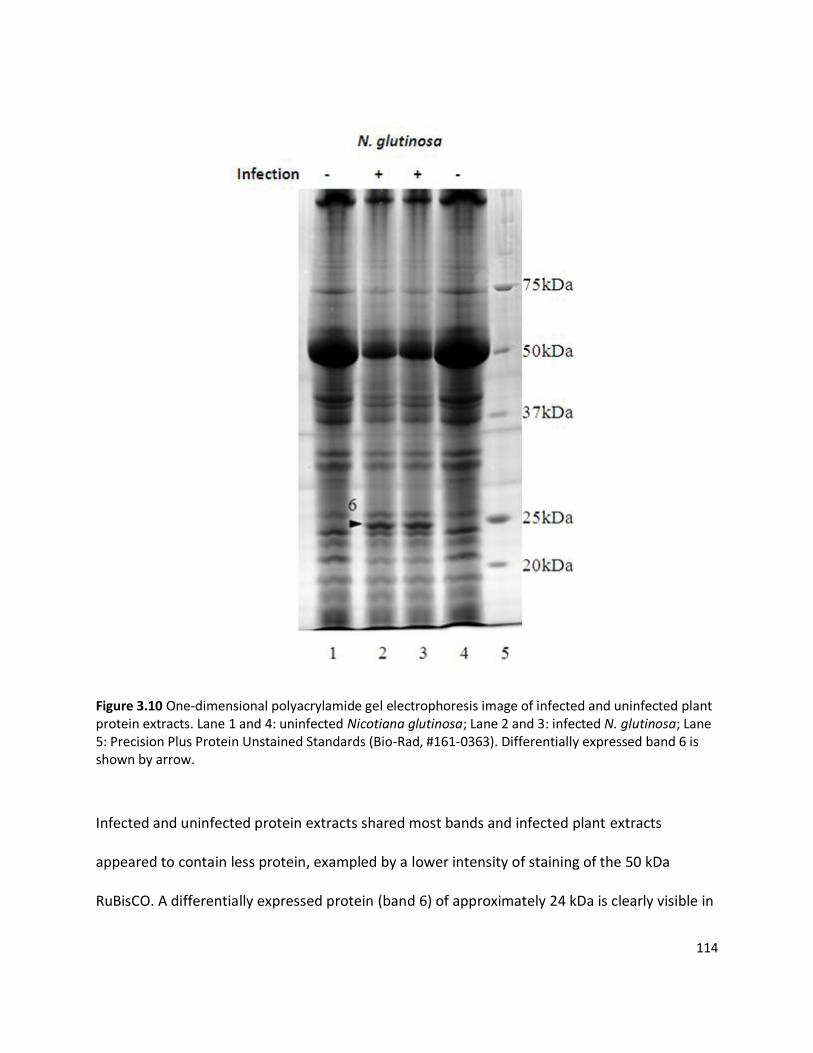
114
Figure 3.10 One-dimensional polyacrylamide gel electrophoresis image of infected and uninfected plant protein extracts. Lane 1 and 4: uninfected Nicotiana glutinosa; Lane 2 and 3: infected N. glutinosa; Lane 5: Precision Plus Protein Unstained Standards (Bio-Rad, #161-0363). Differentially expressed band 6 is shown by arrow.
Infected and uninfected protein extracts shared most bands and infected plant extracts
appeared to contain less protein, exampled by a lower intensity of staining of the 50 kDa
RuBisCO. A differentially expressed protein (band 6) of approximately 24 kDa is clearly visible in

115
lanes 2 and 3 in the infected plant extracts. This band (band 6) was removed and analysed by
PMF. The general parameters were used for data acquisition. For the spectrum (Fig. 3.11 and
the 4 peaks matching the database), the Expectation Value (i.e. the likelihood of predicted mass
being correct) and the accession number of the closest match are listed in Table 3.4. The closest
match for these peptide fragment sizes is the CP of Pelargonium zonate spot virus (PZSV)
(tomato strain).
Figure 3.11 Spectrum of trypsin in-gel digested band 6 from Fig. 3.10 (putative viral protein in infected
Nicotiana glutinosa).
a b

116
Figure 3.12 Spectra of infected and uninfected plant protein extracts as detected by the Voyager MS. a and b: infected/uninfected Nicotiana glutinosa with Pelargonium zonate spot virus.
The Voyager-DE™ PRO Workstation was used to characterise the intact CP of PZSV (Fig. 3.12).
The additional peak in infected extracts at 22997.77 Da was characteristic of the CP mass of
PZSV, whose calculated CP mass is 23084.58 Da. Two peaks present in both infected and
uninfected extracts, approximately 24938.83 Da and 26887.88 Da, were interpretted as plant
proteins common to both extracts.
To further confirm the identity of the virus present in the C. maritima plant, RNA was extracted
and RT-PCR was done as described in Chapter 2. PZSV-specific oligonucleotide primers that
annealed within the putative movement protein (MP) of the genome (Liu & Sears, 2007) (R3-F
5’ CTCACCAACTGAATGCTCTGGAC 3’ and R3-R 5’ TGGATGCGTCTTTCCGAACC 3’) were used to
amplify part of RNA3 using an annealing temperature of 54 °C (Fig. 3.13 ). The resulting
amplicon was purified (MinElute PCR kit, Qiagen, #28004) and sequenced directly with the
primers used in their amplification. The virus sequence was assigned an accession number by
GenBank (GU046705). This sequence was analysed using NCBI BlastN and the sequence was
confirmed to be part of the PZSV genome, with 93–95% identity to other published PZSV RNA3
sequences (Finetti-Sialer & Gallitelli, 2003). Fig. 3.14 showed the phylogenetic relationship of
PZSV (Woodman point isolate and Tomato strain) with other viruses in the family Bromoviridae.
The CP nucleotide sequence of PZSV (Woodman point isolate) is 49%-52% identical to other

117
viruses in the family, and 95% identical to PZSV (Tomato strain). In 2005, PZSV was classified as
the only member of a new genus in the family: Anulavirus (Gallitelli et al., 2005).
Figure 3.13 Lane 1: Amplified part of RNA3 sequence of Pelargonium zonate spot virus genome. Lane M: BenchTop 1kb DNA Ladder (promega, #G7541).

118
Figure 3.14 Phylogenetic tree constructed with partial CP nucleotide sequences of members of the family Bromoviridae. AMV: Alfalfa mosaic virus; EmoV: Elm mottle virus; OLV-2: Olive latent virus 2; PZSV-T: Pelargonium zonate spot virus (Tomato strain); PZSV-W: Pelargonium zonate spot virus (Woodman point isolate); PSV: Peanut stunt virus; CMV-Mi: Cucumber mosaic virus (Mi isolate); CMV-Z: Cucumber mosaic virus (Z strain); BMV: Brome mosaic virus; MYFV: Melandrium yellow fleck virus; SBLV: Spring beauty latent virus; BBMV: Broad bean mottle virus; CCMV: Cowpea chlorotic mottle virus; CYBV: Cassia yellow blotch virus; TMV (Tobacco mosaic virus) was used as outgroup.
119
Detection of double infection
Plants are often infected with more than one virus. Further optimisation of the system was
done to detect double infections of individual plants. N. benthamiana is a host of both CMV
and HarMV so this host was inoculated with both of these viruses. Controls were plants
inoculated with either CMV or HarMV, and uninoculated N. benthamiana.
Two weeks after inoculation, symptoms on N. benthamiana inoculated with CMV and HarMV
included mosaic, leaf distortion and stunting. However, N. benthamiana inoculated either with
CMV or HarMV alone showed only mild mosaic (Fig. 3.15). Fresh leaves of the plants inoculated
with either CMV, HarMV or with both viruses were used to extract protein using method 3. The
protein extracts were then separated by one dimensional electrophoresis (Fig. 3.16).

120
Figure 3.15 Symptoms of Cucumber mosaic virus (CMV) and Hardenbergia mosaic virus (HarMV)
infected Nicotiana benthamiana (arrows). (1) Four pots from left to right were N. benthamiana infected with CMV and HarMV, N. benthamiana infected with CMV, N. benthamiana infected with HarMV and N. benthamiana uninfected. Plants with mixed infection showed stunting compared with single infected plants and the uninfected control. (2) Mix infection plant leaves showed severe mosaic and leaf distortion. (3) CMV infected plant leaves did not show obvious symptoms. (4) HarMV infected plant leaves showed mild mosaic.

121
When the intensity of protein bands from uninoculated plants are compared with those from
plants inoculated with CMV (Fig. 3.16 lane 2) or with both CMV and HarMV (Fig. 3.16 lane 3),
the lanes that have protein from a CMV infected plants have protein bands at just above 25 kDa
(band 7 and 8) with much higher levels of expression.
Figure 3.16 One-dimensional polyacrylamide gel electrophoresis image of inoculated and uninoculated Nicotiana benthamiana protein extracts (using extraction method 3 with the same weight of starting

122
materials and loading the same volume of protein extracts for each lane). Lane 1: N. benthamiana inoculated with Hardenbergia mosaic virus (HarMV); Lane 2: N. benthamiana inoculated with Cucumber mosaic virus (CMV); Lane 3: N. benthamiana inoculated with CMV and HarMV; Lane 4: uninoculated N. benthamiana. Lane 5: Precision Plus Protein Unstained Standards (Bio-Rad, #161-0363). Arrow indicated bands were highly expressed in inoculated plant extracts and were applied to peptide mass fingerprinting (PMF).
PMF analysis of these two bands was done using in-gel digestion protocol 2 (Table 3.5). The
protein mass range was set from 10 to 37kDa when searching within the database. Other
parameters used were as described previously.
Table 3.5 Peptide mass fingerprinting (PMF) analysis of CMV CP
Band number
Measured peptide massesa
(Da)
Predicted masses
(Da)
Predicted identityb
CP mass (kDa)c
Coverage (%)
Expectation valued
7 1138.574 1138.569 CMV 24.1 39 2.93283e−005 1208.622 1208.619 1351.652 1351.650 1479.745 1479.745 1507.757 1507.751 1587.803 1587.800 1635.850 1635.846 2316.179 2316.170 3302.623 3302.575
8 1138.572 1138.569 CMV 23.5 25 6.51819e-003 1208.622 1208.619 1479.746 1479.745 1587.807
1635.846
1587.800
1635.846
2316.177 2316.170
a Measured peptide masses after calibration. b GenBank accession codes of viruses that most closely matched peptide mass fingerprints of the proteins tested: Cucumber mosaic virus (CMV) AAF28361.1 (No. 8), CMV CAC81741.1 (No.7). c CP masses predicted from amino acid sequences.

123
d According to default setting in ProFound, expectation value < 1e-003 is a highly confident identification while 1e-003<expectation value <1e-001 is as marginal match. Expectation value >1e-001 is considered to be failed search.
Band 7 and 8 were identified to be from the CP of CMV as expected. The intensity of the bands
on Fig. 3.16 indicates that the concentration of CMV was higher in the single infected plant than
in the doubly infected plant. The reason for this difference is discussed in Chapter 5. However,
in both plants inoculated with HarMV (Fig. 3.16 lane 1 HarMV alone, and lane 3 HarMV and
CMV) no additional band corresponding to HarMV CP was visible. Degenerate primers LegpotyF
(5’-GCWKCHATGATYGARGCHTGGG-3’) (Webster et al., 2007) and LegpotyR (5’-
AYYTGYTYMTCHCCATCCATC-3’) were used to amplify the 3’ terminal end of the NIb gene and
the 5’ region of the CP gene of HarMV to confirm infection. Bands with approximately 600 bp
indicated that the plants were infected with HarMV (Fig. 3.17).
Figure 3.17 DNA amplicons of Hardenbergia mosaic virus (HarMV) inoculated to Nicotiana benthamiana plants. Lane M: 100 bp DNA Ladder (Axygen, #M-DNA-100bp); Lane 1: N. benthamiana inoculated with HarMV and Cucumber mosaic virus (CMV); Lane 2: N. benthamiana inoculated with HarMV.

124
3.3.1.4 Non-viral protein Peptide Mass Fingerprinting analysis
Several other plants (H. comptoniana, N. glutinosa, Kennedia coccinea, Anigozanthos manglesii
and Phaseolus vulgaris) with symptoms of unknown virus infection were used to search for
identity of an infectious virus using the MS assay strategy described above (Table 3.1 6, 8, 9, 10
and 11). Differentially expressed proteins were found in most of the infected plant tissue
extracts. However, these proteins were either identified to be plant proteins or remain to be
identified. The gel images (Fig. 3.18 to Fig. 3.20) show differentially expressed bands and these
were analysed by PMF. Proteins identified are listed in Appendix 1. Unidentified proteins are
listed in Appendix 2. No viruses were identified in these experiments.

125
Figure 3.18 One-dimensional polyacrylamide gel electrophoresis images of protein extracts from infected and uninfected plants. Lane1 and 2: symptomatic/symptom-free Kennedia coccinea; Lane 3 and 4: symptomatic/symptom-free Nicotiana glutinosa; Lane 6 and 7: symptomatic/symptom-free K. coccinea; Lane 5 and 8: Precision Plus Protein Unstained Standards (Bio-Rad, #161-0363). Additional bands 9, 10, 11, 12 (arrows) were isolated to do in-gel digestion and peptide mass fingerprinting (PMF) analysis. Band 13 was much more highly expressed in symptom-free plant extracts using both extraction methods and was analysed by PMF. Band 10: unknown; band 9: 1,3,-beta-D-glucanase; band 11: 1,3,-beta-D-glucanase; band 12: oxygen-evolving enhancer protein 1; band 13: ribulose 1,5-bisphosphate carboxylase (RuBisCO) small subunit.

126
Figure 3.19 One-dimensional polyacrylamide gel electrophoresis images of infected and uninfected plant protein extracts. Lane 1 and 8: Precision Plus Protein Unstained Standards (Bio-Rad, #161-0363); Lane 2 and 3: symptom-free/symptomatic Anigozanthos manglesii; Lane 4 and 5: symptom-free/symptomatic A. manglesii; Lane 6 and 7: infected/uninfected Hardenbergia comptoniana with Hardenbergia mosaic virus (HarMV). Arrows indicate bands from symptomatic A. manglesii extracts that were analysed by peptide mass fingerprinting (PMF). No visible differentially-expressed band was seen in ‘infected’ and uninfected H. comptoniana. Band 14: unknown; band 15: unknown.

127
Figure 3.20 One-dimensional polyacrylamide gel electrophoresis image of infected and uninfected plant protein extracts. Lane 1 to 6: symptomatic Phaseolus vulgaris named BB2, SB1, 4B2, 4B1, J52, J51; Lane 7: uninfected P. vulgaris; Lane 8: Precision Plus Protein Unstained Standards (Bio-Rad, #161-0363). Differentially expressed protein bands 16 and 17 were analysed by peptide mass fingerprinting (PMF). Band 16: beta-1,3-endoglucanase; band 17: cytosolic ascorbate peroxidase.
128
3.3.1.5 MS/MS sequencing of the coat protein of Pelargonium zonate spot virus
Band 6 (Fig. 3.10) from a plant infected by an unknown virus later determined to be PSZV was
excised and analysed by MS/MS sequencing by Proteomics International Pty Ltd in Western
Australia. Fig. 3.21 shows the matching probability distribution based Mowse Score (Savitski et
al., 2005) in the report. According to the MS/MS report protein hits scored above 54 were
confident identities. This figure shows that only one peptide had a match with a significant
score at 233 (>54), which was to the CP of PZSV (GenBank accession codes: Q9DUT0). Both PMF
and MS/MS successfully identified band 6 (Fig. 3.10) as the CP of PZSV. The sequenced peptides
by MS/MS are listed in Table 3.6. Fig. 3.22 shows the full sequence of PZSV CP from NCBI
database, peptides detected by PMF and sequenced peptides by MS/MS analysis.
The amino acid sequences of four peptides of PZSV CP were sequenced by MS/MS, three of
which were detected by PMF, thus validating the accuracy of PMF identification based on the
molecular mass. The peptide SRQQALAK sequenced by MS/MS was not detected by PMF and
peptide EFSGLSMSVER detected by PMF was not identified by peptide sequencing, which
probably derived from different resulting peptides under different conditions of trypsin
digestion, such as pH, temperature, digestion duration.

129
Table 3.6 MS/MS amino acid sequencing results of Pelargonium zonate spot virus CP
Observed mass (Da) Calculated massa (Da) Peptide sequence 901.4973 900.5141 R.SRQQALAK.L
1170.5408 1169.5982 K.GHVIYHYPGK.T 1885.8575 1884.9985 K.IFVEHEKIGQAEYIPL.- 2007.9496 2007.1113 R.SLTVPDALLESPNLRLNR.V
a Calculated mass based on the peptide sequence.
Figure 3.21 Score = -10*Log(P), where P is the probability that the observed match is a random event. Individual ions scores > 54 indicate identity or extensive homology (p<0.05).

130
Figure 3.22 Comparison of Pelargonium zonate spot virus (PZSV) coat protein sequence, peptide mass fingerprinting (PMF) predicted peptides and sequenced peptides by MS/MS analysis. Shaded sequences indicate the peptides detected and predicted by PMF analysis. Peptide sequences below are the sequence from MS/MS analysis.
3.3.2 Detection of plant viruses using Next Generation Sequencing
Illumina sequencing of the cDNA prepared from total RNA extracted from leaf tissue of a lily
plant with viral symptoms generated a total of 36 million individual sequences with a read
length of 78 nt, giving a total of about 2.8 billion (2.8 Gb) nt of DNA sequence. Contig assembly
using Velvet short read assembler (Zerbino & Birney, 2008) gave 171, 920 contigs. BlastN
(Altschul et al., 1997) analysis showed that one of them had 88% identity with protein
phosphatase 1 (PP1) gene for polyprotein 1 of CNSV cycas strain (host Cycas revoluta)
(accession number AB073147.1), and the other one was 88% similar to protein phosphatase 2
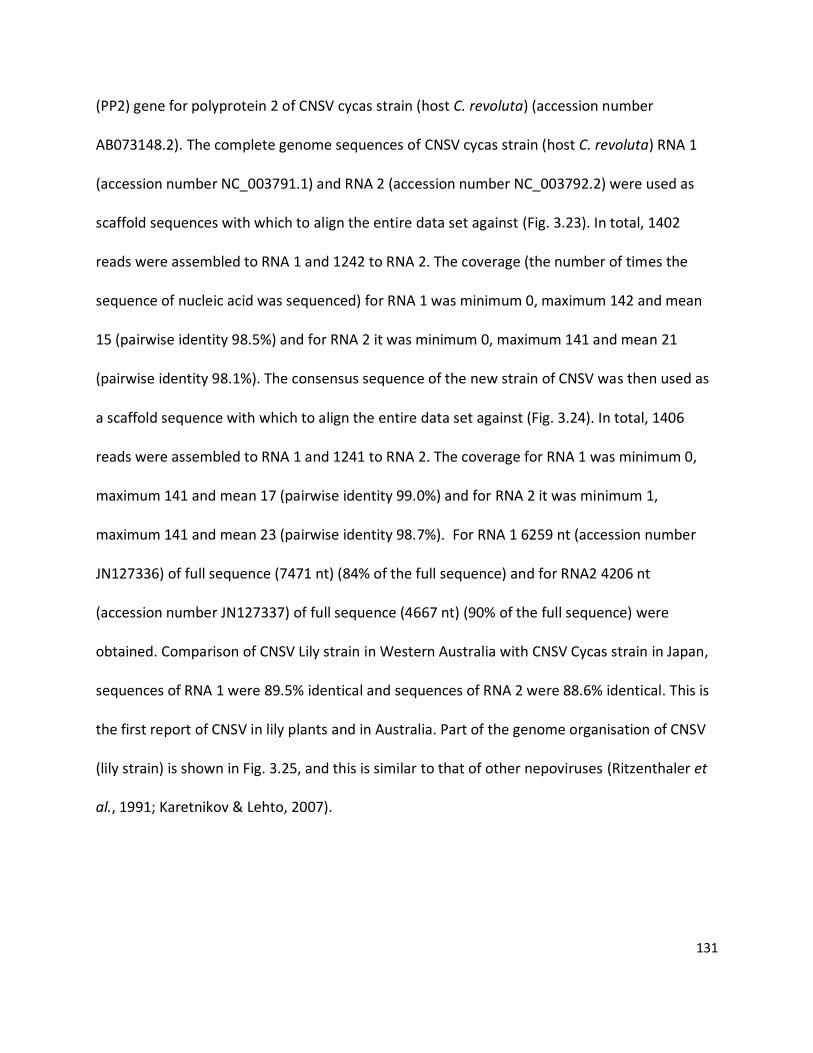
131
(PP2) gene for polyprotein 2 of CNSV cycas strain (host C. revoluta) (accession number
AB073148.2). The complete genome sequences of CNSV cycas strain (host C. revoluta) RNA 1
(accession number NC_003791.1) and RNA 2 (accession number NC_003792.2) were used as
scaffold sequences with which to align the entire data set against (Fig. 3.23). In total, 1402
reads were assembled to RNA 1 and 1242 to RNA 2. The coverage (the number of times the
sequence of nucleic acid was sequenced) for RNA 1 was minimum 0, maximum 142 and mean
15 (pairwise identity 98.5%) and for RNA 2 it was minimum 0, maximum 141 and mean 21
(pairwise identity 98.1%). The consensus sequence of the new strain of CNSV was then used as
a scaffold sequence with which to align the entire data set against (Fig. 3.24). In total, 1406
reads were assembled to RNA 1 and 1241 to RNA 2. The coverage for RNA 1 was minimum 0,
maximum 141 and mean 17 (pairwise identity 99.0%) and for RNA 2 it was minimum 1,
maximum 141 and mean 23 (pairwise identity 98.7%). For RNA 1 6259 nt (accession number
JN127336) of full sequence (7471 nt) (84% of the full sequence) and for RNA2 4206 nt
(accession number JN127337) of full sequence (4667 nt) (90% of the full sequence) were
obtained. Comparison of CNSV Lily strain in Western Australia with CNSV Cycas strain in Japan,
sequences of RNA 1 were 89.5% identical and sequences of RNA 2 were 88.6% identical. This is
the first report of CNSV in lily plants and in Australia. Part of the genome organisation of CNSV
(lily strain) is shown in Fig. 3.25, and this is similar to that of other nepoviruses (Ritzenthaler et
al., 1991; Karetnikov & Lehto, 2007).

132
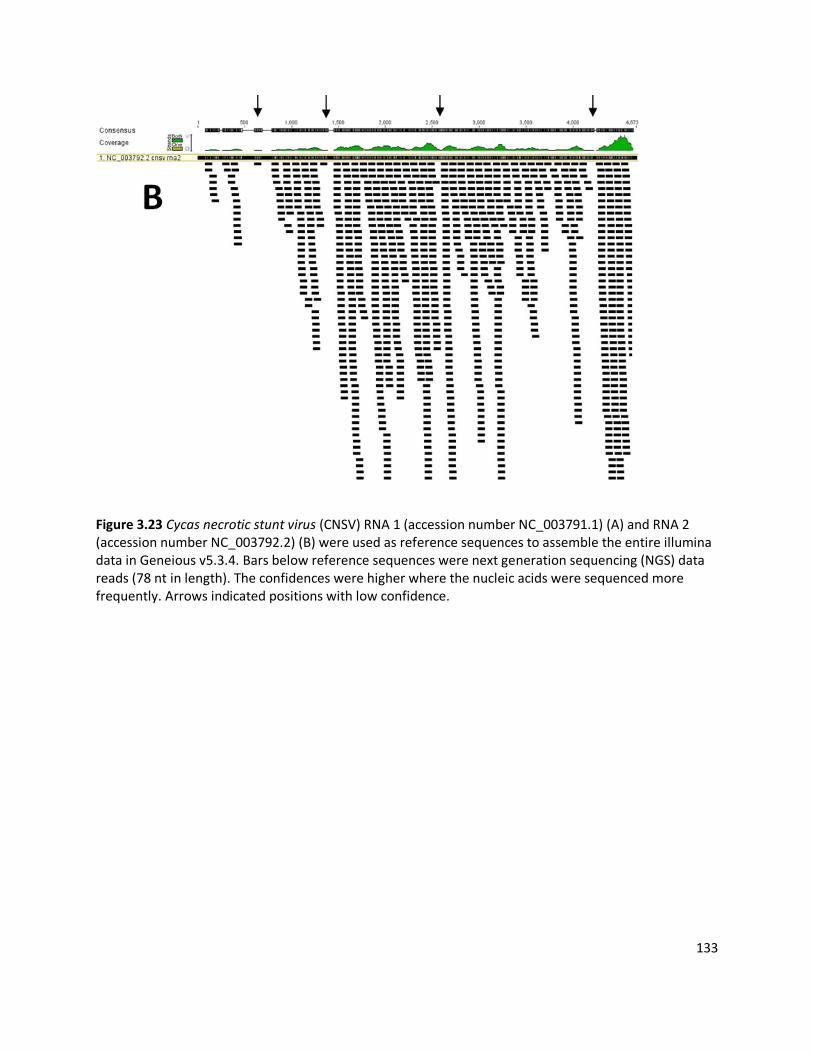
133
Figure 3.23 Cycas necrotic stunt virus (CNSV) RNA 1 (accession number NC_003791.1) (A) and RNA 2 (accession number NC_003792.2) (B) were used as reference sequences to assemble the entire illumina data in Geneious v5.3.4. Bars below reference sequences were next generation sequencing (NGS) data reads (78 nt in length). The confidences were higher where the nucleic acids were sequenced more frequently. Arrows indicated positions with low confidence.

134

135
Figure 3.24 Cycas necrotic stunt virus (CNSV) (Lily strain) RNA 1 consensus sequence (Fig. 3.23) (A) and RNA 2 consensus sequence (Fig. 3.23) (B) were used as reference sequences to assemble the entire data in Geneious v5.3.4. Bars below reference sequences were next generation sequencing (NGS) data reads (78 nt in length). The confidences were higher where the nucleic acids were sequenced more frequently.
Figure 3.25 Part of the genome organisation of Cycas necrotic stunt virus (CNSV) (Lily strain) based on alignment with CNSV (Cycas strain). Genes and domains are indicated as boxes; lines indicate untranslated regions (UTRs); (A)n and horizontal dashed lines represent poly(A) tail; nucleotide positions of the borders of the genes or domains are shown above. CNSV polyprotein 1 is predicted to be cleaved into: nucleotide-binding protein (NTB); viral protein genome-linked (VPg); cysteine protease (CysPro); RNA-dependent RNA polymerase (RdRp). CNSV polyprotein 2 is predicted to be cleaved into: movement protein (MP) and coat protein (CP).
Presence of the virus in the bulb tissue of infected lily plants was confirmed by RT-PCR. Primers
for PCR reactions were designed according to the sequence obtained from the NGS assembly
(RNA 1): CNSVF 5’- TGCCATGGCTGGTTTTGGAG-3’; CNSVR 5’- GCAGCATGGCAATCCATAGG-3’
with expected amplicon size 915 bp. A DNA band of approximately 1000bp (expected size 915
bp) is present on the gel (Fig. 3.26). Sanger sequencing of this amplicon (915 bp) confirmed that
it was part of the CNSV RNA 1 sequence, which was the same as sequence obtained from NGS.
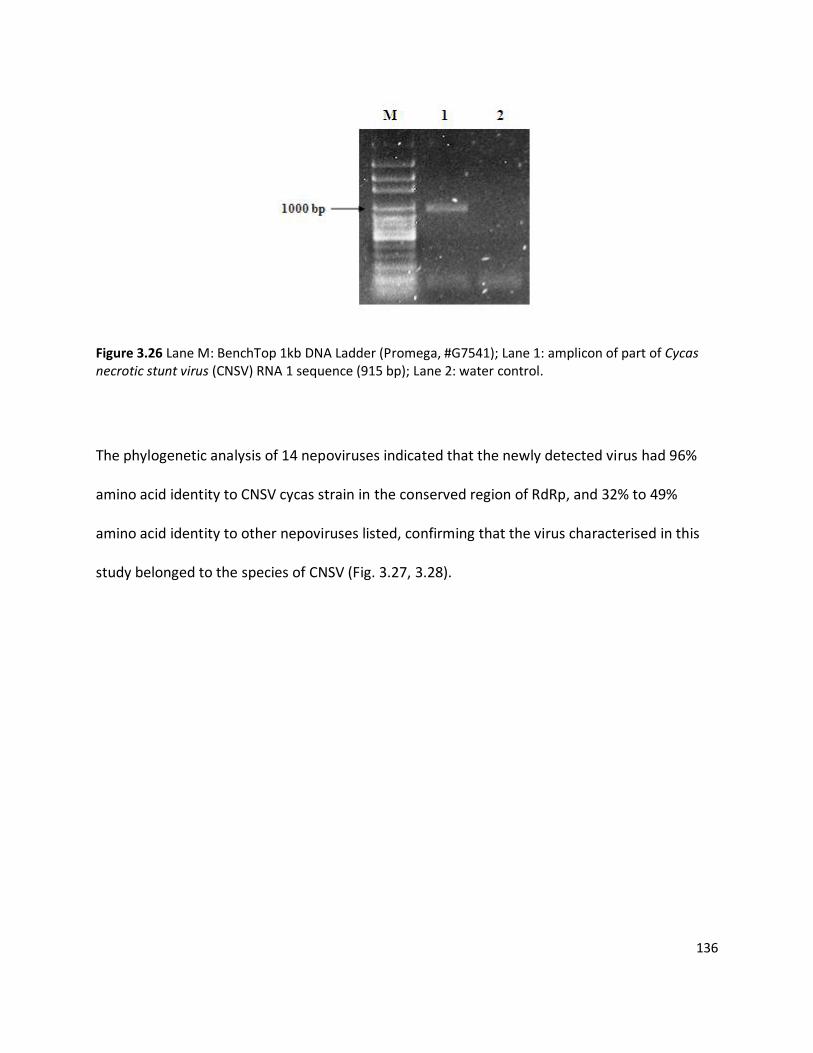
136
Figure 3.26 Lane M: BenchTop 1kb DNA Ladder (Promega, #G7541); Lane 1: amplicon of part of Cycas necrotic stunt virus (CNSV) RNA 1 sequence (915 bp); Lane 2: water control.
The phylogenetic analysis of 14 nepoviruses indicated that the newly detected virus had 96%
amino acid identity to CNSV cycas strain in the conserved region of RdRp, and 32% to 49%
amino acid identity to other nepoviruses listed, confirming that the virus characterised in this
study belonged to the species of CNSV (Fig. 3.27, 3.28).
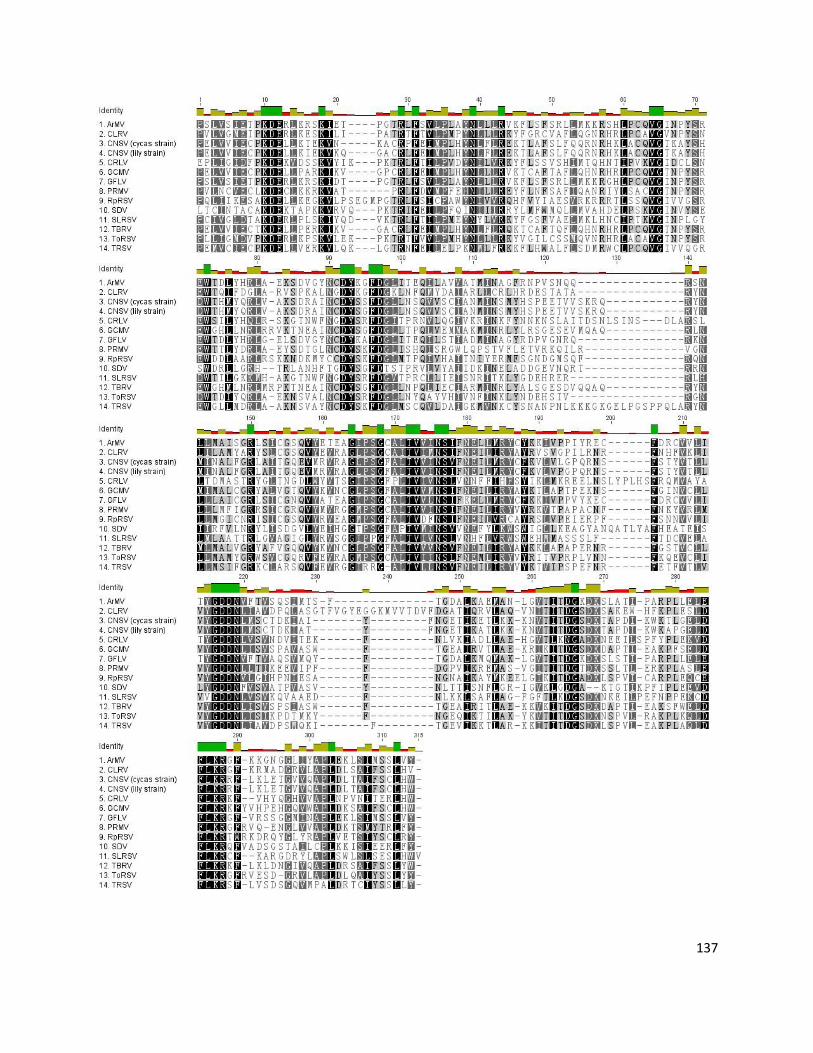
137

138
Figure 3.27 Multiple alignment of the conserved region of the RNA dependent RNA polymerase (RdRp) of Cycas necrotic stunt virus (CNSV) (lily strain and cycas strain) and other 12 nepoviruses (amino acid sequences). Virus species names and accession numbers used are listed below: SDV (Satsuma dwarf virus, AB009958), RpRSV (Raspberry ringspot virus, NC_005266.1), PRMV (Peach rosette mosaic virus, AF016626), ArMV (Arabis mosaic virus, AY303786.1), GFLV (Grapevine fanleaf virus, D00915), CLRV (Cherry leaf roll virus, GU167974.1), ToRSV (Tomato ringspot virus, L19655), TRSV (Tobacco ringspot virus, U50869), GCMV(Grapevine chrome mosaic virus, X15346), TBRV (Tomato black ring virus, AY157993.1), CNSV (Cycas necrotic stunt virus, NC_003791.1 (cycas strain)/ next generation sequencing (NGS) data (lily strain)), CRLV (Cherry rasp leaf virus, AJ621357.1), SLRSV (Strawberry latent ringspot virus, NC_006964.1). Shaded regions represent residues with high identity.
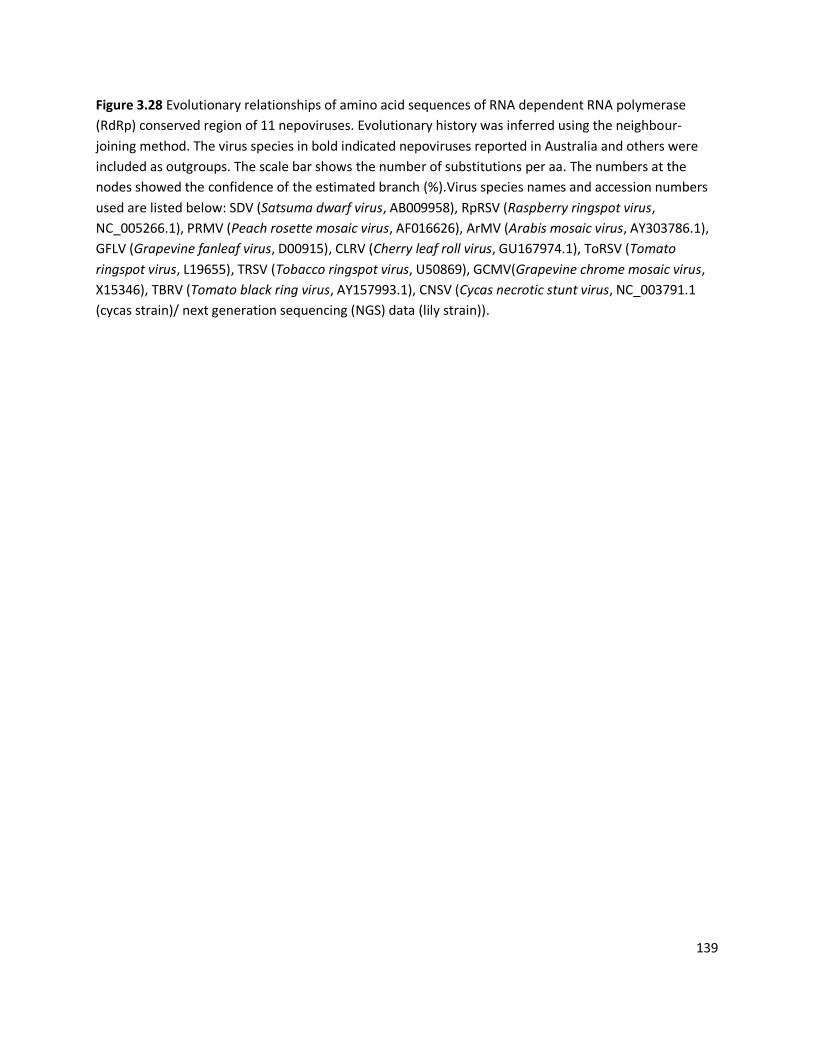
139
Figure 3.28 Evolutionary relationships of amino acid sequences of RNA dependent RNA polymerase
(RdRp) conserved region of 11 nepoviruses. Evolutionary history was inferred using the neighbour-
joining method. The virus species in bold indicated nepoviruses reported in Australia and others were
included as outgroups. The scale bar shows the number of substitutions per aa. The numbers at the
nodes showed the confidence of the estimated branch (%).Virus species names and accession numbers
used are listed below: SDV (Satsuma dwarf virus, AB009958), RpRSV (Raspberry ringspot virus,
NC_005266.1), PRMV (Peach rosette mosaic virus, AF016626), ArMV (Arabis mosaic virus, AY303786.1),
GFLV (Grapevine fanleaf virus, D00915), CLRV (Cherry leaf roll virus, GU167974.1), ToRSV (Tomato
ringspot virus, L19655), TRSV (Tobacco ringspot virus, U50869), GCMV(Grapevine chrome mosaic virus,
X15346), TBRV (Tomato black ring virus, AY157993.1), CNSV (Cycas necrotic stunt virus, NC_003791.1
(cycas strain)/ next generation sequencing (NGS) data (lily strain)).

140
3.4 Discussion
3.4.1 Using Peptide Mass Fingerprinting to identify plant viruses
A simplified assay for identifying viruses in infected plant material using one-dimensional SDS
PAGE to separate total proteins, followed by trypsin digestion of differential bands and PMF
identification of viral proteins, was developed. Four known viruses, ZYMV, TuMV, AMV and
CMV were identified correctly, confirming application of the assay. An unknown virus infecting
an invasive coastal dune weed C. maritima (Rodman, 1986) was identified as PZSV, the first
report of its presence in Australia and in this host species. When plants doubly infected with
two known viruses were tested, only one virus was identified.
3.4.1.1 Selection of propagation hosts for virus and protein extraction protocols
Although the virus assay showed that in some cases both known and novel viruses could be
identified by PMF, some others could not be identified. One of the main limitations to
identification is that virus concentration appeared to vary considerably. For example, in B.
juncea infected with TuMV it showed a high load of TuMV CP on the gel, whereas in N.
benthamiana infected with PWV it showed no visible viral protein band (Fig. 3.7). N.
benthamiana was a good propagation host for CMV (Fig. 3.16). The reason why HarMV CP not
being visualised in infected N. benthamiana protein extracts (Fig. 3.16) was either that the
extraction method was not optimal for HarMV or that the infected N. benthamiana plants did

141
not accumulate enough virions that could be extracted and seen on an one-dimensional
polyacrylamide gel. In support of this explanation, further research (Chapter 5) showed that
two weeks after inoculation HarMV had a much lower accumulation in N. benthamiana than
CMV.
It is important to select proper propagation hosts for viruses to be studied to obtain high virus
titres in host plant tissues. Plants containing high concentrations of tannins, gums, or phenolic
compounds, which interfere with virus purification, are also problematic. Plant species in the
following genera have been found to be suitable propagation hosts for purification of a large
number of viruses: Chenopodium, Cucumis, Nicotiana, Petunia and Vigna (Dijkstra & de Jager,
1998). For most viruses their titre decreases in plants after reaching a peak. Some plant viruses
multiply slowly over relatively long period of time, while others reach a peak titre in a short
period (Kokkinos & Clark, 2006; Malapi-Nelson et al., 2009). For example, Barley yellow dwarf
virus (BYDV) PAV isolate can multiply to the peak level in oat plant roots in 7-8 days after
inoculation (Irwin & Thresh, 1992). In doubly infected (CMV and HarMV) N. benthamiana plant
CMV accumulation reaches a peak level one month after inoculation (Chapter5 Fig.5.12).The
best sampling time is when the viruses multiply to maximum level (Cafrune et al., 2006). Virus
titres in different tissues of plants vary considerably as well. Young and vigorously growing
leaves usually contain virus at a higher titre (Chapter 5).
142
It is also evident from this research that one single protein extraction method cannot be
applied to all plant species or viruses. Successful extraction depends on the plant species, the
maturity of tissues selected and the properties of the target protein (e.g. pI, stability etc).
Although many plant sample preparation protocols for proteomic analysis have been
established (Hurkman & Tanaka, 1986; Meyer et al., 1988; Wang et al., 2004; Wang et al., 2006),
no common or simple protocols can be applied for all plant species. For extraction of plant
viruses, most protocols are specific to a virus or a group of viruses (Gallitelli, 1982; Palukaitis et
al., 1992), partly because different virus particles remain stable at different pH and ion
conditions. A ‘minipurification’ has been developed and shown to be useful to extract proteins
of several plant viruses (Blouin et al., 2010), including CMV, TSWV, Tobacco streak virus (TSV),
AMV, Citrus leaf blotch virus (CLBV) and a novel potexvirus. However, the extraction conditions,
such as the concentration and pH of Na citrate buffer, depend on the stability of the virions of
the species involved, and the technique of Blouin et al. (2010) needs an ultracentrifugation step.
In this study, four protocols were used to extract both plant and virus proteins from plant
tissues. The extraction method that could extract most virus proteins despite their different
stability and properties is desired for the assay. Different protocols in fact extracted different
protein components and this was reflected in the different protein bands in the SDS PAGE gels
(Fig. 3.4). Band 3 was subsequently identified to be CP of ZYMV, however only extraction
method 3 (acetone/DTT precipitation) showed a virus band at about 33 kDa. The acetone/DTT
precipitation method was then applied for subsequent research and successfully used to
extract proteins of four known viruses and one novel virus, from 5 different hosts. However,
this method was not suitable to extract virus protein from several other plants with presumed
143
virus symptoms (H. comptoniana, N. glutinosa, Kennedia coccinea, Anigozanthos manglesii and
Phaseolus vulgaris). The reason could be that this extraction method was not optimised to
extract virus proteins from these hosts, or that the infected plants did not contain a high
enough virus titre that its proteins could be extracted and seen on a gel. Another possibility is
that some of the apparently symptomatic plants were not in fact infected with viruses. But this
can not be tested by ELISA/PCR because no prior knowledge was available for these plants with
symptoms.
3.4.1.2 Visualisation of viral proteins using one-dimensional PAGE
Using this assay strategy, it was possible to identify some of the viruses tested, but further
optimisation is needed in cases where mixed infection occurs with viruses that have closely
similar CP masses, or where CP masses are similar to those of abundant plant proteins. The
large subunit of RuBisCO, especially, is present in leaves in large amounts, and viral proteins of
approximately 50 kDa would be masked by its presence. According to predicted CP masses of
plant viruses (Blouin et al., 2010), most virus CPs have masses lower than that of RuBisCO,
although some fall within its mass range. Another consideration is that viral CPs can be resistant
to trypsin digestion because of post-translational modification (Shukla et al., 1988), which may
explain why coverage of tryptic fragments of viral CPs was relatively low (11–36%). It is worth
noting that viral proteins other than CPs were not observed on the gels or detected by PMF,
probably because they were in quantities below the resolution of the Coomassie stain used. A

144
protein band below 75 kDa in Fig, 3.7 lane 8 may be a viral CI protein. The work also showed
that plant proteins such as RuBisCO were present in lower amounts in infected plants
compared to uninfected control plants (Fig. 3.4, 3.7 and 3.10). There are two possible
explanations for this: (i) virus infection lowers accumulation of plant proteins, including
RuBisCO, (ii) in infected plants, virus proteins account for a portion of the total extracted
protein mass, therefore a proportionally lower amount of plant protein is loaded on the gel. It is
probable that both explanations are correct to a greater or lesser extent(Luo et al., 2010).
In addition to virus CPs, other differentially expressed proteins were found in some infected
and uninfected plant tissue extracts (3.3.4). However, these proteins were either identified to
be plant proteins or remained unidentified. The plant proteins were possibly expressed in
response to virus invasion, while the unidentified proteins could be plant proteins or other
pathogen proteins (including viral protein) that are not present in the protein database. Since
all samples were suspected to be infected with virus based on infection-like symptoms (except
H. comptoniana known to be infected with HarMV) the reason could be either that they were
not infected with virus and the symptoms were due to other environmental or biotic factors,
such as nutrient deficiency, or that the virus did not multiply to a concentration high enough for
detection by one-dimensional PAGE. Differentially expressed plant protein components also
gave clues to investigate the plant defense responses to pathogen invasion, such as a
peroxidase reported to be related to cell wall enhancement for developing a stronger physical
barrier preventing further spread of the pathogen from the site of infection, and 1,3,-beta-D-

145
glucanase has been reported as part of the defence mechanism to fungal infection in previous
studies (Bol et al., 1990).
In Fig. 3.7, band 5 was not an extra band but a much more highly expressed protein, indicating
that this band probably included more than one component. Two-dimensional gel
electrophoresis could also be used to separate such proteins in extracts, although two-
dimensional gel electrophoresis is technically demanding and would require larger protein
extracts for separation. However, in this work it was demonstrated that in a multiple-
component protein band, the more highly expressed protein can be identified by PMF analysis.
One of the main advantages that this assay has over those published previously is rapidity, since
it requires less than two full days to complete. In this approach viruses were identified from an
extract of total plant proteins, without the need for lengthy or complicated methods of
purification of virus particles from host proteins, such as gel filtration chromatography (GFC)
(Wang et al., 2007) or ultracentrifugation (Blouin et al., 2010). It does not require two-
dimensional separation by SDS PAGE (Cooper et al., 2003). However, in the double infection
(CMV and HarMV) experiment, only one virus, CMV, reached a high accumulation in host plant
N. benthamiana that can be extracted and visualised on one-dimensional gel. The protein
extract from N. benthamiana plant only infected with HarMV did not reveal the virus protein
either, indicating HarMV exsited in this host in low accumulation. Application of two-
dimensional electrophoresis or change of host plant may help detect double infection using this
assay.

146
3.4.1.3 Peptide Mass Fingerprinting and tandem MS/MS sequencing
PMF predicts peptide identity by the accurate measurement of peptide masses and a statistical
procedure. Both PMF and MS/MS sequencing were used to identify the protein in band 6 (PZSV
CP) in Fig. 3.10. They were both used successfully to identify the protein and correctly indicated
the species of the virus. The correspondence of peptide sequences predicted by PMF and those
sequenced further justifies the use of PMF to identify virus protein from in-gel digestion,
although one of the peptides detected by PMF was not sequenced, probably because of the
different digestion conditions used to do PMF (3.1.2.5 protocol 1) and sequencing (done by
Proteomics International Pty Ltd). The assay optimised in this study utilises a rapid in-gel trypsin
digestion procedure. Further, single MS analysis rather than tandem MS (Cooper et al., 2003)
was sufficient for identifying the viruses tested.
Despite being relatively simple and rapid, the assay does not currently lend itself to high
throughput analysis of samples, and availability of an appropriate MALDI-TOF mass
spectrometer may be limiting in many laboratories. An appropriate protein extraction
procedure has to be optimised and several suspected bands on the gel may have to be anlysed.
Its primary use is in identifying viruses whose presence is certain but whose identities have
proven difficult to determine using more rapid methods. Once possible PMF matches are
established, other techniques such as those based on nucleic acid analysis or serology can be

147
used to confirm identity. Where viruses are detected that do not share identity with known
viruses, a peptide sequencing approach using MS/MS can be used to gain enough
understanding of the genome to facilitate design of degenerate primers. RT-PCR and
sequencing provide more specific and confident information of virus identities.
Using this approach, four plant viruses were identified successfully to the species level from
two families and three genera with distinct CP sizes and particle morphology (filamentous and
bacilliform). This improved and simplified assay may facilitate wider use of PMF for plant virus
identification, and possibly for other plant pathogens.
3.4.1.4 Pelargonium zonate spot virus
PZSV is the only species in the genus Anulavirus, family Bromoviridae. It was originally isolated
from Pelargonium zonale and first reported in Italy in 1982 (Gallitelli, 1982) and subsequently
from tomato crops in other parts of Europe (Hanssen et al., 2010). The economic importance of
this virus is a result of the tomato disease it induces, with concentric chlorotic/necrotic rings
symptoms on leaves and fruits. It was recently reported in the east coast of North America (Liu
& Sears, 2007) infecting tomato plants. It was listed as a potential threat to the Australian
horticultural industry before its report in this study. This is the first report of the presence of
this virus in Australia and in the host C. maritima. Other hosts of PZSV include tomato (S.
lycopersicon) (Gallitelli, 1982), Pelargonium (Pelargonium zonale), pepper (Capsicum annuum),

148
Rubia tinctorum (Escriu et al., 2009). Since the virus was collected from the coastal dune weed C.
maritima growing along the coast of Perth, and this virus has been shown to be seed-borne in
tomato (Lapidot et al., 2010), it is suggested that PZSV may be transmitted to Western Australia
by ocean current with floating viruliferous seeds. An antibody to PZSV CP is available
commercially, making monitoring of this virus possible using ELISA as well as PCR, should this
virus become a problem in Australia.
3.4.2 Using Next Generation Sequencing to identify plant viruses
NGS and conventional Sanger sequencing were used to obtain the partial genome sequence of
a new strain of CNSV isolated from L. longiflorum. This host is a new host of this virus and this is
the first report of CNSV in Australia. CNSV was first isolated and characterised in Japan in 1986
from sago cycad (C. revoluta) with symptoms of dwarfing and twisting of young leaves and
chlorotic or necrotic spots on mature leaves (Kusunoki et al., 1986), and in 2006 from gladiolus
(Gladiolus spp.) (Hanada et al., 2006). In a glasshouse based inoculation test, the host range of
sago cycad strain is limited whereas the gladiolus strain is wider, mainly infecting ornamental
plants, such as aucuba (Aucuba japonica), daphne (Daphne odora), allium (Allium fistlosum),
globe amaranth (Gomphrena globosa) and zinnia (Zinnia elegans), but also some economically
important crops, including soybean (Glycine max), peanut (Arachis hypogaea) and spinach
(Spinacia oleracea) (Hanada et al., 2006). Chenopodium amaranticolour and C. quinoa were
used as indicator hosts of this virus in which infected leaves showed chlorotic mottle or

149
chlorotic spots. In addition to nematode transmission, many nepoviruses can be transmitted
through seeds, pollen or vegetatively propagated plant materials (Brown et al., 1995). CNSV has
been reported to be both nematode-transmitted and seed-borne (Han et al., 2002). In 2003
CNSV was recorded in New Zealand in sago cycad (C. revoluta) and peonies (Paeonia lactiflora)
(Ochoa-Corona et al., 2003), indicating that this virus is probably widespread internationally.
Unlike other diagnostic assays, such as ELISA, PCR or hybridization methods, NGS does not
require any virus-specific reagent, therefore it can be used as a universal identification
technique. Full genome sequences can be obtained readily through NGS and subsequent
bioinformatic analysis (Adams et al., 2009; Wylie & Jones, 2011b; Wylie & Jones, 2011c).
Although the majority of the genome sequence (86%) was obtained by NGS, the sequence of
the 5’ prime end of CNSV lily strain RNA 1 was not obtained (Fig. 3.23, arrows indicated). This
might result from a biased library preparation. Future work should include sequencing the
remainder of the genome by conventional sequencing or rapid-amplification of cDNA ends
(RACE).
As for the genome organisation, CNSV has common features of viruses in the Comoviridae: a
bipartite genome; RNA 1 encodes a helicase, 3-C like proteinase and RdRp to form a conserved
replication block; RNA 2 polyprotein includes a MP immediately followed by the CP. All
nepoviruses have two domains upstream of the helicase in RNA 1, which is different from the
150
other two genera in the same family: Comovirus and Fabavirus. CNSV shares this feature in
nepoviruses. Furthermore, CNSV RNA 1 and RNA 2 have identical 5’ untranslated (UTR) and 3’
UTR regions, which is typical of nepoviruses (Sanfacon et al., 2009). By analysing the RdRp
conserved regions of the lily virus and 13 other nepoviruses, the lily virus had 89% and 96%
identity to CNSV (Cycas strain) at the nucleotide sequence and amino acid sequence levels,
respectively. However, this virus showed limited homology to other nepoviruses with identity
of 53%–65% and 29%–64% at the nucleotide and amino acid levels, respectively. According to
the criteria defining species within Comoviridae (two species have less than 75% nucleic acid
sequence identity and less than 80% amino acid sequence identity) (Sanfacon et al., 2009) the
virus from the lily plant belongs to CNSV at the species level. Therefore, we propose that the
detected virus is a new strain of CNSV, named lily strain (RNA 1, accession number JN127336;
RNA 2, accession number JN127337).
Detection of the virus in the lily bulb tissues suggests that CNSV is not only transmitted by seed
and nematodes, but also through vegetatively propagated plant materials, which significantly
increases the chance of its spread within Australia, because many ornamental plants, including
lily, are vegetatively propagated in nurseries and planted in home gardens. Furthermore, the
same viral symptoms reported here have already been observed for more than 10 years in the
lily plant tested in this study, so it is probable that CNSV is already established in Australia. It
has been reported that different CNSV strains have a much wider host range than generally
recognized (Hanada et al., 2006). The economic importance of CNSV, distribution and potential
151
to infect native flora still needs to be assessed, to determine its quarantine status. CNSV
appears to be a broad host range virus because the three natural hosts reported (cycas, lily and
peony) are distantly related. It is therefore a possible threat to other commercial species and
indigenous plants. CNSV isolates in Japan have been shown to be highly variable and have a
rather wide host range, including ornamental and crop plants, including soybean (Glycine max),
peanut (Arachis hypogaea) and spinach (Spinacia oleracea) (Hanada et al., 2006). Future work
should focus on the incidence of CNSV infection in naturalised and domesticated lily plants,
other ornamental plants, such as cycas and native plants. RT-PCR/ sequencing appears to be the
best way to detect CNSV, since serological properties of different CNSV isolates can be variable
(Ochoa-Corona et al., 2003). The results reported here will assist in detecting other strains of
the virus (Wylie et al., 2011).
152
CHAPTER 4 A NEW ENCOUNTER BETWEEN A
VIRUS AND A GRAIN LEGUME AT THE
INTERFACE OF AN ANCIENT ‘BIODIVERSITY
HOTSPOT’ AND A RECENT AGROECOSYSTEM
153
4.1 Introduction
Plant viruses co-evolved with wild plants long before crop domestication (Lovisolo et al., 2003).
When man first domesticated plants about 10,000 years ago, some plant viruses were favoured
when host plant species were selected for domestication traits and cultivated over large areas
(Vaughan et al., 2007). Humans inadvertently extended the geographical and host ranges of
viruses infecting their crops when they migrated to new lands carrying infected plants with
them. In new locations viruses encountered new hosts, new vectors, and other viruses (Thresh,
1980). Perhaps more commonly, domesticated species encountered new viruses from the local
flora when they were established in new regions. Passage within an alternative host was likely
to be major driver of evolutionary change (Kearney et al., 1999; Lovisolo et al., 2003), which, in
some cases, led to host specialisation through mutation and recombination (Wylie et al., 2008;
Wylie & Jones, 2009). Reproductive success of a virus upon encountering a new host depended
on the type of resistance encountered and the number of resistance genes present (Harrison,
2002). In modern times, reports of new encounters between viruses and plants have increased
with the rapid trade of plant products around the world, and with better detection assays
(Gibbs & Mackenzie, 1997; Luo et al., 2010). Further, it is anticipated that climate change will
increase the incidence of new encounter scenarios between plants, viruses, and their vectors.
Encounters of native viruses and introduced crops were reported in Africa. For example,
Cassava brown streak disease was first reported in Tanzania in 1936 (Storey, 1936) and it was
recently reported to be caused by an African native whitefly-borne virus Cassava brown streak
virus (CBSV) (Monger et al., 2001; Maruthi et al., 2005) which induced necrotic roots and stems

154
on cassava originally from Brazil. Replacement of vulnerable cultivars with relatively tolerant
ones has reduced US$ 15–20 million loss caused by viruses in production of cassava in Africa
(Thresh, 2006). Studying viruses in wild plant communities and at the interface between wild
and cultivated vegetation is a neglected area that has the potential to provide critical
information on threats to biodiversity and cultivated species, and on virus evolution (Lovisolo et
al., 2003; Jeger et al., 2006).
Narrow-leafed lupin (L. angustifolius) is a grain legume originating from the Mediterranean
basin where it has been utilised as a food source for millennia. Today, cultivars are grown in
several regions of the world (Europe, the Americas, southern Africa, southern Australia). In the
‘wheatbelt’ area within the Southwest Australian Floristic Region of Western Australia, low
alkaloid lupin cultivars were first grown commercially in the early 1970s (Gladstones, 1972).
They now constitute a critical component of the cropping system where they are sown in
rotation with wheat. The region grows around 80% of world lupin grain production, amounting
to 920,000 t produced on 650,000 ha in 2005 (Palta et al., 2008). The bulk of the grain is
processed into stock feed.
Several viruses are reported to infect lupin crops in Western Australia (Jones & McLean, 1989),
but the most economically significant are CMV (family Bromoviridae, genus Cucumovirus) and
BYMV (family Potyviridae, genus Potyvirus), neither of which originated in Australia. BYMV also

155
infects at least four wild legumes indigenous to the Southwest Australian Floristic Region
(McKirdy et al., 1994). Narrow-leafed lupin cultivars respond to BYMV infection either by
systemic necrotic or non-necrotic reactions. Infection by the necrosis-inducing strain of BYMV
kills young lupin plants quickly (Jones et al., 2003) and spreads through the crop in a monocyclic
pattern because there is only a brief window of time for virus acquisition and transmission to
other plants by aphid vectors before the plant dies. Symptoms of infection by the non-necrosis-
inducing strain include tip necrosis, stunting, and flower abortion, but not plant death. Affected
plants remain infective for the duration of the growing season resulting in a polycyclic spread
pattern (Cheng & Jones, 2000). Early infection of necrotic strain of BYMV killed lupins therefore
there was no seed production while the late infection decreased the number of seeds by 55%
to 80%. The yield losses resulting from the non-necrotic strain of BYMV depended on the
infection stage. The number of seeds decreased by 27% to 98% as infection duration increased
(Jones et al., 2003).
The Southwest Australian Floristic Region is one of 25 global ‘biodiversity hotspots’, where 7380
species of indigenous vascular plants have been described, half of them endemic (Myers et al.,
2000; Brooks et al., 2002; Hopper & Gioia, 2004). Webster et al. (2007) described 29 isolates of
a novel plant virus from the region, HarMV (genus Potyvirus), that symptomatically and
asymptomatically infected plants of H. comptoniana (Australian native wisteria), an endemic
wild species whose provenance is a narrow coastal strip about 800 km in length within the
region. H. comptoniana has an attractive climbing growth habit and panicles of purple flowers
156
which makes it a valuable amenity plant that is traded around the world, and the subject of
selective breeding. Although the authors identified other natural hosts of HarMV, the level of
infection amongst them appeared to be very low (unpublished data). On the other hand, the
level of HarMV infection of wild H. comptoniana plants was high. At seven collection sites
within its natural range, 13-72% (mean 45%) of H. comptoniana individuals were infected with
HarMV. Nucleotide sequences from a collection of isolates from throughout its natural range
showed CP genes were genetically diverse (over 21% nucleotide diversity), placing isolates in
eight distinct phylogenetic groups that corresponded mainly to geographic location (Webster et
al., 2007). Because genomic divergence is roughly proportional to the evolutionary distance
from a common ancestor (Van Regenmortel, 2000), a high degree of sequence diversity over a
small geographic range, as was the case with HarMV, is typical of a virus that co-evolved with
indigenous wild plants over a long period of time (Spetz et al., 2003). Webster et al. (2007)
described a glasshouse-based experiment where HarMV isolates representing six of the eight
described phylogenetic groups were inoculated manually or by aphids to four species of lupins:
L. cosentinii (sandplain lupin), L. luteus (yellow lupin), Lupinus mutabilis (pearl lupin) and L.
angustifolius (narrow-leafed lupin). All lupin species became infected and symptoms observed
ranged from symptomless local infection in L. mutabilis to plant death in L. cosentinii. Reactions
in infected narrow-leafed lupin plants resembled those of the non-necrotic strain of BYMV: leaf
mosaic, leaf distortion, leaf down-curling, stunting, and bunching of young leaves, but not plant
death.

157
Despite the clearance of more than 75% of the native vegetation of the ‘wheatbelt’ region of
the Southwest Australian Floristic Region since agriculture first began there 180 years ago
(Coates & Dixon, 2007), H. comptoniana remains a common component of the indigenous flora
that survives on road verges and perimeters of fields in part of the area where lupins are
cultivated, notably the coastal strip from Perth to about 200 km north of Perth. The region
provides an interface between the remnants of an ancient ecosystem and a recent
agroecosystem that is ideal for studying interactions between native and introduced plant
viruses and their native and introduced hosts. Although the study by Webster et al. (2007)
indicated there was potential for HarMV to spread naturally via vectors to lupin crops, this was
not tested in the field and using H. comptoniana as a source plant. In this Chapter a two-years
field study is described in which H. comptoniana plants infected with HarMV were grown within
a field plot of narrow-leafed lupin plants and monitored for natural spread of HarMV via wild
aphids.

158
4.2 Methods and Materials
4.2.1 Virus resource, inoculation and grafting
H. comptoniana seedlings were germinated in seedling trays in an insect-proofed glasshouse.
When seedlings were eight weeks old leaf samples from each plant were tested for potyviruses
by indirect ELISA (Torrance et al., 1986) using a generic potyvirus monoclonal antibody (Agdia
Inc). Actively growing shoots were taken from a naturally infected (isolate MU-4), wild H.
comptoniana plant growing on campus at Murdoch University (Fig. 4.1 A), Perth, inoculated and
grafted on virus-tested H. comptoniana seedlings (Fig. 4.1) (Fig. 4.2) in the glasshouse
(described in Chapter 2).
Four weeks after grafting, young H. comptoniana leaves were tested by ELISA. Where a
potyvirus was detected by ELISA it was further characterised using RT-PCR and nucleotide
sequencing. Total RNA was extracted using an RNeasy Plant Miniprep kit (Qiagen, #74904).
Degenerate primers used were LegpotyF (5’- GCWKCHATGATYGARGCHTGGG-3’) (Webster et al.,
2007) and LegpotyR (5’- AYYTGYTYMTCHCCATCCATC-3’) (Wylie et al., 2010) (annealing
temperature 50 oC). These primers generate an amplicon of approximately 630 bp from most
potyviruses, which corresponded to the 3’ terminal end of the NIb gene and the 5’ region of the
CP gene. For amplification and sequencing of the whole HarMV CP gene, primer sequences
used were HarMVCPF (5’- CYCCTTACATTGCTGAATCAGC-3’) and HarMVCPR (5’-
GACTACGAGCCAATAACTGTG-3’) (annealing temperature 50oC). RT-PCR conditions and direct

159
nucleotide sequencing of the resulting amplicons were as described in Chapter 2. Sequences
were edited within Geneious Pro v4.8.3 (Drummond et al., 2010), then compared with those in
GenBank (National Centre for Biotechnology Information, Bethesda, MD) using BlastN (Altschul
et al., 1997). The CP sequence of HarMV isolate MU-4 was assigned an accession code by
GenBank.
Figure 4.1 A: Hardenbergia comptoniana plant naturally infected with Hardenbergia mosaic virus (HarMV) on campus at Murdoch University, Perth. B: Symptoms on naturally infected (MU-4) wild H. comptoniana leaves include mosaic and leaf distortion. C: Two month old healthy H. comptoniana seedlings. D: Uninfected H. comptoniana leaves in the glasshouse.

160
Figure 4.2 A, B, C: Grafted shoots infected with Hardenbergia mosaic virus (HarMV) on stock plants. D: Symptoms of infection of Hardenbergia comptoniana leaves after grafting in the glasshouse.
4.2.2 Field plot layout, field data collection, seed transmission
Pilot study 2009
L. angustifolius cv Mandelup seed was obtained from the Department of Agriculture and Food,
Western Australia. The land used for this experiment was located on the campus of Murdoch
University, Perth, Western Australia. A plot 9 x 5 metres in area and consisting of a sandy loam
was prepared by rotary hoeing. Nitrophoska blue fertiliser (12-12-17-2+TE) was broadcast at
the rate 2 kg/100 m2. Six rows of lupin cv Mandelup were sown by hand at a density of 7/m2 in
July 2009. Ten H. comptoniana plants infected with HarMV were planted amongst the lupins
throughout the plot (Fig. 4.3 and 4.4).

161
Figure 4.3 Experimental plot in 2009 15 weeks after planting showing the position of virus source plants (Hardenbergia comptoniana) (▲), uninfected (●) and infected lupin plants (■). Numbers represent the distance in metres of the infected plant to the north end of the row. Numbers in parentheses represent the order in which plants developed symptoms of virus infection.

162
Figure 4.4 Picture of layout of field trial in 2009. A: Lupins started to germinate one week after planting. Hardenbergia comptoniana plants infected with HarMV were planted at random intervals in the plot. B: Lupins grew to two leaf stage at week two. C: Field trial layout eight weeks after planting.
Plants were watered regularly. No pesticides were applied during the trial so that wild aphids
could freely colonise plants. Lupin seedlings were examined twice weekly for symptoms of virus
infection and for aphids. Every 10-12 days, leaves of plants with symptoms resembling virus
infection were collected and tested by ELISA for potyvirus and RT-PCR/sequencing using
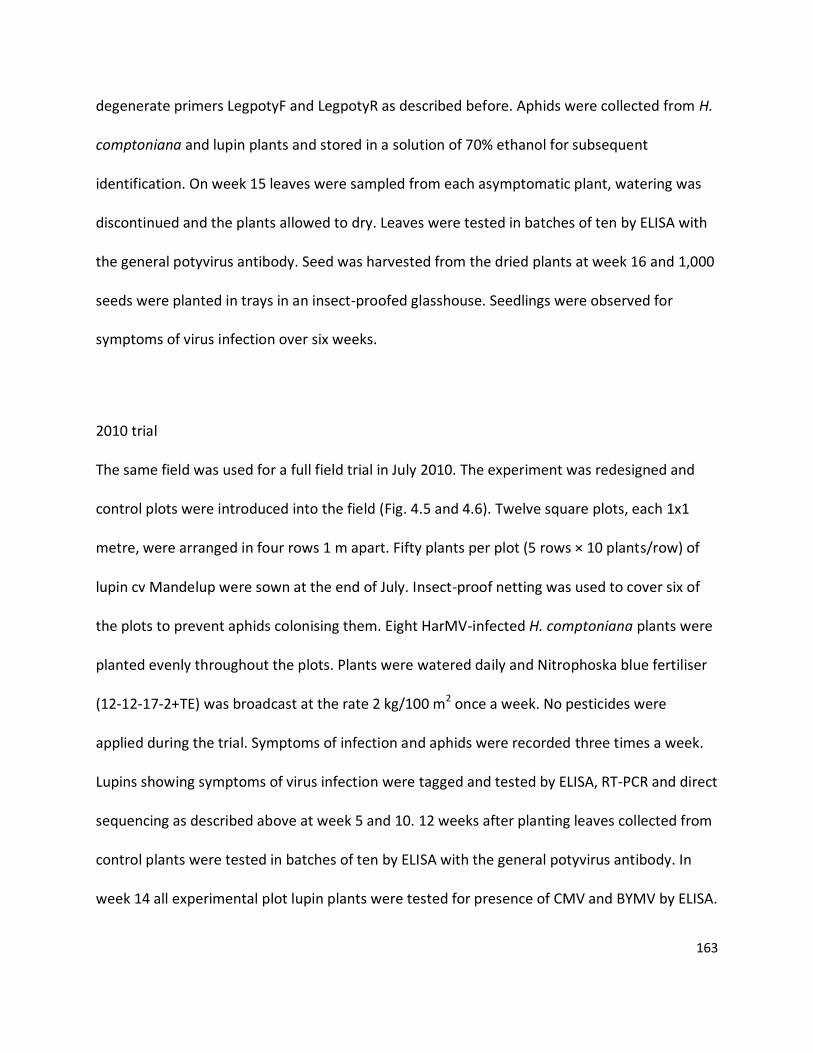
163
degenerate primers LegpotyF and LegpotyR as described before. Aphids were collected from H.
comptoniana and lupin plants and stored in a solution of 70% ethanol for subsequent
identification. On week 15 leaves were sampled from each asymptomatic plant, watering was
discontinued and the plants allowed to dry. Leaves were tested in batches of ten by ELISA with
the general potyvirus antibody. Seed was harvested from the dried plants at week 16 and 1,000
seeds were planted in trays in an insect-proofed glasshouse. Seedlings were observed for
symptoms of virus infection over six weeks.
2010 trial
The same field was used for a full field trial in July 2010. The experiment was redesigned and
control plots were introduced into the field (Fig. 4.5 and 4.6). Twelve square plots, each 1x1
metre, were arranged in four rows 1 m apart. Fifty plants per plot (5 rows × 10 plants/row) of
lupin cv Mandelup were sown at the end of July. Insect-proof netting was used to cover six of
the plots to prevent aphids colonising them. Eight HarMV-infected H. comptoniana plants were
planted evenly throughout the plots. Plants were watered daily and Nitrophoska blue fertiliser
(12-12-17-2+TE) was broadcast at the rate 2 kg/100 m2 once a week. No pesticides were
applied during the trial. Symptoms of infection and aphids were recorded three times a week.
Lupins showing symptoms of virus infection were tagged and tested by ELISA, RT-PCR and direct
sequencing as described above at week 5 and 10. 12 weeks after planting leaves collected from
control plants were tested in batches of ten by ELISA with the general potyvirus antibody. In
week 14 all experimental plot lupin plants were tested for presence of CMV and BYMV by ELISA.

164
Seeds, harvested from infected lupins plants in week 16, were planted in trays in an insect-
proofed glasshouse. Seedlings were observed for symptoms of virus infection and tested by
ELISA for potyvirus two weeks after germination.
Figure 4.5 Field experiment layout in 2010. Symbol ▲ showed position of virus source plants (H Hardenbergia comptoniana) with the number under them indicating the distances they were away from the south end of the field. Each square represents a plot planted with 5 rows of lupin plants, each row 10 individuals. T1 to T6 were experimental plots while C1 to C6 were control plots covered with insect-proof netting. ● indicates uninfected and ○ infected lupin plants. The total infection rate was 39.1% at the margin and 24.4% at the centre of all the plots.

165
Figure 4.6 Field experiment in 2010. A: Layout of the field trial. Control plots were covered by insect-proof netting. Infected Hardenbergia comptoniana plants were planted between plots. Lupins with suspected symptoms were marked by blue paper tags and tested. B: Lupins growing under the aphid proof covers as controls, where no potyvirus infection was found.
4.2.3 Interactions of three HarMV isolates against four lupin cultivars
Two isolates of HarMV (WHP-1, WHP-2) collected from wild H. comptoniana plants growing at
Wireless Hill Park, Perth, were sequenced using primer HarMVCPF and HarMVCPR as described

166
above. Sequences were compared with those in GenBank using BlastN to sort out the virus
isolates. L. angustifolius cvs Mandelup, Belara, Tanjil and Tallerack seeds were obtained from
the Department of Agriculture and Food, Western Australia and planted in insect-proofed
glasshouse. Fresh leaves of H. comptoniana infected with three HarMV isolates (WHP-1, WHP-2
and MU-4) were collected and inoculated to lupin plants in the glasshouse when the seedlings
were at the two-leaf stage (each inoculation with a repeat pot and a control pot). Infected leaf
tissue was ground in cold 0.05M potassium phosphate buffer (pH 7.2) with a mortar and pestle,
which was mixed with the diatomaceous earth ‘celite’ before being rubbed onto young leaves.
Viral symptoms were recorded daily to week 6.
4.3 Results
The ELISA test of 20 eight-week-old seedlings of H. comptoniana showed that none of them
were infected by potyviruses. Four weeks after shoots derived from a wild H. comptoniana
plant infected with HarMV isolate MU-4 were grafted to each seedling, some plants showed
virus like symptoms of systemic infection on young leaves in ungrafted shoots (Fig. 4.2). Grafted
and ungrafted shoots of all plants were tested for potyviruses by ELISA. Ten grafted plants were
systemically infected with a potyvirus, confirmed to be HarMV MU-4 by nucleotide sequencing
of PCR amplicons (accession number GU812281). A phylogenetic analysis of the CP sequence of
the isolate showed it to be a member of HarMV group V (Webster et al., 2007). Symptoms were
typical of naturally infected H. comptoniana plants: chlorosis, mosaic patterns on the leaves and
leaf distortion (Fig. 4.2). Aphids were first observed on lupin seedlings in the field plot (both

167
2009 and 2010) two weeks after planting and on new growth on H. comptoniana plants six
weeks after planting. Both winged and wingless Myzus persicae (green peach aphid),
Acyrthosiphon kondoi (bluegreen aphid) and Rhopalosiphon padi (oat aphid) were collected
from both species (Fig. 4.7).
In the 2009 pilot study leaves of lupins with suspected symptoms of virus infection, including
leaf down curling, stunting, necrotic stem streaking, tip wilting, leaf abscission, and necrosis (Fig.
4.8) were collected on weeks 8, 10, 12, 13 after planting. In total, 15 plants were infected by
potyviruses over the course of the experiment, five at week 8, four each at weeks 10 and 12,
and an additional two at week 13. Nucleotide sequences showed that 14 of these plants (4.67%
of the total lupin plants) were infected with HarMV MU-4 (Fig. 4.3), the same isolate present in
the H. comptoniana plants. The remaining lupin plant was infected with the necrotic strain of
BYMV, presumably transferred from a wild plant growing nearby. All infected plants died within
20 days of symptoms becoming visible and none produced viable seed. About 4-5 infected
plants were identified during each of the first three samplings. Only two infected plants were
identified on the final sampling day in October 2009, probably because the exceptionally hot
and dry weather during this time inhibited aphid activity. By then, H. comptoniana plants had
stopped active growth and aphids could not be found on them. In general, lupins that became
infected occurred close to H. comptoniana plants, both along rows and across rows (Fig. 4.3 and
4.9). Nine of the 14 infected lupins were located within 1 m of a H. comptoniana plant. No
potyviruses infected the asymtomatic lupins that were all tested before the plants dried off.
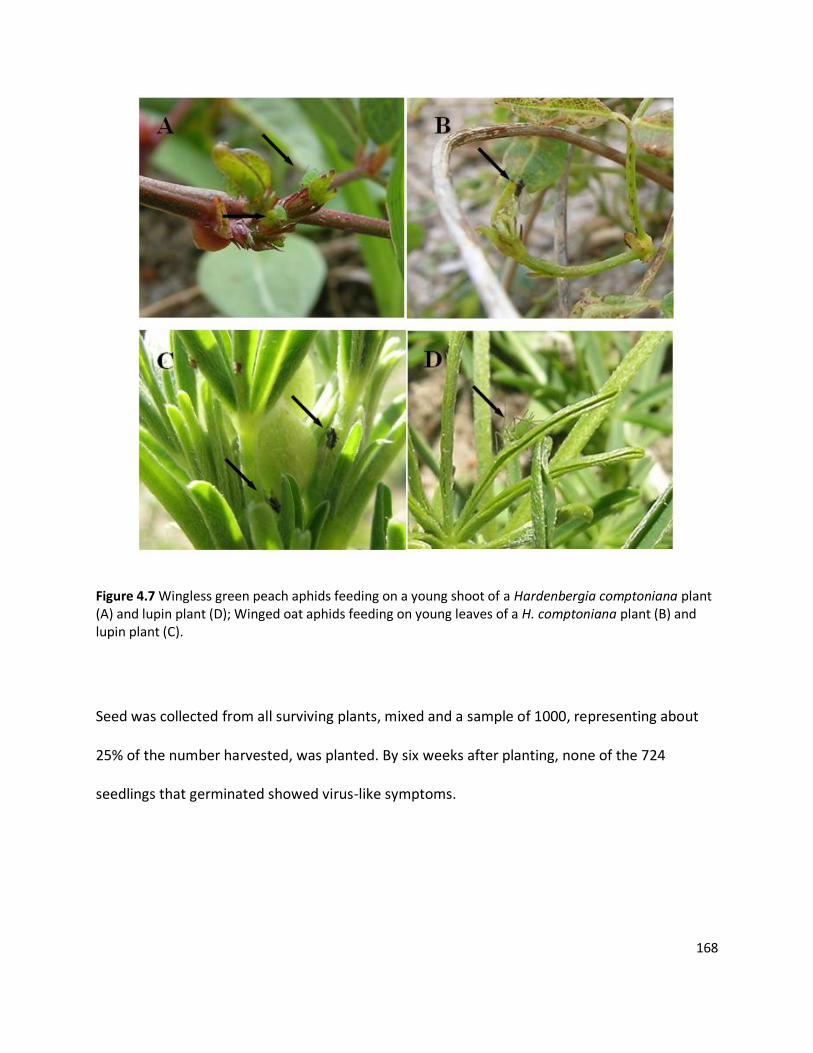
168
Figure 4.7 Wingless green peach aphids feeding on a young shoot of a Hardenbergia comptoniana plant (A) and lupin plant (D); Winged oat aphids feeding on young leaves of a H. comptoniana plant (B) and lupin plant (C).
Seed was collected from all surviving plants, mixed and a sample of 1000, representing about
25% of the number harvested, was planted. By six weeks after planting, none of the 724
seedlings that germinated showed virus-like symptoms.

169
Figure 4.8 Typical viral symptoms of lupin plants induced by Hardenbergia mosaic virus (HarMV) infection. (A) The plant showed typical necrotic stem streaking, stunting and seed production failure by early infection; (B) Late infection induced no stunting and seed production failure but common necrotic stem streaking; (C) Typical tip necrosis occurred on a lupin plant; (D) Healthy lupin plants growing vigorously under the cover net.

170
Figure 4.9 Number of lupin plants infected with Hardenbergia mosaic virus (HarMV) MU-4 decreases with distance (metres) to the nearest virus source plant (Hardenbergia comptoniana). The trend line fits y = 8.3255e-0.921x.
In the experiment in 2010, the first lupin plant showing the same suspected symptoms
described above (Fig. 4.8) were sampled and tested to be infected with HarMV (isolate MU-4)
by nucleotide sequencing 5 weeks after planting. The leaves of symptomatic lupin plants were
all collected and tested by ELISA for potyvirus 10 weeks after planting, of which 92 were
positive (infection rate 30.67%). 25 of them were randomly selected and further characterised
by nucleotide sequencing, confirmed to be infected with HarMV (isolate MU-4). Although they
initially developed symptoms resembling those present in 2009, infected plants usually did not
die before uninfected plants (3 infected plants died). Spread was also much greater in 2010,
probably because infected lupin plants acted as foci of infection to other lupins. Lupin plants on
the margins of the plots initially became infected before those in the middle of the plots (Fig.
4.5), suggesting that lupin to lupin spread may have been occurring. In week 12 no lupin plants

171
in the control plots were infected with potyvirus. None of the lupin plants in the experimental
plots was confirmed to be CMV or BYMV infected in week 14. If non-necrotic HarMV infection
became widespread in lupin crops it could impact on yields. Seed from all 92 HarMV infected L.
angustifolius plants and another 92 uninfected plants were collected and dried in paper bags at
room temperature for 10 days before analysis. HarMV infection reduced individual seed weight
by 32% (Fig. 4.10A), seed number by 79% (for 92 plants) (Fig. 4.10B), and reduced total seed
yield of 92 plants by 86% (Fig. 4.10C). The seed was often discoloured (Fig. 4.10D). None of the
761 seedlings grown from seed collected from infected parent plants were positively tested to
be HarMV infected by ELISA. Like BYMV, the virus does not appear to be seed transmitted in
the same manner that CMV is. The question remains why the symptom phenotypes were
different in 2009 and 2010.
Four lupin cultivars showed different levels of resistance to three HarMV isolates (isolate MU-4,
WHP-1 and WHP-2) infection (Table 4.1 and Fig. 4.11). Necrotic stem streaking and tip leaf
necrosis were common symptoms of lupin plants with HarMV infection. Slight necrotic stem
streaking was visible close to the tip of the plants about two weeks after inoculation and this
then spread to the bottom along stem. Although most tip necrosis was not lethal to lupin plants,
it did cause plant stunting and leaf downcurling. Lupin cvs Mandelup and Belara infected with
HarMV isolate WHP-2 showed systemic necrosis and died 22 and 32 days after inoculation
respectively. Although no lupin cultivar was found to induce a systemic hypersensitive response
to all three HarMV isolates, lupin cvs Mandelup and Belara showed necrotic responses to
isolate WHP 2.

172
Figure 4.10 Data from 2010 field plot: comparison of average grain weight of single seed (A), seed
number produced per 92 Lupinus angustifolius plants (B), seed weight produced per 92 L. angustifolius
plants (C) and appearance (D) between Hardenbergia mosaic virus (HarMV)–infected (dark grey) and
uninfected (light grey) L. angustifolius plants.

173
Figure 4.11 Symptom variation among 4 genotypes of Lupinus angustifolius infected with 3 isolates of Hardenbergia mosaic virus (HarMV) (WHP-1, WHP-2 and MU-4). Photos were taken 25 days after inoculation. Belara infected with WHP-2 isolate exhibited systemic necrosis 22 days after inoculation and Mandelup infected with WHP-2 isolate died 32 days after inoculation. Symptoms are described in Table 4.1.
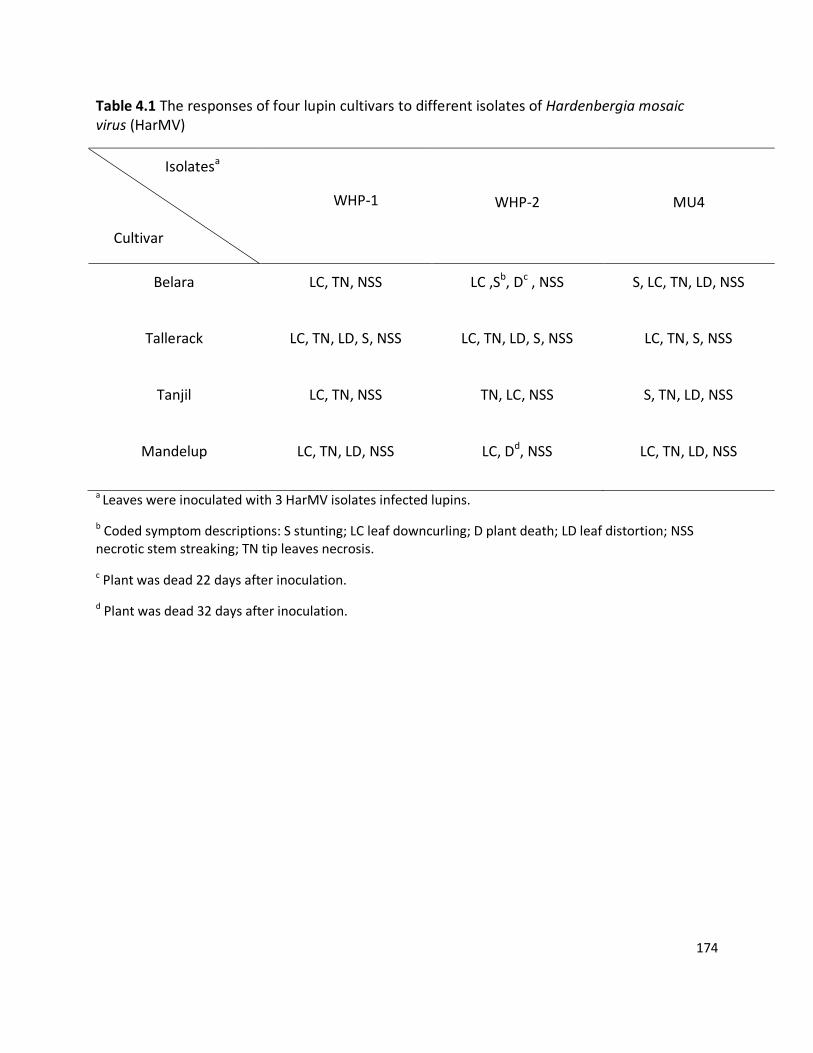
174
Table 4.1 The responses of four lupin cultivars to different isolates of Hardenbergia mosaic virus (HarMV)
Isolatesa
Cultivar
WHP-1
WHP-2
MU4
Belara LC, TN, NSS LC ,Sb, Dc , NSS S, LC, TN, LD, NSS
Tallerack LC, TN, LD, S, NSS LC, TN, LD, S, NSS LC, TN, S, NSS
Tanjil LC, TN, NSS TN, LC, NSS S, TN, LD, NSS
Mandelup LC, TN, LD, NSS LC, Dd, NSS LC, TN, LD, NSS
a Leaves were inoculated with 3 HarMV isolates infected lupins.
b Coded symptom descriptions: S stunting; LC leaf downcurling; D plant death; LD leaf distortion; NSS necrotic stem streaking; TN tip leaves necrosis.
c Plant was dead 22 days after inoculation.
d Plant was dead 32 days after inoculation.

175
4.4 Discussion
Field trials done in 2009 and 2010 are described which showed that natural infection can occur
between HarMV, a virus of indigenous plants in south-western Australia, and narrow-leafed
lupin, an important component of the cropping system of the region. Because symptoms of
HarMV infection of lupins usually resemble those of non-necrotic BYMV (Cheng & Jones, 2000)
and may have been mistaken for it, it is possible that HarMV infection has occurred naturally
since lupin production began in the region in the early 1970s. HarMV was only characterised in
2007 (Webster et al., 2007) and there is no specific antiserum for it, making high-throughput
testing problematic.
In 2009 the lupin response to HarMV infection resembled that of a necrotic strain of BYMV, and
the reasons for this are unclear. It may have been because there was less rain in 2009 than
2010 so the plants were under more physiological stress. Three of 92 infected lupin plants in
2010 died probably because of infection with other pathogens or pests. Isolate MU-4 was not
one of those used in the previous glasshouse study by Webster et al. (2007). The nucleotide
sequence of isolate MU-4 placed it in phylogenetic group V, none of whose members caused a
necrotic reaction in narrow-leafed lupin in the glasshouse study (Webster et al., 2007). In the
glasshouse based experiment Mandelup infected with HarMV MU-4 also developed non-
necrotic symptoms, suggesting that the response of lupins to infection in 2009 was atypical. The
stage of infection of the plants may have been a factor. In lupins, infection by BYMV at the
seedling stage induces more stunting and loss of seed production failure (Cheng & Jones, 2000).

176
These authors tested differential responses of two lupin genotypes to BYMV infection and
distinguished two subgroups within the necrotic strain, one of which induced systemic necrosis
in both lupin genotypes and the other that killed one but induced a non-necrotic response in
the other. Here a range of lupin genotypes was challenged against a panel of HarMV isolates
and a similar interaction occurred between HarMV and narrow-leafed lupin. Isolate WHP-2 was
shown to cause a necrotic reaction in cvs Mandelup and Belara but a non-necrotic response on
cvs Tanjil and Tallerack. Isolate WHP-1 and MU-4 induced non-necrotic symptoms to all four
lupin genotypes. A study by Wylie et al. (2008) showed that comparisons of CP nucleotide
sequences of BYMV did not distinguish between necrotic and non-necrotic strains, indicating
the genetic determinant of those phenotypes did not reside in the CP. It appears that this also
applies to HarMV.
The experiments here showed that the HarMV isolate which induced necrotic or non-necrotic
symptoms on lupin plants had a strong impact on the virus spread pattern and infection rate. In
2009 the infection rate of HarMV was low (4.67%), as expected with a virus that induces rapid
death of its host. The infection rate in 2010 was much higher (30.67%). In 2010, some plants
infected early remained infective in the field for more than eight weeks, possibly acting as viral
reservoirs for further spread. In these experiments, the rate of spread would also have been
influenced by several factors including the density of lupin plants, the density of infected H.
comptoniana plants, and the number, species, and activity of aphids. In the 2009 trial, plant
density of seven plants/m2 was lower than the usual agricultural rates in the region of 25-45
plants/m2 (O'Connell et al., 2003). Higher incidences of virus infection occur at lower lupin plant

177
densities, attributed partly to incoming viruliferous vector aphids being more attracted to
plants with bare earth around them than to a plant canopy (Jones, 1993). In 2010 the plant
density in the trial was closer to that in agricultural fields (50 plants/m2). In agricultural fields, H.
comptoniana plants occur around the margin of the crop, not within it as they did in the 2009
trial, so infection of lupins is expected to occur mainly near the margins of fields. This prediction
was studied in 2010 by planting H. comptoniana plants around the plots instead of among the
plants. It was observed that symptomatic plants first appeared in the margin of each plot and
more plants showed common necrotic stem streaking inside the plot later. This was the case
with the necrotic strain of BYMV, which is spread mainly from infected clovers in surrounding
fields (Cheng & Jones, 2000).
Potyviruses are spread by aphid vectors. The three species of aphids recorded colonising both H.
comptoniana and lupin plants (M. persicae, A. kondoi, R. padi) are all naturalised species
originally from the northern hemisphere. This is not surprising because of the around 150
species of Aphididae estimated to be present in Australia, only 13 indigenous species are known
(Valenzuela et al., 2007). All three species associated with both plant species are known vectors
of other potyviruses (Bradley & Ganong, 1955; Castle et al., 1992; Keldish et al., 1998) and are
therefore potentially to be responsible for spreading HarMV. Most infected lupins occurred
close to H. comptoniana plants so viruliferous aphids may have walked between them.
However, winged aphids were present and would be capable of spreading viruses further, as
evidenced by the occurrence of BYMV in one plant in 2009 that must have been brought in by a
winged adult. It had been recorded that aphid activity had an impact on crop yield loss from

178
virus infection in the region. In Western Australia rainfall during late summer and early autumn
(February-April) is a determinant for aphid epidemics that year by influencing soil moisture and
the availability of green plants on which aphids build up before moving into crops (from website
http://www.agric.wa.gov.au/PC_90884.html?s=1001). The overall rainfall from February to
April in 2009 was 23.2 mm while in 2010 it was substantially higher at 79.4 mm, which resulted
in more aphid activity in 2010, and this could be another factor contributing to the higher
infection rate in 2010.
As it stands, HarMV does not appear to pose a significant threat to the Western Australian lupin
industry because the natural range of H. comptoniana covers only a small part of the lupin
growing area of the ‘wheatbelt’, that constitutes a narrow band along the coast from Perth to
200 kms north of it, an area less than 10% of the lupin production area. In an agricultural
context, infection of lupins by the necrotic strain of HarMV is likely to be restricted to the
margins of fields where H. comptoniana grows and cause minimal production losses. However,
the non-necrotic strain could spread rapidly in lupin fields within the vulnerable region of the
‘wheatbelt’ with much higher infection rates.
It is concluded that HarMV is capable of naturally extending its host range under field
conditions to a recently introduced grain legume with the assistance of introduced aphid
species as vectors, but it is probable that this does not pose a significant threat to the lupin
industry at present. H. comptoniana, the major host of HarMV, occurs naturally in only about
10% of the lupin growing area. The virus is potentially not seed-borne so it must be spread from

179
wild plants each year, and it is unlikely be spread to new parts of the wheatbelt because of
restriction to its wild host’s range. However, HarMV is spread by introduced aphids that may
probe a range of native and introduced plant species, thereby offering the virus opportunities
to extend its host range. Further studies should test other native and introduced legumes for
the virus. A high throughput antiserum-based test would simplify screening for HarMV. H.
comptoniana, which is now widely traded around the world as an ornamental plant, and this
too provides opportunities for HarMV to extend its geographical range where it will encounter
a range of potential new hosts, although no studies have been made to determine the extent of
infection of plants internationally. The differential responses to infection of narrow-leafed lupin
by HarMV indicates that this pathosystem represents an ideal opportunity to study evolution
and epidemiology of a virus in real time as it encounters new vectors and hosts at the interface
of an ancient natural ecosystem and a recent agroecosystem.

180
CHAPTER 5 DETECTION AND QUANTIFICATION
OF VIRUSES IN SINGLE OR MIXED INFECTED
PLANTS USING REAL-TIME PCR

181
5.1 Introduction
Real-time PCR is a technique used to detect and quantify template DNA by amplifying PCR
products in the presence of a fluorescent reporter molecule (e.g. SYBR Green or a dye-labeled
sequence specific probe) in which fluorescence increases as the PCR reaction proceeds. This
enables the progress of the sequence-specific reaction to be quantified in real time.
Conventional RT-PCR is able to detect specific viruses only, while real-time RT-PCR is used to
detect and quantify specific virus nucleic acid sequences, such as in the detection of Tomato
mosaic virus (ToMV) in irrigation waters (Boben et al., 2007), TSWV in individual thrips
(Boonham et al., 2002) and Maize chlorotic mottle virus (MCMV) in maize seeds (Zhang et al.,
2010). Compared with conventional RT-PCR, real-time RT-PCR is timesaving, allowing the
detection of viruses during the RT-PCR reaction. Real-time RT-PCR is also highly automated and
sensitive that it does not need to do the electrophoresis at the end of reactions. Real-time
multiplexed assays have been developed to detect simultaneously two or more viruses in plant
tissues (Eun et al., 2000; Mortimer-Jones et al., 2009) using virus sequence-specific probes
labeled with fluorescence probe that transmits at different wavelengths. An advantage of this
method over conventional diagnostic tests is that it is much more sensitive than ELISA and does
not require electrophoretic separation of products as is the case for standard PCR test. This
makes real-time PCR suitable for a high-throughput virus diagnostics. By using highly specific
fluorescence probes, real-time PCR can be used to distinguish different strains or isolates of a
virus and even to detect point mutations (Jacquot et al., 2005; Balme-Sinibaldi et al., 2006;
Kogovsek et al., 2008).
182
Because of its high sensitivity, specificity and ability to detect target nucleic acids in complex
backgrounds, real-time PCR has been developed to quantify amounts of plant viruses (Seal &
Coates, 1998) rather than, for example, using an immunoassay. When a virus infects its host
systemically the virus titre can impact on epidemiology by affecting symptom severity (van den
Bosch et al., 2007), transmission rate (Jimenez-Martinez & Bosque-Perez, 2004), the rapidity of
onset of death (Magbanua et al., 2000) and yield loss. Virus titre varies according to
temperature (Jensen et al., 1985), virus strain (Varma & Malathi, 2003; Jimenez-Martinez &
Bosque-Perez, 2004; Seal et al., 2006), presence of inherent resistance genes, and any applied
control strategy (e.g. propagation in vitro/vivo, breeding for resistance/tolerance) (van den
Bosch et al., 2007).
Narrow-leafed lupin (L. angustifolius) has been cropped in Western Australia since the early
1970s and became an important component of the cropping system mainly for stock feed. Its
growth has also had a significant positive impact on yields of grain crops. For example, lupin is
planted with wheat in rotation to increase wheat yield by contributing to soil nitrogen. The
most economically important virus diseases of lupin plants in Western Australia are caused by
BYMV (family Potyviridae, genus Potyvirus) and CMV (family Bromoviridae, genus Cucumovirus).
Work in Chapter 4 showed that HarMV is naturally transmitted to lupin plants from H.
comptoniana by wild aphids. In a glasshouse, three HarMV isolates were inoculated to four
lupin cultivars and both necrotic and non-necrotic responses were recorded. Lupin cv Belara

183
plants infected with isolate WHP-1 showed symptoms of leaf downcurling, tip leaf necrosis and
necrotic stem streaking, while plants of the same cultivar infected with isolate WHP-2 showed
stunting, leaf downcurling, necrotic stem streaking and death about 22 days after inoculation
(Fig. 4.11 and Table 4.1). A possible reason for the symptom discrepancy was that there were
different titres of the two virus isolates within the plants infected. It is generally recognised that
higher virus titre often generates more severe symptoms (van den Bosch et al., 2007). In this
study, real-time PCR was used to quantify two HarMV iaolates (WHP-1 and WHP-2) titres in
lupin crop (cv Belara). This study aims to use real-time quantitative PCR to elucidate whether
the virus titres contribute to the symptom discrepancy of lupin plants infected with two
different HarMV isolates.
Mixed infections of plants with more than one virus strain or virus species are common in both
cultivated and wild plants (Hammond et al., 1999; Wylie et al., 2011; Wylie & Jones, 2011c). For
example, wild populations of Nicotiana glauca were reported to be infected with seven viruses
(Dodds, 1993). Vegetatively propagated crops are considered to have a higher risk of infection
with multiple viruses (Hammond et al., 1999; Wylie et al., 2011). Mixed infections sometimes
do not exhibit obvious changes in symptoms (Martin & Elena, 2009), but in most cases
symptoms are either enhanced or moderated in some way (Hammond et al., 1999). Other
epidemiological traits affected by the mixed infections include the efficiency of virus
transmission (Wintermantel et al., 2008), host resistance (García-Cano et al., 2006) and the titre
of individual infecting viruses (Malapi-Nelson et al., 2009; Martin & Elena, 2009). It is therefore

184
usually not possible to predict the effects of interactions between two co-infecting viruses on
symptom severity and virus titre, as these will depend on the different virus species and host.
The same co-infection of viruses in different hosts has been shown to induce different symptom
modification and viral titres (Kamei et al., 1969; Martin & Elena, 2009). Most species in the
family Potyviridae, one of the largest families of viruses, are in the genus Potyvirus. They infect
a wide range of plants and cause significant losses in agricultural production. CMV, a virus with
a worldwide distribution, has the widest host range of any known plant virus, and infects more
than 1,000 plant species in 100 families (experimental and natural host range) (Hobbs et al.,
2000). Interactions between potyviruses and CMV in co-infected plants (e.g. ZYMV,
Watermelon mosaic virus (WMV) co-infected with CMV in Cucurbit) (Wang et al., 2002)
commonly induced synergistic symptoms, and in plant CMV titre increased while the potyvirus
titre decreased or remained the same compared with singly infected hosts (Taiwo et al., 2007;
Mascia et al., 2010). The CMV 2b gene and potyvirus HC-Pro gene that mediate RNA-silencing
suppression are both involved in this interaction (Martin & Elena, 2009; Mascia et al., 2010).
The expression of the CMV 2b gene inhibits the production of small interfering RNAs (siRNAs)
directed against virus sequences, generated by Dicer-like enzymes, whose expression acts to
suppress the host antiviral silencing (Diaz-Pendon et al., 2007). HC-Pro, decreases siRNA
stability by methylation (Fukuzawa et al., 2010; Mascia et al., 2010), and is also a suppressor of
virus RNA silencing that promotes potyvirus accumulation. In this study, real-time quantitative
PCR was used to determine both CMV and HarMV titres in doubly or singly infected N.
benthamiana plants. This study is to investigate the interaction between two co-infection virus,
HarMV and CMV, in host plant N. benthamiana.
185
In the study described in this Chapter, HarMV isolates WHP-1 and WHP-2 were quantified in
lupin cv Berala leaf tissues to investigate the relationship between symptom severity and virus
titre. In its natural host, the symptom severity of HarMV different isolates infection varies for
different plants, and even different branches of the same plant infected with the same HarMV
isolate show inconsistent symptoms (Fig. 5.1). The leaves of a wild H. comptoniana plant
infected with HarMV isolate WHP-2 showed different symptoms and was collected. The virus
titres in these leaves were quantified using real-time quantitative PCR to determine whether
different virus titres contributed to differences in this symptom development.

186
Figure 5.1 Symptom variation in wild Hardenbergia comptoniana plants infected with Hardenbergia mosaic virus (HarMV) isolate WHP-2 located on the Murdoch campus (A). The leaves shown in (B) to (F) in this figure were from this single plant; (B) Leaves showed bright yellow spots and blotches, distortion and mosaic at the front compared with asymptomatic leaves behind; (C) Leaves on the right showed severe chlorosis and distortion compared with asymptomatic leaves on the left; (D, E) Leaves showed mosaic and are distorted; (F) Leaves showed yellow spots and mild distortion.

187
5.2 Methods and Materials
5.2.1 Quantifying necrotic and non-necrotic HarMV isolates in lupin plants
Wild H. comptoniana leaves (10-20) infected with HarMV isolates WHP-1 and WHP-2 were
collected and inoculated to lupin plants in an insect-proofed glasshouse (temperature 23 °C) as
described in Chapter 4 (4.2.3). Lupin cv Belara infected with isolates WHP-1 and WHP-2 were
collected from young leaves (one leaf for each) two weeks post inoculation. Total RNA was
extracted from the collected leaves individually using an RNeasy Plant Miniprep kit (Qiagen,
#74904) and quantified using a Nanodrop UV-Vis spectrophotometer (Nanodrop Technologies).
Reverse transcription of total RNA was carried out using a High-Capacity cDNA Transcription Kit
(Applied Biosystems, #4368814) (using reverse primer). Two sets of primers for RT-PCR were
designed to amplify part of the CP gene (HarMVQ3F 5’ ATGGTGTGGTGCATTGA 3’ and
HarMVQ3R 5’ TCAATGTACGCTTCAGCTGC 3’) (annealing temperature 52 °C)/ (HarMVQ4F 5’
AATGCAAAGACAGCAGTGCG 3’ and HarMVQ4R 5’ TCCAAGCCAAACAACTTAGT 3’) (annealing
temperature 55 °C). PCR was done using GoTaq® Flexi DNA Polymerase (Promega, #M8291) to
confirm infection and evaluate primer specificity and viability. All other conditions were as
described in Chapter 2.
Products of PCR were concentrated using ethanol precipitation and quantified using the
Nanodrop UV-Vis spectrophotometer. Amplicons were diluted 1×10⁻³, 1×10⁻⁴, 1×10⁻⁵, 1×10⁻⁶,
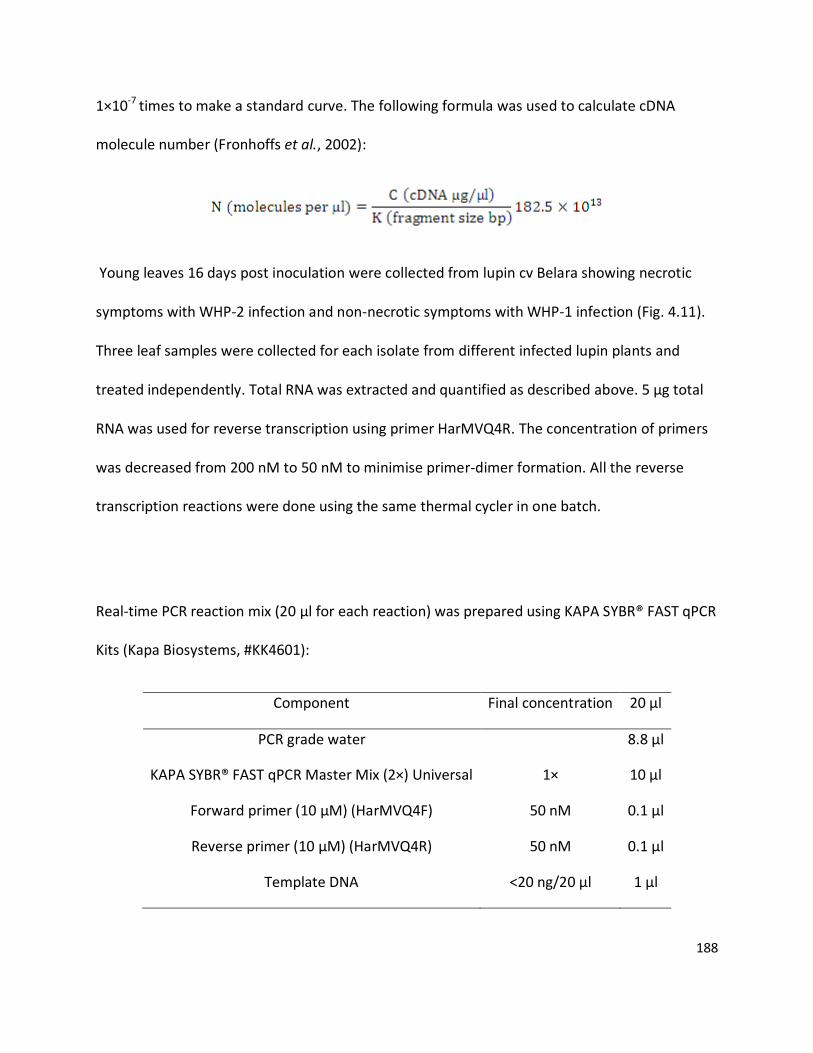
188
1×10⁻⁷ times to make a standard curve. The following formula was used to calculate cDNA
molecule number (Fronhoffs et al., 2002):
Young leaves 16 days post inoculation were collected from lupin cv Belara showing necrotic
symptoms with WHP-2 infection and non-necrotic symptoms with WHP-1 infection (Fig. 4.11).
Three leaf samples were collected for each isolate from different infected lupin plants and
treated independently. Total RNA was extracted and quantified as described above. 5 µg total
RNA was used for reverse transcription using primer HarMVQ4R. The concentration of primers
was decreased from 200 nM to 50 nM to minimise primer-dimer formation. All the reverse
transcription reactions were done using the same thermal cycler in one batch.
Real-time PCR reaction mix (20 µl for each reaction) was prepared using KAPA SYBR® FAST qPCR
Kits (Kapa Biosystems, #KK4601):
Component Final concentration 20 µl
PCR grade water 8.8 µl
KAPA SYBR® FAST qPCR Master Mix (2×) Universal 1× 10 µl
Forward primer (10 µM) (HarMVQ4F) 50 nM 0.1 µl
Reverse primer (10 µM) (HarMVQ4R) 50 nM 0.1 µl
Template DNA <20 ng/20 µl 1 µl

189
The thermal cycler used for real-time PCR reaction was Rotor-Gene Q (QIAGEN, # 9001580)
with the thermocycling set as follows:
Step Temperature Time Cycles
Enzyme activation 95 °C 2 min 1
Denaturation 95 °C 3 s 40
Annealing /Extension 55 °C 30 s
Standard dilutions 1×10⁻³, 1×10⁻⁴, 1×10⁻⁵, 1×10⁻⁶ and 1×10⁻⁷ of the RT-PCR amplicon (primers
used were HarMVQ4F and HarMVQ4R) were run with cDNA samples in the Rotor-Gene Q real
time thermal cycler simultaneously, all of which were done in triplicate. Healthy lupin leaves
were used as control. The threshold for quantification analysis was set to ‘Auto-Find’.
5.2.2 Quantification of HarMV from wild H. comptoniana leaves showing symptom
variation
Isolate WHP-2 was collected from a wild H. comptoniana plant located on Wireless Hill,
Booragoon, Perth City (Fig. 5.1). Four groups (A, B, C, D) of leaf samples (three leaves with
similar symptoms and leaf age for each group) with different symptoms from this plant were
collected (Fig. 5.2) and extracted for total RNA. Three leaves in each group were extracted for
RNA individually and then quantified using a Nanodrop UV-Vis spectrophotometer. RT-PCR was

190
carried out as described to evaluate the viability of the primers in H. comptoniana (using
HarMVQ4R for reverse transcription and HarMVQ4F/ HarMVQ4R for PCR).
For real-time RT-PCR, 2 µg total RNA was reverse transcribed using primer HarMVQ4R. All
reverse transcription reactions were done using the same thermal cycler in one batch. cDNA
standards, reaction mix preparation and cycler setting used were as described before (5.2.1).
Figure 5.2 Symptoms of leaves of Hardenbergia mosaic virus (HarMV) isolate WHP-2 infected wild Hardenbergia comptoniana. Leaves showed (A) distortion and severe mosaic; (B) severe chlorosis; (C) severe leaf curling and vein clearance; (D) mild mosaic. All the leaves were collected from one infected plant. A, B, C are younger leaves while D are mature leaves (three leaves for each group).
5.2.3 Quantification of CMV/HarMV in leaf tissues of single/double infected N.
benthamiana plant
The leaves (10-20) of M. truncatula infected with CMV (Q strain) (subgroup II) obtained from
the Department of Agriculture and Food Western Australia were collected and inoculated to
191
three N. benthamiana seedlings. The leaves (10-20) from a wild H. comptoniana plant naturally
infected with HarMV isolate MU-4 (Chapter 4) on the Murdoch campus were collected and
inoculated to three N. benthamiana seedlings. Both viruses were also inoculated to three N.
benthamiana seedlings simultaneously. All the inoculations were done in an insect-proofed
glasshouse (temperature 20 °C). Two pots of N. benthamiana seedlings were not inoculated for
control. The symptoms were recorded 4 weeks post inoculation.
One leaf was collected from each plant and total RNA was extracted. Primers to amplify part of
the CMV subgroup II CP gene were designed by Integrated DNA Technologies online software
(CMVQF 5’ TTCGCGTCTTAGTGTGCCTATGGA 3’ and CMVQR 5’ ATCTGCTGAGTCAAAGCACGCAAC
3’) (annealing temperature 55 °C). RT-PCRs were done to confirm infection and evaluate primer
specificity and viability using primer pairs CMVQF/ CMVQR and HarMVQ4F/ HarMVQ4R. RT-PCR
product was concentrated using ethanol precipitation and quantified using a Nanodrop UV-Vis
spectrophotometer. The concentrated product was diluted 1×10⁻³, 1×10⁻⁴, 1×10⁻⁵, 1×10⁻⁶, 1×10⁻⁷
times to make the standard stock for CMV real-time PCR assay.
Young and symptomatic leaf samples (one leaf from each plant) from all infected plants were
collected 1, 2, 3, 4 weeks post inoculation, and total RNA extracted within 2 hours of harvest.
All RNA samples were stored at -80 °C. At week 5, RNA samples were quantified using a
Nanodrop UV-Vis spectrophotometer and for each sample 1 µg total RNA was used to do
192
reverse transcription, using CMVQR or HarMVQ4R. All the reactions were done using the same
thermal cycler in one batch. In real-time PCR primer pairs HarMVQ4F/ HarMVQ4R were used to
amplify HarMV sequence and CMVQF/ CMVQR were used to amplify CMV sequence. HarMV
real-time PCR standards made in 5.2.1 were used as standards. Reaction mix and cycler setting
were as described before (5.2.1).

193
5.3 Results
5.3.1 Quantitation of necrotic and non-necrotic isolates of HarMV in lupin
Necrotic (N) and non-necrotic (NN) symptoms were induced by HarMV isolates WHP-1 and
WHP-2 (Fig. 4.11 and Table 4.1). An RT-PCR assay indicated that primers HarMVQ4F/
HarMVQ4R amplified the target sequence (92 bp) of both WHP-1 and WHP-2 isolates much
more efficiently than primers HarMVQ3F/ HarMVQ3R (target sequence 170 bp) (Fig. 5.3).
Therefore, primers HarMVQ4F/ HarMVQ4R were selected for use in subsequent real-time PCR
assays. The amplicons were sequenced to confirm that they originated from HarMV.
Figure 5.3 2% agarose gel electrophoresis of RT-PCR products. Lane M: 100 bp DNA Ladder (Axygen, #M-DNA-100bp); Lane1: WHP-1 using primer HarMVQ3F/ HarMVQ3R; Lane 2: WHP-2 using primer HarMVQ3F/ HarMVQ3R; Lane 3: water control using primer HarMVQ3F/ HarMVQ3R; Lane 4: WHP-1 using primer HarMVQ4F/ HarMVQ4R; Lane 5: WHP-2 using primer HarMVQ4F/ HarMVQ4R; Lane 6: water control using primer HarMVQ4F/ HarMVQ4R.
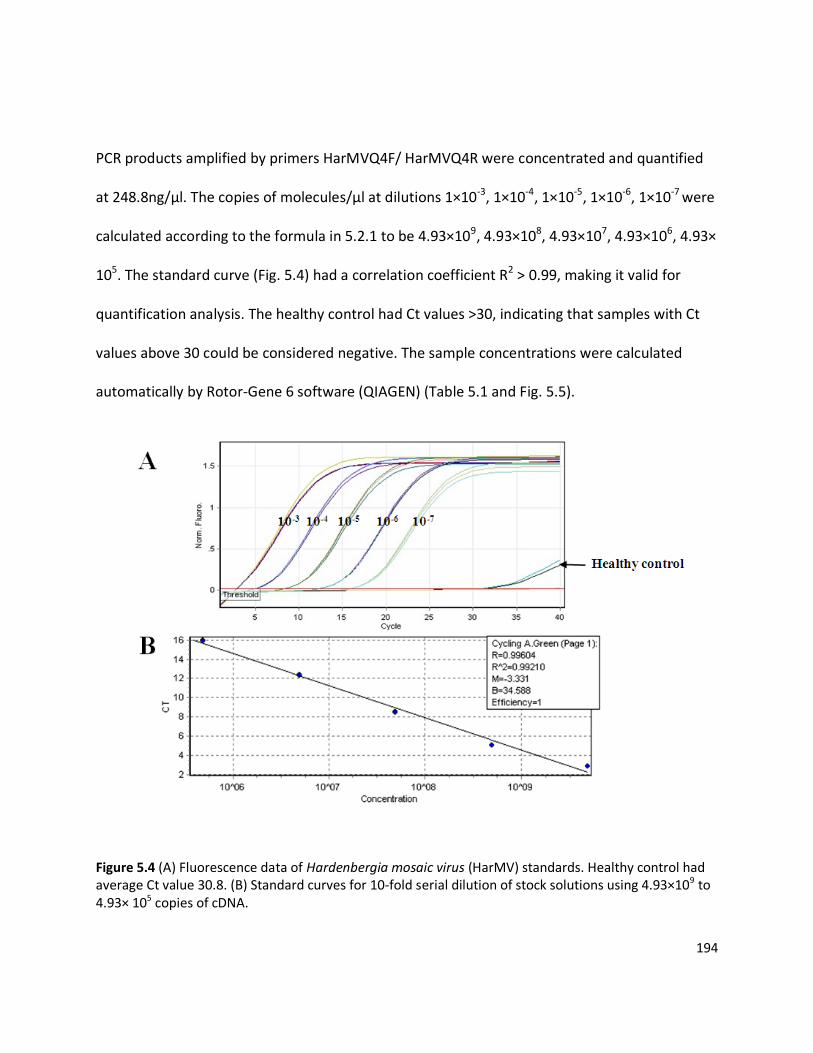
194
PCR products amplified by primers HarMVQ4F/ HarMVQ4R were concentrated and quantified
at 248.8ng/µl. The copies of molecules/µl at dilutions 1×10⁻³, 1×10⁻⁴, 1×10⁻⁵, 1×10⁻⁶, 1×10⁻⁷ were
calculated according to the formula in 5.2.1 to be 4.93×10⁹, 4.93×10⁸, 4.93×10⁷, 4.93×10⁶, 4.93×
105. The standard curve (Fig. 5.4) had a correlation coefficient R2 > 0.99, making it valid for
quantification analysis. The healthy control had Ct values >30, indicating that samples with Ct
values above 30 could be considered negative. The sample concentrations were calculated
automatically by Rotor-Gene 6 software (QIAGEN) (Table 5.1 and Fig. 5.5).
Figure 5.4 (A) Fluorescence data of Hardenbergia mosaic virus (HarMV) standards. Healthy control had average Ct value 30.8. (B) Standard curves for 10-fold serial dilution of stock solutions using 4.93×10⁹ to 4.93× 10⁵ copies of cDNA.
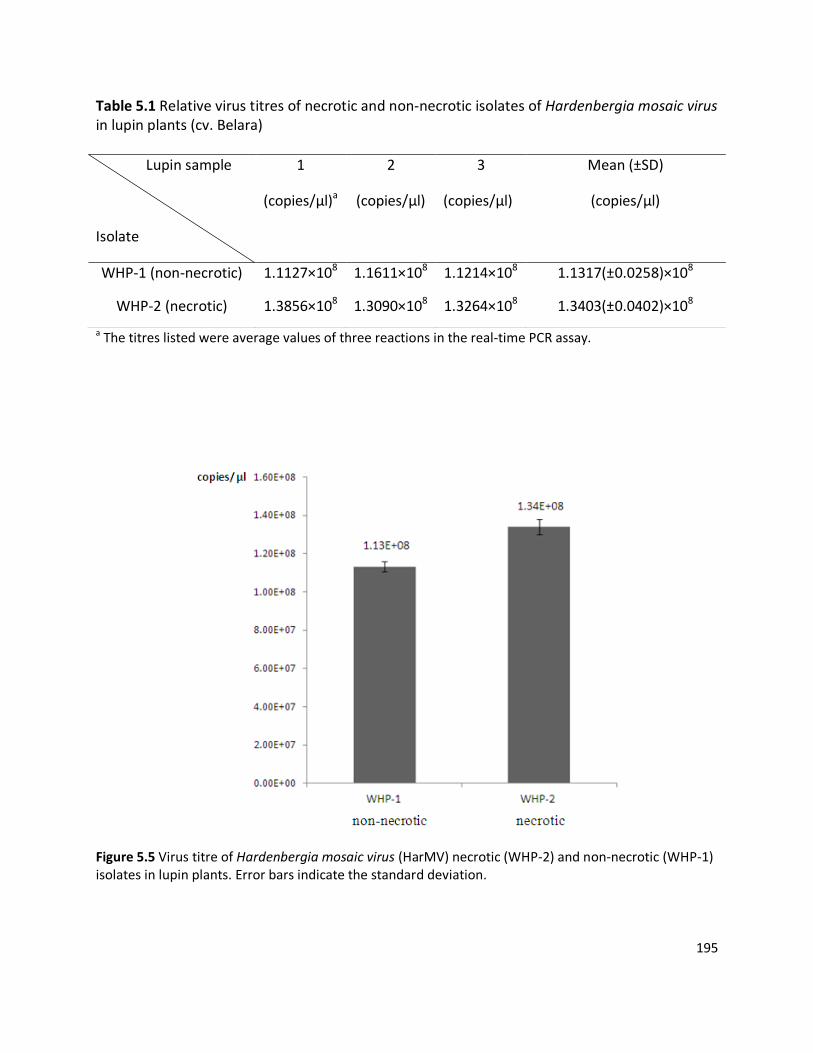
195
Table 5.1 Relative virus titres of necrotic and non-necrotic isolates of Hardenbergia mosaic virus in lupin plants (cv. Belara)
a The titres listed were average values of three reactions in the real-time PCR assay.
Figure 5.5 Virus titre of Hardenbergia mosaic virus (HarMV) necrotic (WHP-2) and non-necrotic (WHP-1) isolates in lupin plants. Error bars indicate the standard deviation.
Lupin sample
Isolate
1
(copies/µl)a
2
(copies/µl)
3
(copies/µl)
Mean (±SD)
(copies/µl)
WHP-1 (non-necrotic) 1.1127×10⁸ 1.1611×10⁸ 1.1214×10⁸ 1.1317(±0.0258)×108
WHP-2 (necrotic) 1.3856×10⁸ 1.3090×10⁸ 1.3264×10⁸ 1.3403(±0.0402)×108
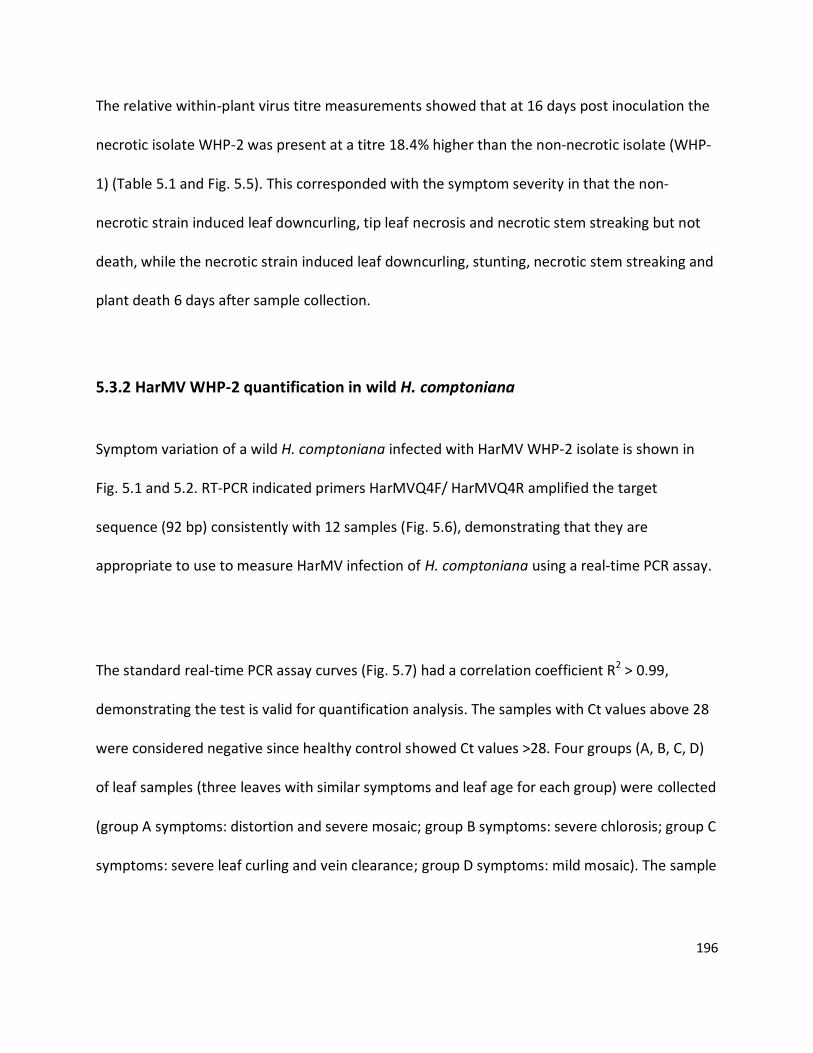
196
The relative within-plant virus titre measurements showed that at 16 days post inoculation the
necrotic isolate WHP-2 was present at a titre 18.4% higher than the non-necrotic isolate (WHP-
1) (Table 5.1 and Fig. 5.5). This corresponded with the symptom severity in that the non-
necrotic strain induced leaf downcurling, tip leaf necrosis and necrotic stem streaking but not
death, while the necrotic strain induced leaf downcurling, stunting, necrotic stem streaking and
plant death 6 days after sample collection.
5.3.2 HarMV WHP-2 quantification in wild H. comptoniana
Symptom variation of a wild H. comptoniana infected with HarMV WHP-2 isolate is shown in
Fig. 5.1 and 5.2. RT-PCR indicated primers HarMVQ4F/ HarMVQ4R amplified the target
sequence (92 bp) consistently with 12 samples (Fig. 5.6), demonstrating that they are
appropriate to use to measure HarMV infection of H. comptoniana using a real-time PCR assay.
The standard real-time PCR assay curves (Fig. 5.7) had a correlation coefficient R2 > 0.99,
demonstrating the test is valid for quantification analysis. The samples with Ct values above 28
were considered negative since healthy control showed Ct values >28. Four groups (A, B, C, D)
of leaf samples (three leaves with similar symptoms and leaf age for each group) were collected
(group A symptoms: distortion and severe mosaic; group B symptoms: severe chlorosis; group C
symptoms: severe leaf curling and vein clearance; group D symptoms: mild mosaic). The sample

197
concentrations were calculated automatically by Rotor-Gene 6 software (QIAGEN) (Table 5.2
and Fig. 5.8).
Figure 5.6 1.5% agarose gel electrophoresis of RT-PCR products of Hardenbergia mosaic virus (HarMV) infected Hardenbergia comptoniana. Lane M: 100 bp DNA Ladder (Axygen, #M-DNA-100 bp); Lane 1 to 12: amplicons of part of HarMV CP gene (length 92 bp); Lane 13: water control using primers HarMVQ4F/ HarMVQ4R.

198
Figure 5.7 Fluorescence data of Hardenbergia mosaic virus (HarMV) standards. Healthy control had average Ct values 28.8. (B) Standard curves for 10-fold serial dilution of stock solutions using 4.93×10⁹ to 4.93× 10⁵ copies of cDNA.
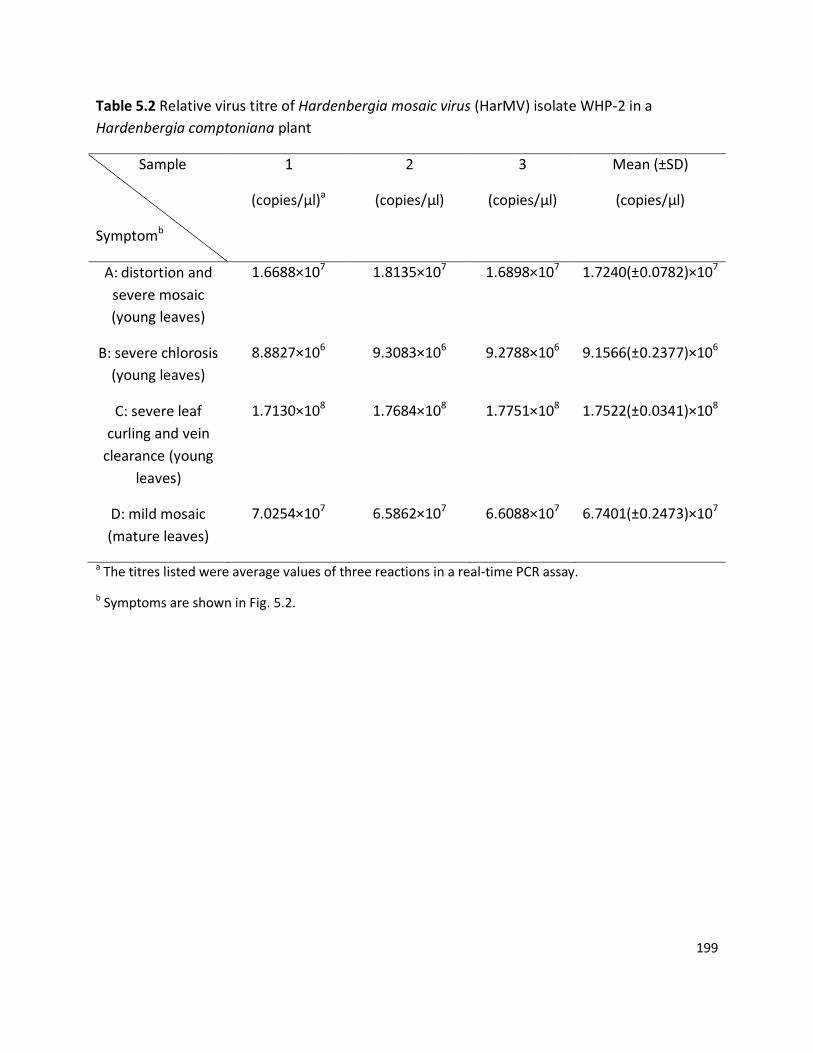
199
Table 5.2 Relative virus titre of Hardenbergia mosaic virus (HarMV) isolate WHP-2 in a
Hardenbergia comptoniana plant
Sample
Symptomb
1
(copies/µl)a
2
(copies/µl)
3
(copies/µl)
Mean (±SD)
(copies/µl)
A: distortion and
severe mosaic
(young leaves)
1.6688×10⁷ 1.8135×10⁷ 1.6898×10⁷ 1.7240(±0.0782)×107
B: severe chlorosis
(young leaves)
8.8827×10⁶ 9.3083×10⁶ 9.2788×10⁶ 9.1566(±0.2377)×106
C: severe leaf
curling and vein
clearance (young
leaves)
1.7130×10⁸ 1.7684×10⁸ 1.7751×10⁸ 1.7522(±0.0341)×108
D: mild mosaic
(mature leaves)
7.0254×10⁷ 6.5862×10⁷ 6.6088×10⁷ 6.7401(±0.2473)×107
a The titres listed were average values of three reactions in a real-time PCR assay.
b Symptoms are shown in Fig. 5.2.

200
Figure 5.8 Virus titre of Hardenbergia mosaic virus (HarMV) isolate WHP-2 in wild Hardenbergia comptoniana plant. Symptoms of A leaves: distortion and severe mosaic (young leaves); Symptoms of B leaves: severe chlorosis (young leaves); Symptoms of C leaves: severe leaf curling and vein clearance (young leaves); Symptoms of D leaves: mild mosaic (mature leaves) (Fig. 5.2). All four groups of leaves
were collected from different branches of one Hardenbergia comptoniana plant. Three biological replicates were used by testing three different leaves for each leaf group. The concentration above the bars showed the mean value of three biological replicates of each leaf group. The variations between three biological replicates were shown in Table 5.2.
The quantification analysis indicated that the wild H. comptoniana infected with HarMV WHP-2
not only showed variable symptoms but also harboured different virus titres in different leaves
of the plant. Leaves of sample group D (three leaves tested) showed much less severe distortion
and mosaic than did leaf group A and B (three leaves tested for each), but contained a 3.9-fold
virus greater accumulation of virus than did leaves A, and a 7.4-fold greater virus accumulation
compared to leaves B. Leaves C had different symptoms of severe leaf curling and vein clearing,
not comparable to mosaic symptoms in terms of severity (Fig. 5.2). They contained the highest
201
virus titre of the four leaf groups, about 10.2-fold more than in leaves A, 19.1-fold more than in
leaves B, and 2.6-fold more than in leaves D. The conclusion is that this wild H. comptoniana
infected with HarMV WHP-2 showed diverse symptoms and within-plant titres in the leaves,
and that virus titre and leaf symptoms were not directly correlated, with the highest titre being
more than 19 times that of the lowest.
5.3.3 CMV/ HarMV quantification in single/ double infected N. benthamiana
CMV/ HarMV mixed infection of N. benthamiana plants strongly enhanced some viral
symptoms, such as chlorosis, and induced new symptoms that differed from single infection,
such as severe yellowing and stunting (Fig. 5.9).
The results of RT-PCR using primers CMVQF/ CMVQR and HarMVQ4F/ HarMVQ4R indicated
that all of the nine N. benthamiana plants tested were infected with both viruses and these two
primer sets were able to amplify efficiently both CMV and HarMV target viral sequences in N.
benthamiana plants (Fig. 5.10). Concentrated CMV PCR product was quantified using the
Nanodrop UV-Vis spectrophotometer to be 83.5 ng/µl. The numbers of molecules in dilutions
1×10⁻³, 1×10⁻⁴, 1×10⁻⁵, 1×10⁻⁶, 1×10⁻⁷ were calculated according to the formula in 5.2.1 to be
1.13×10⁹, 1.13×10⁸, 1.13×10⁷, 1.13×10⁶, 1.13× 10⁵ (copies/µl).
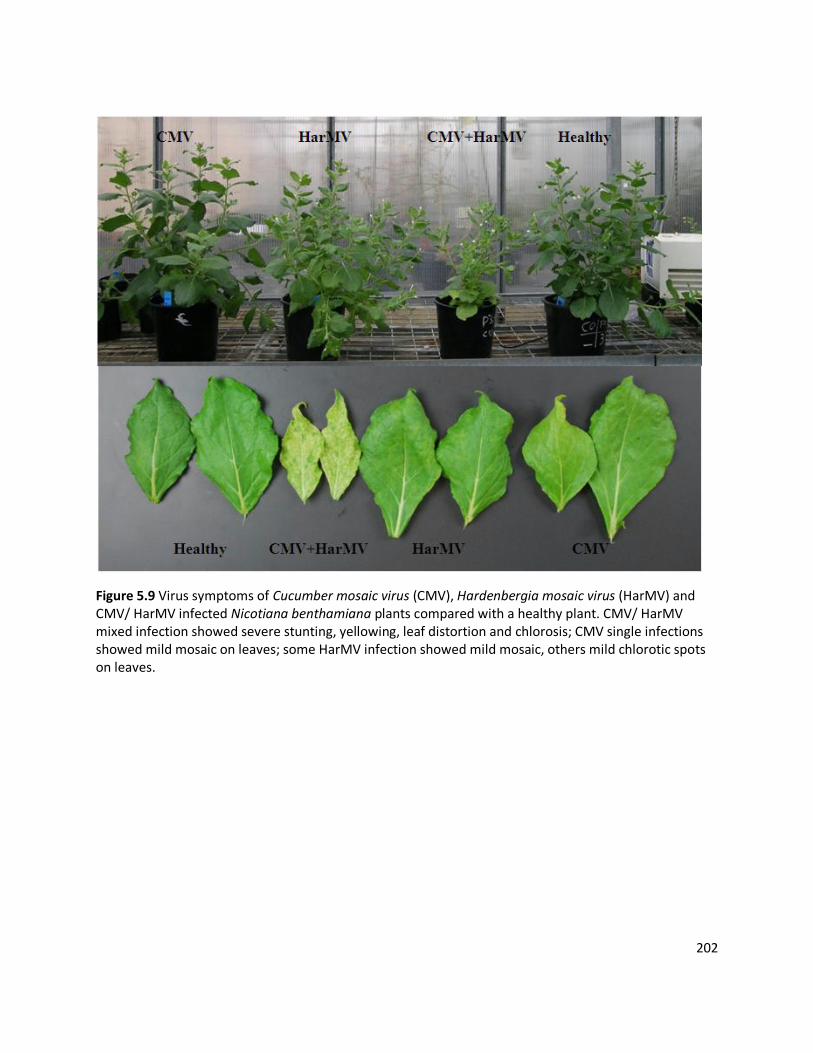
202
Figure 5.9 Virus symptoms of Cucumber mosaic virus (CMV), Hardenbergia mosaic virus (HarMV) and CMV/ HarMV infected Nicotiana benthamiana plants compared with a healthy plant. CMV/ HarMV mixed infection showed severe stunting, yellowing, leaf distortion and chlorosis; CMV single infections showed mild mosaic on leaves; some HarMV infection showed mild mosaic, others mild chlorotic spots on leaves.

203
Figure 5.10 2% agarose gel electrophoresis of RT-PCR products of Cucumber mosaic virus (CMV) and Hardenbergia mosaic virus (HarMV) infected Nicotiana benthamiana plant. Lane M: 100 bp DNA Ladder (Axygen, #M-DNA-100bp); Lane 1 to 3: CMV infected N. benthamiana using primers CMVQF/ CMVQR (length 135 bp); Lane 4 to 6: CMV/ HarMV infected N. benthamiana using primers CMVQF/ CMVQR (length 135 bp); Lane 7: healthy N. benthamiana using primers CMVQF/ CMVQR as negative control; Lane 8 to 10: HarMV infected N. benthamiana using primers HarMVQ4F/ HarMVQ4R (length 92 bp); Lane 11 to 13 CMV/ HarMV infected N. benthamiana using primers HarMVQ4F/ HarMVQ4R (length 92 bp); Lane 14: healthy N. benthamiana using primers HarMVQ4F/ HarMVQ4R as negative control.
The standard curves for both CMV and HarMV real-time assays had a correlation coefficient
R2 > 0.99 (Fig. 5.11), making them valid for quantification analysis. For the CMV real-time assay
the samples with Ct values above 28 were considered negative since healthy controls showed
Ct values >28. For the HarMV real-time assay the samples with Ct values above 36 were
considered negative since healthy control showed Ct values >36. The sample concentrations
were calculated automatically by Rotor-Gene 6 software (QIAGEN) (Table 5.3 and Fig. 5.12).
Three biological replicates were applied by testing three N. benthamiana plants infected with
CMV, three N. benthamiana plants infected with HarMV and three N. benthamiana plants
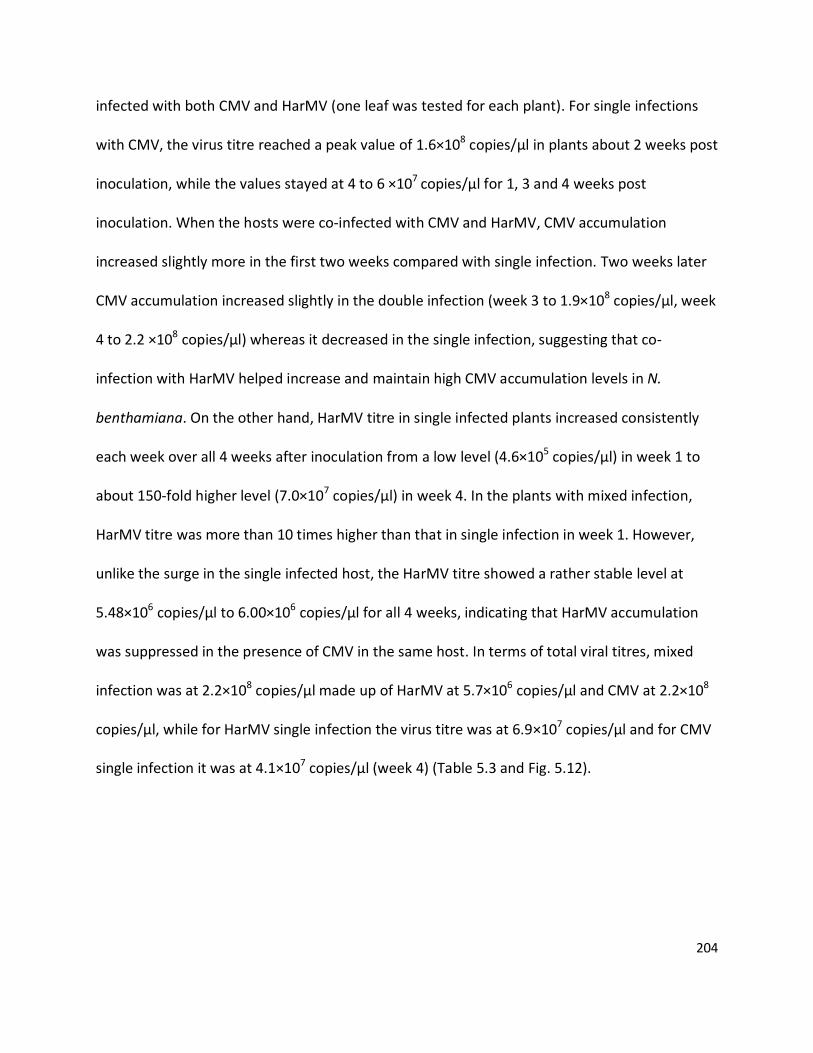
204
infected with both CMV and HarMV (one leaf was tested for each plant). For single infections
with CMV, the virus titre reached a peak value of 1.6×10⁸ copies/µl in plants about 2 weeks post
inoculation, while the values stayed at 4 to 6 ×10⁷ copies/µl for 1, 3 and 4 weeks post
inoculation. When the hosts were co-infected with CMV and HarMV, CMV accumulation
increased slightly more in the first two weeks compared with single infection. Two weeks later
CMV accumulation increased slightly in the double infection (week 3 to 1.9×10⁸ copies/µl, week
4 to 2.2 ×10⁸ copies/µl) whereas it decreased in the single infection, suggesting that co-
infection with HarMV helped increase and maintain high CMV accumulation levels in N.
benthamiana. On the other hand, HarMV titre in single infected plants increased consistently
each week over all 4 weeks after inoculation from a low level (4.6×10⁵ copies/µl) in week 1 to
about 150-fold higher level (7.0×10⁷ copies/µl) in week 4. In the plants with mixed infection,
HarMV titre was more than 10 times higher than that in single infection in week 1. However,
unlike the surge in the single infected host, the HarMV titre showed a rather stable level at
5.48×10⁶ copies/µl to 6.00×10⁶ copies/µl for all 4 weeks, indicating that HarMV accumulation
was suppressed in the presence of CMV in the same host. In terms of total viral titres, mixed
infection was at 2.2×10⁸ copies/µl made up of HarMV at 5.7×10⁶ copies/µl and CMV at 2.2×10⁸
copies/µl, while for HarMV single infection the virus titre was at 6.9×10⁷ copies/µl and for CMV
single infection it was at 4.1×10⁷ copies/µl (week 4) (Table 5.3 and Fig. 5.12).

205
Figure 5.11 Fluorescence spectra and standard curves of Cucumber mosaic virus (CMV) (A) and Hardenbergia mosaic virus (HarMV) (B) real-time assays. For CMV assay healthy control had an average Ct value of 36.5 and for HarMV the value was 28.5.

206
Table 5.3 Cucumber mosaic virus (CMV) and Hardenbergia mosaic virus (HarMV) with-in plant titres in single and double infected Nicotiana benthamiana
Plantb
Infection
1
(copies/µl)a
2
(copies/µl)
3
(copies/µl)
Mean (±SD)
(copies/µl)
CMV
(single
infection)
Week 1 5.7669×10⁷ 5.8898×10⁷ 5.6088×10⁷ 5.7552(±0.1407)×107
Week 2 1.6063×10⁸ 1.7237×10⁸ 1.5725×10⁸ 1.6342(±0.0794)×108
Week 3 6.1825×10⁷ 5.8378×10⁷ 6.0964×10⁷ 6.0389(±0.1794)×107
Week4 4.1361×10⁷ 4.1841×10⁷ 3.8351×10⁷ 4.0518(±0.1892)×107
HarMV
(single
infection)
Week 1 4.8772×10⁵ 4.9467×10⁵ 4.0070×10⁵ 4.6103(±0.5236)×105
Week 2 1.5505×10⁷ 1.6914×10⁷ 1.4192×10⁷ 1.5537(±0.1361)×107
Week 3 3.6369×10⁷ 3.9621×10⁷ 3.9307×10⁷ 3.8432(±0.1794)×107
Week4 7.4763×10⁷ 7.0011×10⁷ 6.1984×10⁷ 6.8919(±0.6459)×107
CMV
(double
infection)
Week 1 5.9868×10⁷ 6.6256×10⁷ 6.0445×10⁷ 6.2190(±0.3533)×107
Week 2 1.8173×10⁸ 1.8656×10⁸ 1.9070×10⁸ 1.8633(±0.0449)×108
Week 3 1.9867×10⁸ 1.9619×10⁸ 1.8602×10⁸ 1.9363(±0.0670)×108
Week4 2.2088×10⁸ 2.2132×10⁸ 2.1152×10⁸ 2.1791(±0.0554)×108
HarMV
(double
infection)
Week 1 5.6958×10⁶ 6.2203×10⁶ 6.0747×10⁶ 5.9970(±0.2708)×106
Week 2 5.0700×10⁶ 5.5652×10⁶ 6.4123×10⁶ 5.6825(±0.6788)×106
Week 3 5.6750×10⁶ 5.1919×10⁶ 5.5658×10⁶ 5.4776(±0.2533)×106
Week4 5.7015×10⁶ 5.7756×10⁶ 5.5090×10⁶ 5.6620(±0.1376)×106
a The titres listed are average values of three reactions in real-time PCR assay.
207
b Three biological replicates were applied by testing three N. benthamiana plants infected with CMV, three N. benthamiana plants infected with HarMV and three N. benthamiana plants infected with both CMV and HarMV (one leaf was tested for each plant)
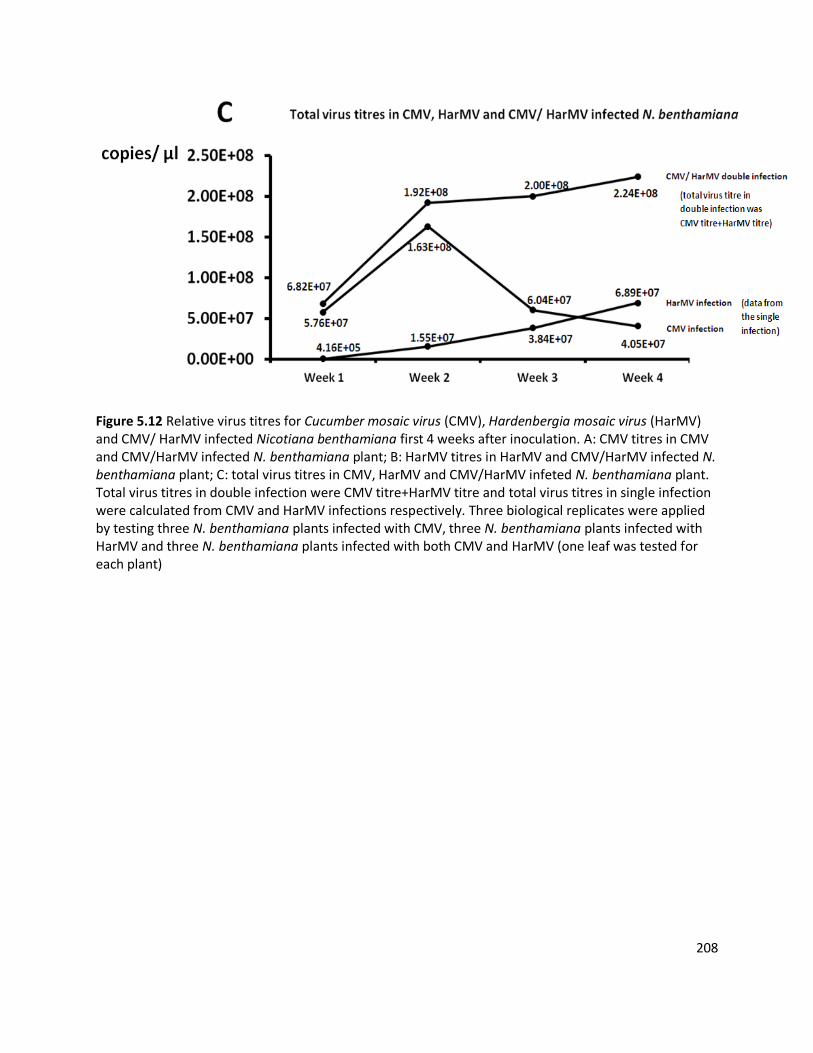
208
Figure 5.12 Relative virus titres for Cucumber mosaic virus (CMV), Hardenbergia mosaic virus (HarMV) and CMV/ HarMV infected Nicotiana benthamiana first 4 weeks after inoculation. A: CMV titres in CMV and CMV/HarMV infected N. benthamiana plant; B: HarMV titres in HarMV and CMV/HarMV infected N. benthamiana plant; C: total virus titres in CMV, HarMV and CMV/HarMV infeted N. benthamiana plant. Total virus titres in double infection were CMV titre+HarMV titre and total virus titres in single infection were calculated from CMV and HarMV infections respectively. Three biological replicates were applied by testing three N. benthamiana plants infected with CMV, three N. benthamiana plants infected with HarMV and three N. benthamiana plants infected with both CMV and HarMV (one leaf was tested for each plant)
209
5.4 Discussion
In this study real-time RT-PCR was applied to titrate HarMV (isolates WHP-1, WHP-2 and MU-4)
and CMV (subgroup II) in the host L. angustifolius, H. comptoniana and N. benthamiana. In the
quantificaiton of necrotic and non-necrotic HarMV isolates in lupin plants, three leaf samples
(one leaf for each) were collected for each isolate from different infected lupin plants and
tested independently (three biological replicates). In the quantification of HarMV from wild H.
comptoniana leaves showing symptom variation, four groups (A, B, C, D) of leaf samples (three
leaves with similar symptoms and leaf age for each group) with different symptoms from one
plant were tested (three biological replicates). In the quantification of CMV/HarMV in leaf
tissues of single/double infected N. benthamiana plant, three biological replicates were applied
by testing three N. benthamiana plants infected with CMV, three N. benthamiana plants
infected with HarMV and three N. benthamiana plants infected with both CMV and HarMV (one
leaf was tested for each plant). HarMV necrotic isolate WHP-2 was at a titre 18.4% higher than
the non-necrotic isolate (WHP-1). A H. comptoniana plant infected with HarMV isolate WHP-2
which exhibited a range of symptoms in different leaves of the same plant was found to
harbour inconsistent levels of virus titres in leaves with different symptoms, with the highest
concentration more than 19 times that of the lowest. Visible symptoms did not correlate well
with virus titres. A comparison of single infection of N. benthamiana with CMV and HarMV, and
CMV/HarMV double infection not only showed strong synergistic enhancement of symptoms,
but also had an impact on the accumulation of both viruses over time. In combination, CMV
accumulation was enhanced whilst HarMV was suppressed. The total virus levels of CMV plus

210
HarMV in double infected N. benthamiana plants was 3 to 5.5 times higher that for single
infected plants.
Real-time RT-PCR has been used to measure and compare the viral load of RNA viruses and
real-time PCR has been used for DNA viruses (Martin & Elena, 2009), based on the copy
number of target virus sequence being related to the number of viral genomes in total nucleic
acid pool. For the quantification of RNA viruses most research has been done using a one-step
RT- quantitative PCR (RT-qPCR) for absolute quantification (Mortimer-Jones et al., 2009).
However, since the RT reaction efficiency is highly reproducible when applying the same primer
to the same target RNA (Stahlberg et al., 2004). This study used real-time qPCR to quantify the
viral cDNA by doing RT using a conventional thermal cycler rather than real-time PCR thermal
cycler. T7 RNA polymerase was not required to synthesise RNA standard stocks, the latter were
established by serial dilutions of PCR products. However, a drawback of this approach is that it
is a relative quantification method, and direct comparison of the the amounts of two viruses
must be made with caution because the RT efficiency may vary from 70%-90% with different
primers (Stahlberg et al., 2004). With this in mind RT reactions for each experiment were done
using the same thermal cycler in one batch.
The differences in virus titre in single and doubly infected N. benthamiana plants with HarMV
and CMV (Fig. 5.12) were not only influenced by the other virus infection, but also by the stage

211
of infection. For example, at week 1 and week 2 CMV accumulations in the single infection and
double infection were almost at the same level (week 1 single infection at 5.76×10⁷ and double
infection at 6.22×10⁷; week 2 single infection at 1.63×10⁸ and double infection at 1.86×10⁸).
However, at week 3 CMV accumulation in single infection decreased more than 50% to
6.04×10⁷ while in double infection the CMV accumulation slightly increased to 1.94×10⁸, which
was more than three times of the CMV accumulation in single infection. Thus the measurement
of virus titre in plant hosts over a period of time provided more information on virus-host and
virus-virus interactions than quantifying virus at a single infection time point.
The lupin cv Belara infected with HarMV isolate WHP-2 (necrotic isolate) was shown to harbour
slightly higher mean virus titres than when infected with WHP-1 (non-necrotic isolate) 16 days
post inoculation, but this result does not strongly support the hypothesis that this virus induced
more severe symptoms because of the higher virus accumulation. Instead it is likely that a
gene-for-gene systemic hypersensitive reaction occurred. Such cases have been reported for
lupin plants, such as the single dominant hypersensitivity gene Nbm-1 that controls the
systemic necrotic response for L. angustifolius to infection with BYMV-N (Jones & Smith, 2005).
A presumption was that the systemic necrosis-induced virus concentration would increase to a
peak in the host and start to decrease after a certain stage. This phenomenon was observed in
many other viruses and their hosts (Mas & Pallas, 1996; Kathiria et al., 2010).. Therefore,
experimental bias was introduced when the virus was titrated only to day 16. Lupin plants
infected with the necrotic isolate died at day 22, before which the virus titre could have been
212
much higher than for non-necrotic isolate. In future studies, it is recommended that the virus
titre be measured at 5, 10, 15, 20 days post-inoculation.
Virus titre has been shown to influence transmission rates by vectors. Studies suggest a positive
correlation between the virus titer in the source leaf and the rate of transmission (Froissart et
al., 2010). For example, the transmission efficiency of BYDV in wheat by R. padi was greater
when the virus was present at a higher titre (Jimenez-Martinez & Bosque-Perez, 2004). Another
study showed that the comparison between Maize stripe virus (MStV) US isolate and the CR
isolate suggested that CR isolate of MStV multiply faster and reach higher levels in, and are
transmitted more efficiently by Peregrinus maidis (Ammar et al., 1995). Study of virus
accumulation of HarMV in H. comptoniana not only helped understand the interaction between
the virus and its wild host but also provided a perspective of assessing risk of the virus
transmitted to new introduced crops.
A wild H. comptoniana plant infected with HarMV WHP-2 showed variable symptoms and
harboured different virus titres in different parts of the plant. Leaf age could influence different
titres. Leaves A and B were old while leaves C were new growing young leaves and leaves D
were typical mature leaves (Fig. 5.2). The trend found here was that leaves C (severe leaf
curling and vein clearance) had the highest virus titre while leaves A (distortion and severe
mosaic), B (severe chlorosis) and D (mild mosaic) were lower. Severe mosaic was usually

213
observed on aged leaves but these harboured lower levels of virus. On the other hand, young
leaves mostly exhibited mild symptoms, but the virus was present at a much higher titre.
Others have found similar trends in which young leaves were more susceptible to infection and
also contained more virus particles (Fargette et al., 1987). Since young shoots were more
attractive to aphids and had a higher virus accumulation level, actively growing H. comptoniana
plants probably act as the main reservoir or source of spread of HarMV. The high titre of virus
particles in the young shoots could be a strategy for virus to spread to other plants. In addition,
actively dividing cells in young leaves tend to contain more virus particles because viruses rely
on cell multiplication machinery to reproduce. In the glasshouse experiment, the HarMV titre
was high (on average 1.2×10⁸ copies/µl) in lupin plants compared with H. comptoniana (on
average 6.7×10⁷ copies/µl), which suggested that this virus, present in new host, may replicate
to a higher level.
The interactions between CMV and potyviruses, such as enhanced virus titre and synergism in
mixed infections, have been mainly attributed to silencing suppressor activities (HC-Pro for
potyviruses and 2b for CMV) (Wege & Siegmund, 2007; Wang et al., 2009; Fukuzawa et al.,
2010). Both HC-Pro and 2b have been found to bind dsRNA to inhibit DCL (Dicer-like) processing.
Methylation of short interfering RNAs (siRNAs) by HC-Pro helps decrease their stability
(Fukuzawa et al., 2010), whereas the product of CMV gene 2b can inhibit the activity of the
Argonaute 1 protein complex to inhibit cleavage activity (Fukuzawa et al., 2010). In N.
benthamiana infected with CMV compared with doubly infected with CMV and HarMV, CMV

214
titres were higher from week 1 to week 2; at week 1 the double infection titre was 7.8% higher
and by week 2 it was 14.7% higher. However, CMV single infection titre was reduced in weeks 3
and 4 possibly because of host silencing while in the double infection CMV titre slightly
increased until it was 3.2-fold higher than in single infected plants in week 3, and 5.4-fold more
by week 4. A possibility was that CMV gene 2b worked as a suppressor of gene silencing and so
helped increase virus accumulation in the early stage of infection (week 1 and 2), while HC-Pro
was more active at later stages (weeks 3 and 4). In HarMV single and doubly infected plants,
CMV presence enhanced HarMV accumulation at the early stage (week1) (12.9-fold higher in
double infection). HaMV titre strongly increased in weeks 2, 3 and 4, possibly because HC-Pro
helped suppress host gene silencing. However, in the HarMV double infection the titres were
very stable and did not show an expected increase, which could involve virus-virus competition
in the mixed infection (Martin & Elena, 2009). Synergistic enhancement of CMV/ HarMV double
infection in the N. benthamiana plant was shown in this study. Further experiments might focus
on investigating CMV/ HarMV double infection in lupin plants. This would be important because
CMV may be considered as the most important virus disease for the lupin industry in Western
Australia, and HarMV is a native virus in the region found only recently to be transmitted to
lupins. The concern here is that CMV could multiply to a much higher titre in co-infected crops,
thereby increasing the vector transmission rate and yield loss in the region (Yates et al., 1993).
In addition, CMV is a seed-borne virus. If the coinfection of CMV and HarMV can increase CMV
titre level in lupins it may enhance seed transmission of CMV. Further research should be done
to find out whether increasing CMV virus titre could induce a higher rate of seed transmission
in lupins.

215
CHAPTER 6 GENERAL DISCUSSION

216
6.1 Overview of major outcomes
In this study, peptide mass fingerprinting (PMF), MS/MS protein sequencing, RT-PCR/
nucleotide sequencing, ELISA, real-time qPCR, and bioinformatics of next generation
sequencing data were used to detect, identify and characterise viruses infecting native and
introduced plants in Western Australia. PMF coupled with one dimensional electrophoresis
was used to detect unexpected plant viruses by their CPs and NGS was powerful in novel
viruses discovery and characterisation by full genome sequencing. Two exotic viruses,
Pelargonium zonate spot virus (PZSV) and Cycas necrotic stunt virus (CNSV), were found for the
first time in Australia and both were infecting new host plant species. Transmission of plant
viruses to new hosts is likely result in host specialisation (mutation and recombination),
regarded to be main power of virus evolution. International trade of crops and other plant
products makes the quarantine of exotic plant viruses a biosecurity concern. Surveillance of
virus transmission from their native hosts to crops, especially in some areas where agriculture
was introduced only recently, was important to protection both on crops production and native
ecology. The presumed indigenous potyvirus Hardenbergia mosaic virus (HarMV) was
transmitted from its natural host H. comptoniana to an introduced legume, L. angustifolius,
under field conditions via introduced aphid species. Interactions between viruses and plants
were studied and characterised in single- or doubly- infected plants.
In detail, the major tasks undertaken and results gained were:

217
Four protocols were used to extract proteins from infected and uninfected plant leaves,
one of which was particularly useful for distinguishing viral coat proteins (CP) from plant
proteins. This method, originally developed for extracting proteins from cotyledons, was
modified to extract proteins from mature leaves.
Viral coat proteins were visualised and isolated after one dimensional gel
electrophoresis.
Test protein (BSA) was used in experiments to optimize the method by which protein
was digested in solution by trypsin and the peptide masses determined by MS in a
prOTOF 2000 MALDI O-TOF mass spectrometer (PerkinElmer). The matrix and all the
parameters were optimised for PMF analysis. Calibration was essential before acquiring
data.
Two in-gel digestion protocols, one modified from an in-gel digestion kit and the other
modified from published protocols, were used to identify proteins of interest. Whilst the
protocol based on a commercial kit was more rapid and generated less “noise” in
spectra, the cost of the other protocol was much less.
Four known viruses were used to test the MS based diagnostic procedure: Zucchini
yellow mosaic virus (ZYMV), Turnip mosaic virus (TuMV), Alfalfa mosaic virus (AMV) and
Cucumber mosaic virus (CMV). All four viruses were identified correctly, and this result
confirms application of the assay. An unexpected virus found in an invasive coastal dune
weed Cakile maritima was identified as PZSV, and this is the first report of its presence
in Australia and in this host species.
MS/MS protein sequencing of PZSV CP peptides confirmed its identification.

218
The intact CPs of four viruses were characterised using the Voyager-DE™ PRO
Workstation to accurately measure their total masses. This approach was undertaken to
explore the possibility of identifying these viruses by detecting their intact CPs.
A pilot field study in 2009 showed that HarMV was naturally transmitted from its native
host H. comptoniana to L. angustifolius by naturally occurring aphids. A larger trial with
control plots in 2010 gave a higher infection rate and possibly a polycyclic spread
pattern. Control plants growing within insect-proof cages did not become infected with
the virus. Seeds from infected plants were free of HarMV, indicating that the virus may
not be seed-borne in L. angustifolius.
In a glasshouse-based study using manual inoculation, both necrotic and non-necrotic
symptoms were recorded when three HarMV isolates were inoculated to four lupin cvs.
WHP-2 induced systemic necrosis on lupin cvs Belara and Mandelup and non-necrotic
response on cvs Tallerack and Tanjil, resembling the interaction between BYMV isolates
to lupin cvs.
Three species of aphids: M. persicae (green peach aphid), A. kondoi (bluegreen aphid)
and R. padi (oat aphid) were collected in the field trial and were identified as possible
vectors of HarMV transmission.
Real-time qPCR was used to measure HarMV isolates WHP-1, WHP-2 and MU-4, and
CMV (Q strain) (subgroup II) in L. angustifolius, H. comptoniana and N. benthamiana
plants. Isolate WHP-2 occured at 18% higher concentration than WHP-1 in lupin cv
Belara. Virus titres differed in different H. comptoniana leaves showing a range of
symptoms and the highest was more than 19-fold greater than the lowest. In doubly
219
infected N. benthamiana plants the overall virus titre increased to a higher level than in
singly infected plants. Four weeks after inoculation with CMV/ HarMV, CMV
accumulation was enhanced while HarMV accumulation was suppressed.
A new strain of CNSV was identified after analysis of NGS data. The partial genome of
RNA1 and RNA2 was obtained. Virus was found in vegetatively propagated materials,
the bulb tissue of infected lily plants (L. longiflorum). This is the first report of this virus
in Australia and in the host L. longiflorum.
The overall aim of detecting and characterising plant viruses present in Western Australian
native flora and introduced plants, using a range of techniques, was achieved. The conclusion
that identification and characterisation of a virus, especially an unknown virus, usually requires
use of several methods, was supported.
6.2 Techniques to identify and characterise plant viruses
In plant virology, it is generally necessary to characterise new viruses using several different
techniques. ELISA is one of the most common virus identification tools, and it is favoured where
high-throughput assays of well characterised viruses are required. Although ELISA is about 1000
times less sensitive than PCR (Boben et al., 2007), it is a rapid, economical and reliable method
to identify wide range of viruses. In the lupin field trial, leaves from control plots were collected
in batches of ten to test for the presence of potyviruses by ELISA using potyvirus antibody. In

220
several batches, leaves were collected from one positive plant and nine negative plants. It was
found that ELISA could be used to detect batches containing one positive sample in a total of
ten combined samples. The availability of a potyvirus group-specific antibody facilitated
identifying HarMV. In the past, potyvirus-positive ELISA tests of lupins were considered to be
solely the result of infection by BYMV, one of the most important virus diseases of the lupin
crop. However, the field trial showed convincingly that another potyvirus, HarMV, can also
infect lupin plants, and the generic potyvirus antibody cannot be used to distinguish between
them. Symptoms of HarMV infection of lupin usually resemble those of non-necrotic BYMV
(Cheng & Jones, 2000) and in the past could well have been mistaken for it. In such a case,
antibodies specific for both species of virus are desirable for virus diagnosis in lupin crops in
Western Australia. The development of specific antiserum for HarMV would be very useful for
future surveillance of HarMV spread in native flora and crops in Western Australia. Another
solution would be screen potyviruses using the universal antibody and also run a BYMV ELISA
alongside; any potyvirus positives that are BYMV negatives could be tested by PCR for HarMV.
PCR or RT-PCR is used to detect viruses in most laboratories worldwide because of its sensitivity,
specificity and rapidity. In addition, sequencing of the PCR amplicon provides the basis for many
phylogenetic studies on the relatedness and origins of plant viruses, including those on HarMV
(e.g. Webster et al., 2007; Wylie & Jones, 2011). In this study, RT-PCR/ sequencing was used to
confirm the identity of PZSV and also to identify HarMV isolates infecting L. angustifolius and H.
comptoniana. For both the ELISA and RT-PCR/ sequencing approaches previous knowledge of
221
virus sequence or access to virus particles is required to design specific primers or to raise
specific antisera, respectively. This is clearly a major limitation when novel or unexpected
viruses are encountered.
One-dimensional electrophoresis coupled with trypsin digestion and MS analysis to identify
proteins was developed to address the need for a strategy to assay and detect plant viruses in
an unbiased and generic manner. This strategy was developed successfully to identify PZSV, a
virus which was not expected to be found in Western Australia or in the host species in which it
was found. Blouin et al. (2010) have compiled a useful overview of plant virus CP sizes for 19
families and the genera in them (Fig. 6.1). All the viruses identified in this study had coat
protein sizes within the expected mass ranges listed in this Table (ZYMV about 33 kDa/ AMV
about 23 kDa/ TuMV about 31 kDa/ CMV 25 kDa/ PZSV 25 kDa). This overview is a useful guide
for the expected sizes of virus CP which can then be confirmed by subsequent MS analysis.
However, the major limitation of the approach found in this study was that not all the hosts
tested contained a suitably high viral titre to be visualised on a protein gel under the protein
extraction conditions used. Furthermore, for confirmation of PMF of novel viruses protein
sequencing may well be required. As a result, the general approach is not high-throughput or
simple to do, but it is a significant complementary method that can be used to identify viruses
when other routine techniques have failed.

222
Moving from protein - based to nucleic acid - based detection, NGS is even more generic in
nature and does not require any information on any virus that is present in plant tissues.
Therefore NGS can be used as a universal technique for identification and characterisation of
new viruses, at least for RNA viruses. The full genome of a virus can often be generated using
NGS, and depending on the platform used, may also provide information on virus accumulation.
The sequence information obtained can then be used to design primers for subsequent routine
amplification-based assays.

223

224
Figure 6.1 An overview of the mass ranges of plant virus coat proteins by family and genus (Blouin et al., 2010). (1) indicates that coat protein masses were estimated by SDS PAGE; (2) indicates no physical data available on website www.dpvweb.net/intro/index.php so that estimates of coat protein sizes are based on sequence data; for the remainder putative coat protein data was used. Black bars indicate the mass range in a genus and the light gray indicates mass range within a family. The mass range for a minor CP or CP read-through is indicated by dark gray bars.
6.3 Infection rate and spread pattern of HarMV in field trials
In the initial field test in 2009 and the full experiment in 2010, HarMV was transmitted from its
native host under field conditions to L. angustifolius, probably by the introduced aphid species
found on the plants. However, the crop infection rate (4.7% in 2009 and 30.7% in 2010) and
virus spread pattern (monocyclic in 2009 and probably polycyclic in 2010) were different in the
two years.

225
One reason for different HarMV incidences was that the symptoms of lupin plants induced by
HarMV differed in these two trials. In the pilot experiment in 2009 lupin plants were killed
about three weeks after the necrotic stem streaking symptom became visible. In the following
year infected lupin plants showed tip leaf necrosis, stunting and necrotic stem streaking but
usually did not die, allowing infected lupin plants to act as foci of infection to other lupins. In
the initial study in 2009, L. angustifolius plants infected with HarMV died after expressing
symptoms of systemic necrosis of the N strain of BYMV. In the 2010 field experiment and the
glasshouse experiment, L. angustifolius (cv. Mandelup) infected with HarMV (isolate MU-4)
were seldom killed. The reason for these different symptoms is not obvious. One possibility is
that there were quantitative or qualitative differences which could have influenced the level of
inoculum pressure and in this way modified the symptoms. In P. vulgaris, low temperatures
(25 °C) protected plants against mechanical inoculation of potyviruses but at higher
temperatures (above 33 °C) necrotic lesions and veinal necrosis developed on inoculated leaves,
followed by systemic veinal necrosis and plant death (Fisher & Kyle, 1994). In contrast, high
ambient temperatures at the field site do not appear to be a causative factor for the observed
differences in symptoms in L. angustifolius, although individual days with high temperatures
could have been one factor. In 2009, when all infected plants died, the climatic conditions for
the July- November period were cooler (mean 20.7 °C) than they were in 2010 (mean 22.4 °C)
(Bureau of Meteorology, Australian Government). It is possible that there is a genetic basis for
the observed differences in symptoms in 2009 and 2010, although the experiment was
designed to minimise this potential. Viruses exist in genetically heterogeneous populations
within a host and the dominance of particular genotypes may fluctuate over time (Elena et al.,

226
2011). A powerful driver of plant virus evolution is infection of a new host (Wylie et al., 2008;
Wylie & Jones, 2011a). It is possible, therefore, that during the process of movement from H.
comptoniana plants to L. angustifolius plants over two growing seasons, subtly distinct virus
genotypes became dominant in the new lupin hosts and this could underlie the differential host
response. The samples may be the first of an establishment of a tissue set that determines
genetic changes of HarMV in lupin plants over time. Indeed, the observation that a few lupin
plants died after infection in the 2010 season supports the hypothesis that different viral
genotypes were being transferred between species. Although amplicons representing viral CPs
were sequenced in both years and were identical, other viral genes that have a more direct
influence on host response were not sequenced. It is also possible that an undetected virus(es)
was present and caused symptoms. For instance, a novel flexivirus, Hardenbergia virus A, has
since been described co-infecting H. comptoniana plants from the region (Wylie & Jones,
2011c), although its infectivity in lupins has not been tested. Furthermore, in the glasshouse
real-time quantitative PCR showed that HarMV titre was at a high level (>1×10⁸ copies/µl) in
lupin plants compared with H. comptoniana, which could increase transmission rate as well.
Therefore, removing plants with viral symptoms represents one of the best disease
management strategies by reducing the chance of secondary virus spread.
Another possible reason for variable incidence of this virus disease was the activity of aphids in
the two years. Although in both trials all three aphid species were observed, in 2010 the aphids,
especially green peach aphids, were in greater numbers. In areas with a Mediterranean climate,

227
like Western Australia, survival of aphid populations over the hot, dry season (November to
February) is a critical factor that influences aphid outbreaks and virus epidemics in subsequent
crops that year. In Western Australia, rainfall during late summer and early autumn (February-
April) is a determinant for high aphid numbers that year by increasing soil moisture and the
availability of green plants on which aphids build up before moving into crops (from website
http://www.agric.wa.gov.au/PC_90884.html?s=1001). The overall rainfall from February to
April in 2009 was 23.2 mm while in 2010 it was substantially greater at 79.4 mm, corresponding
to the observation that there were more aphids present in 2010, which possibly contributed to
the higher incidence of virus disease. Some aphids migrate to Western Australia on the wind
from other places in early autumn (Thackray et al., 2004). This indicates that monitoring climate
data and aphid activity can further assist in decisions on aphid control strategies for prevention
and management of aphid vectored virus diseases in crops both before and during the growing
season.
6.4 Future research
The following points address possible future research following on from this study:
The one-dimensional electrophoresis/ MS strategy to identify plant viruses can be
optimised further to detect double or multiple infections using protocols optimised to
extract a wide range of viruses that exist in plants at low titre.
228
The use of protein separation by one-dimensional electrophoresis coupled with PMF can
be tested further to investigate plant responses to virus invasion by identifying
differentially expressed plant proteins, or detect other virus protein (e.g. CI protein of
potyviruses).
Develop a high throughput assay for HarMV infection to facilitate surveillance of virus
incidence - one approach would be to produce HarMV specific antiserum for ELISA
testing, and another one would be real-time RT-PCR. ELISA or RT-PCR based methods
should be applied to survey and quantify the potential incidence of HarMV as a
pathogen in lupin crops.
There should be further testing for the presence of HarMV in other introduced
economically important legumes, such as in chickpea, faba bean, peanut and pasture
legumes (clovers, medics and vetches, etc).
There is a similar need to characterise and survey for the presence of PZSV in the Perth
area, and to assess the risk of this virus infecting crops in other regions. This might also
invoke using commercially available antibody/ ELISA methods.
There is a need to study CNSV epidemiology in Australia, including host range,
distribution and economic importance.
NGS has evolved as a very powerful new method of obtaining full genomic sequence
data in a cost effective manner, and this will undoubtedly reveal the presence of many
new virus species, both in native and crop plants.

229
Domesticated crops were cultivated at their origins with their wild relatives during the early
time of agriculture. In modern times, world trade in plant products has expanded the original
geographical range of crops and their pathogens. New encounters of plants and viruses present
a significant threat for both agricultural production and ecological diversity. An aggressive virus
that a crop has not previously encountered before could result in a new damaging disease. In
addition, native flora could be destroyed by new introduction of a virus to a new area,
systematically threatening local biodiversity. Discovery of novel and unexpected viruses in the
native flora and introduced crops all over the world and further characterise host-virus new
encounters (such as symptoms and production lost caused by new encounters, or virus seed-
borne rate in new hosts).

230
Appendix 1 Peptide mass fingerprinting (PMF) analysis of differential expression plant protein
a Bands numbered in 3.3.4 b GenBank accession codes of plant protein that most closely matched peptide mass fingerprints of the proteins tested: P23535.1 (No.9), P23535.1 (No.11), P14226.1 (No.12), CAC04296.1 (No.13), P23535.1 (No.16), AAB03844.1 (No.17).
Band number
a
Identityb Measured peptide masses
(Da)c
Predicted masses (Da)
Coverage (%)
Expectation value
d
9 endo-1,3-beta-glucosidase 990.547 990.549 24% 1.07741e-002 1202.648 1202.644 1471.781 1471.778 2638.364 2638.355 2831.318 2831303
11 endo-1,3-beta-glucosidase 990.555 990.549 24% 7.40336e-003
1202.651 1202.644 1471.787 1471.778
2638.371 2638.355
2831.325 2831.303
12 oxygen-evolving enhancer protein 1
963.588 963.579 21% 3.06693e-002
1235.660 1235.650
1292.646 1292.640
1759.890 1759.873
2269.098 2269.099
2293.143 2293.122
13 ribulose 1,5-bisphosphate carboxylase (small subunit)
774.439 774.427 22% 3.81206e-002 1020.523 1020.524 1464.745 1464.747 2395.159 2395.157
16 endo-1,3-beta-glucosidase 990.535 990.549 59% 5.18348e-010
1202.629 1202.644 1471.762 1471.778 1890.003 1890.024 2301.058 2301.109 2340.125 2340.141 2638.318 2638.355 2813.267 2813.270 2831.271 2831.303 2984.439 2984.458 3583.775 3583.809
17 cytosolic ascorbate
peroxidase 1518.728 1518.746 30% 1.81847e-002 2030.887 2030.900 2248.096 2248.126 2305.061 2305.068

231
c Measured peptide masses after calibration.
d All the searching parameters used were general parameters. According to default setting in ProFound,
expectation value< 1e-003 is highly confident identification while 1e-003<expectation value<1e-001 is marginal
match. Expectation value>1e-001 is considered to be failed search.
Appendix 2 Peptide mass fingerprinting (PMF) peaks of unidentified protein
Band numbera Peaks
b (Da)
3 568.1325 647.9856 649.9844 524.1422 506.1337 550.1226 804.2766
691.9754 2266.1655 1261.7016 693.9766 1278.6428 1845.9903 2850.4500
3542.7611 3125.5067 3109.5165 3441.6819 3526.7441
10 3489.5723 3800.9752 1793.9241 568.1344 681.9926 666.0173 2606.3529
524.1444 1929.0676 3472.5719 3832.9770 506.1342 1895.9617 550.1236
893.0176 697.9677 2089.1687 2791.4129 877.0443 1772.8078 1868.9502
650.0434 1809.9198 1830.8343 1872.9925 522.1288 2159.0985 2584.3142
3152.6518 2334.2383 2972.4060 3350.6360 3151.6415 3049.5126 3349.6331
3813.9203
14 1868.9579 1763.0461 568.1349 2089.1737 524.1451 1933.9795 550.1241
2042.9720 506.1350 1447.8688 1001.5802 522.1293 666.0176 2742.4039
1786.8234 3259.6326 2538.4471 2008.9950 2741.4035 2224.1200 3275.6295
3258.6185 2326.2071 1166.7298 2210.1133 2757.4007 3274.6342 2807.3350
2780.9370
15 568.1350 622.0533 666.0185 650.0194 524.1444 550.1249 506.1341
871.0299 887.0045 983.5036 647.9912 1082.0537 1098.0243 3092.5240
1918.0138 2146.0400 2098.9544 1964.9527 2226.1288 2781.4447 2807.3460
2780.4295 3528.7657 3514.7528 3091.4713 2788.9495 3807.8459 a Bands numbered in 3.3.3 and 3.3.4. b Measured peptide masses after calibration.
232
REFERENCES
Adams, I. P., Glover, R. H., Monger, W. A., Mumford, R., Jackeviciene, E., Navalinskiene, M., et al. (2009). Next-generation sequencing and metagenomic analysis: a universal diagnostic tool in plant virology. Molecular Plant Pathology, 10, 537-545.
Akhtar, K. P., Ahmad, M., Shah, T. M., & Atta, B. M. (2011). Transmission of Chickpea chlorotic dwarf virus in Chickpea by the Leafhopper Orosius albicinctus (Distant) in Pakistan. Plant Protection Science, 47, 1-4.
Almeida, R. P. P., Blua, M. J., Lopes, J. R. S., & Purcell, A. H. (2005). Vector transmission of Xylella fastidiosa: applying fundamental knowledge to generate disease management strategies. Annals of the Entomological Society of America, 98, 775-786.
Altschul, S. F., Madden, T. L., Schaffer, A. A., Zhang, J., Zhang, Z., Miller, W., et al. (1997). Gapped BLAST and PSI-BLAST: a new generation of protein database search programs. Nucleic Acids Research, 25, 3389-3402.
Ammar, E. D., Gingery, R. E., & Madden, L. V. (1995). Transmission efficiency of three isolates of maize stripe tenuivirus in relation to virus titre in the planthopper vector Ptant Pathotogy, 44, 239-243.
Anderson, P. K., Cunningham, A. A., Patel, N. G., Morales, F. J., Epstein, P. R., & Daszak, P. (2004). Emerging infectious diseases of plants: pathogen pollution, climate change and agrotechnology drivers. Trends in Ecology & Evolution, 19, 535-544.
Balme-Sinibaldi, V., Tribodet, M., Croizat, F., Lefeuvre, P., Kerlan, C., & Jacquot, E. (2006). Improvement of Potato virus Y (PVY) detection and quantitation using PVY(N)- and PVY(O)-specific real-time RT-PCR assays. Journal of Virological Methods, 134, 261-266.
Bertolini, E., Olmos, A., Martinez, M. C., Gorris, M. T., & Cambra, M. (2001). Single-step multiplex RT-PCR for simultaneous and colourimetric detection of six RNA viruses in olive trees. Journal of Virological Methods, 96, 33-41.
Blouin, A. G., Greenwood, D. R., Chavan, R. R., Pearson, M. N., Clover, G. R. G., MacDiarmid, R. M., et al. (2010). A generic method to identify plant viruses by high-resolution tandem mass spectrometry of their coat proteins. Journal of Virological Methods, 163, 49-56.
Boben, J., Kramberger, P., Petrovic, N., Cankar, K., Peterka, M., Strancar, A., et al. (2007). Detection and quantification of Tomato mosaic virus in irrigation waters. European Journal of Plant Pathology, 118, 59-71.
Bol, J. F., Linthorst, H. J. M., & Cornelissen, B. J. C. (1990). Plant pathogenesis-related proteins induced by virus infection. Annual Review of Phytopathology, 28, 113-138.
Boonham, N., Smith, P., Walsh, K., Tame, J., Morris, J., Spence, N., et al. (2002). The detection of Tomato spotted wilt virus (TSWV) in individual thrips using real time fluorescent RT-PCR. Journal of Virological Methods, 101, 37-48.
Boonham, N., Tomlinson, J., & Mumford, R. (2007). Microarrays for rapid identification of plant viruses. Annual Review of Phytopathology, 45, 307-328.
Boonham, N., Walsh, K., Smith, P., Madagan, K., Graham, I., & Barker, I. (2003). Detection of potato viruses using microarray technology: towards a generic method for plant viral disease diagnosis. Journal of Virological Methods, 108, 181-187.
Bradley, R. H. E., & Ganong, R. Y. (1955). Evidence that potato virus Y is carried near the tip of the stylets of the aphid vector Myzus persicae (sulz.). Canadian Journal of Microbiology, 1, 775-782.
Briddon, R. W., & Markham, P. G. (2000). Cotton leaf curl virus disease. Virus Research, 71, 151-159.

233
Bringans, S., Eriksen, S., Kendrick, T., Gopalakrishnakone, P., Livk, A., Lock, R., et al. (2008). Proteomic analysis of the venom of Heterometrus longimanus (Asian black scorpion). Proteomics, 8, 1081-1096.
Brizard, J. P., Carapito, C., Delalande, F., Van Dorsselaer, A., & Brugidou, C. (2006). Proteome analysis of plant-virus interactome: comprehensive data for virus multiplication inside their hosts. Molecular & Cellular Proteomics, 5, 2279-2297.
Brooks, T. M., Mittermeier, R. A., Mittermeier, C. G., da Fonseca, G. A. B., Rylands, A. B., Konstant, W. R., et al. (2002). Habitat loss and extinction in the hotspots of biodiversity. Conservation Biology, 16, 909-923.
Brown, D. J., Robertson, W. M., & Trudgill, D. L. (1995). Transmission of viruses by plant nematodes. Annual Review of Phytopathology, 33, 223-249.
Bystricka, D., Lenz, O., Mraz, I., Piherova, L., Kmoch, S., & Sip, M. (2005). Oligonucleotide-based microarray: a new improvement in microarray detection of plant viruses. Journal of Virological Methods, 128, 176-182.
Cadman, C. H. (1963). Biology of soilborne viruses. Annual Review of Phytopathology, 1, 143-172. Cafrune, E. E., Balzarini, M., & Conci, V. C. (2006). Changes in the Concentration of an Allexivirus During
the Crop Cycle of Two Garlic Cultivars. Plant Disease, 90, 1293-1296. Call, D. R. (2005). Challenges and opportunities for pathogen detection using DNA microarrays. Critical
reviews in microbiology, 31, 91-99. Call, D. R., Borucki, M. K., & Loge, F. J. (2003). Detection of bacterial pathogens in environmental
samples using DNA microarrays. Journal of Microbiological Methods, 53, 235-243. Carstens, E. B. (2009). Ratification vote on taxonomic proposals to the International Committee on
Taxonomy of Viruses (2009). Archives of Virology, 155, 133-146. Castle, S. J., Perring, T. M., Farrar, C. A., & Kishaba, A. N. (1992). Field and laboratory transmission of
watermelon mosaic virus 2 and zucchini yellow mosaic virus by various aphid species. Phytopathology, 82, 235-240.
Chasan, R. (1995). Geminiviruses: A twin approach to replication. The Plant Cell, 7, 659-661. Cheng, Y., & Jones, R. A. C. (2000). Biological properties of necrotic and non-necrotic strains of bean
yellow mosaic virus in cool season grain legumes. Annals of Applied Biology, 136, 215-227. Clark, M. F., & Adams, A. N. (1977). Characteristics of the microplate method of enzyme-linked
immunosorbent assay for the detection of plant viruses. Journal of General Virology, 34, 475-483.
Coates, D. J., & Dixon, K. W. (2007). Current perspectives in plant conservation biology. Australian Journal of Botany, 55, 187-193.
Cooper, B., Eckert, D., Andon, N. L., Yates, J. R., & Haynes, P. A. (2003). Investigative proteomics: identification of an unknown plant virus from infected plants using mass spectrometry. Journal of the American Society for Mass Spectrometry 14, 736-741.
Cooper, I., & Jones, R. A. C. (2006). Wild plants and viruses: under-investigated ecosystems. Advances in Virus Research, 67, 1-47.
Cox-Foster, D. L., Conlan, S., Holmes, E. C., Palacios, G., Evans, J. D., Moran, N. A., et al. (2007). A metagenomic survey of microbes in honey bee colony collapse disorder. Science, 318, 283-287.
Cox, P. M., Betts, R. A., Jones, C. D., Spall, S. A., & Totterdell, I. J. (2000). Acceleration of global warming due to carbon-cycle feedbacks in a coupled climate model. Nature, 408, 184-187.
Decraemer, W., & Robbins, R. T. (2007). The who, what and where of Longidoridae and Trichodoridae. Journal of Nematology, 39, 295-297.

234
Di Carli, M., Villani, M. E., Bianco, L., Lombardi, R., Perrotta, G., Benvenuto, E., et al. (2010). Proteomic analysis of the plant-virus interaction in cucumber mosaic virus (CMV) resistant transgenic tomato. Journal of Proteome Research, 9, 5684-5697.
Diaz-Pendon, J. A., Li, F., Li, W. X., & Ding, S. W. (2007). Suppression of antiviral silencing by cucumber mosaic virus 2b protein in Arabidopsis is associated with drastically reduced accumulation of three classes of viral small interfering RNAs. The Plant Cell, 19, 2053-2063.
Dijkstra, J., & de Jager, C. P. (1998). Practical plant virology: protocols and exercises: Springer-Verlag GmbH.
Dodds, J. A. (1993). DsRNA in diagnosis. In R. E. F. Matthews (Ed.), Diagnosis of Plant Virus Diseases (pp. 273-293). Boca Raton, FL: CRC Press.
Drummond, A. J., Ashton, B., Cheung, M., Heled, J., Kearse, M., Moir, R., et al. (2010). Geneious (Version 4.8).
Elena, S. F., Bedhomme, S., Carrasco, P., Cuevas, J. M., de la Iglesia, F., Lafforgue, G., et al. (2011). The evolutionary genetics of emerging plant RNA viruses. Molecular Plant-Microbe Interactions, 24, 287-293.
Escriu, F., Cambra, M. A., & Luis-Arteaga, M. (2009). First Report of Pepper as a Natural Host for Pelargonium zonate spot virus in Spain. Plant Disease, 93, 1346.
Eun, A. J., Seoh, M., & Wong, S. (2000). Simultaneous quantitation of two orchid viruses by the TaqMan real-time RT-PCR. Journal of Virological Methods, 87, 151-160.
Fargette, D., Thouvenel, J.-C., & Fauquet, C. (1987). Virus content of leaves of cassava infected by African cassava mosaic virus. Annals of Applied Biology, 110, 65-73.
Fauquet, C., Mayo, M., Maniloff, J., Desselberger, U., & Ball, L. A. (2005). Virus taxonomy: Eighth Report of the International Committee on Taxonomy of Viruses: Elsevier.
Feng, J., Wang, K., Liu, X., Chen, S., & Chen, J. (2009). The quantification of tomato microRNAs response to viral infection by stem-loop real-time RT-PCR. Gene, 437, 14-21.
Finetti-Sialer, M., & Gallitelli, D. (2003). Complete nucleotide sequence of Pelargonium zonate spot virus and its relationship with the family Bromoviridae. Journal of General Virology, 84, 3143-3151.
Fisher, M. L., & Kyle, M. M. (1994). Inheritance of resistance to potyviruses in Phaseolus vulgaris L. III. Cosegregation of phenotypically similar dominant responses to nine potyviruses Theoretical and Applied Genetics, 89, 818-823.
Fondong, V. N., Pita, J. S., Rey, M. E. C., de Kochko, A., Beachy, R. N., & Fauquet, C. M. (2000). Evidence of synergism between African cassava mosaic virus and a new double-recombinant geminivirus infecting cassava in Cameroon. Journal of General Virology 81, 287-297.
Francki, R. I. B., & Hatta, T. (1980). Cucumber mosaic virus-Variation and problems of identification. Acta Horticulturae, 110, 167-174.
Froissart, R., Doumayrou, J., Vuillaume, F., Alizon, S., & Michalakis, Y. (2010). The virulence-transmission trade-off in vector-borne plant viruses: a review of (non-)existing studies. Philosophical Transactions of the Royal Society B, 365, 1907-1918.
Fronhoffs, S., Totzke, G., Stier, S., Wernert, N., Rothe, M., Bruning, T., et al. (2002). A method for the rapid construction of cRNA standard curves in quantitative real-time reverse transcription polymerase chain reaction. Molecular and Cellular Probes, 16, 99-110.
Fukuzawa, N., Itchoda, N., Ishihara, T., Goto, K., Masuta, C., & Matsumura, T. (2010). HC-Pro, a potyvirus RNA silencing suppressor, cancels cycling of Cucumber mosaic virus in Nicotiana benthamiana plants. Virus Genes, 40, 440-446.
Gallitelli, D. (1982). Properties of a tomato isolate of Pelargonium zonate spot virus. Annals of Applied Biology, 100, 457-466.
235
Gallitelli, D., Finetti-Sialer, M., & Martelli, G. P. (2005). Anulavirus, a proposed new genus of plant viruses in the family Bromoviridae. Archives of Virology, 150, 407-411.
García-Cano, E., Renato, R. O., Fernández-Muñoz, R., & Moriones, E. (2006). Synergistic interaction between Tomato chlorosis virus and Tomato spotted wilt virus results in breakdown of resistance in tomato. Phytopathology, 96, 1263-1269.
Garnsey, S. M., Permar, T. A., Cambra, M., & Henderson, C. T. (1993). Direct tissue blot immunoassay (DTBIA) for detection of citrus tristeza virus (CTV). Paper presented at the 12th IOCV Conference, Riverside, California, USA.
Garrett, K. A., Dendy, S. P., Frank, E. E., Rouse, M. N., & Travers, S. E. (2006). Climate change effects on plant disease: genomes to ecosystems. Annual Review of Phytopathology, 44, 489-509.
Gergerich, R. C. (2004). Plant virus transmission. Encyclopedia of Plant and Crop Science, 1-3. Gibbs, A., & Mackenzie, A. (1997). A primer pair for amplifying part of the genome of all potyvirids by
RT-PCR. Journal of Virological Methods, 63, 9-16. Gibbs, A. J., & Guy, P. (1979). How long have there been plant viruses in Australia. Australasian Plant
Pathology, 8, 41-42. Gibbs, A. J., Mackenzie, A. M., Wei, K. J., & Gibbs, M. J. (2008). The potyviruses of Australia. Archives of
Virology, 153, 1411-1420. Gladstones, J. S. (1972). Lupins in Western Australia Bulletin of the Department of Agriculture. Western
Australia. Hammond, J., Lecoq, H., & Raccah, B. (1999). Epidemiological risks from mixed virus infections and
transgenic plants expressing viral genes. Advances in Virus Research, 54, 189-314. Han, S. S., Karasev, A. V., Ieki, H., & Iwanami, T. (2002). Nucleotide sequence and taxonomy of Cycas
necrotic stunt virus. . Archives of Virology, 147, 2207-2214. Hanada, K., Fukumoto, F., Kusunoki, M., Kameya-Iwaki, M., Tanaka, Y., & Iwanami, T. (2006). Cycas
necrotic stunt virus isolated from gladiolus plants in Japan. Journal of General Plant Pathology, 72, 383-386.
Hanssen, I. M., Lapidot, M., & Thomma, B. P. (2010). Emerging viral diseases of tomato crops. Molecular Plant-Microbe Interactions, 23, 539-548.
Harrington, R., Bale, J. S., & Tatchell, G. M. (1995). Aphids in a changing climate. In R. Harrington & N. E. Stork (Eds.), Insects in a Changing Environment (pp. 126-155): Academic Press.
Harris, T. D., Buzby, P. R., Babcock, H., Beer, E., Bowers, J., Braslavsky, I., et al. (2008). Single-molecule DNA sequencing of a viral genome. Science, 320, 106-109.
Harrison, B. D. (1960). The biology of soil-borne plant viruses. Advances in virus research, 7, 131-161. Harrison, B. D. (2002). Virus variation in relation to resistance-breaking in plants. Euphytica, 124, 181-
192. Henzel, W. J., Billeci, T. M., Stults, J. T., Wong, S. C., Grimley, C., & Watanabe, C. (1993). Identifying
proteins from two-dimensional gels by molecular mass searching of peptide fragments in protein sequence databases. Proceedings of the National Academy of Sciences, 90, 5011-5015.
Hirosawa, M., Hoshida, M., Ishikawa, M., & Tomoyuki, T. (1993). MASCOT: multiple alignment system for protein sequences based on three-way dynamic programming. Computer Applications in the Biosciences 9, 161-167.
Hobbs, H. A., Eastburn, D. M., D'Arcy, C. J., Kindhart, J. D., Masiunas, J. B., Voegtlin, D. J., et al. (2000). Solanaceous Weeds as Possible Sources of Cucumber mosaic virus in Southern Illinois for Aphid Transmission to Pepper. Plant Disease, 84, 1221-1224.
Hopper, S. D., & Gioia, P. (2004). The southwest Australian floristic region; evolution and conservation of a global hot spot of biodiversity. Annual Review of Ecology, Evolution and Systematics, 10, 399-422.

236
Hull, R. (1999). Classification of reverse transcribing elements: a discussion document. Archives of Virology, 144, 209-214.
Hull, R. (2002). Matthew's plant Virology (fourth ed.): Academic Press. Hurkman, W. J., & Tanaka, C. K. (1986). Solubilization of plant membrane proteins for analysis by two-
dimensional gel electrophoresis. Plant Physiology, 81, 802-8066. Irwin, M. E., & Thresh, J. M. (1992). Barley Yellow Dwarf Virus Epidemiology: A Study in Ecological
Complexity. Paper presented at the Barley Yellow Dwarf in West Asia and North Africa, Rabat. Jacquot, E., Tribodet, M., Croizat, F., Balme-Sinibaldi, V., & Kerlan, C. (2005). A single nucleotide
polymorphism-based technique for specific characterization of YO and YN isolates of Potato virus Y (PVY). Journal of Virological Methods, 125, 83-93.
Jain, R. K., Pappu, S. S., Pappu, H. R., Culbreath, A. K., & Todd, J. W. (1998). Molecular diagnosis of tomato spotted wilt tospovirus infection of peanut and other field and greenhouse crops. Plant Disease, 82, 900-904.
James, P., Quadroni, M., Carafoli, E., & Gonnet, G. (1993). Protein identification by mass profile fingerprinting. Biochemical and Biophysical Research Communications, 195, 58-64.
Jeger, M. J., Seal, S. E., & Van den Bosch, F. (2006). Evolutionary epidemiology of plant virus disease. Advances in Virus Research, 67, 163-203.
Jensen, S. G., Palomar, M. K., Ball, E. M., & Samson, R. (1985). Factors Influencing virus titer in maize dwarf mosaic virus. Phytopathology, 75, 1132-1136.
Jimenez-Martinez, E. S., & Bosque-Perez, N. A. (2004). Variation in barley yellow dwarf virus transmission efficiency by Rhopalosiphum padi (Homoptera: Aphididae) after acquisition from transgenic and nontransformed wheat genotypes. Journal of Economic Entomology, 97, 1790-1796.
Jones, R. A. C. (1993). Effects of cereal borders, admixture with cereals and plant density on the spread of bean yellow mosaic potyvirus into narrow-leafed lupins (Lupinus angustifolius). Annals of Applied Biology, 122, 501-518.
Jones, R. A. C. (2005). Patterns of spread of two non-persistently aphid-borne viruses in lupin stands under four different infection scenarios. Annals of Applied Biology, 146, 337-350.
Jones, R. A. C. (2009). Plant virus emergence and evolution: origins, new encounter scenarios, factors driving emergence, effects of changing world conditions, and prospects for control. Virus Research, 141(2), 113-130.
Jones, R. A. C., Coutts, B. A., & Cheng, Y. (2003). Yield limiting potential of necrotic and non-necrotic strains of Bean yellow mosaic virus in narrow-leafed lupin (Lupinus angustifolius). Australian Journal of Agricultural Research, 54, 849-859.
Jones, R. A. C., & McLean, G. D. (1989). Virus diseases of lupins. Annals of Applied Biology, 114, 609-637. Jones, R. A. C., & Smith, L. J. (2005). Inheritance of hypersensitive resistance to Bean yellow mosaic virus
in narrow-leafed lupin (Lupinus angustifolius). Annals of Applied Biology, 146, 539-543. Jordan, R., & Hammond, J. (1991). Comparison and differentiation of potyvirus isolates and
identification of strain-, virus-, subgroup-specific and potyvirus group-common epitopes using monoclonal antibodies. Journal of General Virology, 72, 25-36.
Kakani, K., Robbins, M., & Rochon, D. A. (2003). Evidence that binding of Cucumber necrosis virus to vector zoospores involves recognition of oligosaccharides. Journal of Virology, 77, 3922-3928.
Kamei, T., Goto, T., & Matusi, C. (1969). Turnip mosaic virus multiplication in leaves infected with Cauliflower mosaic virus. Phytopathology, 59, 1795-1797.
Kang, B. C., Yeam, I., & Jahn, M. M. (2005). Genetics of plant virus resistance. Annual Review of Phytopathology, 43, 581-621.
237
Kanyuka, K., Ward, E., & Adams, M. J. (2003). Polymyxa graminis and the cereal viruses it transmits: a research challenge. Molecular Plant Pathology, 4, 393-406.
Karetnikov, K., & Lehto, K. (2007). The RNA2 5 leader of Blackcurrant reversion virus mediates efficient in vivo translation through an internal ribosomal entry site mechanism. Journal of General Virology, 88, 286-297.
Kassanis, B., & Govier, D. A. (1971). The role of the helper virus in aphid transmission of potato aucuba mosaic virus and potato virus C. Journal of general virology, 13, 221-228.
Kathiria, P., Sidler, C., Golubov, A., Kalischuk, M., Kawchuk, L. M., & Kovalchuk, I. (2010). Tobacco mosaic virus infection results in an increase in recombination frequency and resistance to viral, bacterial, and fungal pathogens in the progeny of infected tobacco plants. Plant Physiology, 153, 1859-1870.
Kearney, C. M., Thomson, M. J., & Roland, K. E. (1999). Genome evolution of tobacco mosaic virus populations during long-term passaging in a diverse range of hosts. Archives of Virology, 144, 1513-1526.
Keldish, M., Pomazkov, Y., Arushanova, E., & Chervyakova, O. (1998). Vectors as epidemiological factors in widening the host range for viruses of fruit trees and small fruit crops. Acta Horticulturae, 472, 147-152.
Khetarpal, R. K., & Maury, Y. (1987). Pea seed-borne mosaic virus: a review. Agronomie, 7, 215-224. Kiratiya-Angul, S., & Gibbs, A. (1992). Group-specific antiserum detects potyviruses in several wild plant
species in southeastern Australia. Australasian Plant Pathology, 21, 118-119. Kogovsek, P., Gow, L., Pompe-Novak, M., Gruden, K., Foster, G. D., Boonham, N., et al. (2008). Single-
step RT real-time PCR for sensitive detection and discrimination of Potato virus Y isolates. Journal of Virological Methods, 149, 1-11.
Kokkinos, C. D., & Clark, C. A. (2006). Real-Time PCR Assays for Detection and Quantification of Sweetpotato Viruses. Plant Disease, 90, 783-788.
Kreuze, J. F., Perez, A., Untiveros, M., Quispe, D., Fuentes, S., Barker, I., et al. (2009). Complete viral genome sequence and discovery of novel viruses by deep sequencing of small RNAs: a generic method for diagnosis, discovery and sequencing of viruses. Virology, 388, 1-7.
Kriwacki, R. W., & Siuzdak, G. (2000). Probing protein-protein interactions with mass spectrometry. Methods in Molecular Biology, 146, 223-238.
Kusunoki, M., Hanada, K., Iwaki, M., Chang, M. U., Doi, Y., & Yora, K. (1986). Cycas necrotic stunt virus, a new member of nepoviruses found in Cycas revoluta host range, purification, serology and some other properties. Annals of the Phytopathological Society of Japan, 52, 302-311.
Lamberti, F., Taylor, C. E., & Seinhorst, J. W. (1975). Nematode vectors of plant viruses: Plenum. Lan, P., Yeh, W. B., Tsai, C. W., & Lin, N. S. (2010). A unique glycine-rich motif at the N-terminal region of
Bamboo mosaic virus coat protein is required for symptom expression. Molecular Plant-Microbe Interactions, 23, 903-914.
Langeveld, S. A., Dore, J. M., Memelink, J., Derks, A. F., van der Vlugt, C. I., Asjes, C. J., et al. (1991). Identification of potyviruses using the polymerase chain reaction with degenerate primers. Journal of General Virology, 72, 1531-1541.
Lapidot, M., Guenoune-Gelbart, D., Leibman, D., Holdengreber, V., Davidovitz, M., Machbash, Z., et al. (2010). Pelargonium zonate spot virus is transmitted vertically via seed and pollen in tomato. Phytopathology 100, 798-804.
Ledergerber, C., & Dessimoz, C. (2011). Base-calling for next-generation sequencing platforms. Briefings in Bioinformatics, 12, 489-497.
Lee, J. A., Choi, S. K., Yoon, J. Y., Hong, J. S., Ryu, K. H., Lee, S. Y., et al. (2007). Variation in the pathogenicity of lily isolates of cucumber mosaic virus. Journal of Plant Pathology, 23, 251-259.
238
Lewis, J. K., Bendahmane, M., Smith, T. J., Beachy, R. N., & Siuzdak, G. (1998). Identification of viral mutants by mass spectrometry. Proceedings of the National Academy of Sciences, 95, 8596-8601.
Liu, H. Y., & Sears, J. L. (2007). First report of Pelargonium zonate spot virus from tomato in the United States. Plant Disease, 91, 663.
Lovisolo, O., Hull, R., & Rosler, O. (2003). Coevolution of viruses with hosts and vectors and possible paleontology. Advances in Virus Research, 62, 325-379.
Luo, H., Wylie, S. J., & Jones, M. G. K. (2010). Identification of plant viruses using one-dimensional gel electrophoresis and peptide mass fingerprints. Journal of Virological Methods, 165, 297-301.
MacCoss, M. J., Wu, C. C., & Yates, J. R. (2002). Probability-based validation of protein identifications using a modified SEQUEST algorithm. Analytical Chemistry, 74, 5593-5599.
Magbanua, Z. V., Wilde, H. D., Roberts, J. K., Chowdhury, K., Jorge, A., Moyer, J. W., et al. (2000). Field resistance to Tomato spotted wilt virus in transgenic peanut (Arachis hypogaea L.) expressing an antisense nucleocapsid gene sequence. Molecular Breeding, 6, 227-236.
Malapi-Nelson, M., Wen, R. H., Ownley, B. H., & Hajimorad, M. R. (2009). Co-infection of soybean with Soybean mosaic virus and Alfalfa mosaic virus results in disease synergism and alteration in accumulation level of both viruses. Plant Disease, 93, 1259-1264.
Manabe, T., Jin, Y., & Tani, O. (2007). Assignment of human plasma polypeptides on a nondenaturing 2-D gel using MALDI-MS and PMF and comparisons with the results of intact protein mapping. Electrophoresis, 28, 843-863.
Mann, M., Højrup, P., & Roepstorff, P. (1993). Use of mass spectrometric molecular weight information to identify proteins in sequence databases. Biological Mass Spectrometry, 22, 338-345.
Margulies, M., Egholm, M., Altman, W. E., Attiya, S., Bader, J. S., Bemben, L. A., et al. (2005). Genome sequencing in microfabricated high-density picolitre reactors. Nature, 437, 376-380.
Martin, S., & Elena, S. F. (2009). Application of game theory to the interaction between plant viruses during mixed infections. Journal of General Virology, 90, 2815-2820.
Martinez, A. (2005). Georgia plant disease loss estimates, from http://pubs.caes.uga.edu/caespubs/pubs/PDF/SB41-08.pdf
Maruthi, M. N., Hillocks, R. J., Mtunda, K., Raya, M. D., Muhanna, M., Kiozia, H., et al. (2005). Transmission of Cassava brown streak virus by Bemisia tabaci (Gennadius). Journal of Phytopathology, 153, 307-312.
Mas, P., & Pallas, V. (1996). Long-distance movement of cherry leaf roll virus in infected tobacco plants. Journal of General Virology, 77, 531-540.
Mascia, T., Cillo, F., Fanelli, V., Finetti-Sialer, M. M., Stradis, A. D., Palukaitis, P., et al. (2010). Characterization of the interactions between Cucumber mosaic virus and Potato virus Y in mixed infections in tomato Molecular Plant-Microbe Interactions, 23, 1514-1524.
McKirdy, S. J., Coutts, B. A., & Jones, R. A. C. (1994). Occurrence of bean yellow mosaic virus in subterranean clover pastures and perennial native legumes. Australian Journal of Agricultural Research, 45, 183-194.
McKirdy, S. J., & Jones, R. A. C. (1995). Bean yellow mosaic potyvirus infection of alternative hosts associated with subterranean clover (Trifolium subterraneum) and narrow-leafed lupins (Lupinus angustifolius): field screening procedure, relative susceptibility/resistance rankings, seed transmission and persistence between growing seasons. Australian Journal of Agricultural Research, 45, 135-152.
Meyer, Y., Grosset, J., Chartier, Y., & Cleyet-Marel, J. C. (1988). Preparation by two-dimensional electrophoresis of proteins for antibody production: antibodies against proteins whose synthesis is reduced by auxin in tobacco mesophyll protoplasts. Electrophoresis, 9, 704-712.
239
Michael, K., Harder, T. C., Mettenleiter, T. C., & Karger, A. (2009). Diagnosis and strain differentiation of avian influenza viruses by restriction fragment mass analysis. Journal of Virological Methods, 158, 63-69.
Moffat, A. S. (1999). Plant pathology: Geminiviruses emerge as serious crop threat. Science, 286, 1835. Monger, W. A., Seal, S., Cotton, S., & Foster, G. D. (2001). Identification of different isolates of Cassava
brown streak virus, and development of a diagnostic test Plant Pathology, 50, 768-775. Mortimer-Jones, S. m., Jones, M. G. K., Jones, R. A. C., Thomson, G., & Dwyer, G. I. (2009). A single tube,
quantitative real-time RT-PCR assay that detects four potato viruses simultaneously Journal of Virological Methods, 161, 289-296.
Mouhanna, A. M., Nasrallah, A., Langen, G., & Schlösser, E. (2002). Surveys for Beet Necrotic Yellow Vein Virus (the Cause of Rhizomania), other Viruses, and Soil-borne Fungi Infecting Sugar Beet in Syria. Journal of Phytopathology, 150, 657-662.
Myers, N., Mittermeier, R. A., Mittermeier, C. G., da Fonseca, G. A., & Kent, J. (2000). Biodiversity hotspots for conservation priorities. Nature, 403, 853-858.
Nakatsukasa-Akune, M., Yamashita, K., Shimoda, Y., Uchiumi, T., Abe, M., Aoki, T., et al. (2005). Suppression of root nodule formation by artificial expression of the TrEnodDR1 (coat protein of White clover cryptic virus 1) gene in Lotus japonicus. Molecular Plant-Microbe Interactions, 18, 1069-1080.
Nault, L. R. (1997). Arthropod transmission of plant viruses: a new synthesis. Annals of the Entomological Society of America, 90, 521-541.
NG, J. C. K., & Perry, K. L. (2004). Transmission of plant viruses by aphid vectors. Molecular Plant Pathology, 5, 505-511.
Norse, D., & Gommes, R. (2003). Climate change and agriculture: physical and human dimensions. In J. Bruinsma (Ed.), World agriculture: towards 2015/2030 : an FAO perspective (pp. 357-372): Earthscan.
O'Connell, M., Pannell, D. J., & French, R. J. (2003). Are high lupin seeding rates more risky in the Western Australian wheatbelt? Australian Journal of Experimental Agriculture, 43, 1137-1142.
Ochoa-Corona, F. M., Elliot, D. R., Tang, Z., Lebas, B. S. M., & Alexander, B. J. R. (2003). Detection of Cycas necrotic stunt virus (CNSV) in post-entry quarantine stocks of ornamentals in New Zealand. Phytopathology, 93, S67.
Osiowy, C. (1998). Direct detection of respiratory syncytial virus, parainfluenza virus, and adenovirus in clinical respiratory specimens by a multiplex reverse transcription-PCR assay. Journal of Clinical Microbiology, 36, 3149-3154.
Padliya, N. D., & Cooper, B. (2006). Mass spectrometry-based proteomics for the detection of plant pathogens. Proteomics, 6, 4069-4075.
Palacios, G., Druce, J., Du, L., Tran, T., Birch, C., Briese, T., et al. (2008). A new arenavirus in a cluster of fatal transplant-associated diseases. The New England Journal of Medicine, 358, 991-998.
Palta, J. A., Berger, J. D., & Ludwig, C. (2008). The growth and yield of narrow-leafed lupin: myths and realities. Paper presented at the 12th International Lupin Conference, Fremantle, Western Australia.
Palukaitis, P., Roossinck, M. J., Dietzgen, R. G., & Francki, R. I. (1992). Cucumber mosaic virus. Advances in Virus Research, 41, 281-348.
Pappin, D. J., Hojrup, P., & Bleasby, A. J. (1993). Rapid identification of proteins by peptide-mass fingerprinting. Current Biology, 3, 327-332.
Perera, M. R., Flores-Vagas, R. D., & Jones, M. G. K. (2005a). Identification of aphid species using protein profiling and matrix-assisted laser desorption/ionization time-of-flight mass spectrometry. Entomologia Experimentalis et Applicata, 117, 243-247.

240
Perera, M. R., Vanstone, V. A., & Jones, M. G. K. (2005b). A novel approach to identify plant parasitic nematodes using matrix-assisted laser desorption/ionization time-of-flight mass spectrometry. Rapid Communications in Mass Spectrometry, 19, 1454-1460.
Perry, K. L., Zhang, L., & Palukaitis, P. (1998). Amino acid changes in the coat protein of cucumber mosaic virus differentially affect transmission by the aphids Myzus persicae and Aphis gossypii. Virology, 242, 204-210.
Plumb, R. T., Lennon, E. A., & Gutteridge, R. A. (1986). The effects of infection by barley yellow mosaic virus on the yield and components of yield of barley. Plant Pathology, 35, 314-318.
Polston, J. E., & Anderson, P. K. (1997). The emergence of whitefly-transmitted geminiviruses in tomato in the western hemisphere. Plant Disease, 81, 1358-1369.
Raccah, B., & Fereres, A. (2009). Plant virus transmission by insects. In D. Harper (Ed.), Encyclopedia of Life Sciences: John Wiley & Sons, Ltd.
Redinbaugh, M. G., Seifers, D. L., Meulia, T., Abt, J. J., Anderson, R. J., Styer, W. E., et al. (2002). Maize fine streak virus, a New Leafhopper-Transmitted Rhabdovirus. Phytopathology, 92, 1167-1174.
Ritzenthaler, C., Viry, M., Pinck, M., Margis, R., Fuchs, M., & Pinck, L. (1991). Complete nucleotide sequence and genetic organization of grapevine fanleaf nepovirus RNA1. Journal of General Virology, 72, 2357-2365.
Roberts, I. M., Wang, D., Findlay, K., & Maule, A. J. (1998). Ultrastructural and temporal observations of the potyvirus cylindrical inclusions (Cls) show that the Cl protein acts transiently in aiding virus movement. Virology, 245(1), 173-181.
Rocha-Peña, M. A., Lee, R. F., & Niblett, C. L. (1993). Effectiveness of different citrus species as donor hosts for graft transmission of citrus tristeza virus. Paper presented at the Proc. 12th Conf. IOCV.
Rodman, J. E. (1986). Introduction, establishment and replacement of sea-rockets (Cakile, Cruciferae) in Australia. Journal of Biogeography, 13, 159-171.
Rodoni, B. (2009). The role of plant biosecurity in preventing and controlling emerging plant virus disease epidemics. Virus Research, 141, 150-157.
Roossinck, M. J. (2011). The good viruses: viral mutualistic symbioses. Nature Reviews Microbiology, 9, 99-108.
Roossinck, M. J., Saha, P., Wiley, G. B., Quan, J., White, J. D., Lai, H., et al. (2010). Ecogenomics: using massively parallel pyrosequencing to understand virus ecology. Molecular Ecology, 19, 81-88.
Rothberg, J. M., & Leamon, J. H. (2008). The development and impact of 454 sequencing. Nature Biotechnology, 26, 1117-1124.
Rybicki, E. P. (2005). Plant virus nomenclature and taxonomy. Encyclopedia of Plant and Crop Science, 1-4.
Sambrook, J., Fritch, E. F., & Maniatis, T. (1989). Molecular cloning: a laboratory manual: Cold Spring Harbor Laboratory Press.
Sanfacon, H., Wellink, J., Le Gall, O., Karasev, A., van der Vlugt, R., & Wetzel, T. (2009). Secoviridae: a proposed family of plant viruses within the order Picornavirales that combines the families Sequiviridae and Comoviridae, the unassigned genera Cheravirus and Sadwavirus, and the proposed genus Torradovirus. Arch Virol, 154(Archives of Virology), 899-907.
Sanger, F., Nicklen, S., & Coulson, A. R. (1977). DNA sequencing with chain-terminating inhibitors. Proceedings of the National Academy of Sciences, 74, 5463-5467.
Savitski, M. M., Nielsen, M. L., & Zubarev, R. A. (2005). New data base-independent, sequence tag-based scoring of peptide MS/MS data validates Mowse scores, recovers below threshold data, singles out modified peptides, and assesses the quality of MS/MS techniques. Molecular & Cellular Proteomics, 4, 1180-1188.

241
Seal, S., & Coates, D. (1998). Detection and Quantification of Plant Viruses by PCR. In G. D. Foster & S. C. Taylor (Eds.), Plant Virology Protocols: From Virus Isolation to Transgenic Resistance (Vol. 81, pp. 469-485). Kent, UK.
Seal, S. E., van den Bosch, F., & Jeger, M. J. (2006). Factors influencing Begomovirus evolution and their increasing global significance: implications for sustainable control. Critical Reviews in Plant Sciences, 20, 23-46.
She, Y. M., Haber, S., Seifers, D. L., Loboda, A., Chernushevich, I., Perreault, H., et al. (2001). Determination of the complete amino acid sequence for the coat protein of brome mosaic virus by time-of-flight mass spectrometry. Evidence for mutations associated with change of propagation host. The Journal of Biological Chemistry, 276, 20039-20047.
Shukla, D. D., Strike, P. M., Tracy, S. L., Cough, K. H., & Ward, C. W. (1988). The N and C termini of the coat proteins of potyviruses are surface-located and the N terminus contains the major virus-specific epitopes. Journal of General Virology, 69, 1497-1508.
Siuzdak, G. (1998). Probing viruses with mass spectrometry. Journal of Mass Spectrometry, 33, 203-211. Spetz, C., Taboada, A. M., Darwich, S., Ramsell, J., Salazar, L. F., & Valkonen, J. P. (2003). Molecular
resolution of a complex of potyviruses infecting solanaceous crops at the centre of origin in Peru. Journal of General Virology, 84, 2565-2578.
Stahlberg, A., Hakansson, J., Xian, X., Semb, H., & Kubista, M. (2004). Properties of the reverse transcription reaction in mRNA quantification. Clinical Chemistry, 50, 509-515.
Stenger, D. C., Seifers, D. L., & French, R. (2002). Patterns of polymorphism in wheat streak mosaic virus: sequence space explored by a clade of closely related viral genotypes rivals that between the most divergent strains. Virology, 302, 58-70.
Storey, H. H. (1936). Virus disease of East African plants VI. A progress report on studies of the disease of cassava. East African Agricultural and Forestry Journal, 2, 34-39.
Taiwo, M. A., Kareem, K. T., Nsa, I. Y., & D'A Hughes, J. (2007). Cowpea viruses: Effect of single and mixed infections on symptomatology and virus concentration Virology Journal, 4, 95.
Tan, S. W., Wong, S. M., & Kini, R. M. (2000). Rapid simultaneous detection of two orchid viruses using LC- and/or MALDI-mass spectrometry. Journal of Virological Methods, 85, 93-99.
Taniguchi, H., & Hayashi, N. (1998). A liquid chromatography/electrospray mass spectrometric study on the post-transcriptional modification of tRNA. Nucleic Acids Research, 26, 1481-1486.
Thackray, D. J., Diggle, A. J., Berlandier, F. A., & Jones, R. A. (2004). Forecasting aphid outbreaks and epidemics of Cucumber mosaic virus in lupin crops in a Mediterranean-type environment. Virus Research, 100, 67-82.
Thomas, J. J., Falk, B., Fenselau, C., Jackman, J., & Ezzell, J. (1998). Viral characterization by direct analysis of capsid proteins. Analytical Chemistry, 70, 3863-3867.
Thresh, J. M. (1980). The origins and epidemiology of some important plant virus diseases. Advances in Applied Biology, 5, 1-65.
Thresh, J. M. (2006). Plant virus epidemiology: the concept of host genetic vulnerability. Advances in Virus Research, 67, 89-125.
Todd, J. C., Ammar el, D., Redinbaugh, M. G., Hoy, C., & Hogenhout, S. A. (2010). Plant host range and leafhopper transmission of maize fine streak virus. Phytopathology, 100, 1138-1145.
Torrance, L., Pead, M. T., Larkins, A. P., & Butcher, G. W. (1986). Characterization of Monoclonal Antibodies to a U.K. Isolate of Barley Yellow Dwarf Virus. Journal of General Virology, 67, 549-556.
Traoré, M. D., Traoré, V. S., Galzi-Pinel, A., Fargette, D., Konaté, G., Traoré, A. S., et al. (2008). Abiotic transmission of Rice yellow mottle virus through soil and contact between plants. Pakistan Journal of Biological Sciences, 11, 900-904.

242
Valenzuela, I., Hoffmann, A. A., Malipatil, M. B., Ridland, P. M., & Weeks, A. R. (2007). Identification of aphid species (Hemiptera:Aphididae:Aphidinae) using a rapid polymerase chain reaction restriction fragment length polymorphism method based on the cytochrome oxidase subunit I gene. Australian Journal of Entomology, 46, 305-312.
van den Bosch, F., Jeger, M. J., & Gilligan, C. A. (2007). Disease control and its selection for damaging plant virus strains in vegetatively propagated staple food crops; a theoretical assessment. Proceedings of the Royal Society - Biological Sciences, 274, 11-18.
Van Regenmortel, M. H. V. (2000). Introduction to the species concept in virus taxonomy. In M. H. V. van Regenmortel, C. M. Fauquet, D. H. L. Bishop, E. B. Carstens, M. K. Estes, S. M. Lemon, J. Maniloff, M. A. Mayo, D. J. McGeoch, C. R. Pringle & R. B. Wickner (Eds.), Seventh Report of the International Committee for Taxonomy of Viruses (pp. 3-16). San Diego, CA, USA: Academic Press.
Varma, A., & Malathi, V. G. (2003). Emerging geminivirus problems: a serious threat to crop production. Annals of Applied Biology, 142, 145-164.
Vaughan, D. A., Balazs, E., & Heslop-Harrison, J. S. (2007). From crop domestication to super-domestication. Annals of Botany, 100, 893-901.
Vetten, H. J. (2008). Nanoviruses. In B. W. J. Mahy & M. H. V. Regenmortel (Eds.), Encyclopedia of Virology (third ed., pp. 385-391): Academic Press.
Vora, G. J., Meador, C. E., Stenger, D. A., & Andreadis, J. D. (2004). Nucleic acid amplification strategies for DNA microarray-based pathogen detection. Applied and Environmental Microbiology, 70, 3047-3054.
Wan, J., Dunning, M. F., & Bent, A. F. (2002). Probing plant-pathogen interactions and downstream defense signaling using DNA microarrays Functional & Integrative Genomics, 2, 259-273.
Wang, D., & Maule, A. J. (1992). Early embryo invasion as a determinant in pea of the seed transmission of pea seed-borne mosaic virus. Journal of General Virology 73, 1615-1620.
Wang, D., & Maule, A. J. (1994). A model for seed transmission of a plant virus: genetic and structural analyses of pea embryo invasion by pea seed-borne mosaic virus. Plant Cell, 6, 777-787.
Wang, J., Turina, W., Medina, V., & Falk, B. W. (2009). Synergistic interaction between the Potyvirus, Turnip mosaic virus and the Crinivirus, Lettuce infectious yellows virus in plants and protoplasts. Virus Research, 144, 163-170.
Wang, R., Wang, J., Li, J., Wang, Y., Xie, Z., & An, L. (2007). Comparison of two gel filtration chromatographic methods for the purification of Lily symptomless virus. Journal of Virological Methods, 139, 125-131.
Wang, W., Vignani, R., Scali, M., & Cresti, M. (2006). A universal and rapid protocol for protein extraction from recalcitrant plant tissues for proteomic analysis. Electrophoresis, 27, 2782-2786.
Wang, W., Vignani, R., Scali, M., Sensi, E., Tiberi, P., & Cresti, M. (2004). Removal of lipid contaminants by organic solvents from oilseed protein extract prior to electrophoresis. Analytical Biochemistry, 329, 139-141.
Wang, Y. Z., Gaba, V., Yang, J., Palukaitis, P., & Gal-On, A. (2002). Characterization of synergy between Cucumber mosaic virus and Potyviruses in Cucurbit hosts. Phytopathology, 92, 51-58.
Webster, C. G., Coutts, B. A., Jones, R. A. C., Jones, M. G. K., & Wylie, S. J. (2007). Virus impact at the interface of an ancient ecosystem and a recent agroecosystem: studies on three legume-infecting potyviruses in the southwest Australian floristic region. Plant Pathology, 56, 729-742.
Webster, J., & Oxley, D. (2005). Peptide mass fingerprinting: protein identification using MALDI-TOF mass spectrometry. Methods in Molecular Biology, 310, 227-240.
Wege, C., & Siegmund, D. (2007). Synergism of a DNA and an RNA virus: enhanced tissue infiltration of the begomovirus Abutilon mosaic virus (AbMV) mediated by Cucumber mosaic virus (CMV). Virology, 357, 10-28.
243
Weintraub, P. G., & Orenstein, S. (2004). Potential leafhopper vectors of phytoplasma in carrots. International Journal of Tropical Insect Science, 24, 228-235.
Whitfield, A. E., Ullman, D. E., & German, T. L. (2005). Tospovirus-thrips interactions. Annual Review of Phytopathology, 43, 459-489.
Wintermantel, W. M., Cortez, A. A., Anchieta, A. G., Gulati-Sakhuja, A., & Hladky, L. L. (2008). Co-infection by two criniviruses alters accumulation of each virus in a host-specific manner and influences efficiency of virus transmission. Phytopathology, 98, 1340-1345.
Wylie, S. J., Coutts, B. A., Jones, M. G. K., & Jones, R. A. C. (2008). Phylogenetic analysis of Bean yellow mosaic virus isolates from four continents: relationship between the seven distinct groups found and their natural isolation hosts and geographical origins. Plant Disease, 92, 1596-1603.
Wylie, S. J., & Jones, M. G. (2011a). Characterisation and quantitation of mutant and wild-type genomes of Hardenbergia mosaic virus isolates co-infecting a wild plant of Hardenbergia comptoniana (Publication no. 10.1007/s00705-011-0965-4). Retrieved Mar 22: http://www.ncbi.nlm.nih.gov/entrez/query.fcgi?cmd=Retrieve&db=PubMed&dopt=Citation&list_uids=21424731
Wylie, S. J., & Jones, M. G. K. (2011b). The complete genome sequence of Passionfruit woodiness virus determined using deep sequencing, and its relationship to other potyviruses. Archives of Virology, 156, 479-482.
Wylie, S. J., & Jones, M. G. K. (2011c). Hardenbergia virus A, a novel member of the family Betaflexiviridae from a wild legume in Southwest Australia. Archives of Virology 156, 1245-1250.
Wylie, S. J., & Jones, R. A. (2009). Role of recombination in the evolution of host specialization within bean yellow mosaic virus. Phytopathology, 99, 512-518.
Wylie, S. J., Luo, H., Li, H., & Jones, M. G. K. (2011). Multiple polyadenylated RNA viruses detected in pooled domestic and wild plant samples. Archives of virology, submitted to review.
Wylie, S. J., Nouri, S., Coutts, B. A., & Jones, M. G. (2010). Narcissus late season yellows virus and Vallota speciosa virus found infecting domestic and wild populations of Narcissus species in Australia. Archives of Virology, 155, 1171-1174.
Wylie, S. J., Wilson, C. R., Jones, R. A. C., & Jones, M. G. K. (1993). A polymerase chain reaction assay for cucumber mosaic virus in lupin seeds. Australian Journal of Agricultural Research, 44, 41-51.
Xu, P., Chen, F., Mannas, J. P., Feldman, T., Sumner, L. W., & Roossinck, M. J. (2008). Virus infection improves drought tolerance. New Phytologist, 180, 911-921.
Yalow, R. S., & Berson, S. A. (1960). Immunoassay of endogenous plasma insulin in man. The Journal of Clinical Investigation, 39, 1157-1175.
Yan, F., Zhang, H., Adams, M. J., Yang, J., Peng, J., Antoniw, J. F., et al. (2010). Characterization of siRNAs derived from rice stripe virus in infected rice plants by deep sequencing. Archives of Virology, 155, 935-940.
Yang, A. F., & Hamilton, R. I. (1974). The mechanism of seed transmission of tobacco ringspot virus in soybean. Virology, 62, 26-37.
Yates, J. R., 3rd, Speicher, S., Griffin, P. R., & Hunkapiller, T. (1993). Peptide mass maps: a highly informative approach to protein identification. Analytical Biochemistry, 214, 397-408.
Zechmann, B., & Zellnig, G. (2009). Rapid diagnosis of plant virus diseases by transmission electron microscopy. Journal of Virological Methods, 162, 163-169.
Zerbino, D. R., & Birney, E. (2008). Velvet: Algorithms for de novo short read assembly using de Bruijn graphs. Genome Research, 18, 821-829.
Zhang, W., & Chait, B. T. (2000). ProFound: an expert system for protein identification using mass spectrometric peptide mapping information. Analytical Chemistry, 72, 2482-2489.

244
Zhang, Y., Zhao, W., Li, M., Chen, H., Zhu, S., & Fan, Z. (2010). Real-time TaqMan RT-PCR for detection of Maize chlorotic mottle virus in maize seeds. Journal of Virological Methods.
Žižytė, M., Staniulis, J., & Zitikaitė, I. (2006). Identification of Beet necrotic yellow vein virus isolate detected in Lithuania. Agronomy Research, 4, 475-478.