using neurophysiological markers of genetic risk to define the
TRANSCRIPT

Using Neurophysiological Markers of GeneticRisk to Define the Boundaries of theSchizophrenia Spectrum Phenotype
by Matthew T. Avila, Helene M. Adami, Robert P. McMahon,and Qunvant K. Thaker
AbstractThere is considerable evidence that schizophreniaspectrum personality (SSP) disorders mark geneticrisk for schizophrenia. Use of the spectrum phenotypein genetic and neurophysiological studies may proveinformative. However, the degree to which the currentdiagnostic criteria correspond with genetic risk isunclear. This can be assessed by observing how mea-sures of liability among SSP subjects change as a func-tion of diagnostic criteria. In this study the general-ized estimating equation method was used to assesschanges in eye-tracking performance among SSP andnon-SSP family and community groups employingvarious diagnostic criteria. Eye-tracking deficitsamong SSP relatives remained statistically highercompared with the other groups across progressivelymore liberal SSP criteria. The results suggest thatfewer traits than are used in clinical diagnoses caneffectively identify the spectrum phenotype among rel-atives of schizophrenia patients. Thus, reduced crite-ria may be used in research to increase "high risk"sample size and power to detect neurophysiologicaland genetic differences. Our results provide suggestiveevidence that the use of clinical criteria in researchmay, in fact, underidentify at-risk individuals—poten-tially distorting genetic and neurophysiological find-ings.
Keywords: Schizophrenia, schizophrenia spec-trum, diagnostic criteria, genetic risk, neurophysiolog-ical marker, phenotype.
Schizophrenia Bulletin, 29(2):299-309,2003.
Several investigators have suggested that the study ofschizophrenia spectrum personality disorders (SSPDs)may serve to clarify the genetic causes and related neuro-physiological deficits associated with schizophrenia (e.g.,Lichtermann et al. 2000; Tsuang 2001). Extensive evi-dence from family studies suggests a relationship between
schizophrenia and spectrum disorders (see Battaglia andTorgerson 1996 for a review). This evidence includesreported increases in the prevalence of schizotypal person-ality disorder among relatives of patients with schizophre-nia (e.g., Kendler et al. 1984, 1994; Baron et al. 1985),higher rates of schizophrenia among relatives of individu-als diagnosed with schizotypal personality (Battaglia et al.1991, 1995; Thaker et al. 1993; Kendler and Walsh 1995),and increased prevalence of schizophrenia in the offspringof schizotypal parents whose spouses also have schizo-typal personality (Baron et al. 1983). A similar but weakerrelationship between paranoid and schizoid personalitydisorders and schizophrenia is suggested in some studies(Kendler and Gruenberg 1984; Baron et al. 1985;Battaglia et al. 1995; Kendler and Walsh 1995). Althoughthese data clearly indicate a familial association betweenSSPD and schizophrenia, they provide only indirect sup-port for the hypothesis that these disorders share a com-mon genetic basis. Direct evidence of genetic continuitycomes from a recent study by Pulver et al. (2000), whofound that stratification of families based on the presenceof SSPD in linkage analysis (i.e., restricting the analysis toonly those families where both SSPD and schizophreniawere present) resulted in a significantly higher lod scorefor chromosome 8p21.
Consistent with a shared genetic etiology, studies ofneurocognitive and neurophysiological functioning havefound similar deficits among patients with schizophreniaand individuals with SSPD (Siever 1985; Battaglia andTorgersen 1996). These similarities include deficits inattention (Keefe et al. 1997; Chen et al. 1998), informationprocessing—e.g., event-related potentials (Cadenhead etal. 2000; Niznikiewicz et al. 2000), and eye-tracking per-formance (e.g., Clementz et al. 1990, 1995; Siever et al.1994; Thaker et al. 1996a; O'Driscoll et al. 1998). The
Send reprint requests to M. Avila, The Maryland Psychiatric ResearchCenter, P.O. Box 21247, Baltimore, MD 21228; e-mail:[email protected].
299
Dow
nloaded from https://academ
ic.oup.com/schizophreniabulletin/article/29/2/299/1899375 by guest on 25 February 2022

Schizophrenia Bulletin, Vol. 29, No. 2, 2003 M.T. Avila et al.
degree to which these neurophysiological findings can beattributed to schizotypy, familial relationship to schizo-phrenia, or both is currently unresolved (Thaker 2000).However, several studies find that deficits are more likelyto occur or are more pronounced among relatives ofpatients with schizophrenia exhibiting spectrum traitscompared with unaffected family members and nonfamil-ial cases of SSPD (Condray and Steinhauer 1992; Thakeret al. 1996a, 1998; Kimble et al. 2000). In contrast, severallines of evidence suggest that spectrum disorders in theabsence of a family history of schizophrenia are heteroge-neous in their origins (Squires-Wheeler et al. 1988; Stan-ley et al. 1990; Kendler et al. 1993; Lyons et al. 1994) andnot necessarily related to schizophrenia (Thaker et al.\996b).
Thus, there is converging evidence from family,genetic, and neurophysiological studies that SSPD, partic-ularly in the presence of schizophrenia, marks the geneticliability to schizophrenia. Growing support for this viewhas been accompanied by important changes in study con-ceptualization and design. For example, several investiga-tors have recommended the inclusion of the SSPD pheno-type in formal genetic analyses (e.g., Maier et al. 1994;Faraone et al. 1995; Thaker et al. 1996a). The results ofPulver's (2000) restricted linkage analysis and other mole-cular genetic studies employing the spectrum phenotype(e.g., Ekelund et al. 2000) highlight the potential power ofthis new strategy in searching for regions of interest in thegenome. Assessment and inclusion of SSPD status are alsolikely to increase the power to detect group differences inneurophysiological and cognitive studies of nonpsychoticrelatives.
The success of these strategies is predicated on a highdegree of correspondence between the clinical phenotypeand the presence of genes conferring risk for schizophre-nia. However, the diagnostic criteria used to define thesephenotypes (e.g., DSM-IH-R and DSM-IV; AmericanPsychiatric Association 1987, 1994) were developed pri-marily as a clinical indicator of pathology with lessemphasis on the identification of genetic risk. Thus, in bio-logical terms it remains unclear how effectively our cur-rent diagnostic systems define the boundary of the spec-trum phenotype for the purposes of genetic andrr >•••-• ' ''-- o r • •-.-nhrenja. For example,
' diagnosis andschizophrenia appears inconsistent with the reportedprevalence of negative symptoms (a significant componentof both the schizoid and schizophrenia phenotype) amongrelatives of schizophrenia patients (Kety et al. 1994; Maieret al. 1994). Although this is explained, in part, by the useof hierarchical methods for calculating risk rates in whicha person meeting the diagnosis for both disorders wouldbe included only in the schizotypal group, it also suggests
that DSM criteria for schizoid personality may be toostringent. Siever et al. (1993) and others (e.g., Thaker et al.1993, 1996a) have suggested that the schizophrenia spec-trum may, in fact, extend beyond our current criteria. Thatis, likely genetic carriers who exhibit spectrum symptomsdo not necessarily demonstrate the required number oftraits in any one spectrum category (i.e., schizotypal,schizoid, or paranoid) to receive a formal clinical diagno-sis. If this assertion is correct, the use of formal DSM crite-ria can potentially distort neurophysiological and geneticdifferences—for example, by including nonpsychotic rela-tives with spectrum traits in unaffected categories.
One way to examine this issue is to observe changesin group performance on a putative liability marker usingvarious diagnostic thresholds for SSPD. To examine theeffects of lowering diagnostic thresholds we utilized twoeye-tracking measures: (1) smooth pursuit gain during tar-get masking and (2) the ratio of leading saccadic tosmooth pursuit eye movements. Both measures, which tapspecific components of the smooth pursuit response, havebeen shown when compared with more global assessmentsof eye-tracking performance to better differentiate patientsand relatives from healthy controls, and are thereforethought to more accurately reflect genetic liability forschizophrenia (Ross et al. 1998, 1999, 2000; Thaker et al.1998; Avila etal. 2002).
In an attempt to enhance the identification of"affected" relatives in neurophysiological and geneticstudies of schizophrenia, several researchers reduce thenumber of required spectrum traits by one more (e.g.,Squires-Wheeler et al. 1989; Siever et al. 1994; Battagliaet al. 1995; Thaker et al. 1996a). The purpose of the pres-ent study is to test the validity of this practice by examin-ing the change in eye-tracking performance among SSPDand non-SSPD relatives and community controls usingreduced criteria. Because DSM minus one criteria are mostfrequently employed in studies of schizophrenia, we focuson the comparison between these criteria andDSM-HI-R} Exploratory analyses are also performedusing further trait reductions to identify how far one canrelax DSM criteria before eye-tracking differences amongSSPD groups are significantly reduced. Observed changesin both the pattern and magnitude of group differencesmay have important implications for how we define andtreat SSPD status in future genetic and neurobiologicalstudies of schizophrenia.
1 Minus 1 criteria are similar to the number of traits required byDSM-1I1 criteria. The change from DSM-I11 to DSM-1I1-R involved theaddition of a ninth trait and a subsequent increase in the threshold from 4to 5. Interestingly, there was no psychometric reason for changing thetrait threshold—only a rationale for adding a trait based on clinical con-tent.
J U U
Dow
nloaded from https://academ
ic.oup.com/schizophreniabulletin/article/29/2/299/1899375 by guest on 25 February 2022

Boundaries of the Schizophrenia Spectrum Phenotype Schizophrenia Bulletin, Vol. 29, No. 2, 2003
Methods and Materials
Research VolunteersParticipant recruitment. All participants gave writ-
ten informed consent in accordance with University ofMaryland Institutional Review Board guidelines. First-degree biological relatives of schizophrenia patientsattending inpatient and outpatient programs at theMaryland Psychiatric Research Center (MPRC) wererecruited through letters and MPRC family seminars.First-degree relatives were ascertained from independentfamilies in all but five cases. The diagnosis of indexprobands was verified using the Structured ClinicalInterview for DSM-III-R Diagnosis (SCID-III-R)(Spitzer et al. 1990).
Community volunteers were recruited throughnewspaper advertisements. In order to recruit commu-nity participants with spectrum traits, one set of adver-tisements sought individuals who had experienced magi-cal thinking, perceptual distortions, social isolation, orlack of social drive—see Kunkel et al. (1998) for detailson recruitment of spectrum community participants.
Clinical assessments. The SCID-III-R andStructured Interview for DSM-III-R PersonalityDisorders (SIDP-R) (Pfohl et al. 1989) were used toassess Axis I and Axis II disorders. Modified FamilyHistory Research Diagnostic Criteria (FH-RDC)(Andreasen et al. 1986) were used to rule out positive his-tory for psychotic disorders in the families of communityvolunteers. We modified the FH-RDC by adding probequestions to increase the sensitivity of detecting schizo-phrenia and related disorders (Adami et al. 1990).Masters- and doctoral-level trained clinicians conductedall interviews. Diagnostic information was reviewed in abest estimate diagnostic meeting. Where additional infor-mation was required to make a diagnosis, SIDP-R infor-mant interviews were also conducted. Informant inter-views were done for approximately 10 percent of theparticipants. Each participant was given lifetimeDSM-III-R Axis I and Axis II diagnoses. Interrater relia-bilities (measured using a kappa statistic) exceeded 0.81for all instruments.
Rating individual spectrum traits. Rating the pres-ence or absence of individual spectrum traits was accom-plished using a 1-7 scale based on the extended ratingsscale developed by Chapman et al. (1976). We havedeveloped a manual with anchors to assist in ratings(manual is available upon request from M.T.A.). The fol-lowing general guidelines were used: a symptom defi-nitely absent was rated a 1; a symptom probably absentwas rated a 2; and a symptom probably present was rateda 3. These scores correspond to a rating of 0 on the SIDP-R. A symptom definitely present but mild in severity (i.e.,
did not significantly interfere with functioning or causedistress) was rated a 4, while a symptom definitely presentaccompanied by mild functional impairment and/or dis-tress was rated a 5. These correspond to a rating of 1 onthe SIDP-R. Finally, symptoms of moderate and markedseverity were given ratings of 6 and 7, respectively. Thesecorrespond to a rating of 2 on the SIDP-R. In keepingwith the goal of identifying covert liability rather thanovert pathology, a symptom was considered to be presentif the rating was 4 or more. Thus, the current rating sys-tem may identify individuals with SSPD who do notexhibit functional impairment, thereby limiting its appli-cation to research settings. Interrater reliabilities for para-noid-, schizoid-, and schizotypal-summed scores wereexcellent (intraclass correlation coefficients [ICCs] >0.88). On most of the individual items, interrater reliabili-ties were good (> 0.80); however, on three items, ICCswere suboptimal (0.64 and 0.50 for paranoid items 00A5and 00A6, respectively, and 0.76 for the schizotypal item22A7). Interrater reliabilities for diagnoses of the threepersonality disorders based on full and reducedDSM-III-R criteria ranged from 0.81 to 1.00 (kappa).
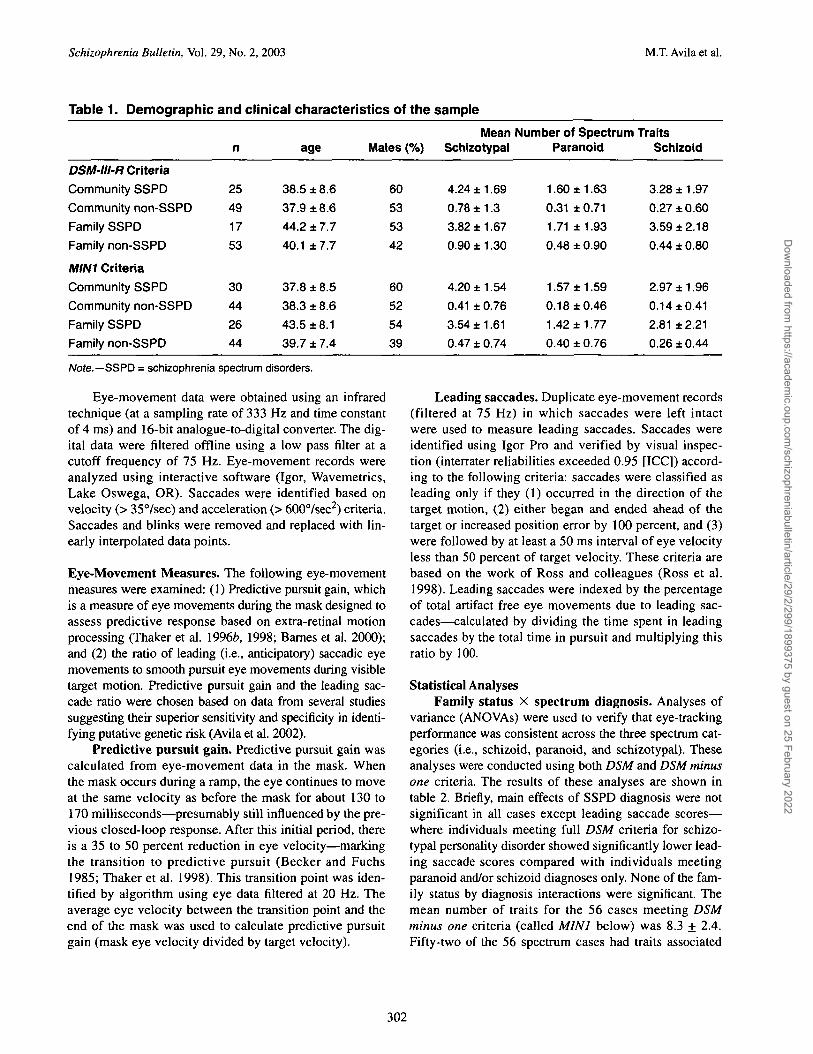
Participant groups. Participants with a current orlifetime Axis I diagnosis (except those with a single, pastepisode of major depression that did not require pharma-cological treatment, or those with a history of substanceabuse ending at least 6 months prior to the study) wereexcluded. Community participants with a family historyof psychotic disorders according to FH-RDC were alsoexcluded. Research volunteers were grouped according tofamily status (family vs. community) and spectrum diag-nosis. Use of DSM-III-R SSPD criteria yielded a samplecomposed of 53 non-SSPD and 17 SSPD family mem-bers, and 49 non-SSPD and 25 SSPD community partici-pants. Clinical and demographic information are shown intable 1 for the groups defined according to bothDSM-III-R and DSM-III-R minus one criteria (the mostcommon threshold reduction seen in the literature).
Ocular Motor Data Acquisition and Analysis. Both theeye-tracking task and ocular motor data acquisition andanalyses have been described in detail previously (seeThaker et al. 1998). Briefly, a target was presented on a15-inch flat monitor. A foveal-petal step-ramp was pre-sented followed by target motion in a horizontal plane,back and forth, at a constant velocity. One sweep acrossthe monitor (from -12° to +12° visual angle) constituted aramp. After approximately three to four ramps, the targetwas unpredictably masked (blanked out) for 500 ms.Targets were originally presented at three velocities (9.4°,14.0°, and 18.77sec). In the present study, only data fromtarget velocities previously shown to maximally discrimi-nate groups are presented (Thaker et al. 1998).
301
Dow
nloaded from https://academ
ic.oup.com/schizophreniabulletin/article/29/2/299/1899375 by guest on 25 February 2022
Schizophrenia Bulletin, Vol. 29, No. 2, 2003 M.T. Avila et al.
Table 1. Demographic and clinical characteristics of the sample
DSM-III-R Criteria
Community SSPD
Community non-SSPD
Family SSPD
Family non-SSPD
MINI Criteria
Community SSPD
Community non-SSPD
Family SSPD
Family non-SSPD
n
25
49
17
53
30
44
26
44
age
38.5 ±8.6
37.9 ±8.6
44.2 ±7.7
40.1 ±7.7
37.8 ± 8.5
38.3 ±8.6
43.5 ±8.1
39.7 ±7.4
Males (%)
60
53
53
42
60
52
54
39
MeanSchizotypal
4.24 ±1.69
0.78 ±1.3
3.82 ±1.67
0.90 ±1.30
4.20 ± 1.54
0.41 ± 0.76
3.54 ±1.61
0.47 ± 0.74
Number of SpectrumParanoid
1.60 ± 1.63
0.31 ±0.71
1.71 ± 1.93
0.48 ± 0.90
1.57 ± 1.59
0.18 ±0.46
1.42 ± 1.77
0.40 ± 0.76
TraitsSchizoid
3.28 ± 1.97
0.27 ± 0.60
3.59 ±2.18
0.44 ± 0.80
2.97 ±1.96
0.14 ±0.41
2.81 ±2.21
0.26 ±0.44
Note.—SSPD = schizophrenia spectrum disorders.
Eye-movement data were obtained using an infraredtechnique (at a sampling rate of 333 Hz and time constantof 4 ms) and 16-bit analogue-to-digital converter. The dig-ital data were filtered offline using a low pass filter at acutoff frequency of 75 Hz. Eye-movement records wereanalyzed using interactive software (Igor, Wavemetrics,Lake Oswega, OR). Saccades were identified based onvelocity (> 35°/sec) and acceleration (> 600°/sec2) criteria.Saccades and blinks were removed and replaced with lin-early interpolated data points.
Eye-Movement Measures. The following eye-movementmeasures were examined: (1) Predictive pursuit gain, whichis a measure of eye movements during the mask designed toassess predictive response based on extra-retinal motionprocessing (Thaker et al. 19966, 1998; Barnes et al. 2000);and (2) the ratio of leading (i.e., anticipatory) saccadic eyemovements to smooth pursuit eye movements during visibletarget motion. Predictive pursuit gain and the leading sac-cade ratio were chosen based on data from several studiessuggesting their superior sensitivity and specificity in identi-fying putative genetic risk (Avila et al. 2002).
Predictive pursuit gain. Predictive pursuit gain wascalculated from eye-movement data in the mask. Whenthe mask occurs during a ramp, the eye continues to moveat the same velocity as before the mask for about 130 to170 milliseconds—presumably still influenced by the pre-vious closed-loop response. After this initial period, thereis a 35 to 50 percent reduction in eye velocity—markingthe transition to predictive pursuit (Becker and Fuchs1985; Thaker et al. 1998). This transition point was iden-tified by algorithm using eye data filtered at 20 Hz. Theaverage eye velocity between the transition point and theend of the mask was used to calculate predictive pursuitgain (mask eye velocity divided by target velocity).
Leading saccades. Duplicate eye-movement records(filtered at 75 Hz) in which saccades were left intactwere used to measure leading saccades. Saccades wereidentified using Igor Pro and verified by visual inspec-tion (interrater reliabilities exceeded 0.95 [ICC]) accord-ing to the following criteria: saccades were classified asleading only if they (1) occurred in the direction of thetarget motion, (2) either began and ended ahead of thetarget or increased position error by 100 percent, and (3)were followed by at least a 50 ms interval of eye velocityless than 50 percent of target velocity. These criteria arebased on the work of Ross and colleagues (Ross et al.1998). Leading saccades were indexed by the percentageof total artifact free eye movements due to leading sac-cades—calculated by dividing the time spent in leadingsaccades by the total time in pursuit and multiplying thisratio by 100.
Statistical AnalysesFamily status X spectrum diagnosis. Analyses of
variance (ANOVAs) were used to verify that eye-trackingperformance was consistent across the three spectrum cat-egories (i.e., schizoid, paranoid, and schizotypal). Theseanalyses were conducted using both DSM and DSM minusone criteria. The results of these analyses are shown intable 2. Briefly, main effects of SSPD diagnosis were notsignificant in all cases except leading saccade scores—where individuals meeting full DSM criteria for schizo-typal personality disorder showed significantly lower lead-ing saccade scores compared with individuals meetingparanoid and/or schizoid diagnoses only. None of the fam-ily status by diagnosis interactions were significant. Themean number of traits for the 56 cases meeting DSMminus one criteria (called MINI below) was 8.3 + 2.4.Fifty-two of the 56 spectrum cases had traits associated
302
Dow
nloaded from https://academ
ic.oup.com/schizophreniabulletin/article/29/2/299/1899375 by guest on 25 February 2022

Boundaries of the Schizophrenia Spectrum Phenotype Schizophrenia Bulletin, Vol. 29, No. 2, 2003
Table 2. Comparison of Eye-Tracking Performance in Community and Family Participants MeetingParanoid and/or Schizoid vs. Schizotypal Criteria a> b
DSM-III-RC<1
Community spectrum (n = 25)
Family spectrum (n = 17)
MIN1ei
Community spectrum (n = 30)
Family spectrum (n = 26)
paranoid
p. gain
0.67 ± 0.21
0.47 ±0.16
0.70 ± 0.210.45 ±0.15
and/or schizoid
saccade
1.2 ±1.31.6 ±1.2
1.1 ±1.02.0 ±1.6
schizotypal
p. gain
0.67 ±0.190.42 ± 0.07
0.62 ±0.210.45 ±0.11
saccade
0.38 ±0.450.35 ±0.41
0.57 ± 0.941.4 ±2.20
a. Means and standard deviation are presented for predictive pursuit gain (p. gain) and the leading saccade ratio (saccade).b. 2 (family vs. community status) by 2 (paranoid/schizoid vs. schizotypal diagnosis) analyses of variance were used to determinewhether eye-tracking performance differed as a function of spectrum category.c. (DSM/Gain) Main effect of family status (family group exhibited lower pursuit gain scores), F(1,35) = 9.8, p = .004; No effect of DSMdiagnosis, F(1,35) < 1.0, p = .75; No family status by diagnosis interaction, F(1,35) < 1.0, p = .70.d. (DSM/Saccade) No effect of family status, F(1,37) < 1.0, p = .63; Main effect of DSM diagnosis (subjects with a schizotypal diagnosisexhibited lower saccade scores), F(1,37) = 8.1, p = .007; No family status by diagnosis interaction, F(1,37) < 1.0, p = .58.e. (MIN1/Gain) Main effect of family status (family group exhibited lower pursuit gain scores), F(1,48) = 14.8, p < .0005; No effect of diag-nosis, F(1,48) < 1.0, p = .43; No family status by diagnosis interaction, F(1,48) < 1.0, p = .48.f. (MIN1/Saccade) Main effect of family status (family group exhibited higher leading saccade scores, F(1,51) = 4.0, p = .05; No effect ofdiagnosis, F(1,51) = 1.6, p = .22; No family status by diagnosis interaction, F(1,51)<1.0, p = .95.
with more than one spectrum category (e.g., both schizoidand schizotypal traits). The lack of differences in eye-tracking performance across the three spectrum categoriesand the common co-occurrence of traits from the differentcategories among individual cases support the hypothe-sized association between neurophysiological abnormali-ties and schizophrenia across spectrum categories. Thus,in subsequent analyses, participants were classified as"SSPD" if they met criteria for any of the SSPD diag-noses.
Each participant was classified as either SSPD or non-SSPD using five different definitions: (1) DSM-III-R cri-teria (DSM); (2) DSM-III-R criteria with trait thresholdsreduced by one (MINI); (3) DSM-III-R with trait thresh-olds reduced by two (MINT); (4) DSM-III-R with thresh-olds reduced by three (MIN3); and (5) DSM SSPD diagno-sis based on the presence of any one spectrum trait (ANY).
To assess the impact of changes to DSM SSPD criteriaon observed differences in eye-tracking performancebetween SSPD relatives and the other groups, we adaptedSullivan-Pepe's method for comparing the strength of uni-variate associations with a single disease outcome amongdifferent risk factors (Sullivan-Pepe et al. 1999). For eachparticipant, five observations were generated—one corre-sponding to each method of defining SSPD. Using theSAS GLM (General Linear Model) procedure (SAS Insti-tute 1997), the following model was tested: eye-trackingscore = group (i.e., family status X SSPD diagnosis) +definition of SSPD + group X definition of SSPD. A sig-nificant group X definition interaction was interpreted asevidence that the magnitude of the differences among the
groups' eye-tracking performances differed according tohow SSPD was defined. The test of the main effect ofgroups compared the linear combination of eye-trackingscores (i.e., aggregated across definitions of SSPD) in eachof the four groups. Post hoc tests were used to compareeye-tracking performance in family SSPD participants tothat of participants in the other groups. To take intoaccount the correlations among repeated observationsfrom the same participants, models were fitted using thegeneralized estimating equations (GEE) method (Liangand Zeger 1986). The primary analysis comparedDSM-III-R criteria to MINI criteria. Exploratory analyseswere also performed using all five definitions of SSPD toidentify how far the criteria could be relaxed before eye-tracking differences among SSPD groups were signifi-cantly reduced. The two eye-tracking measures, predictivepursuit gain and leading saccade ratio, were analyzed sep-arately. Table 3 lists the group means and standard devia-tions for each eye-tracking measure based on the five defi-nitions of SSPD.
ResultsDoes the Use of MINI Criteria Affect GroupDifferences?
Predictive pursuit gain. Type 3 GEE analysis of thegroup X SSPD definition interaction did not achieve sta-tistical significance (x2
(3) = 6.84, p = 0.077). Thus, reduc-ing diagnostic thresholds by one did not significantlychange the pattern or magnitude of group differences inparameter estimates based on predictive pursuit gain. The
303
Dow
nloaded from https://academ
ic.oup.com/schizophreniabulletin/article/29/2/299/1899375 by guest on 25 February 2022

Schizophrenia Bulletin, Vol. 29, No. 2, 2003 M.T. Avila et al.
Table 3. Mean and Standard Deviations for Eye-tracking Measures in Each Diagnostic Scheme9
DSM-lll-R MINI MIN2 MIN3 ANY
community SSPD (n)b
predictive pursuit gain
leading saccades
community non-SSPD (n)
predictive pursuit gain
leading saccades
family SSPD (n)
predictive pursuit gain
leading saccades
family non-SSPD (n)
predictive pursuit gain
leading saccades
250.67±0.20
0.80±1.05
49
0.58±0.18
0.73±0.91
17
0.46±0.14
1.31 ±1.22
53
0.53±0.18
1.16±1.54
300.64±0.21
0.70±0.98
44
0.59±0.17
0.79±0.94
26
0.45±0.13
1.71 ±1.91
44
0.55±0.18
0.89±1.01
33
0.67±0.23
0.65±0.94
41
0.56±0.14
0.84±0.96
33
0.49±0.15
1.49±1.78
37
0.54±0.19
0.93±1.05
42
0.64±0.22
0.60±0.91
32
0.58±0.14
0.93±0.98
44
0.50±0.15
1.53±1.68
26
0.55±0.21
0.62±0.66
480.63±0.21
0.63±0.87
26
0.57±0.14
0.96±1.07
47
0.49±0.15
1.47±1.64
22
0.56±0.21
0.64±0.70
a. Mean and standard deviations for the 4 groups are presented for each diagnostic scheme.b. Changes in sample size for each diagnostic scheme are indicated for each group.
linear combination of predictive pursuit gain scores wassignificantly different among the groups (X2(3) = 13.36, p= 0.003). Least squares mean differences indicated thatthe family SSPD group exhibited lower combined scores(indicating poorer eye-tracking performance) comparedwith the family non-SSPD group (X2
(D = 4.19, p = 0.04),the community SSPD group (x2
(1) = 16.65, p < 0.001),and the community non-SSPD group (x2(i) = 10.20, p =0.01). These results are illustrated graphically in theboxed area of figure 1.
Leading saccades. The group X SSPD definition inter-action for leading saccades was not statistically significant(X2Q) = 7.36, p = 0.061)—suggesting that group differencesin the leading saccade ratio did not change after applyingMINI criteria. Combined leading saccade scores did not sig-nificantly differentiate the groups (x2p) = 5.78, p = 0.12).These results are illustrated graphically in the boxed area offigure 1.
The absence of significant group X SSPD interactionssupports the validity of using MINI criteria. However, oneshould note that both interactions were marginally signifi-cant (p = 0.08 and 0.06), and thus a tentative description ofthem may be informative. Post hoc analyses of the group XSSPD definition interaction suggests a statistical differencein predictive pursuit gain between the family non-SSPD andfamily SSPD groups at MINI criteria (x2
(1) = 6.14, p = 0.01)compared with no statistical effect for these groups usingDSM criteria (X2(i) = 2.31, p = 0.13). For leading saccades,statistical differences emerged between family SSPD andfamily non-SSPD (x2
(1) = 4.02, p = 0.05), family SSPD andcommunity non-SSPD (x2(i) = 5.43, p - 0.02), and familySSPD and community SSPD (x2
( 0 = 6.17, p = 0.01) at MINIcriteria. These differences were not evident using DSM crite-
ria (X2
(1) < 1.00,p = 0.73; x2(1) = 3.34,p = 0.07; X
2(1) = 2.06,
p = 0.15 respectively).
Pattern of Differences Across All Diagnostic SchemesPredictive pursuit gain. Analysis of residual predic-
tive pursuit gain including all definitions of SSPD {DSM toANY) yielded a significant main effect of group (X2(3) =13.11, p = 0.004)—thus the linear combination of pursuitgain scores was significantly different among the groups.The family SSPD group exhibited significantly lower(poorer) combined pursuit gain scores compared with com-munity SSPD (x2
(1) = 16.50, p < 0.001) and communitynon-SSPD (x2
(1) = 8.71, p = 0.003) groups. The family non-SSPD group exhibited significantly lower gain scores com-pared with the community SSPD group (x2(i) = 5.23, p =0.02), but not compared to the community non-SSPD group(X2
(1) < 1.00, p = 0.37). The group X SSPD definition inter-action was not statistically significant (x2(i2) = 18.19, p =0.11) aggregating across all definitions of SSPD.
Leading saccades. The test of the linear combinationof leading saccade scores was not statistically significant(X2
(3) = l.\l,p = 0.067). Thus aggregated across all defini-tions of SSPD, leading saccades did not significantly differ-entiate the groups. The group X SSPD definition interactionwas also not statistically significant (x2(n) = 17.65, p =0.13).
DiscussionThe continued presence of a putative marker of risk (inthis case eye-tracking deficit) among SSPD relativesdespite the application of more liberal diagnostic criteria(MINI) suggests that fewer traits are required than are cur-
304
Dow
nloaded from https://academ
ic.oup.com/schizophreniabulletin/article/29/2/299/1899375 by guest on 25 February 2022

Boundaries of the Schizophrenia Spectrum Phenotype Schizophrenia Bulletin, Vol. 29, No. 2, 2003
Figure 1. Group differences in eye tracking across definitions of SSPDA
0.700
c'5a
I13
0.650
0.600
0.550
0.500
0.450
0.400
1.800
1.600
1.400
1.200
1.000
§ 0.800
0.600
0.400
So00
DSMvs. MINI
• com norm,
—m— comsspd :
—A— f am norm
—M—famsspd
OSM-R-R mini mtn2 rrin3 any
ABoxed area highlights the DSMv. MINI comparison.Note.—com = community; fam = family.
rently employed by DSM to effectively identify the spec-trum phenotype. In practical terms, the data validate thepractice of reducing criteria in order to increase "high risk"sample size and subsequently increase the power to detectgroup differences in neurophysiological studies. For exam-ple, in the present study, the use of MINI criteria increasedthe family SSPD sample size from 17 to 26 (table 2). Thefact that neurophysiological "performance" was unaffectedby the change in criteria also suggests that the nine casesadded to the affected group were, in fact, affected. Thus, intheoretical terms, the use of MINI criteria may be useful in
reducing the number of false negatives made whenattempting to identify individuals at genetic risk based onthe presence of spectrum traits. The addition of affectedcases would serve to increase the power of genetic analy-ses. Results of the present study suggest that this can bedone without increasing false positives.
Preliminary support for this increasing sensitivitycan be seen in figure 1, which shows that group eye-tracking performances are relatively stable across thedifferent definitions of SSPD. This pattern is confirmedstatistically by the presence of group differences on the
305
Dow
nloaded from https://academ
ic.oup.com/schizophreniabulletin/article/29/2/299/1899375 by guest on 25 February 2022

Schizophrenia Bulletin, Vol. 29, No. 2, 2003 M.T. Avila et al.
linear combinations of eye-tracking scores aggregatedacross SSPD definitions. For the predictive pursuit gainmeasure, combined scores significantly differentiatedSSPD relatives from the community groups, but did notdifferentiate non-SSPD relatives from non-SSPD com-munity participants. Although not statistically signifi-cant (p = 0.067), the pattern of differences in the com-bined leading saccade scores was similar—based onleast squares differences, SSPD relatives exhibitedhigher combined scores compared with all other groups,while non-SSPD relatives were not significantly differ-ent from the community groups.
Interestingly, it appears that even the presence of oneSSPD trait increases the likelihood of carrying risk, asmarked by eye-tracking abnormality. For example, if wederive a cut score for normal vs. abnormal eye-trackingperformance and graph the percentage of SSPD relativesexhibiting this abnormality across definitions of SSPD(figure 2), we find that there is a relatively high proportionof abnormality among SSPD relatives (ranging from 23 to33% for predictive pursuit and from 18 to 23% for leadingsaccades), irrespective of how SSPD is defined. In fact, theSSPD "break" in terms of eye-tracking performanceappears to occur between family members exhibiting at
Figure 2. Percentage of SSPD family members exhibiting abnormal eye tracking across definitions ofSSPD1
40.0
35.0
30.0
I 25°o
10
2?
20.0
15.0
10.0
5.0
0.0dsm mini mkt2 m*n3 any notraHs community
sampto
predictive pusnit D leading saccades
Note.—SSPD = schizophrenia spectrum personality disorder1Cut scores for classifying eye-tracking performance as abnormal were empirically derived using logistic regression analysis. Modelswere run using family SSPD vs. community as the dichotomous outcome. Cut scores were calculated using the formula ln[p / (1 - p)] = c+ bx, where b is the eye-tracking measure parameter estimate from the logistic regression, c is the constant from the model, and p is theprobability cut score. Probability cut scores yielding approximately 90 percent specificity were chosen for each measure. Cut values forpredictive pursuit gain and leading saccades were 0.4025 and 2.031, respectively.
306
Dow
nloaded from https://academ
ic.oup.com/schizophreniabulletin/article/29/2/299/1899375 by guest on 25 February 2022

Boundaries of the Schizophrenia Spectrum Phenotype Schizophrenia Bulletin, Vol. 29, No. 2, 2003
least one spectrum trait and family members without spec-trum traits. These data suggest that this way of dividingfirst-degree relatives may prove informative in future neu-rophysiological studies of schizophrenia.
Analyses of the marginally significant group by defini-tion interactions for the DSM vs. MINI comparison provideanother reason to consider the use of reduced criteria in neu-rophysiological studies. Here we see that the conclusionsdrawn about the relationships between eye-tracking abnor-malities, familial association with schizophrenia, and thepresence of SSPD are different depending on the criteriaused. For example, using DSM criteria, one might concludethat familial association, rather than familial association inthe presence of SSPD, is related to abnormalities in predic-tive pursuit (i.e., family SSPD and family non-SSPD werenot different from each other on this measure using DSM cri-teria). However, using MINI criteria, one might suggest thatfamilial association and the presence of SSPD interact suchthat family non-SSPD groups perform worse than controls,and family SSPD groups perform worse than family non-SSPD. The latter conclusion based on MINI criteria is con-sistent with studies that have found that deficits are morelikely to occur or are more pronounced among relatives ofpatients with schizophrenia exhibiting spectrum traits com-pared with unaffected family members (Condray and Stein-hauer 1992; Thaker et al. 1996a, 1998; Kimble et al. 2000).
Conclusions
Although preliminary, the findings of the present studyhave important implications for how we define the spec-trum phenotype in future genetic and neurophysiologicalstudies of schizophrenia. Our data suggest that reducedcriteria may prevent the exclusion of likely genetic carriersfrom affected groups—leading to an increase in at-risksample sizes. Conversely, this strategy may prevent theinclusion of at-risk individuals in family groups assumedto be psychiatrically healthy and therefore at lower risk.The former misclassification could lead to a failure to findsignificant associations between SSPD diagnoses andschizophrenia (for example, in the case of schizoid and/orparanoid personality disorders); or a failure to find signifi-cant associations between SSPD and neurophysiologicaldeficits, while the latter misclassification could lead to anoverestimation of impaired neurophysiological function-ing in "normal" family members.
References
Adami, H.M.; Thaker, G.K.; Moran, M.J.; Cassady, S.L.;Heckner, C.L.; Lahti, A.C.; and Tamminga, C.A.Improved diagnosis of schizophrenia spectrum disorders
using a modified FH-RDC. [Abstract]. Biological Psychia-try, 27:112A, 1990.
American Psychiatric Association. DSM-III-R: Diagnos-tic and Statistical Manual of Mental Disorders. 3rd ed.,revised. Washington, DC: APA, 1987.
American Psychiatric Association. DSM-FV: Diagnosticand Statistical Manual of Mental Disorders. 4th ed. Wash-ington, DC: APA, 1994.
Andreasen, N.C.; Rice, J.; Endicott, J.; Reich, T.; andCoryell, W. The family history approach to diagnosis.How useful is it? Archives of General Psychiatry,43:421^129, 1986.
Avila, M.T.; McMahon, R.P.; Elliott, A.R.; and Thaker,G.K. Neurophysiological markers of vulnerability toschizophrenia: Sensitivity and specificity of specific quan-titative eye movement measures. Journal of AbnormalPsychology, 111:259-267,2002.
Barnes, G.R.; Barnes, D.M.; and Chakraborti, S.R. Ocularpursuit responses to repeated, single-cycle sinusoidsreveal behavior compatible with predictive pursuit. Jour-nal ofNeurophysiology, 84:2340-2355, 2000.Baron, M.; Gruen, R.; Asnis, L.; and Kane, L. Familialrelatedness of schizophrenia and schizotypal states. Amer-ican Journal of Psychiatry, 140(11): 1437-1442, 1983.
Baron, M.; Gruen, R.; Rainer, J.D.; Kane, J.; Asnis, L.; andLord, S. A family study of schizophrenic and normal con-trol probands: Implications for the spectrum concept ofschizophrenia. American Journal of Psychiatry,142(4):447-455, 1985.
Battaglia, M.; Bernardeschi, L.; Franchini, L.; Bellodi, L.;and Smeraldi, E. A family study of schizotypal disorder.Schizophrenia Bulletin, 21(1):33—45, 1995.
Battaglia, M.; Gasoerini, M.; Sciuto, G.; Scherillo, P.;Diaferia, G.; and Bellodi, L. Psychiatric disorders in thefamilies of schizotypal subjects. Schizophrenia Bulletin,17(4):659-668, 1991.
Battaglia, M., and Torgersen, S. Schizotypal disorder: Atthe crossroads of genetics and nosology. Ada PsychiatricaScandinavica, 94:303-310, 1996.
Becker, W., and Fuchs, A.F. Prediction in the oculomotorsystem: Smooth pursuit during transient disappearance ofa visual target. Experimental Brain Research, 57:562-575,1985.
Cadenhead, K.S.; Light, G.A.; Geyer, M.A.; and Braff, D.L.Sensory gating deficits assessed by the P50 event-relatedpotential subjects with schizotypal personality disorder.American Journal of Psychiatry, 157(l):55-59, 2000.
Chapman, L.J.; Chapman, J.P.; and Raulin, M.L. Scales ofphysical and social anhedonia. Journal of Abnormal Psy-chology, 85:374-382, 1976.
307
Dow
nloaded from https://academ
ic.oup.com/schizophreniabulletin/article/29/2/299/1899375 by guest on 25 February 2022

Schizophrenia Bulletin, Vol. 29, No. 2, 2003 M.T. Avila et al.
Chen, W.J.; Liu, S.K.; Chang, C.J.; Lien, Y.J.; Chang,Y.H.; and Hwu, H.G. Sustained attention deficit andschizotypal personality features in nonpsychotic relativesof schizophrenic patients. American Journal of Psychiatry,155(9): 1214-1220, 1998.
Clementz, B.A.; Reid, S.; McDowell, J.E.; and Caden-head, K.S. Abnormality of smooth pursuit eye movementinitiation: Specificity to the schizophrenia spectrum. Psy-chophysiology, 32:130-134, 1995.
Clementz, B.A.; Sweeney, J.A.; Hirt, M.; and Haas, G.Smooth pursuit gain and saccadic intrusions in first-degreerelatives of probands with schizophrenia. Journal ofAbnormal Psychology, 99:327-335, 1990.
Condray, R., and Steinhauer, S.R. Schizotypal personalitydisorder in individuals with and without schizophrenic rel-atives: Similarities and contrasts in neurocognitive andclinical functioning. Schizophrenia Research, 7(1):33^41,1992.
Ekelund, J.; Lichtermann, D.; Hovatta, I.; Ellonen, P.;Suvisaari, J.; Terwilliger, J.D.; Juvonen, H.; Varilo, T.;Arajarvi, R.; Kokko-Sahin, M.L.; Lonnqvist, J.; and Pel-tonen, L. Genome-wide scan for schizophrenia in theFinnish population: evidence for a locus on chromosome7q22. Human Molecular Genetics, 9(7):1049-1057,2000.
Faraone, S.V.; Kremen, W.S.; Lyons, M.J.; Pepple, J.R.;Seidman, L.J.; and Tsuang, M.T. Diagnostic accuracy andlinkage analysis: How useful are schizophrenia spectrumphenotypes? American Journal of Psychiatry,152(9): 1286-1290, 1995.
Keefe, R.S.E.; Silverman, J.M.; Mohs, R.C.; Siever, L.J.;Harvey, P.D.; Friedman, L.; Roitman, S.E.; DuPre, R.L.;Smith, C.J.; Schmeidler, J.; and Davis, K.L. Eye tracking,attention, and schizotypal symptoms in nonpsychotic rela-tives of patients with schizophrenia. Archives of GeneralPsychiatry, 54:169-176, 1997.
Kendler, K.S., and Gruenberg, A.M. An independentanalysis of the Danish Adoption Study of Schizophrenia.Archives of General Psychiatry, 41:555-564,1984.
Kendler, K.S.; Masterson, C.C.; Ungaro, R.; and Davis,K.L. A family history study of schizophrenia-related per-sonality disorder. American Journal of Psychiatry,141(3):424-427, 1994.
Kendler, K.S.; McGurie, M.; Gruenberg, A.M.; Spellman,M.; O'Hare, A.; and Walsh, D. The Roscommon FamilyStudy, II: The risk of nonschizophrenic non-affective psy-choses in relatives. Archives of General Psychiatry,50:645-652, 1993.
Kendler, K.S., and Walsh, D. Schizotypal personality dis-order in parents and the risk for schizophrenia in siblings.Schizophrenia Bulletin, 21(l):47-52, 1995.
Kety, S.S.; Wender, P.H.; Jacobsen, B.; Ingraham, L.J.;Jansson, L; Faber, B.; and Kinney, D.K. Mental illness inthe biological and adoptive relatives of schizophrenicadoptees: Replication of the Copenhagen Study in the restof Denmark. Archives of General Psychiatry,51(6):442-455, 1994.
Kimble, M.; Lyons, M.; O'Donnell, B.; Nestor, P.;Niznikiewicz, M.; and Toomey, R. The effect of familystatus and schizotypy on electrophysiologic measures ofattention and semantic processing. Biological Psychiatry,47(5):402^12, 2000.
Kunkel, R.; Adami, H.; Zetlmeisl, M.; Ross, D.E.; andThaker, G.K. Recruitment of non-patient volunteers withschizophrenia spectrum personality symptoms. Schizo-phrenia Research, 34:181-186, 1998.
Liang, K.Y., and Zeger, S.L. Longitudinal data analysis usinggeneralized linear models. Biometrika, 73:13-22,1986.
Lichtermann, D.; Karbe, E.; and Maier, W. The geneticepidemiology of schizophrenia and of schizophrenia spec-trum disorders. European Archives of Psychiatry and Clin-ical Neuroscience, 250(6):304-310, 2000.
Lyons, M.J.; Toomey, R.; Faraone, S.V.; and Tsuang, M.T.Comparison of schizotypal relatives of schizophrenic ver-sus affective probands. American Journal of MedicalGenetics, 54:279-285, 1994.
Maier, W.; Lichtermann, D.; Minges, J.; and Heun, R. Per-sonality disorders among the relatives of schizophreniapatients. Schizophrenia Bulletin, 20:481-493, 1994.
Niznikiewicz, M.A.; Voglmaier, M.M.; Shenton, M.E.;Dickey, C.C.; Seidman, L.J.; Teh, E.; Van Rhoads, R.; andMcCarley, R.W. Lateralized P3 deficit in schizotypal person-ality disorder. Biological Psychiatry, 48(7):702-705, 2000.
O'Driscoll, G.A.; Lenzenweger, M.F.; and Holzman, P.S.Antisaccades and smooth pursuit eye tracking and schizo-typy. Archives of General Psychiatry, 55(9):837-843,1998.
Pfohl, B.; Blum, N.; Zimmerman, M.; and Stangl, D.Structured Interview for DSM-II1-R Personality (SIDP-R). Iowa City, LA: Department of Psychiatry, University ofIowa, 1989.
Pulver, A.E.; Mulle, J.; Nestadt, G.; Swartz, K.L.; Blouin,J.L.; Dombroski, B.; Liang, K.Y.; Housman, D.E.; Kazaz-ian, H.H.; Antonarakis, S.E.; Lasseter, V.K.; Wolyniec,P.S.; Thornquist, M.H.; and McGrath, J.A. Genetic hetero-geneity in schizophrenia: Stratification of genome scandata using co-segregating related phenotypes. MolecularPsychiatry, 5(6):650-653, 2000.
Ross, R.G.; Olincy, A.; Harris, J.G.; Radant, A.; Adler,L.E.; and Freedman, R. Anticipatory saccades duringsmooth pursuit eye movements and familial transmissionof schizophrenia. Biological Psychiatry, 44:690-697,1998.
308
Dow
nloaded from https://academ
ic.oup.com/schizophreniabulletin/article/29/2/299/1899375 by guest on 25 February 2022

Boundaries of the Schizophrenia Spectrum Phenotype Schizophrenia Bulletin, Vol. 29, No. 2, 2003
Ross, R.G.; Olincy, A.; Harris, J.G.; Radant, A.; Hawkins,M.; Adler, L.E.; and Freedman, R. Evidence for bilinealinheritance of physiological indicators of risk in child-hood-onset schizophrenia. American Journal of MedicalGenetics, 88:188-199, 1999.
Ross, R.G.; Olincy, A.; Harris, J.G.; Sullivan, B.; andRadant, A. Smooth pursuit eye movements in schizophre-nia and attentional dysfunction: Adults with schizophre-nia, ADHD, and a normal comparison group. BiologicalPsychiatry, 48:197-203, 2000.
SAS Institute Inc. SAS/STAT Software: Changes andEnhancements through Releases 6.12. Cary, NC: SASInstitute Inc., 1997. 247-348.
Siever, L.J. Biological markers in schizotypal personalitydisorder. Schizophrenia Bulletin, ll(4):564-575, 1985.Siever, L.J.; Friedman, L.; Moskowitz, J.; Mitropoulou,V.; Keefe, R.; Roitman, S.L.; Merhige, D.; Trestman, R.;Silverman, J.; and Mohs, R. Eye movement impairmentand schizotypal psychopathology. American Journal ofPsychiatry, 151(8): 1209-1215, 1994.Siever, L.J.; Kalus, O.; and Keefe, R. The boundaries ofschizophrenia. The Psychiatric Clinics of North America,16:217-244, 1993.
Spitzer, R.L.; Williams, J.B.W.; Gibbon, M.; and First,M.B. Structured Clinical Interview for DSM III-R (SCID)PB. New York, NY: New York State Psychiatric Institute,Biometrics Research Department, 1990.
Squires-Wheeler, E.; Skodol, A.E.; Bassett, A.; and Erlen-meyer-Kimling, L. DSM-III-R schizotypal personalitytraits in offspring of schizophrenic disorder, affective dis-order, and normal control parents. Journal of PsychiatricResearch, 23:229-239, 1989.
Squires-Wheeler, E.; Skodol, A.E.; Friedman, D.; andErlenmeyer-Kimling, L. The specificity of DSM-IIIschizotypal personality traits. Psychological Medicine,18:757-765, 1988.
Stanley, M.A.; Turner, S.M.; and Borden, J.W. Schizotypalfeatures in obsessive-compulsive disorder. ComprehensivePsychiatry, 31:511-518, 1990.
Sullivan-Pepe, M.; Whitaker, R.C.; and Seidel, K. Esti-mating and comparing univariate associations with appli-cation to the prediction of adult obesity. Statistics in Medi-cine, 18:163-173, 1999.
Thaker, G.K. Defining the schizophrenia phenotype. Cur-rent Psychiatry Reports, 2(5):398^M)3, 2000.
Thaker, G.K.; Adami, H.; Moran, M.; Lahti, A.; and Cas-sady, S. Psychiatric illnesses in families of subjects withschizophrenia-spectrum personality disorders: High mor-bidity risks for unspecified functional psychoses andschizophrenia. American Journal of Psychiatry,150(l):66-71, 1993.
Thaker, G.K.; Cassady, S.; Adami, H.; Moran, M.; andRoss, D.E. Eye movements in spectrum personality disor-ders: Comparison of community subjects and relatives ofschizophrenic patients. American Journal of Psychiatry,153:362-68, 1996a.
Thaker, G.K.; Ross, D.E.; Buchanan, R.W.; Moran, M.J.;Lahti, A.; Kim, C.E.; and Medoff, D. Does pursuit abnor-mality in schizophrenia represent a deficit in the predictivemechanism? Psychiatry Research, 59:221-237, 1996/?.
Thaker, G.K.; Ross, D.E.; Cassady, S.L.; Adami, H.;LaPorte, D.E.; Medoff, D.R.; and Lahti, A. Smooth pursuiteye movements to extraretinal motion signals: Deficits inrelatives of patients with schizophrenia. Archives of Gen-eral Psychiatry, 55(9):830-836, 1998.
Tsuang, M.T. "Phenotypic expressions of the liability toschizophrenia." Plenary address at the International Con-gress on Schizophrenia Research, Whistler, BritishColumbia, April 30, 2001.
Acknowledgments
The authors wish to acknowledge the contributions ofHeather Langley, Lisa Cooper, and Amie Elliot, whoassisted in scoring and analyzing the eye-movement data.The authors wish to express a special thanks to the patientsand families of the Maryland Psychiatric Research Center.The work presented in this paper was supported byNational Institutes of Health grants MH49826 andMH40279.
The Authors
Matthew T. Avila, M.A., is Predoctoral Research Fellow;Helene M. Adami, L.C.S.W., is Clinical Director; andGunvant K. Thaker, M.D., is Chief, Schizophrenia RelatedDisorders Clinic, Maryland Psychiatric Research Center,Baltimore, MD. Robert P. McMahon, Ph.D., is Director ofthe Biostatistics and Data Management Core, MarylandPsychiatric Research Center.
309
Dow
nloaded from https://academ
ic.oup.com/schizophreniabulletin/article/29/2/299/1899375 by guest on 25 February 2022

Dow
nloaded from https://academ
ic.oup.com/schizophreniabulletin/article/29/2/299/1899375 by guest on 25 February 2022