using multimodal biosignal data from wearables to detect
TRANSCRIPT
Using Multimodal Biosignal Data fromWearables to DetectFocal Motor Seizures in Individual Epilepsy Patients
Sebastian Böttcher∗University Medical Center Freiburg
Freiburg, Germany
Nikolay V. ManyakovJanssen R & D, LCCBeerse, Belgium
Nino EpitashviliUniversity Medical Center Freiburg
Freiburg, Germany
Amos FolarinMark P. RichardsonKing’s College London
London, United Kingdom
Matthias DümpelmannAndreas Schulze-Bonhage
University Medical Center FreiburgFreiburg, Germany
Kristof Van LaerhovenUniversity of SiegenSiegen, Germany
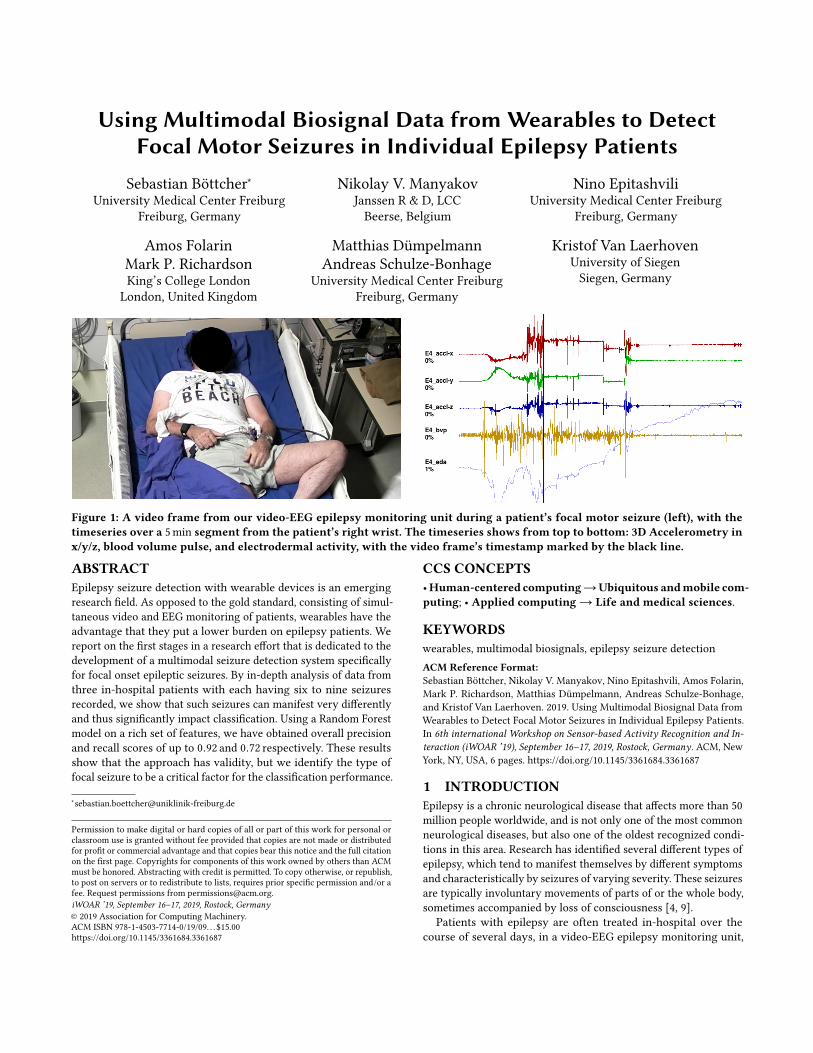
Figure 1: A video frame from our video-EEG epilepsy monitoring unit during a patient’s focal motor seizure (left), with thetimeseries over a 5min segment from the patient’s right wrist. The timeseries shows from top to bottom: 3D Accelerometry inx/y/z, blood volume pulse, and electrodermal activity, with the video frame’s timestamp marked by the black line.
ABSTRACTEpilepsy seizure detection with wearable devices is an emergingresearch field. As opposed to the gold standard, consisting of simul-taneous video and EEG monitoring of patients, wearables have theadvantage that they put a lower burden on epilepsy patients. Wereport on the first stages in a research effort that is dedicated to thedevelopment of a multimodal seizure detection system specificallyfor focal onset epileptic seizures. By in-depth analysis of data fromthree in-hospital patients with each having six to nine seizuresrecorded, we show that such seizures can manifest very differentlyand thus significantly impact classification. Using a Random Forestmodel on a rich set of features, we have obtained overall precisionand recall scores of up to 0.92 and 0.72 respectively. These resultsshow that the approach has validity, but we identify the type offocal seizure to be a critical factor for the classification performance.
Permission to make digital or hard copies of all or part of this work for personal orclassroom use is granted without fee provided that copies are not made or distributedfor profit or commercial advantage and that copies bear this notice and the full citationon the first page. Copyrights for components of this work owned by others than ACMmust be honored. Abstracting with credit is permitted. To copy otherwise, or republish,to post on servers or to redistribute to lists, requires prior specific permission and/or afee. Request permissions from [email protected] ’19, September 16–17, 2019, Rostock, Germany© 2019 Association for Computing Machinery.ACM ISBN 978-1-4503-7714-0/19/09. . . $15.00https://doi.org/10.1145/3361684.3361687
CCS CONCEPTS•Human-centered computing→Ubiquitous andmobile com-puting; • Applied computing→ Life and medical sciences.
KEYWORDSwearables, multimodal biosignals, epilepsy seizure detectionACM Reference Format:Sebastian Böttcher, Nikolay V. Manyakov, Nino Epitashvili, Amos Folarin,Mark P. Richardson, Matthias Dümpelmann, Andreas Schulze-Bonhage,and Kristof Van Laerhoven. 2019. Using Multimodal Biosignal Data fromWearables to Detect Focal Motor Seizures in Individual Epilepsy Patients.In 6th international Workshop on Sensor-based Activity Recognition and In-teraction (iWOAR ’19), September 16–17, 2019, Rostock, Germany. ACM, NewYork, NY, USA, 6 pages. https://doi.org/10.1145/3361684.3361687
1 INTRODUCTIONEpilepsy is a chronic neurological disease that affects more than 50million people worldwide, and is not only one of the most commonneurological diseases, but also one of the oldest recognized condi-tions in this area. Research has identified several different types ofepilepsy, which tend to manifest themselves by different symptomsand characteristically by seizures of varying severity. These seizuresare typically involuntary movements of parts of or the whole body,sometimes accompanied by loss of consciousness [4, 9].
Patients with epilepsy are often treated in-hospital over thecourse of several days, in a video-EEG epilepsy monitoring unit,

iWOAR ’19, September 16–17, 2019, Rostock, Germany Böttcher, et al.
which is the current gold standard for diagnosis and monitoring ofthe epileptic condition. At home however, patients are not objec-tively observed and usually resort to keeping a diary of seizures.These diaries often prove to be incomplete and unreliable, especiallywhen epileptic seizures are accompanied with loss of conscious-ness [1, 3]. Since a 24/7 continuous video-EEG is unpractical foroutpatient studies and personal monitoring, wearables have beenstudied as an attractive alternative to detect and log seizures ofepilepsy patients in their day-to-day environment.
The fewwearable devices that thus far have been used in epilepsyresearch are most commonly smartwatch-like devices or fitnesstrackers that record biosignals such as accelerometry (ACC), elec-trodermal activity (EDA), blood pulse via photoplethysmography(PPG), and electromyography (EMG). These biosignals have beenshown to give sufficient indication towards epileptic seizures, withresearch focusing on monomodal and multimodal detection of Gen-eralized Tonic-Clonic Seizures (or GTCS). GTCS are one type ofseizure that involves both hemispheres of the brain and presentthemselves in violent bilateral muscle contractions of the wholebody. These are very different from Focal Seizures (FS), which startin only one brain hemisphere and can present themselves in a num-ber of different symptoms that are far harder to characterise. Otherresearch has explored the detection of FS with wearable data, how-ever a majority of these efforts have focused on detecting a specifictype of FS only, often by using a single modality.
Thiswork proposes amultimodal approach to detect Focal Seizures(FS), which has thus far been a new and underexplored avenue inepileptic seizure detection. It offers a first analysis into the chal-lenges that lie ahead, especially in the analysis of the various sub-types of FS and the implications this holds for classification tasks inparticular. In the following, the current state of the art in epilepticseizure detection with wearables is explored, followed by the intro-duction of a new data set of biosignal data from wearables worn bythree in-hospital patients that were monitored with video-EEG ina medical epilepsy monitoring unit, along with wearable sensors.This paper focuses specifically on showing the difficulties that mayarise when implementing a multimodal seizure detection pipelinefor variable types of seizures, using common biosignals such asACC, EDA and PPG. The detection of seizures from three selectedpatients is evaluated, and the results are analysed. Concluding, anoutlook on the development of the detection pipeline is given.
2 RELATEDWORKWe structure this section on research work in the detection ofepileptic seizures along the two main types of seizures, GeneralizedTonic-Clonic Seizures (GTCS) and Focal Seizures (FS), as most re-search to date has explicitly focused on one or the other. Monitoringthese two types of seizures has also shown to require very differentmodalities.
Generalized Tonic-Clonic Seizures (GTCS). Due to the se-vere manifestation in body and especially limb movements, GTCSare relatively easy and straightforward to detect using standardwearable biosignals like accelerometry or electromyography (EMG).Moreover, GTCS are a significant risk factor in sudden unexpecteddeath in epilepsy (SUDEP), raising interest in the automatic detec-tion of this type of seizures, especially in an ambulatory setting [14].
There are various examples of GTCS detection in literature, bothwith monomodal and multimodal data.
One basic approach for example is evaluated by Kusmakar et.al. [7] who use accelerometry data from a wrist-worn wearable todetect short-length GTCS in 12 patients. Their approach with asupport vector method and standard time domain features achievesa sensitivity of 95 % and false alarm rate (FAR) of 0.7/24 h. Hal-ford et. al. [5] on the other hand use an upper arm wearable thatrecords surface EMG signals on 199 patients with epilepsy. Theirthresholding method detects 76 % of overall GTCS, with a FAR of2.5/24 h. However they also distinguished between properly andimproperly placed devices, reporting that among properly placeddevices 100 % of GTCS were detected with a FAR of 1.4/24 h. Theyconclude that proper placement of the device is important. EDAand ACC signals are used for example by Poh et. al. [11] to detect94 % of GTC seizures in a data set from 80 patients, with a FAR of0.7/24 h. More recently, Regalia et. al. [13] also used EDA and ACCsignals to detect GTCS, attaining a sensitivity of greater than 92 %with a FAR between 0.2 and 1 on varying data sets of inpatient andoutpatient studies.
Focal Seizures (FS). Also known as partial seizures, FS areseizures that have their source in one of the brains hemispheres, asopposed to GTCS which spread over both. FS are therefore usuallynot accompanied by severe motoric reactions of the body like inGTCS, but rather manifest in a multitude of different symptoms:These can include autonomous reactions like heart rate increase(tachycardia), dyscognitive features like impaired awareness or un-consciousness, less severe motoric components, or so-called auras,which are sensory phenomenons such as deja vu sensations ordizziness. During the course of one FS, multiple of these symptomsmay occur consecutively or simultaneously.
In literature, the detection of FS with wearables has been at-tracting more attention in the recent past. Some research studieshave considered single modalities to detect FS of specific types.Jeppsen et. al. [6] for example look at heart rate variability fromECG for 17 patients, detecting 74 % of seizures with their method.Poh et. al. [10] on the other hand use an EDA sensor to analyzeautonomic changes during and especially after FS and GTCS, con-cluding that the EDA response after GTCS is much more severeand prolonged than in FS. A different approach is taken by Vande-casteele et. al. [15], who compare wearable ECG and PPG devicesin the detection performance of temporal lobe epileptic seizures,which are a type of FS. They report sensitivities of 70 % for ECGand 32 % for PPG detection, with FARs of 2.1/24 h and 1.8/24 h,respectively.
Recently, some studies have also expanded to multimodal de-tection of FS. Cogan et. al. [2] for example propose a multi-stageddetection system that uses heart rate, arterial oxygenation, ACC,EDA and temperature data, detecting 100 % of FS in the sensor read-ings from nearly all 10 patients their data set consists of. However,they do not specify further what type of FS they worked with, onlyreferring to the detected seizures complex partial, an older termfor focal seizures. The work presented here is most comparablewith that of Onorati et. al. [8], who use EDA and ACC data from69 patients to detect GTCS as well as FS, comparing three differentclassification methods. Their best performing method reaches asensitivity of 95 %, with a FAR of 0.2/24 h and a F-score of 0.67 in
Using Multimodal Biosignal Data from Wearables to Detect Focal Motor Seizures in Individual Epilepsy Patients iWOAR ’19, September 16–17, 2019, Rostock, Germany
cross-validation. However, their data set of 55 convulsive seizuresonly includes six focal seizures.
Among the above research works, there are several studies inliterature that present monomodal and multimodal seizure detec-tion on large data sets, however, these are often very generalizedin what seizure types are included. The distinction between GTCSand FS is often made, but subtypes within FS are rarely investi-gated or separated in the annotation. The work presented hereillustrates the breadth of FS by focusing specifically on the multi-modal detection of three distinct types of focal motor seizures inthree individual patients and therein identifies difficulties that mayarise when analysing a larger data set of focal seizures. Further-more, we explore a way of feature extraction that enables usingmultimodal data with multiple different window sizes per modality.In other studies only a single window size with a fixed overlap permodality is commonly used.
3 DATA SETThe evaluation presented here uses selected data that are taken froman ongoing clinical study. In this study, epilepsy patients that arecontinuously monitored in epilepsy monitoring units at two studysites (two academic hospitals) are recruited and asked to wear awearable wristband device, the Empatica E4, and a wearable upper-arm device, the Biovotion Everion. Both sensor units are recordingACC (32Hz/50Hz), EDA (4Hz/1Hz), and PPG (64Hz/50Hz) datacontinuously. The goal of the study is to capture a variable setof seizures for a population of at least n = 200 patients, whilerecording at least one seizure for m = 96 patients. The study isdivided across two clinical sites, King’s College London (UK) andthe University Medical Center in Freiburg (Germany).
The ground truth for seizure labeling is provided by a clinicallytrained expert, who browses through the video-EEG recordingsfrom the epilepsy monitoring unit and manually marks seizureonset and offset, as well as timings of various seizure phases, such astonicmovement, clonicmovement, tachycardia, or unconsciousness.Patients are typically recorded for stretches of 5 to 7 days, and tendto suffer from any type of epilepsy. At the time of this writing, thedata set has collected data from 174 patients from both sites, with276 complete seizures recorded from 70 patients, respectively.
3.1 Selection of three casesFor the preliminary evaluation presented here, only a select set ofparticipants in the study is considered from a single site, as threerepresentative cases that we wish to investigate. For each of thethree patients in question, more than five FS with varying typesof motoric components were recorded, and these patients wereselected for their different seizure manifestations: One patient ex-hibits highly characteristic tonic arm movements that are clearlydistinguishable on the raw ACC signal. The second patient haspredominantly automatisms in their arms, which are often randommovements of the limb that can be classified as neither tonic norclonic. The third patient also has automatisms, however these arenot located in the arms, but rather –more challenging for seizure de-tection – in the legs and also mouth region (oroalimentary). Amongthe three selected patients, a total of 22 seizures had motor features,and most of them also had autonomic or dyscognitive features, or
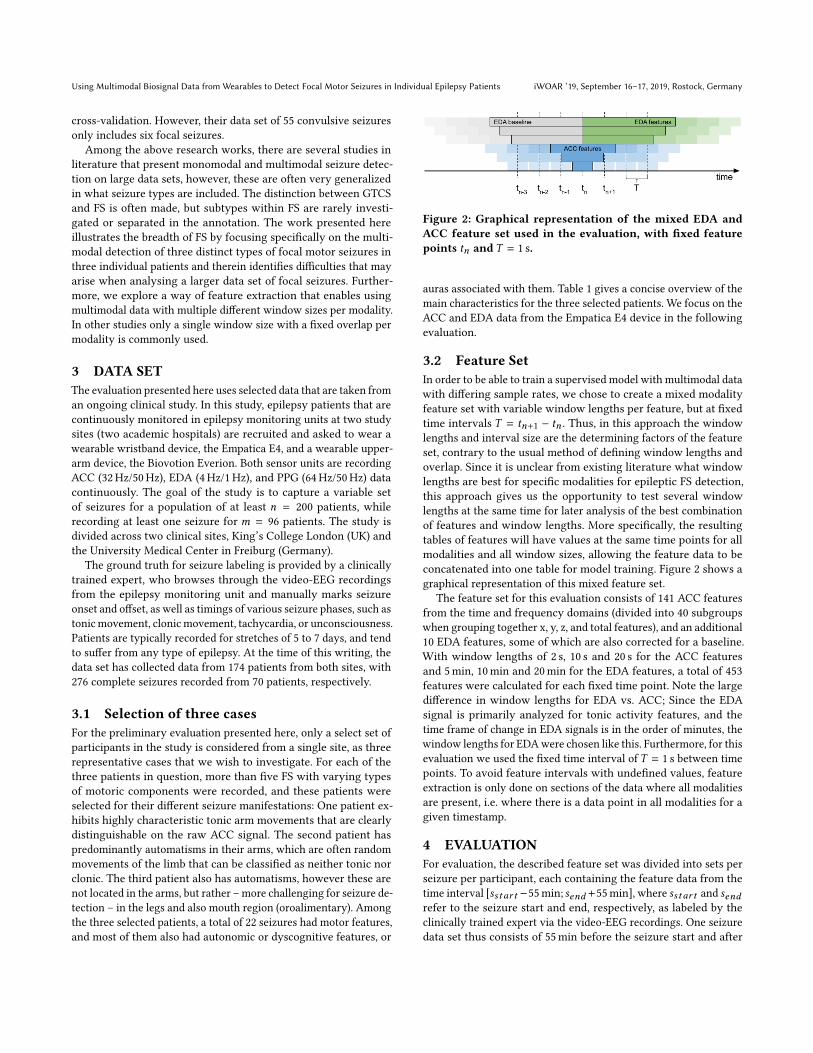
Figure 2: Graphical representation of the mixed EDA andACC feature set used in the evaluation, with fixed featurepoints tn and T = 1 s.
auras associated with them. Table 1 gives a concise overview of themain characteristics for the three selected patients. We focus on theACC and EDA data from the Empatica E4 device in the followingevaluation.
3.2 Feature SetIn order to be able to train a supervised model with multimodal datawith differing sample rates, we chose to create a mixed modalityfeature set with variable window lengths per feature, but at fixedtime intervals T = tn+1 − tn . Thus, in this approach the windowlengths and interval size are the determining factors of the featureset, contrary to the usual method of defining window lengths andoverlap. Since it is unclear from existing literature what windowlengths are best for specific modalities for epileptic FS detection,this approach gives us the opportunity to test several windowlengths at the same time for later analysis of the best combinationof features and window lengths. More specifically, the resultingtables of features will have values at the same time points for allmodalities and all window sizes, allowing the feature data to beconcatenated into one table for model training. Figure 2 shows agraphical representation of this mixed feature set.
The feature set for this evaluation consists of 141 ACC featuresfrom the time and frequency domains (divided into 40 subgroupswhen grouping together x, y, z, and total features), and an additional10 EDA features, some of which are also corrected for a baseline.With window lengths of 2 s, 10 s and 20 s for the ACC featuresand 5min, 10min and 20min for the EDA features, a total of 453features were calculated for each fixed time point. Note the largedifference in window lengths for EDA vs. ACC; Since the EDAsignal is primarily analyzed for tonic activity features, and thetime frame of change in EDA signals is in the order of minutes, thewindow lengths for EDAwere chosen like this. Furthermore, for thisevaluation we used the fixed time interval of T = 1 s between timepoints. To avoid feature intervals with undefined values, featureextraction is only done on sections of the data where all modalitiesare present, i.e. where there is a data point in all modalities for agiven timestamp.
4 EVALUATIONFor evaluation, the described feature set was divided into sets perseizure per participant, each containing the feature data from thetime interval [sstar t −55min; send +55min], where sstar t and sendrefer to the seizure start and end, respectively, as labeled by theclinically trained expert via the video-EEG recordings. One seizuredata set thus consists of 55min before the seizure start and after
iWOAR ’19, September 16–17, 2019, Rostock, Germany Böttcher, et al.
Table 1: The selected participants for this evaluation. n = amount of seizures recorded. Seizure type are the most commontypes among n, where seizures can have multiple sub-types. All seizures have the "motor" sub-type, indicating motoric com-ponents during the seizure. auto. = autonomic components, like tachycardia. dyscog. = dyscognitive components, like loss ofconsciousness. aura = aware seizure, usually with a specific associated feeling.
P n Data Seizure Type Comment1 6 ACC/EDA FS motor; FS auto.; FS dyscog. Characteristic motor seizures with tonic/clonic arm movement2 9 ACC/EDA FS motor; FS auto. Motor seizures with automatisms (most with arm movements)3 7 ACC/EDA FS motor; FS auto.; aura Motor seizures with only automatisms (few with arm movements)
Table 2: Mean results (after 20 repetitions) of leave-one-seizure-out cross-validation using a Random Forest model(t = 50). Shown are precision (p), recall (r), and F1-score (f)for both sets of experiments and the three patients we havefocused on in this paper (p1, p2, and p3).
first experiment second experimentp1 r1 f1 p2 r2 f2
P1 0.78 0.5 0.56 0.92 0.7 0.77P2 0.73 0.7 0.71 0.72 0.72 0.71P3 0.29 0.22 0.19 0.42 0.28 0.28
the seizure end, as well as the duration of the seizure itself, whichfor the 22 seizures of the three selected patients had a mean of1min 55 s. Thus, one seizure accounts for approximately 112min ofdata, amounting to approximately 41 h of data for all seizures of thethree selected patients. The 55min margin was chosen due to thelarge EDA window sizes and characteristically long EDA responsetime. Typical EDA response times can last up to an hour after theactual seizure has ended [10].
On these seizure sets per individual patient, binary leave-one-seizure-out cross-validation was performed, using a Random Forestmodel with t = 50 trees. The evaluation was done sample-wise, i.e.each time point is classified as either belonging to a seizure or not.The cross-validation for each patient was repeated 20 times to give aconfident idea of the Random Forest model performance. Addition-ally, a second round of tests was done, where the interval for the fea-ture data now is [sstar t−55min; send ]+[send+5min; send+55min],thus excluding data from detection for 5min after a seizure wasalready recognized. This can be seen as the simulation of a post-detection pause of data analysis, which prevents false positive detec-tions resulting from large uncertainty in data following immediatelyafter a seizure.
Before the scoring of the tests, the predicted labels are smoothedby a hysteresis function with a threshold of 10 s. Effectively, thismeans all consecutive positive predictions of less than 10 s aredisregarded, and all consecutive negative predictions of less than10 s within a larger positive block are still regarded as positive. Theresults for all tests can be found in Table 2 and will be discussed inthe following.
5 DISCUSSIONSince this is a sample-wise cross-validation, the scores from thisevaluation give an overview of the performance of the RandomForest model with respect to the classification of seizure status for
each second in the test data sets; As opposed to event-based clas-sification which would give an overview of the performance withrespect to the classification of overall seizure events. Furthermore,since for this sample-based evaluation the train and test sets arehighly unbalanced, only precision, recall and F1-score are regardedas measures. The imbalance derives from the choice of seizure dataset, i.e. data for one seizure includes 55min of negative data beforeand after the seizure that typically has a length of < 5min, with amean of 1min 55 s for our selected seizures, or 1.7 % compared tonegative data.
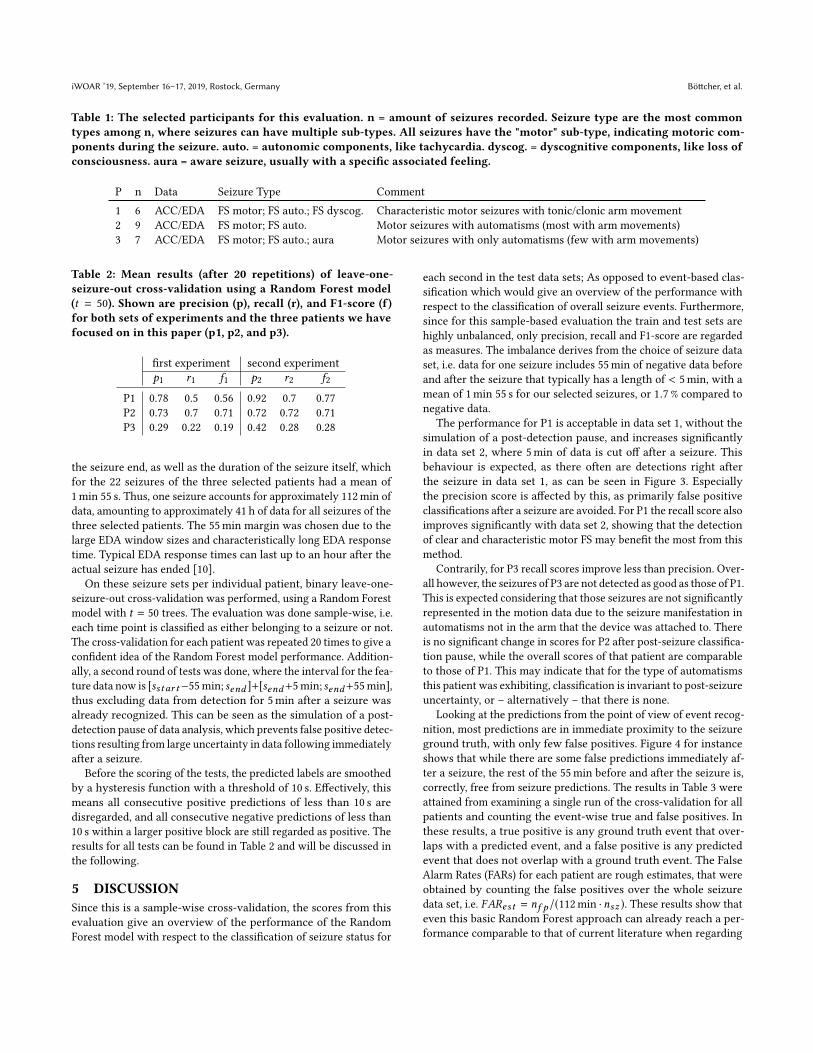
The performance for P1 is acceptable in data set 1, without thesimulation of a post-detection pause, and increases significantlyin data set 2, where 5min of data is cut off after a seizure. Thisbehaviour is expected, as there often are detections right afterthe seizure in data set 1, as can be seen in Figure 3. Especiallythe precision score is affected by this, as primarily false positiveclassifications after a seizure are avoided. For P1 the recall score alsoimproves significantly with data set 2, showing that the detectionof clear and characteristic motor FS may benefit the most from thismethod.
Contrarily, for P3 recall scores improve less than precision. Over-all however, the seizures of P3 are not detected as good as those of P1.This is expected considering that those seizures are not significantlyrepresented in the motion data due to the seizure manifestation inautomatisms not in the arm that the device was attached to. Thereis no significant change in scores for P2 after post-seizure classifica-tion pause, while the overall scores of that patient are comparableto those of P1. This may indicate that for the type of automatismsthis patient was exhibiting, classification is invariant to post-seizureuncertainty, or – alternatively – that there is none.
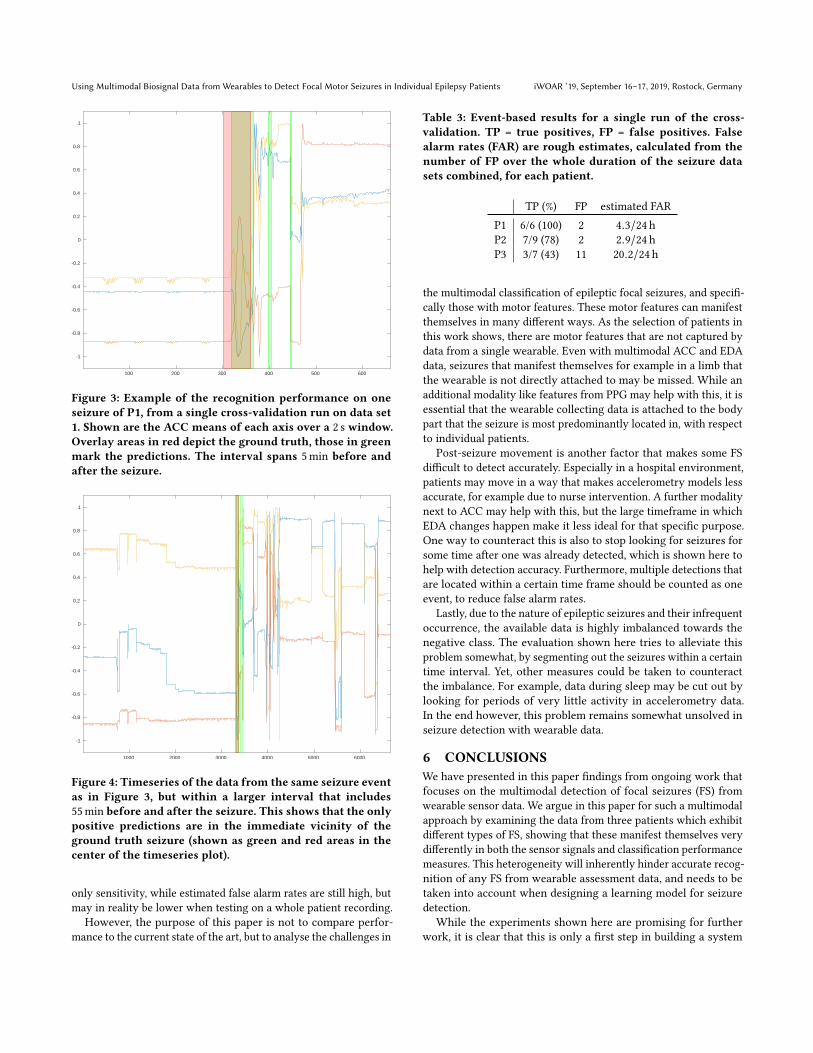
Looking at the predictions from the point of view of event recog-nition, most predictions are in immediate proximity to the seizureground truth, with only few false positives. Figure 4 for instanceshows that while there are some false predictions immediately af-ter a seizure, the rest of the 55min before and after the seizure is,correctly, free from seizure predictions. The results in Table 3 wereattained from examining a single run of the cross-validation for allpatients and counting the event-wise true and false positives. Inthese results, a true positive is any ground truth event that over-laps with a predicted event, and a false positive is any predictedevent that does not overlap with a ground truth event. The FalseAlarm Rates (FARs) for each patient are rough estimates, that wereobtained by counting the false positives over the whole seizuredata set, i.e. FARest = nf p/(112min ·nsz ). These results show thateven this basic Random Forest approach can already reach a per-formance comparable to that of current literature when regarding
Using Multimodal Biosignal Data from Wearables to Detect Focal Motor Seizures in Individual Epilepsy Patients iWOAR ’19, September 16–17, 2019, Rostock, Germany
100 200 300 400 500 600
-1
-0.8
-0.6
-0.4
-0.2
0
0.2
0.4
0.6
0.8
1
Figure 3: Example of the recognition performance on oneseizure of P1, from a single cross-validation run on data set1. Shown are the ACC means of each axis over a 2 s window.Overlay areas in red depict the ground truth, those in greenmark the predictions. The interval spans 5min before andafter the seizure.
1000 2000 3000 4000 5000 6000
-1
-0.8
-0.6
-0.4
-0.2
0
0.2
0.4
0.6
0.8
1
Figure 4: Timeseries of the data from the same seizure eventas in Figure 3, but within a larger interval that includes55min before and after the seizure. This shows that the onlypositive predictions are in the immediate vicinity of theground truth seizure (shown as green and red areas in thecenter of the timeseries plot).
only sensitivity, while estimated false alarm rates are still high, butmay in reality be lower when testing on a whole patient recording.
However, the purpose of this paper is not to compare perfor-mance to the current state of the art, but to analyse the challenges in
Table 3: Event-based results for a single run of the cross-validation. TP = true positives, FP = false positives. Falsealarm rates (FAR) are rough estimates, calculated from thenumber of FP over the whole duration of the seizure datasets combined, for each patient.
TP (%) FP estimated FARP1 6/6 (100) 2 4.3/24 hP2 7/9 (78) 2 2.9/24 hP3 3/7 (43) 11 20.2/24 h
the multimodal classification of epileptic focal seizures, and specifi-cally those with motor features. These motor features can manifestthemselves in many different ways. As the selection of patients inthis work shows, there are motor features that are not captured bydata from a single wearable. Even with multimodal ACC and EDAdata, seizures that manifest themselves for example in a limb thatthe wearable is not directly attached to may be missed. While anadditional modality like features from PPG may help with this, it isessential that the wearable collecting data is attached to the bodypart that the seizure is most predominantly located in, with respectto individual patients.
Post-seizure movement is another factor that makes some FSdifficult to detect accurately. Especially in a hospital environment,patients may move in a way that makes accelerometry models lessaccurate, for example due to nurse intervention. A further modalitynext to ACC may help with this, but the large timeframe in whichEDA changes happen make it less ideal for that specific purpose.One way to counteract this is also to stop looking for seizures forsome time after one was already detected, which is shown here tohelp with detection accuracy. Furthermore, multiple detections thatare located within a certain time frame should be counted as oneevent, to reduce false alarm rates.
Lastly, due to the nature of epileptic seizures and their infrequentoccurrence, the available data is highly imbalanced towards thenegative class. The evaluation shown here tries to alleviate thisproblem somewhat, by segmenting out the seizures within a certaintime interval. Yet, other measures could be taken to counteractthe imbalance. For example, data during sleep may be cut out bylooking for periods of very little activity in accelerometry data.In the end however, this problem remains somewhat unsolved inseizure detection with wearable data.
6 CONCLUSIONSWe have presented in this paper findings from ongoing work thatfocuses on the multimodal detection of focal seizures (FS) fromwearable sensor data. We argue in this paper for such a multimodalapproach by examining the data from three patients which exhibitdifferent types of FS, showing that these manifest themselves verydifferently in both the sensor signals and classification performancemeasures. This heterogeneity will inherently hinder accurate recog-nition of any FS from wearable assessment data, and needs to betaken into account when designing a learning model for seizuredetection.
While the experiments shown here are promising for furtherwork, it is clear that this is only a first step in building a system

iWOAR ’19, September 16–17, 2019, Rostock, Germany Böttcher, et al.
for multimodal detection of FS using biosignal data from wearables.The results in Table 2 show that while this approach may workfor individual patients with characteristic, motoric seizure man-ifestation, it may not work for patients exhibiting other seizuretypes. Furthermore, comparing the results of the first and secondexperiments shows that ignoring a certain amount of time after aseizure detection can significantly improve the detection perfor-mance. While the evaluation shown here is based on sample-wisescoring, a fully implemented system has to be based on events,i.e. consecutive positive predictions must be consolidated into oneseizure event, which would be scored as a hit if it has some overlapwith a ground truth event. An outlook on such a system is given bythe results in Table 3, showing the performance of the presentedsystem when scored on an event basis.
The selection of three specific patients with focal motor seizuresillustrates some core problems that a more advanced detectionsystem needs to deal with. In the future, the cross-patient seizuredetection of such a system needs to be evaluated as well. Whileindividual based detection is one possible approach, the need forgeneralized models is apparent, and current state-of-the-art movesin the direction of individual-invariant models. Furthermore, asystem’s performance on different types of seizures like autonomicor dyscognitive FS needs to be evaluated. Therefore, PPG featuresneed to be considered in addition to the ACC and EDA featuresalready implemented. Multi-class classification of seizure types,and specifically recognition of phases within focal seizures arereasonable goals that may be achieved by a detection system thattakes into account the high variance in focal seizure manifestationsshown in this paper.
ACKNOWLEDGMENTSThis work is part of the collaborative EU research project RADAR-CNS. The RADAR-CNS project has received funding from the Inno-vative Medicines Initiative 2 Joint Undertaking under grant agree-ment No 115902. This Joint Undertaking receives support fromthe European Union’s Horizon 2020 research and innovation pro-gramme and EFPIA. (www.imi.europa.eu, www.radar-cns.org)
Wewould also especially like to thank the whole team at RADAR-base, who provided the technical architecture that was used herefor data collection and processing [12]. (www.radar-base.org)
DISCLAIMERThis communication reflects the views of the RADAR-CNS consor-tium and neither IMI nor the European Union and EFPIA are liablefor any use that may be made of the information contained herein.
REFERENCES[1] DE Blum, J Eskola, JJ Bortz, and RS Fisher. 1996. Patient awareness of seizures.
Neurology 47, 1 (jul 1996), 260–264. https://doi.org/10.1212/wnl.47.1.260[2] D Cogan, J Birjandtalab, M Nourani, J Harvey, and V Nagaraddi. 2017. Multi-
Biosignal Analysis for Epileptic Seizure Monitoring. International Journal of Neu-ral Systems 27, 01 (feb 2017), 1650031. https://doi.org/10.1142/s0129065716500313
[3] MJ Cook, TJ O'Brien, SF Berkovic, M Murphy, A Morokoff, G Fabinyi, W D'Souza,R Yerra, J Archer, L Litewka, S Hosking, P Lightfoot, V Ruedebusch, WD Sheffield,D Snyder, K Leyde, and D Himes. 2013. Prediction of seizure likelihood with along-term, implanted seizure advisory system in patients with drug-resistantepilepsy: a first-in-man study. The Lancet Neurology 12, 6 (jun 2013), 563–571.https://doi.org/10.1016/s1474-4422(13)70075-9
[4] RS Fisher, JH Cross, JA French, N Higurashi, E Hirsch, FE Jansen, L Lagae, SLMoshé, J Peltola, ER Perez, IE Scheffer, and SM Zuberi. 2017. Operational classifi-cation of seizure types by the International League Against Epilepsy: PositionPaper of the ILAE Commission for Classification and Terminology. Epilepsia 58,4 (mar 2017), 522–530. https://doi.org/10.1111/epi.13670
[5] JJ Halford, MR Sperling, DR Nair, DJ Dlugos, WO Tatum, J Harvey, JA French, JRPollard, E Faught, KHNoe, TRHenry, GM Jetter, OV Lie, LCMorgan,MRGirouard,DP Cardenas, LE Whitmire, and JE Cavazos. 2017. Detection of generalized tonic-clonic seizures using surface electromyographic monitoring. Epilepsia 58, 11 (oct2017), 1861–1869. https://doi.org/10.1111/epi.13897
[6] J Jeppesen, S Beniczky, P Johansen, PS, and A Fuglsang-Frederiksen. 2015. Detec-tion of epileptic seizures with a modified heart rate variability algorithm basedon Lorenz plot. Seizure 24 (jan 2015), 1–7. https://doi.org/10.1016/j.seizure.2014.11.004
[7] S Kusmakar, CK Karmakar, B Yan, TJ O’Brien, R. Muthuganapathy, and M.Palaniswami. 2017. Detection of generalized tonic-clonic seizures using shortlength accelerometry signal. In Proc. 39th Annual Int. Conf. of the IEEE Engineeringin Medicine and Biology Society (EMBC). 4566–4569. https://doi.org/10.1109/EMBC.2017.8037872
[8] F Onorati, G Regalia, C Caborni, M Migliorini, D Bender, M-Z Poh, C Frazier, EKThropp, ED Mynatt, J Bidwell, R Mai, WC LaFrance, AS Blum, D Friedman, TLoddenkemper, FMohammadpour-Touserkani, C Reinsberger, S Tognetti, and RWPicard. 2017. Multicenter clinical assessment of improved wearable multimodalconvulsive seizure detectors. Epilepsia 58, 11 (oct 2017), 1870–1879. https://doi.org/10.1111/epi.13899
[9] World Health Organization. 2019. Epilepsy. Retrieved 2 May 2019 from https://www.who.int/en/news-room/fact-sheets/detail/epilepsy.
[10] MZ Poh, T Loddenkemper, C Reinsberger, NC Swenson, S Goyal, JR Madsen, andRW Picard. 2012. Autonomic changes with seizures correlate with postictal EEGsuppression. Neurology 78, 23 (apr 2012), 1868–1876. https://doi.org/10.1212/wnl.0b013e318258f7f1
[11] MZ Poh, T Loddenkemper, C Reinsberger, NC Swenson, S Goyal, MC Sabtala, JRMadsen, and RW Picard. 2012. Convulsive seizure detection using a wrist-wornelectrodermal activity and accelerometry biosensor. Epilepsia 53, 5 (mar 2012),e93–e97. https://doi.org/10.1111/j.1528-1167.2012.03444.x
[12] Y Ranjan, Z Rashid, C Stewart, P Conde, M Begale, D Verbeeck, S Böttcher, RDobson, and A Folarin. 2019. RADAR-Base: Open Source Mobile Health Platformfor Collecting, Monitoring, and Analyzing Data Using Sensors, Wearables, andMobile Devices. JMIR Mhealth Uhealth 7, 8 (01 Aug 2019), e11734. https://doi.org/10.2196/11734
[13] G Regalia, F Onorati, M Lai, C Caborni, and RW Picard. 2019. Multimodal wrist-worn devices for seizure detection and advancing research: Focus on the Empaticawristbands. Epilepsy Research 153 (jul 2019), 79–82. https://doi.org/10.1016/j.eplepsyres.2019.02.007
[14] R Surges, RD Thijs, HL Tan, and JW Sander. 2009. Sudden unexpected death inepilepsy: risk factors and potential pathomechanisms. Nature Reviews Neurology5, 9 (aug 2009), 492–504. https://doi.org/10.1038/nrneurol.2009.118
[15] K Vandecasteele, TD Cooman, Y Gu, E Cleeren, K Claes, W Paesschen, S Huffel,and B Hunyadi. 2017. Automated Epileptic Seizure Detection Based on WearableECG and PPG in a Hospital Environment. Sensors 17, 10 (oct 2017), 2338. https://doi.org/10.3390/s17102338