using modis imagery to validate the spatial representation of ...international swat conference...
TRANSCRIPT

International SWAT Conference
Universidad de Castilla - La Mancha, Toledo, Spain
June 15-17, 2011
Alejandra Stehr1, Oscar Link2, Mauricio Aguayo1
1Centro de Ciencias Ambientales EULA – Chile 2Facultad de Ingeniería, Departamento de Ingeniería Civil
Universidad de Concepción
Chile
Using MODIS imagery to validate the spatial
representation of snow cover extent obtained from
SWAT in a data-scarce Chilean Andean watershed

Outline
Background and objectives
Study area
Methodology
Results
Conclusions

Background and objectives
Depending on the relative altitude and ambient
temperature, Andean watersheds present important snow
coverage during the winter season.
Snowpack stores significant amount of precipitation water.
Released to surface runoff and groundwater when solar
radiation increases.

Background and objectives
25% of the south central Chilean surface is contained in
areas where snow precipitation takes place during a normal
winter.
Chilean
Andes lack
of
meteorological input
hydrological validation
data
Complicates the
analysis of those
hydrological
processes that take
place in this
important part of
many of the
country’s river
basins.

Background and objectives
Remote sensing provide a promising opportunity to enhance the
assessment and monitoring of the spatial and temporal variability
of the different variables involve in the precipitation runoff
process in areas where data availability for hydrological modelling
is scarce.

Background and objectives
The objective of this study is to use remotely-sensed snow
cover information obtained from MODIS imagery in order
to validate the spatial snow cover extent and the thus the
representation of stream hydrology calculated with SWAT.
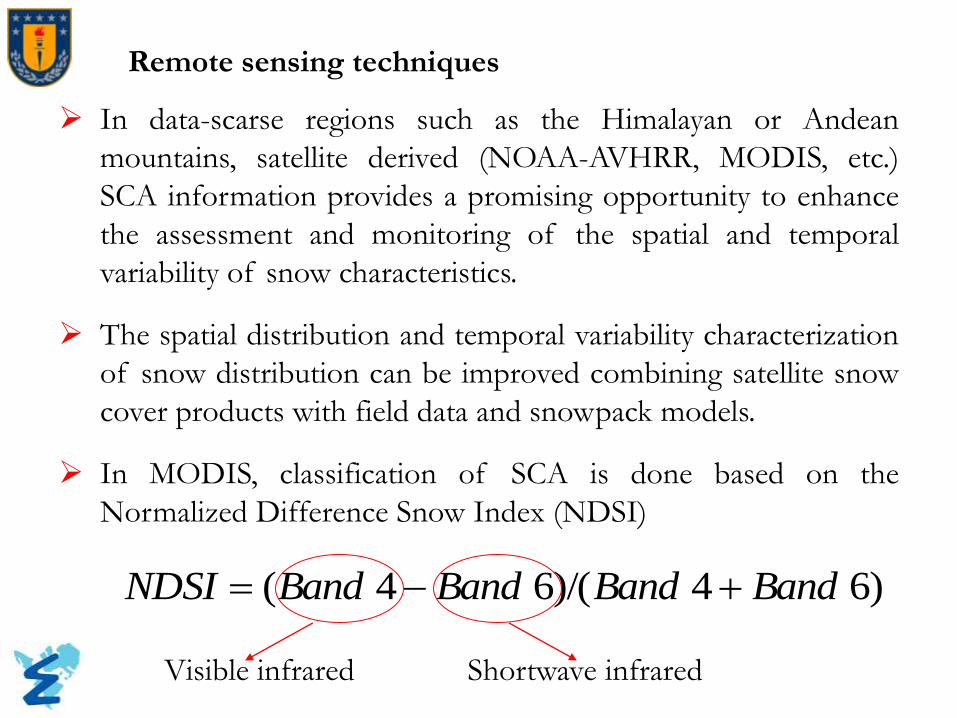
Remote sensing techniques
In data-scarse regions such as the Himalayan or Andean
mountains, satellite derived (NOAA-AVHRR, MODIS, etc.)
SCA information provides a promising opportunity to enhance
the assessment and monitoring of the spatial and temporal
variability of snow characteristics.
The spatial distribution and temporal variability characterization
of snow distribution can be improved combining satellite snow
cover products with field data and snowpack models.
In MODIS, classification of SCA is done based on the
Normalized Difference Snow Index (NDSI)
6) 4 6)/( 4 ( BandBandBandBandNDSI
Visible infrared Shortwave infrared

Remote sensing techniques
For a first approximation,
MODIS MOD10A2 product
were validated for the year 2010
at one observation point in a
Chilean Andean watershed; using
measured snow depth data
obtained from a Sonic Ranging
Sensor (SR50A/AT).

Hydrological modelling with snowmelt
Effect of spatial
heterogeneity on the
surface runoff and
groundwater flow
Semi-distributed hydrological models divide the watershed in
subbasins and each subbasisn is again divided in hydrological
response units (HRU) that are homogeneous in their
hydrological characteristics (soil type, land use and slope).
In this work the semi-distributed approach of surface runoff
which is included in the SWAT model with emphasis on their
snowmelt contribution was use.
Physically-based distributed
or semi-distributed models

Hydrological modelling with snowmelt
Snow accumulation and snowmelt are modelled using a temperature-
index snowmelt relationship:
TMLT2)T(Tsno*bSM mxsnowpackcovmlt
SM: snowmelt (mm H2O)
Bmlt: melt factor for that day (mm H2O day-1- °C)
Tsnowpack: snow pack temperature( ºC)
Tmx: maximum air temperature on a given day (ºC)
TMLT: threshold temperature to occur snowmelt (ºC)
snocov: fraction of area covered by snow
SWE: snowpack water equivalent (mm H2O day-1)
SM: snow melt (mm H2O day-1)
SF: snow fall (mm H2O day-1)
Es: sublimation (mm H2O day-1)
S1)(dayday ESMSFSWESWE

Study area
Area of 455 km2
Elevation values from 880 to
2533 m a.m.s.l.
Flow regime is pluvio-nival, mean
monthly discharges:
Maximum → 45.75 m3/s June
Minimum → 8.96 m3/s March
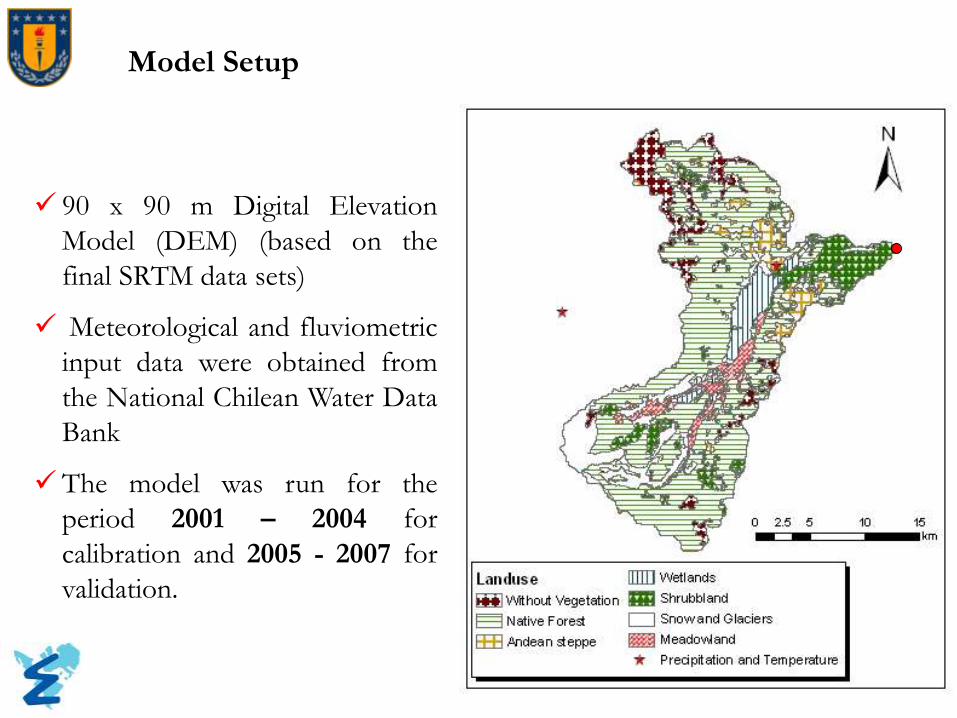
Model Setup
90 x 90 m Digital Elevation
Model (DEM) (based on the
final SRTM data sets)
Meteorological and fluviometric
input data were obtained from
the National Chilean Water Data
Bank
The model was run for the
period 2001 – 2004 for
calibration and 2005 - 2007 for
validation.

MOD10A2 snow product was used.
MOD10A2 pixels were reclassified as snow (1) were MODIS
indicated the presence of snow and no snow (0) in other cases.
MOD10A2 product was validated for April to September of
2010 at one observation point (1190 m.a.s.l.).
MODIS
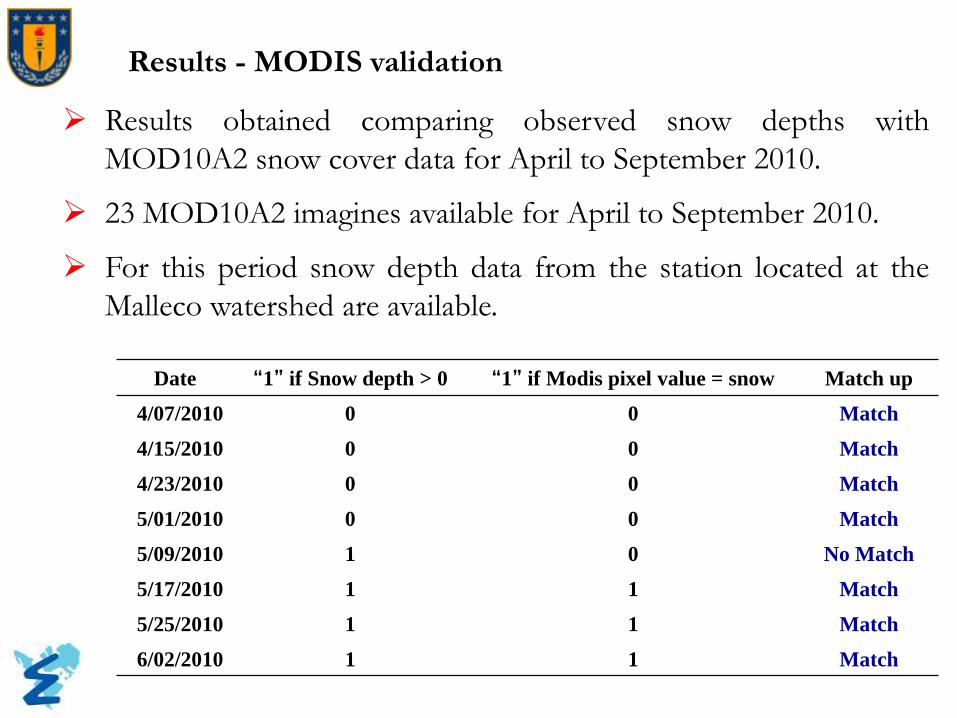
Results - MODIS validation
Results obtained comparing observed snow depths with
MOD10A2 snow cover data for April to September 2010.
23 MOD10A2 imagines available for April to September 2010.
For this period snow depth data from the station located at the
Malleco watershed are available.
Date “1” if Snow depth > 0 “1” if Modis pixel value = snow Match up
4/07/2010 0 0 Match
4/15/2010 0 0 Match
4/23/2010 0 0 Match
5/01/2010 0 0 Match
5/09/2010 1 0 No Match
5/17/2010 1 1 Match
5/25/2010 1 1 Match
6/02/2010 1 1 Match
The snow depth sensor indicated presence of snow during
83% of the time, while MODIS10A2 during 87%.
In the specific case of the day 8/21/2010 the imagine is
classified as cloud at the observation point, but the
surrounding area is classified as snow, thus it is assumed that
the presence of snow at the observation point matches up to
91% .
Results in agreement with previous studies.
Results - MODIS validation
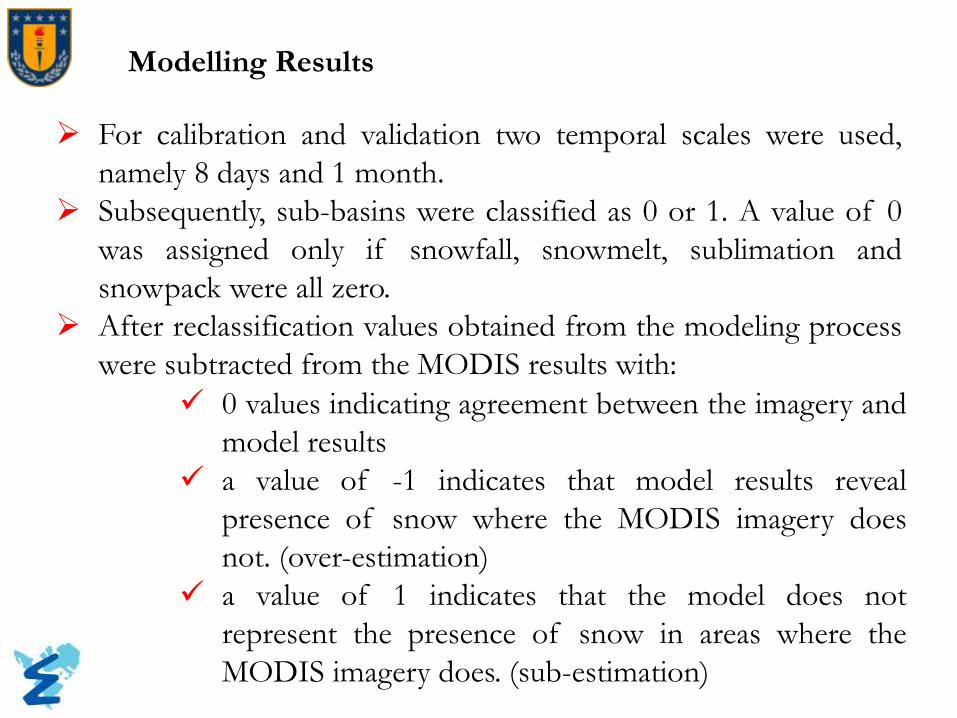
Modelling Results
For calibration and validation two temporal scales were used,
namely 8 days and 1 month.
Subsequently, sub-basins were classified as 0 or 1. A value of 0
was assigned only if snowfall, snowmelt, sublimation and
snowpack were all zero.
After reclassification values obtained from the modeling process
were subtracted from the MODIS results with:
0 values indicating agreement between the imagery and
model results
a value of -1 indicates that model results reveal
presence of snow where the MODIS imagery does
not. (over-estimation)
a value of 1 indicates that the model does not
represent the presence of snow in areas where the
MODIS imagery does. (sub-estimation)

Modelling Results
Calibration
Calibration was done using measured flows and MOD10A2
data.
First a sensitivity analysis was done, results for both time scales
(8 days and 1 month) indicate that the four most sensitive
parameters are snowfall temperature, snowmelt base
temperature and maximum melt factor for snow.
Snow cover area calibration results 2001-2004
Time scale Sub-estimation
(%)
Over-estimation
(%)
Total error (%)
8 days 15.5 5.7 21.2
1 month 8.0 5.7 13.7
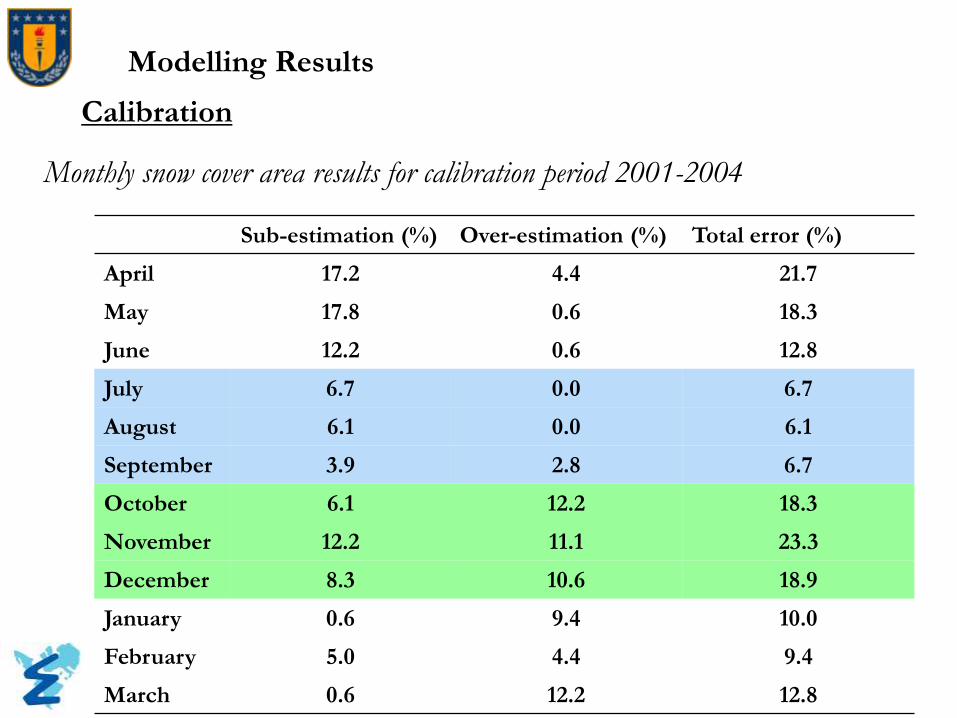
Modelling Results
Calibration
Monthly snow cover area results for calibration period 2001-2004
Sub-estimation (%) Over-estimation (%) Total error (%)
April 17.2 4.4 21.7
May 17.8 0.6 18.3
June 12.2 0.6 12.8
July 6.7 0.0 6.7
August 6.1 0.0 6.1
September 3.9 2.8 6.7
October 6.1 12.2 18.3
November 12.2 11.1 23.3
December 8.3 10.6 18.9
January 0.6 9.4 10.0
February 5.0 4.4 9.4
March 0.6 12.2 12.8

Modelling Results
Validation
Snow cover area validation results 2005-2007
Time scale Sub-estimation
(%)
Over-estimation
(%)
Total error (%)
8 days 12.6 8.4 21.0
Monthly 7.5 9.8 17.2

Modelling Results
Validation
Monthly snow cover area results for validation period 2005-2007
Sub-estimation (%) Over-estimation (%) Total error (%)
April 28.1 4.4 32.6
May 19.3 0.0 19.3
June 15.6 1.5 17.0
July 0.0 2.2 2.2
August 0.0 5.2 5.2
September 2.2 5.9 8.1
October 3.7 6.7 10.4
November 13.3 13.3 26.7
December 1.5 16.3 17.8
January 0.0 20.7 20.7
February 3.7 15.6 19.3
March 2.2 25.2 27.4

Modelling Results
Efficiency and determination coefficient calculated for the calibration (2001–
2004) and validation (2005 -2007) period
Calibration Validation
RRMSE 0.64 0.64
ABSERR 12.59 12.64
EF 0.61 0.35
R2 0.68 0.80

Conclusions
When comparing MOD10A2 data with ground snow
observations at one location, good results are obtained which
can indicate that this product is suitable to use for calibration
and validation of snow cover area. Comparison at more
measuring points is needed.
Results obtained from the presented SWAT model application
for the Lonquimay sub-basin, located in the Central-Chilean
Andes, shows a good performance when comparing snow
cover area obtained from MOD10A2 with snow cover area
obtained from the simulations done with SWAT.

Conclusions
The model shows a satisfactory general model performance in
term of representation of monthly mean discharge at the
basin outlet.
Improvements can be done in the future including more
parameters into the calibration process.
Although a reasonably good description of snow cover extent
could be obtained under most circumstances, the present case
study shows the limitations inherent to the low density of
stations providing meteorological input data in the case of
basins featuring high altitudinal gradients.
24
This investigation has been financed by the following projects:
1. FONDECYT Nº 1090428: “Effects of climate and land use
change on hydric resources. New determining factors for
integrated management of watersheds.”
2. FONDECYT Nº 11100119 : “Snowmelt contribution to
surface runoff and groundwater in Andean watersheds:
monitoring and modelling”
Acknowledgments
International SWAT Conference
Universidad de Castilla - La Mancha, Toledo, Spain
June 15-17, 2011
Alejandra Stehr1, Oscar Link2, Mauricio Aguayo1
1Centro de Ciencias Ambientales EULA – Chile 2Facultad de Ingeniería, Departamento de Ingeniería Civil
Universidad de Concepción
Chile
Using MODIS imagery to validate the spatial
representation of snow cover extent obtained from
SWAT in a data-scarce Chilean Andean watershed