using ioos to improve water quality management in lis james o’donnell frank bohlen, hans dam and...
TRANSCRIPT

Using IOOS to Improve Water Quality Management in LIS
James O’DonnellFrank Bohlen, Hans Dam
and Grant McCardell

• I showed you three quite different versions of the same model
•One with high mixing production and respiration and one with low rates.
•Only the quantitative measures reveal the difference in performance using ship survey data
•Only the buoy data led us to the improvements
•There is evidence of long term trend in forcing and response
SUMMARY
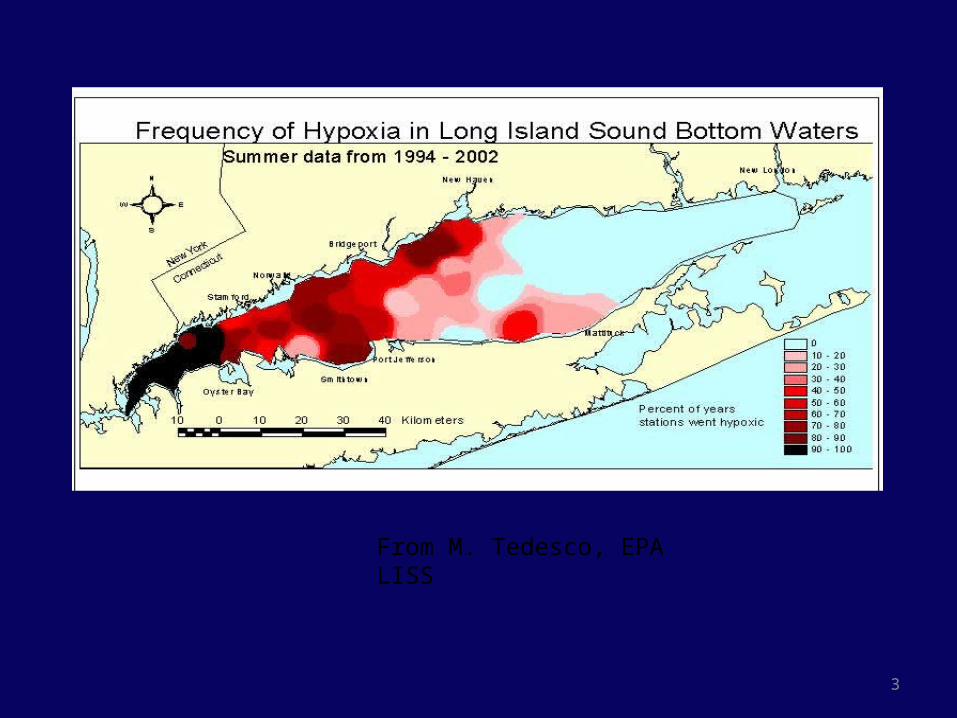
3
From M. Tedesco, EPA LISS

4
Data-Model Comparison

5
C2WLISEXRK
http://lisicos.uconn.edu/ or http://neracoos.org/

The major issues- distortion of physics

7
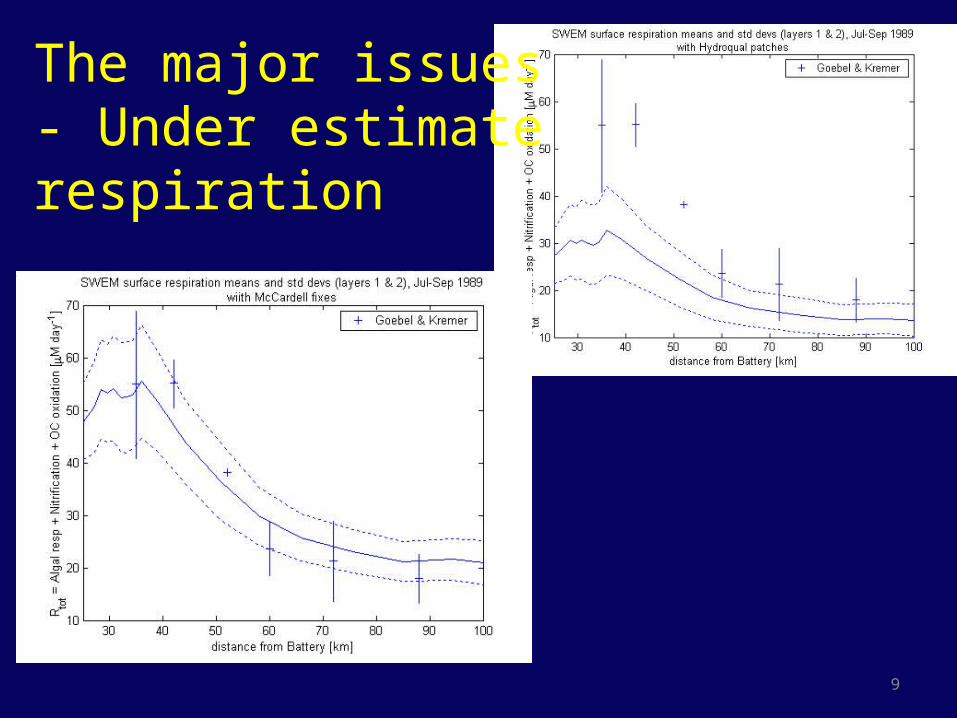
The major issues- Under estimate production
8
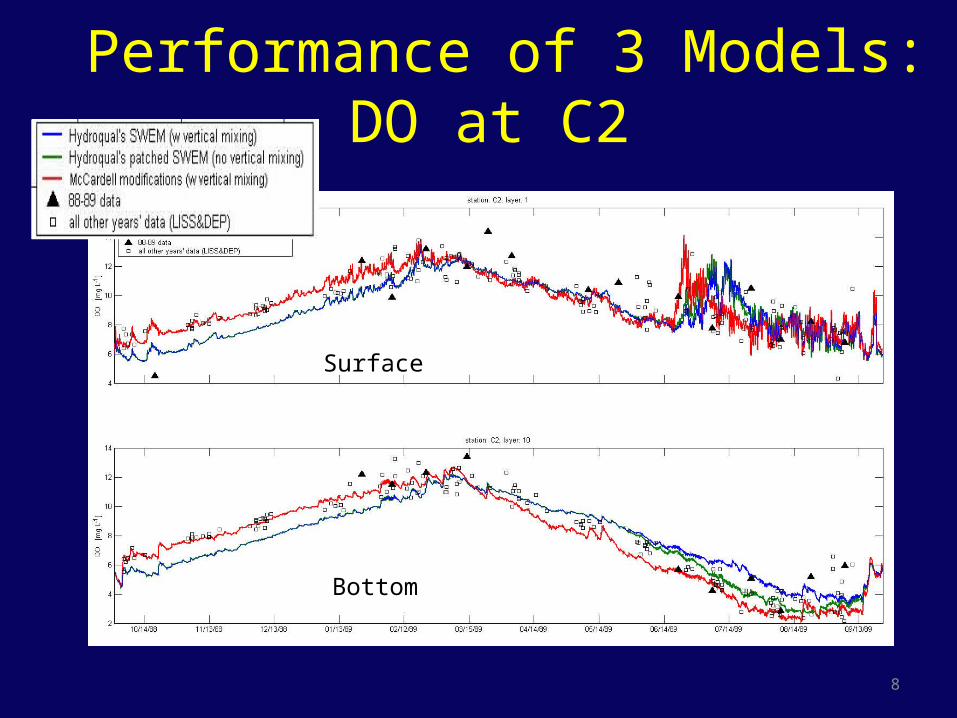
Performance of 3 Models: DO at C2
Surface
Bottom
9
The major issues- Under estimate respiration

The major issues - under estimate respiration Measured Vertical Eddy diffusion coefficient at WLIS (CTDEP C2) in 2006
2 2.2 2.4 2.6 2.8 3-20
-18
-16
-14
-12
-10
-8
-6
-4
-2
0
18
log10
K = log10
( / N2)
-5
-4.5
-4
-3.5
-3
-2.5
-2
-4 -3.5 -3 -2.5 -2 -1.5 -1 -0.5 0 0.5-20
-18
-16
-14
-12
-10
-8
-6
-4
-2
0
Depth
(m)
log10
(K)

11
Summary
• Mixing is distorted to counteract the underestimation of the production and respiration
• Formulation of DO and Phytoplankton C budgets make it difficult to adjust these to more realistic levels.
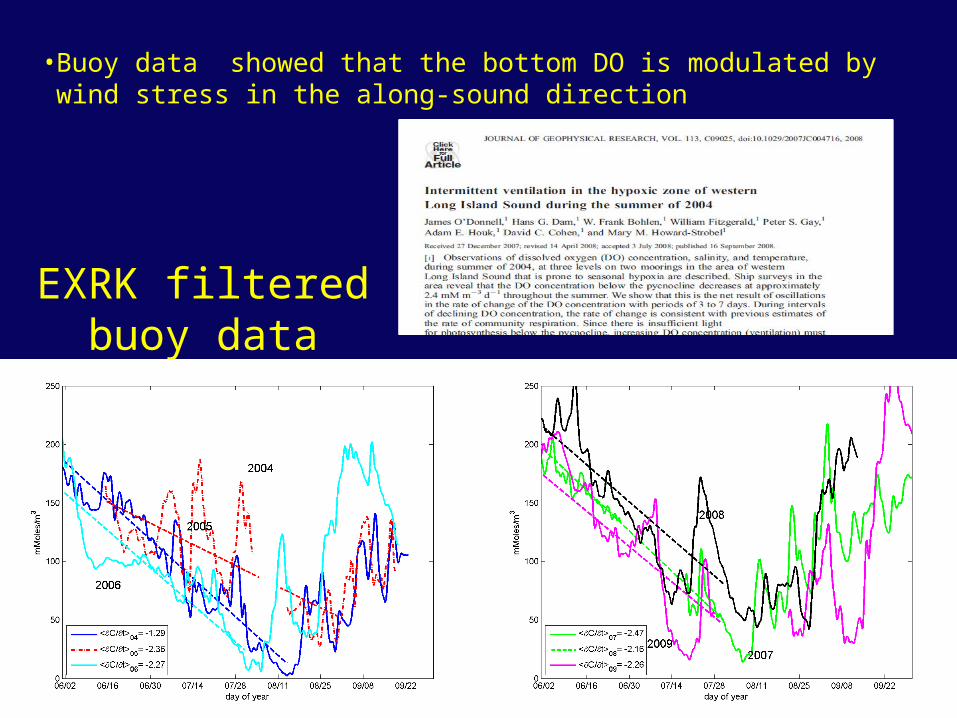
• Buoy data showed that the bottom DO is modulated by wind stress in the along-sound direction
EXRK filtered buoy data
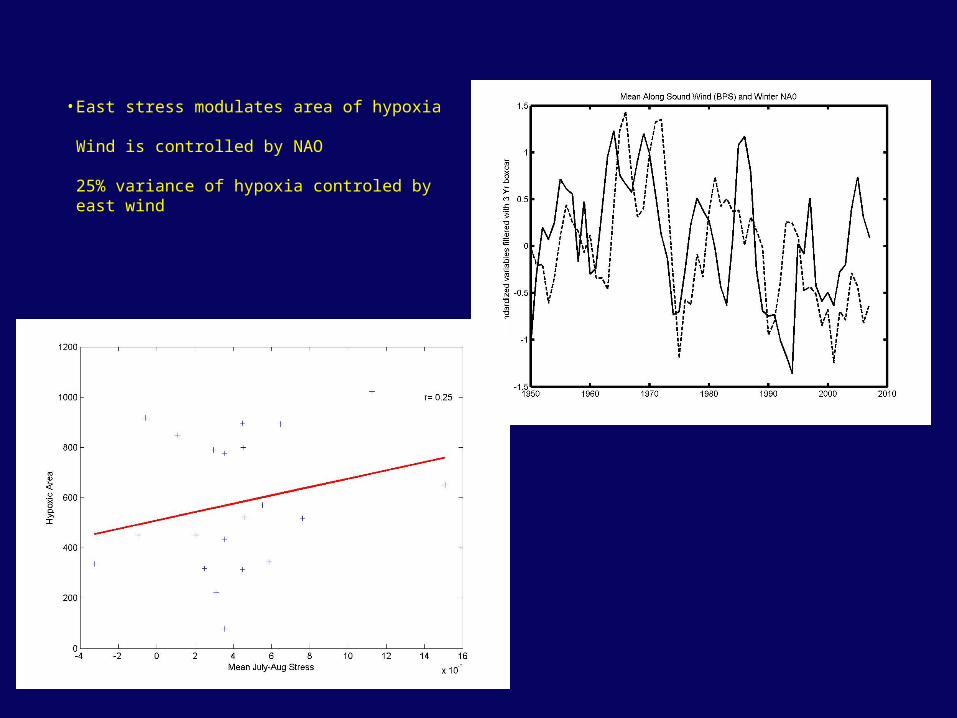
• East stress modulates area of hypoxia
Wind is controlled by NAO
25% variance of hypoxia controled by east wind

Lessons1. Models can only be improved if shown inconsistent with observations
and uncertainty estimates.2. Quantitative measures of skill are essential3. Ship surveys alias tidal and meteorological variability4. Time Series of DO, S & T etc, complement ship surveys.
a) They allow estimates of rates of production and respirationb) They establish the uncertainty due to aliasing
4. Buoys support MET and current measurements and allow estimates of surface exchange and vertical mixing
5. Long term trends can only be detected if measurements (and uncertainties) are sustained
6. Trends in forcing must be separated from trends due to management7. Data sharing and standards are essential8. Model sharing and standards are essential9. Multiple models and model run allow uncertainty in predictions to be
estimated10. Basins should not be viewed in isolation