using intuitionistic fuzzy set for anomaly detection …date of publication xxxx 00, 0000, date of...
TRANSCRIPT
Date of publication xxxx 00, 0000, date of current version xxxx 00, 0000.
Digital Object Identifier 10.1109/ACCESS.2017.DOI
Using Intuitionistic Fuzzy Set forAnomaly Detection of Network Trafficfrom Flow InteractionJINFA WANG1, HAI ZHAO1, JIUQIANG XU1, HEQUN LI1, SHUAI CHAO1, CHUNYANG ZHENG11School of Computer Science and Engineering, Northeastern University, Shenyang, 110819 China
Corresponding author: Jinfa Wang (e-mail: [email protected]).
This work was supported by the Fundamental Research Funds for the Central Universities under Grant 02190022117021 and N171903002.
ABSTRACTWe present a method to detect anomalies in a time series of flow interaction patterns. There are manyexisting methods for anomaly detection in network traffic, such as number of packets. However, thereis non established method detecting anomalies in a time series of flow interaction patterns that can berepresented as complex network. Firstly, based on proposed multivariate flow similarity method on temporallocality, a complex network model (MFS-TL) is constructed to describe the interactive behaviors of trafficflows. Having analyzed the relationships between MFS-TL characteristics, temporal locality window andmultivariate flow similarity critical threshold, an approach for parameter determination is established.Having observed the evolution of MFS-TL characteristics, three non-deterministic correlations are definedfor network states (i.e. normal or abnormal). Furthermore, intuitionistic fuzzy set (IFS) is introduced toquantify three non-deterministic correlations, and then a anomaly detection method is put forward for singlecharacteristic sequence. To build an objective IFS, we design a Gaussian distribution-based membershipfunction with a variable hesitation degree. To determine the mapping of IFS’s clustering intervals tonetwork states, a distinction index is developed. Then, an IFS ensemble method (IFSE-AD) is proposedto eliminate the impacts of the inconsistent about MFS-TL characteristic to network state and improvedetection performance. Finally, we carried out extensive experiments on several network traffic datasets foranomaly detection, and the results demonstrate the superiority of IFSE-AD to state-of-the-art approaches,validating the effectiveness of our method.
INDEX TERMS network traffic flow, flow interaction, complex network, anomaly detection, multivariateflow similarity, temporal locality, intuitionistic fuzzy set, ensemble method.
I. INTRODUCTIONAnomalies can be defined as some patterns in data that do notimitate network traffic normal behavior. Network operatorsfrequently face a wide range of such patterns in networktraffic. Most of anomalous patterns begin abnormalities dueto malicious illegitimate activities under large scale trafficflow interactions, such as cyber intrusions, distributed denialof services attacks, botnet attacks, worm propagation, portmalicious scanning, and brute-force attacks [1], [2]. Whichcould lead to catastrophic consequences and threaten theproper operation of networks. Anomaly detection is a methodto find patterns that deviate from the expected behavior. Al-though network traffic profiling has become one of the mostimportant and common means for anomaly detection in thepast years [3], new and more robust detection mechanisms
need to be developed as the complexity of these attacks keepsincreasing as discussed in Cisco 2017 Midyear Cybersecurityreport [4].
In general, the studies of network traffic profiling canbe classified by their level of observation: (a) packet level,such as signature-based application detection and methodsusing the well known port numbers, (b) flow level statisticaltechniques (c) host level, such as host-profiling approaches.The above methods focus on the feature extraction, selection,and analysis on per study object (e.g. packet, flow or host),and ignore the interaction of network traffic. In this paper,the interaction refers to the dependency between two flowsor relevance from one flow to another. For example the wormvirus hiding in a host will firstly send a large number ofscanning flows to other hosts, and then inject worm code
VOLUME 4, 2016 1
arX
iv:1
810.
0779
6v1
[cs
.NI]
12
Sep
2018
J. Wang et al.: Using Intuitionistic Fuzzy Set for Anomaly Detection of Network Traffic from Flow Interaction
into the vulnerable hosts depending on the scanning responseflows. And in both the case of malcode and P2P, using contentsignature methods seem destined to fail in the face of en-cryption and polymorphism. Therefore, from the perspectiveof traffic flow interactions, we construct a complex networkmodel to describe the interaction behaviors of large scalenetwork traffic flows instead of traditional statistical method.Since complex network provides a powerful mechanism forcapturing the interactive relationships among study objects,it has been an effective method for relational expression ofstructured data [5]–[7], especially the time series data. Forinstance, Supriya et al. [6] translated the epileptic EEG signaltime series into complex network, and then used the statis-tical properties of complex network to detect the epilepsy.Whereas in Internet, based on complex networks theory, thecomplexity of Internet topologies have been widely studied[8], [9]. But there is few studies about the complexity ofnetwork traffic. In 2007, a study of the social behavior ofInternet hosts was presented by the Traffic Dispersion Graphs(TDGs) as a way to monitor, analyze, and visualize networktraffic [10]. In TDGs, the edge can be defined to showdifferent interactions between two hosts. Wang et al. [11]studied social behavior similarity of Internet end-hosts basedon behavioral graph analysis. In Reference [12], we studiedthe flow interactive behaviors on temporal locality and putforward the temporal locality complex network (TLCN) tomonitor, analyze, and visualize large scale network trafficflows. But in TLCN, some network flows that are not relevantin flow content could also build connections due to TLCNdefinition. For this reason, by focusing on the interactionbehaviors of similar flows on temporal locality, an improvedcomplex network model (MFS-TL) for large scale networkflows is developed in which the proposed multivariate flowsimilarity method is used to quantify the correlation amongthe flows on temporal locality.
Obviously, the anomaly detection for network traffic flowsis to detect the anomalous MFS-TL structure. Recently years,constructing complex networks from structured data and thenmining the nonconforming patterns by complex networkstatistical characteristics have become an effective meansfor anomaly detection [13]. For instance cyber networks,fraud detection, fault detection in medical claims, engineer-ing systems, sensor networks, climate network, and manymore domains. However, one of key challenges is the incon-sistent performance about multiple network characteristicsto network states [9], [14], [15], when each of networkcharacteristics is regarded as the constituent detector alone.
Specifically, some characteristic values present negativecorrelation with detection goals. In other words, this charac-teristic could indicate that network is normal/abnormal but infact it is abnormal/normal. Some have non-correlation withthe detection goals, i.e. the unuseful characteristics couldbring non-deterministic for network states [16]. Hence it canbe inferred that the good characteristics improve the detectionaccuracy, the bad ones strength the certainty for the oppositestate, but the others bring the uncertainty for judging network
state. Undoubtedly, it become an uncertain theory problem ofmultiple complex network characteristics to multiple states.
In this paper, the intuitionistic fuzzy set (IFS) [17]is adopted to describe above non-deterministic correlationproblem. Its key is that similar networks probably sharecertain characteristics [6]. Different from [18], where it isgiven a non-null hesitation part about the evaluation of studyobjects to define the indeterministic behavior, we use thehesitation degree of IFS to express the useless of unusefulcharacteristic, and the non-membership degree of IFS to rep-resent the negative correlation about the characteristic to onecertain network state (i.e. normal or abnormal). Meanwhile anew membership function is designed to resolve the problemof the hesitation degree being a fixed value. A distinctionindex is put forward for the purpose of multiple clusteringintervals being mapped to two states’ linguistic variables.Furthermore, the intuitionistic fuzzy weighted geometric(IFWG) operator [19] is introduced to fuse multiple IFSsinto one new IFS about network structure to network stateto eliminate the impacts of the inconsistent performance.To obtain the detection result, we use score function andprecision function to select best IFS which has maximummembership degree for a given network state (or linguisticvariable). Thus based on the intuitionistic fuzzy set, thedetection method of single MFS-TL characteristic (IFS-AD)and the ensemble method of multiple characteristics (IFSE-AD) are separately developed to find the abnormal MFS-TL.We apply our methods to detect the anomalies in publiclynetwork traffic trace datasets, where it utilizes 14 networkcharacteristic metrics. Extensive evaluation on datasets withground truth shows that IFSE-AD outperformance the othermethods. The main contributions of this paper include:
1) Construct a complex network model (MFS-TL) to de-scribe the interaction behaviors of large scale similarflows on temporal locality. The MFS-TL can monitor,analyze, and visualize network flow behaviors from theperspective of the protocol, application, flow type, andflow payload.
2) Put forward a quantification method about MFS-TLcharacteristic to network state based on intuitionisticfuzzy set (IFS). In which, the proposed distinctionindex resolves the mapping problem from multipleclustering intervals of the IFS to two states’ linguisticvariables.
3) Propose an ensemble method (IFSE-AD) for multiplecharacteristic IFSs to improve detection performance.The IFSE-AD resolves the inconsistent problem ofMFS-TL characteristic presenting network state.
4) Methodological identification of an appropriate mul-tivariate flow similarity critical threshold rc and tem-poral locality window ∆w. To evaluate the efficiencyof the proposed methods in detecting the anomalies ofpublicly datasets including the abnormal events of thecyber intrusions, botnet attacks, distributed denial ofservices, brute force attack.
2 VOLUME 4, 2016

J. Wang et al.: Using Intuitionistic Fuzzy Set for Anomaly Detection of Network Traffic from Flow Interaction
The rest of this paper is organized as follows: Second IIprovides a thorough literature review of the related work.Section III constructs a complex network model (MFS-TL) todescribe the interaction behaviors of large scale similar flowson temporal locality. In Section IV, based on intuitionisticfuzzy set, we develope a anomaly detection method for singleMFS-TL characteristic, and a ensemble detection methodfor multiple MFS-TL characteristics’ IFSs which improvesthe detection performance. Furthermore, the MFS-TL pa-rameters and statistical characteristics are analyzed, and ourmethod performance are shown and evaluated in Section V.Finally, Section VI presents the concluding remarks.
II. RELATED WORKNetwork traffic anomalies are instances in data that donot conform to the behavior exhibited by normal traffic.Traffic anomalies in a network can be defined as any net-work events or operation that deviate from the normal net-work behavior. They happen due to the growing numberof network-based attacks or intrusions. Nowadays, the net-work anomaly detection methods can be classified into thestatistic-, classification-, clustering-, soft computing-, fuzzyset theory-, and combination learners-based [1], [20]. Ingeneral, the first step is that the raw data is reduced by one ofthe three important strategies, i.e. dimensionality reduction(e.g. feature selection and feature extraction), clustering, andsampling, on packet-level, flow-level or host-level. However,the selected features or quantified metrics are usually used asthe individual indicator [21]–[24].
In recent years, network traffic profiling based on theprobability relationships of studied objects has been paidattention. That is because complex network has been an ef-fective method for relational expression of structured data ascomplex network theory provides a powerful mechanism forcapturing the interactive relationships among study objects[13]. For instance the communication among the hosts. Ina study of the traffic volume between each pair of hostsand traffic flows on all ports, Yin et al. [25] developed theVisFlowConnect tool for visualizing network traffic flowdynamics for situational awareness that on all protocols anddynamic evolution on time. Iliofotou et al. [10] proposed theTraffic Dispersion Graph (TDG) to discover network-wideinteractions of the hosts to monitor, analyze, and visualizenetwork traffic. Wang et al. [11] studied social behaviorsimilarity of Internet end-hosts based on behavioral graphanalysis. Guan et al. [26] constructed a directed graph modelfrom the bidirectional region flows where a node denotes onehost located at either source region or destination region andthe edges represent the number of packets transferred fromthe source host to destination host. In addition, probabilitygraph is used to depict the relationship of the flow attributes(as the nodes). The studies of [27], [28] presented the pro-posed time series graph to describe the relationships amongmulti-time series such as the source IP address, destinationIP address, source port, destination port. Di et al. [29] putforward the flow graphs in the following way: each mobile
phone number in records represents a user node; each serverIP address in the records represents a server node; each flowrecord between a user node and a server node forms anedges. Tsuruta et al. [30] defined packets sent by coordinatedmalware attacks as bridge-less connected bipartite graphs.The structure-based screening is a method for extracting onlypackets that constitute 2-edge connected components of abipartite graph. Nowadays, the visibility graph is also usedin the network traffic analysis. Ye et al. [31] constructed thecomplex network for traffic sequences based on visibilitygraph. Then the complex network features is used to analyzethe host behavior in the traffic sequence.
In summary, the researchers have used the complex net-work theory to study the interaction behaviors of packet-leveland host-level, or the probability relationship of the statisticalresults. However, in [12], we proposed the temporal localitycomplex network for flow-level interaction which can effec-tively determine the Internet applications and discover theattack patterns. In this paper, we constructed the complexnetwork model of multivariate flow similarity on temporallocality to improve the ability of flow interaction presenting.
Thus, the problem of network traffic anomaly detection isconverted into the anomaly detection for complex networks.In fact, the anomaly detection for complex networks hasbecome a hot topic [9], [13]. Bunke [32] used graph featuresgenerated by graph edit distance to classify the normal andabnormal. Dai et al. [33] unified both positive and negativemutual dependency relationship in an unsupervised frame-work to detect anomalous nodes of bipartite graphs such asusers-rating-products in online marketplaces, users-clickingwebpages on the WWW and users referring-users in socialnetworks. Eberle and Holder [34] discovered anomalies ingraphs and patterns of varying sizes with minimal to no falsepositive by using the minimum description length principleand probabilistic approaches. Gunnemann et al. [35] pro-posed a method for finding homogeneous groups by join-ing the paradigms of subspace clustering, i.e. we determinesets of nodes that show high similarity in subsets of theirdimensions and that are as well densely connected within thegiven graph. Li et al. [36] developed an iBlackhole-DC algo-rithm for finding black hole and volcano patterns in a largedirected network. Sun et al. [37] identified abnormal nodesby computing the neighborhood for each node using randomwalk with restarts and graph partitioning. Reference [38]proposed the density-based network clustering algorithm todetect communities, hubs, and outliers in large scale undi-rected networks. Wang et al. [39] proposed a heterogeneousreview graph to capture the relationships among reviewers,reviewers and stores, and then put forward an iterative modelto identify suspicious reviewers. Supriya et al. [6] made theepileptic EEG signals transform into the complex networkand then used the statistical properties to detect the epilepsy.
In terms of network traffic anomaly detection, some stud-ies based on complex network theory have been done by theresearchers. For example, based on the TDG, Le et al. [40]had used complex network metrics, such as degree distribu-
VOLUME 4, 2016 3

J. Wang et al.: Using Intuitionistic Fuzzy Set for Anomaly Detection of Network Traffic from Flow Interaction
tion, maximum degree and dK−2 distance, to detect anoma-lous network traffic. In the study of network-wide anomalydetection, Zhou [41] detected the network anomalies basedon routers’ connecting relationships, i.e. he used the graphto describe the traffic feature distribution sequences and theirrelationships. Reference [26] used the six features proposedbased on the regional flow model to describe the networktraffic patterns and to capture the dynamic traffic patterns,especially the changes caused by attacks. Ishibashi et al. [42]extracted communication structure to identify low intensityanomalous network events, which can not be detected withconventional volume-based anomaly detection schemes. Ina word, the complex network is an effective means for theanomaly detection of structured data.
III. MULTIVARIATE FLOW SIMILARITY MODEL ONTEMPORAL LOCALITYIn this paper, multivariate flow similarity on temporal localityis used to quantify the interactive behaviors among similarflows at local time. In the below a specific example of flowinteraction is given, i.e., the traffic flow interaction underGoogle search. During opening the Google.com, the browserfirstly looks up the IP address of Google.com by the DNSflows, and loads Google’s webpage by HTTP flows. Then,it sends the HTTP request flows again to obtain the searchresults for the given keywords. Next, we probably click somehyperlinks on search page to trigger new flows. Eventually,we may repeatedly request new flows decided by previousflow content until we obtain our wanted results. Obviously,the flows in each step depend on the previous flows, that isto say the previous flows trigger the further flows. Anotherexample is the recursive or iterative query of DNS resolver.The DNS server has to forward this requests to its provideror tell the user its provider, if there is no record for agiven domain name [43]. In fact, the interactions in largescale traffic flows are so complicated that the traditionalstatistical methods are very hard to describe the macroscopicrelationships. But the complex network has a good nature todepicting the complexity and interaction of large scale trafficflows. Thus, based on complex network theory we proposethe construction method of multivariate flow similarity modelon temporal locality in the following.
A. MODEL DEFINITION
First, a 6-tuple f = {sa, da, sp, dp, pr, ps} is defined todenote one network traffic flow, where the sa, da, sp, dp,pr, and ps represent the source IP, destination IP, sourceport, destination port, protocol number, and flow payload sizerespectively. Then the set F = {f1, f2, . . . , fn} denotes ntraffic flow traces on time series. When we focus on trafficflows of one Internet application (e.g., either of two ports isa fixed value), the 6-tuple can be simplified into the 3-tuplef = {sa, da, ps}. Here one unique flow can be identified bythe values of sa and da.
1) Temporal localityTemporal locality is used to describe the interaction on aper item basis apart from in an aggregate reference flow[44]. In network traffic flows, the interactive relationshipsare built from current flows to further flows. For two flowsfi and fj occurring at time ti and tj separately (ti ≤ tj), if tj ∈ [ti, ti + ∆w], there would be the interactiverelationship from fi to fj , where the ∆w denotes the sizeof temporal locality window. In other words, there will be adirected connection from flow node fi to fj . However, thecaptured network traffic flows are diverse, especially thoseat the backbone network. Two flows fi and fj could beirrelevant in flow content in despite of tj ∈ [ti, ti + ∆w]or ti ∈ [tj , tj + ∆w]. In order to eliminate the impacts fromirrelevant flows, we design the multivariate flow similaritymethod to filter the pseudo interactive relationships of theflows by quantifying the similar probability of two flows.
2) Multivariate flow similarityTo determine true relationship of two flows, we propose amultivariate flow similarity method by computing the similarprobability of features values of two flows, such as the sourceand destination IP, source and destination port, protocol type,and flow payload size.
Source and Destination IP addresses. Source and desti-nation IP addresses have been widely used in the intrusiondetection domain. Whereas as a feature it does not providea definitive conclusion, it can be used as a reference innetwork traffic flow profiling. Different from statistic-basedtraffic anomaly detection, in this paper their primary valuecomes from a similar probability to evaluate the relevanceof different flows. For example, the attack flows from singleattacker to multiple victims contain the attacker’s IP address.Thus, we develope the below equation (1) to calculate flowsimilarity on IP address.
ra(fi, fj) =max{LCP1, LCP2, LCP3, LCP4}
L(1)
Where the LCP1 = |sai ∩ saj | , LCP2 = |sai ∩ daj |,LCP3 = |dai ∩ saj |, LCP4 = |dai ∩ daj | denote the lengthof common prefix of two IP addresses, and the L is the IPaddress length, i.e. 32 for IPv4 and 128 for IPv6.
Source and Destination port. In TCP/IP network, a portnumber is a way to identify a specific application to which anInternet or other network message is to be forwarded whenit arrives at a server. So the port number is usually used tomatch the Internet services of the corresponding TCP or UDPimplementation, such as the 21 for FTP, 22 for SSH, 23 forTELNET, 25 for SMTP, 53 for DNS, 80 for HTTP, 6881-6889 for BT and 5554 for Worm Sasser. The flows from sameInternet services would like to interact each other. Thus, asshown in equation (2), if existing two ports pi and pj in flowsfi and fj belong to same Internet services, the probability offlow interaction is 1, otherwise 0.
rpo(fi, fj) =
{1 if pi ∼= pj ,∃pi ∈ fi and ∃pj ∈ fj0 otherwise
(2)
4 VOLUME 4, 2016

J. Wang et al.: Using Intuitionistic Fuzzy Set for Anomaly Detection of Network Traffic from Flow Interaction
Protocol. Similar to source-destination port pair, protocolwas widely used for filtering out non-related traffic, thusreducing the volume of flows requiring further processing.Sometimes the sheer presence of a specific protocol in trafficraises suspicion. For example, IRC traffic is relatively rarelyused for legitimate purposes to the extend that in certainnetworks there is no use for this protocol at all. So theflows belonging to the same protocol in a monitored network,especially the special protocols, are more probable to interacteach other.
rpr(fi, fj) =
{1 pri = prj
0 otherwise(3)
Flow payload size. The flow payload size are mostlyintended to represent similar communication patterns. Thismetric has been used with the purpose of both traffic classifi-cation (i.e. distinguish specific protocols, especially the P2P)and traffic anomaly detection. That is because continuousflows from one Internet application exhibit a very consistentbehavior. Here we use the ratio between two flows’ payloadsizes to exhibit the flow similarity.
rps(fi, fj) =min{psi, psj}max{psi, psj}
(4)
Considering the normalization of the rps, in equation (4)the minimum of two flows’ payload size is divided by themaximum of that.
Furthermore, the multivariate similarity between two flowscan be calculated by the following equation:
r(fi, fj) = wa ∗ ra + wpo ∗ rpo + wpr ∗ rpr + wps ∗ rps, (5)
where the wa, wpo, wpr, and wps denote the weight of corre-sponding flow feature respectively,wa+wpo+wpr+wps = 1.A entropy weight method [45] is adopted to determine theweights of equation (5). Furthermore, the interaction rela-tionship of two flow nodes fi and fj is expressed as:
Eij =
{1 tj ∈ [ti, ti + ∆w] and r(fi, fj) ≥ rc0 otherwise
(6)
If Eij = 1, an connection is built from flow node fi to flownode fj , and vice versa. Specifically, if only the similarityr(fi, fj) between two flows is not less than a critical thresh-old rc and the fj occurs in the temporal locality windowof the fi, there should be a directed connection from fito fj . The parameters ∆w and rc should be determined toan proper value by which the complex network can capturethe characteristics of network traffic time series. We havediscussed it in detail in Section V-B.
According to the above method, a complex network modelg = (N,E) based on multivariate flow similarity on temporallocality can be constructed from network traffic traces, wherethe v ∈ N is the network node that denotes unique networkflow f , the e ∈ E describes a interaction relationshipbetween two nodes. In this paper the g is a directed complexnetwork, where the direction of edge e(vi, vj) indicates the
flow vi triggers the flow vj , the vj depends on the vi, or thereis an relevance. About MFS-TL, the most important is theability of describing macroscopic interactive structure, eventhough it builds the connections from microscopic trafficflows. Therefore, the MFS-TL can capture the interaction anddynamic of large scale network traffic flows.
B. MODEL FILTRATION AND FORMATIONOne of the fundamental questions in using MFS-TL is thedefinitions of network node and edge. This basic question canbe answered in many different ways depending on the goalof our study. We start with the observation that what kind orlevel of network flows should be selected as network nodein MFS-TL. We call this process Node Filtering. One simplenode filtering is to select IP protocol flows. In addition tothis basic node filtering, we can enrich the definition of whatconstitutes a node by imposing "stricter" rules that capturedifferent aspects of traffic flows. For instance, we can havefilters for "allowing" a flow node based on: (a) the frequencyof one flow, (b) the type of the flow (e.g., TCP three-wayhandshake), (c) the application protocol used (TCP, UDP,ICMP etc.), (d) the application based on port number (e.g.,Port Number 80 for HTTP, Port Numbers 6881−6889 forBT), and finally (e) looking at properties of the flow content,such as payload size or by using deep packet inspection.
Besides basic definition about network edge in SectionIII-A , more rules or features, called Edge Filtering, canbe put forward to enrich the definition of network edge.In general, the directed edges can be used to identify theindicator of the probability interaction between a pair offlows. Directed edges in a MFS-TL are very useful in iden-tifying various node behaviors and also in establishing theircausal relationship. However, we could choose to considerundirected edges, which will enable us to use the moreextensively studied complex network metrics for undirectednetworks, as discussed in later Section V-C. In addition toedge direction, it is also important to define the level ofnetwork edge in MFS-TL. One simple edge filter is to add anedge e(vi, vj) between flow node vi and vj when Eij = 1of equation (6). Once an edge is added, this filter ignoresany flow interaction from vi to vj . We call this edge filteras the Unweighted-Edge(UWE), and is mainly used to studythe interactive process of network flows. However, for theflow interaction behavior, the frequency of edge e(vi, vj) isan important indicator in MFS-TL. We call this edge filter asthe Weighted-Edge(WE).
In this paper, we mainly focus on the interactions of thetraffic flows based on TCP and UDP application protocol.In other words, the MFS-TL uses the (c) filtering type (asdefined above). Throughout the paper and unless stated other-wise, when the legacy application for a flow uses the TCP orUDP, we use the WE edge filter on the corresponding protocolof the flows.
Since we use node filtering by application protocol andedge filtering by the edge frequency, the MFS-TLs captureaspects of any application that uses these protocol. However,
VOLUME 4, 2016 5

J. Wang et al.: Using Intuitionistic Fuzzy Set for Anomaly Detection of Network Traffic from Flow Interaction
application protocol-based filtering is consistent with ouruse of MFS-TLs as a monitoring tool. For example, if atsome time points network traffic at TCP Port 80 appearssignificantly different, it could be: (a) a new begin or mali-cious application tunneling its traffic under that port, or (b) achange in the behavior of the traditional traffic.
IV. ANOMALY DETECTION METHOD BASED ONINTUITIONISTIC FUZZY SETFor a MFS-TL g = {N,E,C}, the C is the collectionof complex network characteristic metrics. If it is sam-pled with a fixed time window 4t, one MFS-TL sequenceG = {g1, g2, . . . , gn} will be obtained by extracting MFS-TL from network traffic samples, where the gi representsthe flow interactions of a monitored network at ith sampleperiod. Assume that there are p characteristic metrics for thesampling MFS-TL gi. Then in n sampling MFS-TLs, existinga characteristic vector C = {c}p×n denotes p time series ofMFS-TL characteristics. Every MFS-TL characteristic willdepict the MFS-TL structure from different perspectives. Forinstance, the number of MFS-TL nodes and the number ofMFS-TL edges describe MFS-TL size. When one anomalyactivity occurs, a large number of nodes or edges will disap-pear or appear suddenly in MFS-TL. The MFS-TL diameterdenotes the worst communication path length. Under theintentional attacks, MFS-TL diameter will first increases andthen decreases quickly [9]. In Section V-C, the detailed anal-ysis results denote that the correlation between network char-acteristic and network states can be classified into tree types:positive correlation, negative correlation and non-correlation,and is non-deterministic in different datasets. Therefore, weput forward the intuitionistic fuzzification method for singleMFS-TL characteristic to quantify three non-deterministiccorrelations.
A. INTUITIONISTIC FUZZY SET FOR SINGLECHARACTERISTICDefinition 1 (Intuitionistic Fuzzy Set, IFS): X is a finiteuniversal set, such as the network diameter values (X = Ci).An intuitionistic fuzzy set A in X is an object having thefollowing form.
A = {< x, µA(x), γA(x), πA(x) > |x ∈ X} (7)
where the µA(x) : X → [0, 1] defines the degree of mem-bership, and γA(x) : X → [0, 1] defines the degree of non-membership of the element x ∈ X to intuitionistic fuzzy setA, with the condition 0 ≤ µA(x)+γA(x) ≤ 1 for all x inX .For each intuitionistic fuzzy set inX , πA(x) = 1−µAj
−γAj
is called the hesitation degree(or intuitionistic index) of x toA.
In order to obtain the IFS A of MFS-TL characteristic,we define the domain of discourse, and then partition it.First, the domain of discourse D = [xmin − ε1, xmax + ε2]is constructed, where xmin and xmax are the minimumand maximum of set X , and ε1 and ε2 are proper positivenumbers. Second, the intuitionistic fuzzy C-means clustering
algorithm(IFCM) [46] is used to partition the domain ofdiscourse into m clustering intervals. Meanwhile we get theclustering center vector V = {v1, v2, . . . , vc} of universe D.Then let
di =
xmin − ε1, i = 0
(vi + vi+1)/2, i = 1, 2, ...,m− 1
xmax + ε2, i = m
(8)
As a result, the universe D is divided into m unequal in-tervals, i.e. D = {[d0, d1], [d1, d2], . . . , [dm−1, dm]}. Everyx ∈ X should exist m intuitionistic fuzzy sets Ai ={< x, uAi(x), γAi
(x), πAi(x)|x ∈ Di}, where the uAi
(x)denotes the membership degree of x in ith clustering interval[di−1, di] and γAi(x) is the non-membership degree of that.
Existed methods of membership and non-membershipfunction usually give the hesitation degree a fixed value.Objectively, the hesitation degree should be dynamic withthe universal set X . So we adopted the Gaussian function(equation (9)) which meets below condition: when the dis-tance between the x and the interval center v is lower, thedegree of membership µ is more close to 1.
uAi(x) = exp(− (x− ψui)2
2σ2ui
) (9)
Where i = 1, 2, . . . ,m, and ψuiand σui
are the functionparameters. Then the following rules are defined so as toresolve above parameters:
1) If x is in the middle of an clustering interval, i.e. x =vi, the membership value µAi
(x) = 1.2) If x is on the boundaries of an clustering interval, i.e.
x = (vi − vi−1)/2, let πAi(x) = α, (0 ≤ α ≤ 1), then
µAi(x) = (1− α)/2.
Based on above rules, the function parameters are resolved:
ψui= vi (10)
σui = − (vi−1 + vi)2
8ln((1− α)/2)(11)
Thus, given a value x, the membership values for everyclustering interval are calculated by equations(9), (10) and(11). The non-membership function is calculated based onYager generating function [47]. The Yager’s intuitionisticfuzzy complement is written as following:
γAi(x) = (1− µβAi
(x))1/β , β > 0 (12)
When µAi(x) = 1, then γAi
(x) = 0, and otherwise viceversa. Therefore the IFS (equation(7)) becomes:
Ai ={< x, µAi(x), (1− µβAi(x))1/β ,
1− µAi(x)− (1− µβAi
(x))1/β > |x ∈ Di}(13)
As we all known, one network is either normal or abnor-mal. But the value of clustering intervals m is not less than2 depending on our goals. When m = 2, one clusteringinterval represents normal state and the other representsabnormal state. When m > 2, as Fig.4 shown the anomalydetection performance achieves the best when m = 10,
6 VOLUME 4, 2016

J. Wang et al.: Using Intuitionistic Fuzzy Set for Anomaly Detection of Network Traffic from Flow Interaction
how to partition m clustering intervals again to two states’clustering interval set becomes an important problem foranomaly detection. In other words, we need to know whichclustering intervals represent the normal state and the othersrepresent the abnormal state. Let the NC and AC denotethe normal clustering interval set and abnormal clusteringinterval set, D = AC
⋃NC and AC
⋂NC = ∅. The
abnormal clustering interval set AC is that includes most ofthe abnormal instances of the training set, and the normalclustering interval setNC is that includes most of the normalinstances of the training set. For the ith abnormal clusteringinterval in AC, the tti = AIi
|ACi| and tfi = NIi|ACi| denote
the ratio of the number of abnormal instances AIi and thenumber of normal instances NIi to total instances |ACi|.Correspondingly, the ffj =
NIj|NCj | and ftj =
AIj|NCj | de-
note the ratio of the number of normal instances NIj andthe number of abnormal instances AIj to total instances|NCj | of the jth normal clustering interval. For the twostates’ set, we get TT =
∑i∈ACi=0 tti, TF =
∑i∈ACi=0 tfi,
FF =∑j∈NCj=0 ffj and FT =
∑j∈NCj=0 ftj . Furthermore,
a distinction index is designed for the purpose that finds thebest partitioning for the clustering intervals by obtaining themaximum η = TT − TF + FF − FT .
τ =η
TT + TF + FF + FT, arg maxAC,NC
(η) (14)
In above equation, we found that the best case is there isno normal instances in abnormal clustering interval set andno abnormal instances in normal clustering interval set, i.e.TT = 1, TF = 0, FF = 1, and FT = 0. When all instancesof training set distribute evenly, the TT , TF , FF , and FTwill be 0. Thus, the τ ∈ [0, 1] denotes distinction degree ofthe clustering intervals to network states. The higher the τ is,the better the clustering intervals’ partition is, and the moresignificant the relevance of MFS-TL characteristic values tonetwork states is. Essentially, it is because the changes of thecharacteristic values can reflect network states.
Here we find that the A, as the individual detector forsingle MFS-TL characteristic, can give detection result byselecting a IFS with maximum membership degree.
B. INTUITIONISTIC FUZZY SET ENSEMBLE FORMULTIPLE CHARACTERISTICSSingle MFS-TL characteristic as the individual detector alonewould be used to detect abnormal in some datasets. But thestudies of complex network anomaly detection indicate thatthe changes of each of characteristics have the inconsistentperformance in same anomaly events [9], [14], [15]. So aensemble method of multiple characteristic IFSs is essentialfor the purpose of eliminating the inconsistent.
For the temporal sequence of one MFS-TL characteristicCi, we can compute its domain of discourse Di and itsIFS Ai based on Section IV-A. Furthermore equation(13)can be extended as following equation for multiple MFS-TLcharacteristics:
Aij(c) = {< c, µAij(c), γAij
(c), πAij(c) > |c ∈ Dj} (15)
Where the i = 1, 2, . . . , p, j = 1, 2, . . . ,m, and the Dj is thejth clustering interval of one MFS-TL characteristic Ci. TheAij(c) represents the IFS of the ith network characteristic cto the jth clustering interval. In other words, the µAij (c) isthe membership function of ith network characteristic valueto jth clustering interval of network characteristic universeDi, the γAij
(c) is the non-membership function of ith net-work characteristic value to jth clustering interval of theuniverse Di, and the πAij
(c) is the hesitation degree.Finally, the intuitionistic fuzzy relationship A between
p MFS-TL characteristics and m clustering intervals arecalculated by carrying out the temporal sequence partitionand intuitionistic fuzzy set construction on the training set.Hence, the above problem becomes the multi-IFSs reasoningproblem. Let C ′ = [c1 c2 . . . cp]
T denotes the character-istic values of a testing MFS-TL g′. Then we define theequation (16) to compute the IFSs B of the characteristiccollection C ′ to m clustering intervals.
B = A�C′ =
A11(c1) A12(c1) . . . A1m(c1)
A21(c2) A22(c2) . . . A2m(c2)
......
......
Ap1(cp)Ap2(cp) . . . Apm(cp)
T
(16)
Where the Bij denotes the membership, non-membershipand hesitation of the jth characteristic value to the i cluster-ing interval, and then the Bi is the IFS that current networkdepicted by p network characteristics is mapped to the ithclustering interval. As a result, the B describes the intu-itionistic fuzzy set between the network characteristics andclustering intervals.
However, for multiple characteristic IFSs B, the sizesof normal interval set NC and abnormal interval set ACare usually different with different MFS-TL characteristic,e.g. the size of the AC of network edge |ACedge| maybe not equal that of network diameter |ACdiameter|. Evenif their sizes are equal, the items of the set NC and ACof each MFS-TL characteristic may not be one-to-one cor-respondence to the domain of discourse D, e.g. i 6= jwhere ACedge0 = Dedge
i and ACdiameter0 = Ddiameterj . In
order to fuse multiple characteristics IFSs, we introduce theintuitionistic fuzzy weighted average operator to separatelycombine the intuitionistic fuzzy sets in clustering interval setNC and AC. Furthermore, the IFSs B between p networkcharacteristics and m cluster intervals are translated intothe IFSs B′ with p network characteristics and two states’linguistic variables L = {L1, L2} based on the distinctionindex function (14) and intuitionistic fuzzy weighted averageoperator.
B′ =
A′11(c1) A′12(c1)
A′21(c2) A′22(c2)
......
A′p1(cp)A′p2(cp)
T
(17)
VOLUME 4, 2016 7

J. Wang et al.: Using Intuitionistic Fuzzy Set for Anomaly Detection of Network Traffic from Flow Interaction
Where A′i1(ci) = {< ci, µA′i1
(ci), γA′i1
(ci), πA′i1
(ci) >|ci ∈ L1} andA′i2(ci) = {< ci, µA′
i2(ci), γA′
i2(ci), πA′
i2(ci) >
|ci ∈ L2}, and the L1 and L2 denote the abnormal clusteringinterval set AC and the normal clustering interval set NCseparately. In order to judgment whether the network isabnormal or not based on multi-characteristic IFSs B′,the IFWG is introduced to fuse IFSs of multiple networkcharacteristics to the linguistic variables.Definition 2 (IFWG): Let αj = (µj , γj) be a collection ofIFS with the weight vector w = (w1, w2, . . . , wp)
T such thatwj ∈ [0, 1] and
∑pj wj = 1. An IFWG operator of dimension
p is a mapping: ωp → ω, and
IFWGω(α1, α2, ..., αp) = αω11 ⊕ α
ω22 ⊕ ...⊕ αωp
p
= (
p∏j=1
uωjaj , 1−
p∏j=1
(1− vaj )ωj ))(18)
Moreover, the weight wi of the ith network characteristic cis calculated based on the distinction index τ of MFS-TLcharacteristic, as the following equation (19):
wi =τi∑p
i=1(τi). (19)
Using the IFWG, the IFS B′′ of MFS-TL structure to each oflinguistic variables is calculated as shown in equation(20).Where the µB′
i(C ′) is the degree of membership of the
network structure to the ith linguistic variable, the γB′i(C ′)
and πB′i(C ′) are the non-membership and hesitation of that.
Then, we defined a method of comparing multiple IFSs,based on the score function and the precision function, toobtain the defuzzification of the B′.
B′′ = IFWGω(B′)
=
({< C ′, µ(C ′), γ(C ′), π(C ′) > |C ′ ∈ L1}{< C ′, µ(C ′), γ(C ′), π(C ′) > |C ′ ∈ L2}
)(20)
Definition 3 (Score function [48]): For any intuitionisticfuzzy set A =< µ, γ >, the score function S(A) of this IFSis defined as follows:
S(A) = µ− γ, S(A) ∈ [−1, 1] (21)
It can be seen that the larger the value of S(A) is, the bettermembership relationship the intuitionistic fuzzy set A is.Definition 4 (Precision function [49]): For any intuitionisticfuzzy set A =< µ, γ >, the precision function H(A) of thisIFS is defined as follows:
H(A) = µ+ γ, H(A) ∈ [0, 1] (22)
The larger the value of H(A) is, the higher the precisiondegree of the intuitionistic fuzzy set A =< µ, γ > is.For any tow intuitionistic fuzzy set A1 =< µ, γ > andB =< µ, γ >, the followings hold true:
1) If S(A) < S(B), then A < B2) If S(A) = S(B):
a) WhenH(A) = H(B), thenA = B, that isA andB represent the same information.
b) When H(A) < H(B), then A < B.Based on above rules, the two intuitionistic fuzz logic of theB′′ can be compared each other. Then the sorted vector isgiven R = {B′′1, B′′2}, and the B′′1 is the detection resultof our method.
V. EXPERIMENTAL RESULTSIn order to analyze the complex network feature of ourmodel and verify the anomaly detection performance of ourmethod, we use a variety of publicly available real Internettraffic traces: (1) ISOT dataset, (2) CTU dataset, and (3) CI-CIDS2017 dataset. These traces are non-sampled and includeup to layer-4 headers with no payload. In this section, ourworks consist of the analysis of the MFS-TL parameters andMFS-TL statistical characteristics, and the evaluation of ouranomaly detection method.
A. DATASETThe ISOT dataset is the combination of several existing pub-licly available malicious and non-malicious datasets, such asthe abnormal dataset from the French chapter of the honeynetproject, and the normal datasets from the Traffic Lab atEricssion Research in Hungary and the Lawrence BerkeleyNational Lab (LBNL) . As mentioned in Reference [50], theexperimental data is produced by merging multiple originaldatasets into a single individual trace file. Based on thiscombined traces, we selected two pieces of data: the LBNLnormal data on Jan 6, 2005 and Jan 7, 2005, and the ab-normal data captured at 22:00−23:00 on Oct 7, 2010. Then,having the normal traffic at 2005-01-06 20:00:00−2005-01-07 00:26:00 and 2005-01-07 20:00:00−2005-01-08 00:26:00as background traffic, the abnormal traffic is separately in-jected into background traffic. Furthermore, we obtain theexperimental datasets ISOT-06 and ISOT-07 which includethe Storm and Waledac anomalous activities.
The CTU is a dataset of anomalous traffic that was cap-tured in the CTU University, in 2011. The goal of the datasetwas to have a large capture of real botnet traffic mixedwith normal traffic. The CTU dataset consists in thirteencaptures of different botnet samples. On each sample a spe-cific malware was executed, which used several protocolsand performed different actions. In this paper, the samplesCTU-4 and CTU-9 are adopted which executed the malicioussoftwares Rbot and Neris, respectively [51].
The CICIDS2017 dataset contains benign and the mostup-to-date common attacks, which resembles the true real-world data [52]. The data capturing period started at 9:00,July 3, 2017 and ended at 17:00 on July 7, 2017, for atotal of 5 days. The first day is the normal day and onlyincludes the benign traffic. The implemented attacks includeBrute Force FTP, Brute Force SSH, DoS, Heartbleed, WebAttack, Infiltration, Botnet, and DDoS. They have been ex-ecuted both morning and afternoon on the other days. TheSSH-Patator(i.e. Brute Force SSH attack) and CICIDS-DoS(including the DoS-Slowloris, DoS-Slowhttptest, DoS-Hulk,DoS-GoldenEye, and DDoS-LOIT attacks) are selected in
8 VOLUME 4, 2016

J. Wang et al.: Using Intuitionistic Fuzzy Set for Anomaly Detection of Network Traffic from Flow Interaction
TABLE 1: Publicly available network traffic datasets from ISOT, CTU and CICIDS project.
Name Date/Time Duration Unique IPs 2-tuple flows 5-tuple flows Abnormal 5-tuple flows Packets Abnormal packetsISOT-06 2005-01-06/20:00:00 4.33 hrs 14,492 35,362 142,955 32,945(23.05%) 8,946,619 370,099(4.41%)ISOT-07 2005-01-07/20:00:00 4.00 hrs 13,906 31,269 137,307 32,945(23.99%) 10,001,278 370,099(3.70%)CTU-4 2011-08-15/11:00:05 4.17 hrs 185,372 211,050 722,810 1,735(0.24%) 4,171,952 3,718(0.09%)CTU-9 2011-08-17/12:01:01 5.18 hrs 366,096 455,340 1,178,257 93,736(7.96%) 8,003,477 382,708(4.78%)CICIDS-SSH 2017-07-04/14:00:00 2.00 hrs 4,072 7,130 66,307 2,551(3.85%) 1,703,856 5,063(0.30%)CICIDS-DoS 2017-07-05/09:47:00 3.86 hrs 6,658 12,870 169,144 24,357(14.40%) 6,904,454 294,218(4.26%)
our work. Moreover, the normal traffic from the fist traceswith corresponding time period of the attack event is alsoextracted as the normal traffic of this attack.
Table 1 summarizes the captured time, the captured du-ration, and the number of unique IPs, 2-tuple flows (f ={sa, da}), 5-tuple flows (f = {sa, da, sp, dp, pr}), abnormal5-tuple flows, network packets and abnormal packets. Notedthat the values in parentheses denote the percentage of theabnormal flows. Based on existed data labels, we propose anew label method because the MFS-TL is constructed on thesampled traffic traces with a fixed time interval. Specifically,we calculate the ratio γ between the number of abnormalflows and the total flows in one sampled traffic traces. If theratio γ is not less than 0.001, this sample is labeled withabnormal, otherwise it is normal.
Additionally, we have used four following common eval-uation metrics: accuracy, precision, recall, and F-Measure.Accuracy (Acc) is the percentage of all normal and anomalyinstances that are correctly classified. Precision (Pre) is thepercentage of correctly detected anomaly instances over alldetected anomaly instances. Recall (Rec) is the percentageof anomaly instances correctly detected. F-Measure (F1) is aharmonic combination of the precision Pre and recall Recinto a single measure. Based on above definitions, we givefollowing equations:
Acc =TP + TN
TP + TN + FP + FN
Pre =TP
TP + FP
Rec =TP
TP + FN
F1 =2 ∗ Pre ∗RecPre+Rec
(23)
Where the True Positives (TP ) measures how many in-stances of a given class are correctly classified; the TrueNegatives (TN ) measures the number of correctly classifiedinstances of a class; the False Positives (FP ) measures howmany instances of other classes are confused with a givenclass; and the False Negatives (FN ) measures the number ofmisclassified instances of a class.
B. PARAMETER ANALYSIS OF THE MFS-TLAs defined in MFS-TL model, the temporal locality window∆w and multivariate flow similarity critical threshold rc aretwo key parameters which determine the connectivity amongthe flows. Thus how to select an appropriate temporal localitywindow and multivariate flow similarity critical threshold
are very important for MFS-TL structure. Theoretically, thebigger ∆w or lower rc offers the higher connection prob-ability of two flow nodes. As a result, the network densityof the MFS-TL increases with the above parameter values.However, if the ∆w is big enough that the MFS-TL loses thepurpose of depicting the interaction relationship among theflows. When the rc is close to 0, every flow becomes the iso-lated node of the MFS-TL. Conversely, if the ∆w is too smallor the rc is too high, some valuable connections in MFS-TLwould be filtered. Thus the ∆w and rc should be determinedto the proper values by which the complex network MFS-TLcan capture the interactive feature of the network traffic flowtime series. For the purpose of constructing a proper MFS-TL, a group of complex network characteristics are analyzedas a function of the ∆w and rc, as shown in Fig.1.
First, the network traffic traces from the ISOT-06, CTU-9,and CICIDS-SSH are split with the 1 minute sampling time.Second, given the ∆w and rc, we can construct one MFS-TLfor one sampled traffic traces. Thus, each of traffic datasetsis translated into the MFS-TL sequences with the fixed ∆wand rc. Then, we calculate the characteristics of all MFS-TLs, such as the node number, edge number, mean degree,max degree, clique, K-core, entropy, clustering coefficient,assortative coefficient, SPL, diameter(mean), diameter(max)and power-law of network degree distribution, as shown inTable 2. Finally, the contour is used to plot the distributionsof the characteristic values as a function of the ∆w and rc.Due to the space limitation, only four distributions includingthe edge number, mean degree, SPL, and entropy of the CTU-9 are presented in Fig.1. The statistical results from ISOT-06, CTU-9, and CICIDS-SSH show that the distributionsabout mean degree, clique, and K-core are similar with theFig.1a and 1b, the assortative, SPL, and diameter(max) aresimilar with the Fig.1d. But the distribution of the clusteringor power-law is different from the other characteristics, andis different with different datasets.
Observing the distributions of Fig.1, we found that thevalues of edge or max degree increase linearly, the entropygrows as a power of the ∆w, and the SPL decreases as apower of the ∆w, when the rc is a fixed value. However,when the ∆w is a fixed value, the values of edge, maxdegree, and entropy decrease exponentially, and the SPLgrows exponentially. But, when the 0.6 < rc < 0.8, thechanges of the edge number and the max degree becomerelatively slow. However, the entropy and SPL have mutationcorrespondingly. As we all know, the lower the systemicentropy is, the easier it is to accurately describe its micro-
VOLUME 4, 2016 9

J. Wang et al.: Using Intuitionistic Fuzzy Set for Anomaly Detection of Network Traffic from Flow Interaction
TABLE 2: The used characteristic metrics for the MFS-TL.
Characteristic DescriptionNode number The number of network nodes.Edge number The number of network edges.Mean Degree The average degree connectivity of a network.Max Degree The maximum degree connectivity of a network.MDR The ratio of the maximum degree in a network.K-core The maximum sub-network in which node degree ≥ k.Clique The number of the largest clique of a network.Clustering The transitivity of all nodes in a network.Assortative A preference for a network’s nodes to attach to others.Entropy The measure of unpredictability of network structure.SPL The average of shortest paths of all pairs of nodes.Diameter(max) The maximum of shortest paths of all pairs of nodes.Diameter(mean) The maximum of average paths of all pairs of nodes.Power-law The slope of best-fit line for degree distribution.
scopic state [53]. Thus, in this paper the multivariate flowsimilarity critical threshold rc is selected at the mutationpoint, i.e. rc = 0.65. Meanwhile considering the IP latency,that the communication latency within a country is usually0.03s−0.05s and that between two countries, especially thetranscontinental, is 0.1s−0.15s 1, the temporal locality win-dow ∆w is set as 0.1s.
0.02 0.06 0.10 0.14 0.18w(s)
0.0
0.2
0.4
0.6
0.8
r c
(a) Edge Number
0e+008e+042e+052e+053e+054e+055e+056e+056e+05
Edge
Num
ber
0.02 0.06 0.10 0.14 0.18w(s)
0.0
0.2
0.4
0.6
0.8
r c
(a) Max degree
015003000450060007500900010500
Max
deg
ree
0.02 0.06 0.10 0.14 0.18w(s)
0.0
0.2
0.4
0.6
0.8
r c
(a) Entropy
0.1250.2000.2750.3500.4250.5000.5750.650
Entro
py
0.02 0.06 0.10 0.14 0.18w(s)
0.0
0.2
0.4
0.6
0.8
r c
(a) SPL
1.752.503.254.004.755.506.257.00
SPL
FIGURE 1: Distributions between temporal locality window(∆w), multivariate flow similarity critical threshold rc andMFS-TL characteristics values in CTU-9 dataset.
C. STATISTICAL CHARACTERISTICS OF THE MFS-TLIn order to describe the structure feature of MFS-TL, 14network characteristic metrics are introduced in Table 2.Each of MFS-TL characteristic metrics will present specificstructure feature depending on itself definition. For instance,the node number and edge number denote the network size.The MDR shows the importance of max-degree node in anetwork. The SPL and the diameter can evaluate the trans-mission performance of a network. The power-law pointsout the node preference attachment in a network. In thissection, the CTU-9 dataset is used to study the dynamical
1http://www.verizonenterprise.com/about/network/latency/
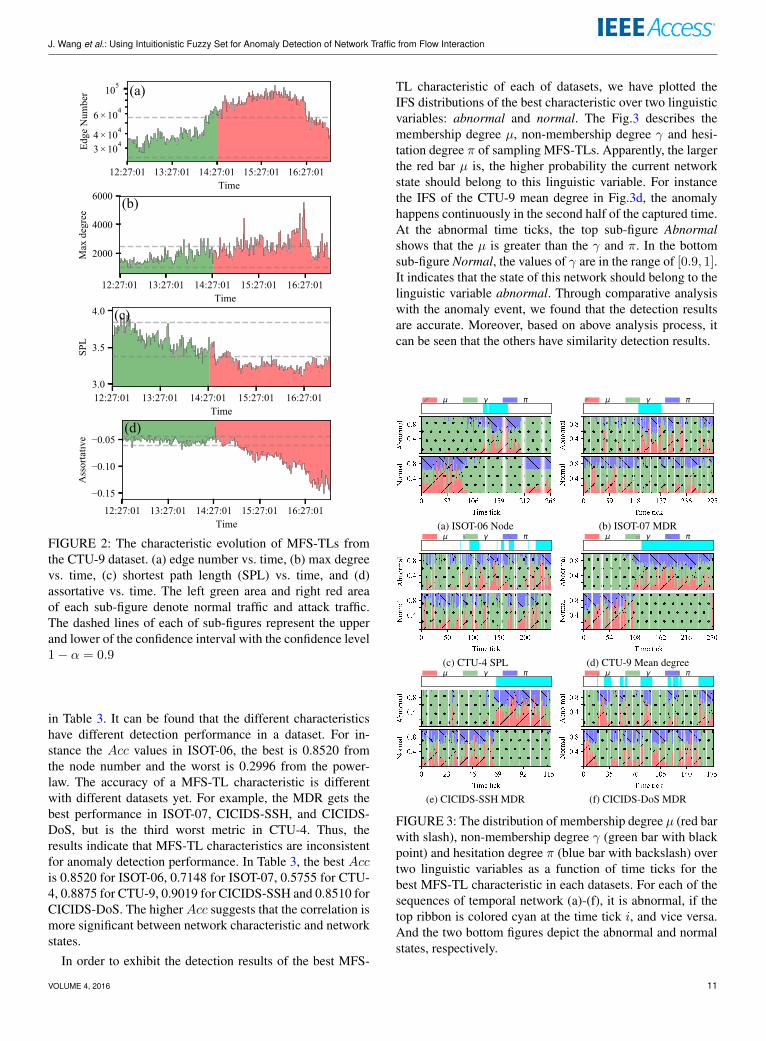
evolution of the MFS-TLs with anomaly events. Based onabove method, the sampling MFS-TL was constructed, theMFS-TL characteristics were calculated, and then the char-acteristic values was plotted as a function of time. But dueto the space limitation, in Fig.2 we only exhibit the dynamicevolution of some characteristics including the edge number,max degree, SPL and assortative coefficient. Following themethod proposed in Section V-A, the real network states (i.e.,normal or abnormal) are labeled over time tick. In Fig.2,the left green area and right red area of each sub-figure de-note normal traffic and attack traffic. Clearly, the correlationbetween the network characteristic evolution and networkstates can be classified into three types: positive correlation,negative correlation and non-correlation. For instance, inthe CTU-9 dataset the evolutions of the node number, edgenumber, mean degree, clustering, K-core, clique and entropyare positive correlative with network states (e.g. Fig.2a),those of the SPL, diameter(mean), and diameter(max) arenegative correlative with network states (e.g. Fig.2c and 2d),and the MDR, max degree, power-law are non-correlativewith network states (e.g. Fig.2b). It suggests that the MFS-TLcharacteristic measurement will be a effective method for In-ternet traffic anomaly detection. Further analysis shows thatthe correlation between MFS-TL characteristic and networkstate is non-deterministic in a datasets.
According to observing the distributions of network char-acteristics, we found the normal state’s values of most of net-work characteristics follow the Gaussian distribution. Thus,we define a simple rule for the statistical characteristic: thesampling MFS-TL is anomaly if the network characteristicvalue ci is lower than the ψ in which the ψ indicates theabnormal threshold for a given network characteristic se-quence. So the threshold ψ is related to the performance ofthe anomaly detection. Given a confidence interval θ, thethreshold ψ can be computed by ψ = µ + λσ, where µand σ denote the mean and the standard deviation of onecharacteristic sequence C = {c1, c2, . . . , cn}. And the λ isthe quantile of the normal distribution corresponding to thegiven confidence interval θ [54]. In this paper, the ε is 0.1that confidence level of a MFS-TL characteristic sequenceis 1 − ε = 0.9. Accordingly, the best detection metrics ofCTU-9 MFS-TLs is the SPL, 0.9383, and the worst one isthe diameter(max), 0.2469.
D. SINGLE CHARACTERISTIC-BASED ANOMALYDETECTIONTo analyze the evolution of MFS-TLs characteristics in alldatasets, we found that there are the positive correlation,negative correlation and non-correlation between networkcharacteristic and network states. For this reason, we use theintuitionistic fuzzy set (IFS) to quantify the non-deterministiccorrelations, that is let membership degree, non-membershipdegree, and hesitation degree of the IFS describe the positivecorrelation, negative correlation and non-correlation.
First, we calculate the anomaly detection accuracy (Acc)based on the IFS of single MFS-TL characteristic, as shown
10 VOLUME 4, 2016
J. Wang et al.: Using Intuitionistic Fuzzy Set for Anomaly Detection of Network Traffic from Flow Interaction
12:27:01 13:27:01 14:27:01 15:27:01 16:27:01Time
105
3 × 1044 × 104
6 × 10⁴
Edge
Num
ber (a)
12:27:01 13:27:01 14:27:01 15:27:01 16:27:01Time
2000
4000
6000
Max
deg
ree
(b)
12:27:01 13:27:01 14:27:01 15:27:01 16:27:01Time
3.0
3.5
4.0
SPL
(c)
12:27:01 13:27:01 14:27:01 15:27:01 16:27:01Time
0.15
0.10
0.05
Ass
orta
tive
(d)
FIGURE 2: The characteristic evolution of MFS-TLs fromthe CTU-9 dataset. (a) edge number vs. time, (b) max degreevs. time, (c) shortest path length (SPL) vs. time, and (d)assortative vs. time. The left green area and right red areaof each sub-figure denote normal traffic and attack traffic.The dashed lines of each of sub-figures represent the upperand lower of the confidence interval with the confidence level1− α = 0.9
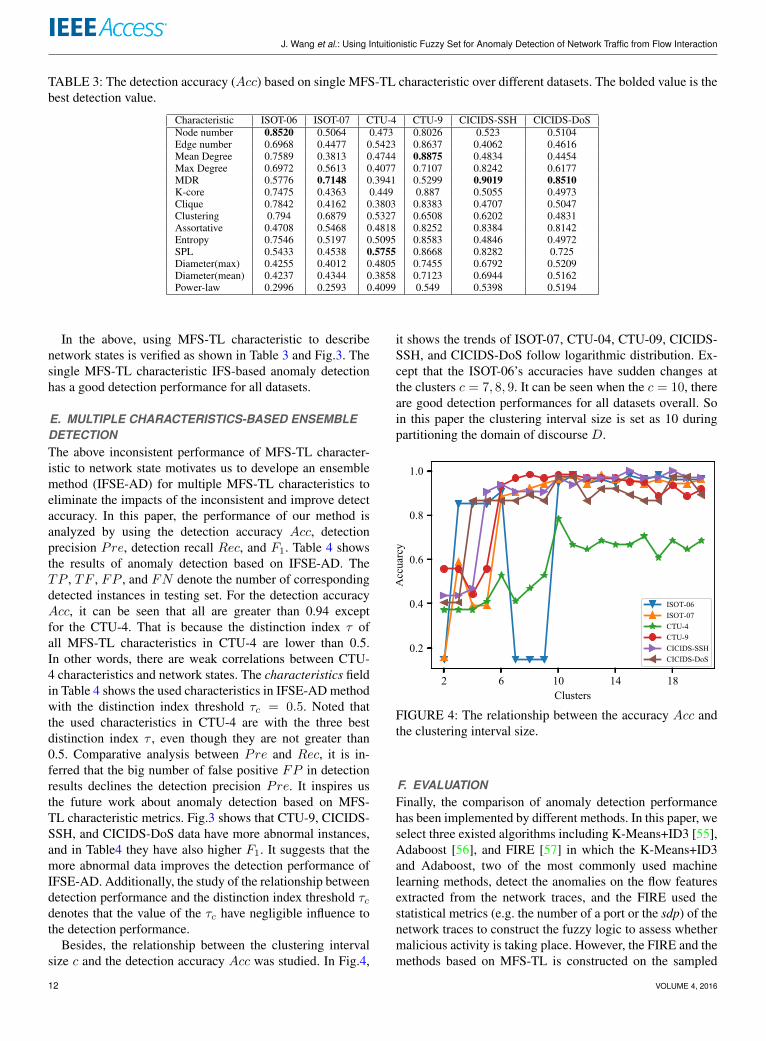
in Table 3. It can be found that the different characteristicshave different detection performance in a dataset. For in-stance the Acc values in ISOT-06, the best is 0.8520 fromthe node number and the worst is 0.2996 from the power-law. The accuracy of a MFS-TL characteristic is differentwith different datasets yet. For example, the MDR gets thebest performance in ISOT-07, CICIDS-SSH, and CICIDS-DoS, but is the third worst metric in CTU-4. Thus, theresults indicate that MFS-TL characteristics are inconsistentfor anomaly detection performance. In Table 3, the best Accis 0.8520 for ISOT-06, 0.7148 for ISOT-07, 0.5755 for CTU-4, 0.8875 for CTU-9, 0.9019 for CICIDS-SSH and 0.8510 forCICIDS-DoS. The higherAcc suggests that the correlation ismore significant between network characteristic and networkstates.
In order to exhibit the detection results of the best MFS-
TL characteristic of each of datasets, we have plotted theIFS distributions of the best characteristic over two linguisticvariables: abnormal and normal. The Fig.3 describes themembership degree µ, non-membership degree γ and hesi-tation degree π of sampling MFS-TLs. Apparently, the largerthe red bar µ is, the higher probability the current networkstate should belong to this linguistic variable. For instancethe IFS of the CTU-9 mean degree in Fig.3d, the anomalyhappens continuously in the second half of the captured time.At the abnormal time ticks, the top sub-figure Abnormalshows that the µ is greater than the γ and π. In the bottomsub-figure Normal, the values of γ are in the range of [0.9, 1].It indicates that the state of this network should belong to thelinguistic variable abnormal. Through comparative analysiswith the anomaly event, we found that the detection resultsare accurate. Moreover, based on above analysis process, itcan be seen that the others have similarity detection results.
(a) ISOT-06 Node (b) ISOT-07 MDR
(c) CTU-4 SPL (d) CTU-9 Mean degree
(e) CICIDS-SSH MDR (f) CICIDS-DoS MDR
FIGURE 3: The distribution of membership degree µ (red barwith slash), non-membership degree γ (green bar with blackpoint) and hesitation degree π (blue bar with backslash) overtwo linguistic variables as a function of time ticks for thebest MFS-TL characteristic in each datasets. For each of thesequences of temporal network (a)-(f), it is abnormal, if thetop ribbon is colored cyan at the time tick i, and vice versa.And the two bottom figures depict the abnormal and normalstates, respectively.
VOLUME 4, 2016 11
J. Wang et al.: Using Intuitionistic Fuzzy Set for Anomaly Detection of Network Traffic from Flow Interaction
TABLE 3: The detection accuracy (Acc) based on single MFS-TL characteristic over different datasets. The bolded value is thebest detection value.
Characteristic ISOT-06 ISOT-07 CTU-4 CTU-9 CICIDS-SSH CICIDS-DoSNode number 0.8520 0.5064 0.473 0.8026 0.523 0.5104Edge number 0.6968 0.4477 0.5423 0.8637 0.4062 0.4616Mean Degree 0.7589 0.3813 0.4744 0.8875 0.4834 0.4454Max Degree 0.6972 0.5613 0.4077 0.7107 0.8242 0.6177MDR 0.5776 0.7148 0.3941 0.5299 0.9019 0.8510K-core 0.7475 0.4363 0.449 0.887 0.5055 0.4973Clique 0.7842 0.4162 0.3803 0.8383 0.4707 0.5047Clustering 0.794 0.6879 0.5327 0.6508 0.6202 0.4831Assortative 0.4708 0.5468 0.4818 0.8252 0.8384 0.8142Entropy 0.7546 0.5197 0.5095 0.8583 0.4846 0.4972SPL 0.5433 0.4538 0.5755 0.8668 0.8282 0.725Diameter(max) 0.4255 0.4012 0.4805 0.7455 0.6792 0.5209Diameter(mean) 0.4237 0.4344 0.3858 0.7123 0.6944 0.5162Power-law 0.2996 0.2593 0.4099 0.549 0.5398 0.5194
In the above, using MFS-TL characteristic to describenetwork states is verified as shown in Table 3 and Fig.3. Thesingle MFS-TL characteristic IFS-based anomaly detectionhas a good detection performance for all datasets.
E. MULTIPLE CHARACTERISTICS-BASED ENSEMBLEDETECTIONThe above inconsistent performance of MFS-TL character-istic to network state motivates us to develope an ensemblemethod (IFSE-AD) for multiple MFS-TL characteristics toeliminate the impacts of the inconsistent and improve detectaccuracy. In this paper, the performance of our method isanalyzed by using the detection accuracy Acc, detectionprecision Pre, detection recall Rec, and F1. Table 4 showsthe results of anomaly detection based on IFSE-AD. TheTP , TF , FP , and FN denote the number of correspondingdetected instances in testing set. For the detection accuracyAcc, it can be seen that all are greater than 0.94 exceptfor the CTU-4. That is because the distinction index τ ofall MFS-TL characteristics in CTU-4 are lower than 0.5.In other words, there are weak correlations between CTU-4 characteristics and network states. The characteristics fieldin Table 4 shows the used characteristics in IFSE-AD methodwith the distinction index threshold τc = 0.5. Noted thatthe used characteristics in CTU-4 are with the three bestdistinction index τ , even though they are not greater than0.5. Comparative analysis between Pre and Rec, it is in-ferred that the big number of false positive FP in detectionresults declines the detection precision Pre. It inspires usthe future work about anomaly detection based on MFS-TL characteristic metrics. Fig.3 shows that CTU-9, CICIDS-SSH, and CICIDS-DoS data have more abnormal instances,and in Table4 they have also higher F1. It suggests that themore abnormal data improves the detection performance ofIFSE-AD. Additionally, the study of the relationship betweendetection performance and the distinction index threshold τcdenotes that the value of the τc have negligible influence tothe detection performance.
Besides, the relationship between the clustering intervalsize c and the detection accuracy Acc was studied. In Fig.4,
it shows the trends of ISOT-07, CTU-04, CTU-09, CICIDS-SSH, and CICIDS-DoS follow logarithmic distribution. Ex-cept that the ISOT-06’s accuracies have sudden changes atthe clusters c = 7, 8, 9. It can be seen when the c = 10, thereare good detection performances for all datasets overall. Soin this paper the clustering interval size is set as 10 duringpartitioning the domain of discourse D.
2 6 10 14 18Clusters
0.2
0.4
0.6
0.8
1.0
Acc
uarc
y
ISOT-06ISOT-07CTU-4CTU-9CICIDS-SSHCICIDS-DoS
FIGURE 4: The relationship between the accuracy Acc andthe clustering interval size.
F. EVALUATIONFinally, the comparison of anomaly detection performancehas been implemented by different methods. In this paper, weselect three existed algorithms including K-Means+ID3 [55],Adaboost [56], and FIRE [57] in which the K-Means+ID3and Adaboost, two of the most commonly used machinelearning methods, detect the anomalies on the flow featuresextracted from the network traces, and the FIRE used thestatistical metrics (e.g. the number of a port or the sdp) of thenetwork traces to construct the fuzzy logic to assess whethermalicious activity is taking place. However, the FIRE and themethods based on MFS-TL is constructed on the sampled
12 VOLUME 4, 2016

J. Wang et al.: Using Intuitionistic Fuzzy Set for Anomaly Detection of Network Traffic from Flow Interaction
TABLE 4: The performance of anomaly detection based on our method.
Dataset Characteristic TP TF FP FN Acc Pre Rec F1
ISOT-06 Node, Edge, Mean degree, Clique, Clustering,Entropy, K-Core, Max degree.
8 43 3 0 0.9444 0.7273 1.0000 0.8421
ISOT-07 Node, MDR, Clustering. 7 42 1 1 0.9608 0.8750 0.8750 0.8750
CTU-4 Entropy, Edge, Mean Degree. 18 22 10 1 0.7843 0.6423 0.9474 0.7660
CTU-9 SPL, Mean Degree, K-Core, Edge, Entropy,Assortative, Clique, Node, Diameter(mean),Diameter(max).
34 26 1 0 0.9836 0.9714 1.0000 0.9855
CICIDS-SSH SPL, MDR, Max degree, Assortative. 13 18 0 1 0.9688 1.0000 0.9286 0.9630
CICIDS-DOS MDR, Assortative. 15 21 1 0 0.9730 0.9375 1.0000 0.9677
TABLE 5: Comparison of the accuracy/F1 of anomaly detection by different methods.
Dataset K-Means+ID3 Adaboost FIRE Gaussian-Dist IFS-AD IFSE-ADISOT-06 0.7871 / 0.8370 0.9730 / 0.9793 0.8410 / 0.9695 0.9705 / 0.9811 0.8520 / 0.7022 0.9444 / 0.8421ISOT-07 0.6519 / 0.7448 0.8640 / 0.9218 0.9347 / 0.9650 0.7222 / 0.7826 0.7148 / 0.5180 0.9608 / 0.8750CTU-4 0.9898 / 0.9011 0.7120 / 0.8296 0.8280 / 0.9043 0.5517 / 0.6422 0.5755 / 0.4427 0.7843 / 0.7660CTU-9 0.7861 / 0.7987 0.5590 / 0.7153 0.7245 / 0.7700 0.9383 / 0.9667 0.8875 / 0.9059 0.9836 / 0.9855CICIDS-SSH 0.7734 / 0.8043 0.8330 / 0.9441 0.8185 / 0.8592 0.8272 / 0.8940 0.9019 / 0.8832 0.9688 / 0.9630CICIDS-DoS 0.8055 / 0.8586 0.8880 / 0.9280 0.5020 / 0.6586 0.9483 / 0.9697 0.8510 / 0.8192 0.9730 / 0.9677
network traces with 1 minute sampling interval. So, the sizesof training set and testing set are far less than those of theK-Means+ID3 and Adaboost. Moreover, the Gaussian-Distrepresents the anomaly detection method based on Gaussiandistribution mentioned in the Section V-C. The IFS-ADrepresents the single characteristic-based anomaly detectionmethod proposed in the Section V-D. In this paper, the IFS-AD and IFSE-AD methods makes a fuzzification for everycharacteristic value to two states’ linguist variables, and findwhich represents a best membership degree with multiplecharacteristics. In Table 5, the values denote the anomalydetection accuracy Acc and F1 separately. According to thecomparison results, we found that the detection accuracyAccof the IFSE-AD are far better than that of K-Means+ID3,Adaboost, and FIRE. Although, the IFS-AD Acc and F1 arelower than the Gaussian-Dist, the IFS provide a good enoughexpression mechanism for the correlations between MFS-TLcharacteristic and network states that the IFSE-AD based onmultiple characteristics has a better anomaly performancethan the Gaussian-Dist. Additionally, we found that the meth-ods based on the flow statistics and flow interaction havedifferent sensitivity to the traffic data. Specifically, the K-Means+ID3, Adaboost, and FIRE based on the flow statisticshave a better performance for what contains fewer anomalyactivities. The Gaussian-Dist, IFS-AD, and IFSE-AD basedon the flow interaction have a better performance for whatcontains more anomaly activities.
VI. CONCLUSION
In this work we have proposed the intuitionistic fuzzy setensemble method (IFSE-AD) for anomaly detection of net-work traffic from the perspective of flow interaction. On the
one hand, the multivariate flow similarity complex networkmodel (MFS-TL) not only describe the interaction behav-iors of large scale network flows, but also can monitor thedynamics of network traffic flows. On the other hand, ourquantitative evaluation for network anomaly behaviors onpublicly available network traffic datasets with ground truthshow that building the IFSE-AD is effective in boostingdetection performance.
Initially, based on complex network theory, a complex net-work model, i.e. MFS-TL, is constructed by computing themultivariate flow similarity on temporal locality. Analyzingthe relationships between MFS-TL characteristics, temporallocality window ∆w, and multivariate flow similarity criticalthreshold rc, an approach for parameter determination is es-tablished, i.e. finding the mutation point of MFS-TL entropyand SPL, and considering the communication latency. Thus,as shown in Fig.1 the parameters are set as ∆w = 0.1s andrc = 0.65 which exhibit the complexity and dynamic ofnetwork traffic. Observing the evolution of statistical charac-teristics of the MFS-TLs, three non-deterministic correlationtypes between MFS-TL characteristic and network state aredefined, i.e. positive correlation (e.g. Fig.2a), negative cor-relation (e.g. Fig.2c and Fig.2d), and non-correlation (e.g.Fig.2b).
Then, we introduced the intuitionistic fuzzy set (IFS)to quantify the correlation between MFS-TL characteristicand network state, i.e. membership degree of the IFS forpositive correlation, non-membership degree of the IFS fornegative correlation, and hesitation degree of the IFS fornon-correlation. Furthermore, for a MFS-TL characteristicsequence, a IFS-based anomaly detection method (IFS-AD)is put forward to detect traffic anomalies. In IFS-AD, a Gaus-
VOLUME 4, 2016 13

J. Wang et al.: Using Intuitionistic Fuzzy Set for Anomaly Detection of Network Traffic from Flow Interaction
sian distribution-based membership function with a variablehesitation degree is designed to express the objectivity ofintuitionistic fuzzification. The proposed distinction indexresolves the mapping problem from multiple clustering inter-vals of the IFS to two states’ linguistic variables. Accordingto the accuracies in Table 3, we find the MDR obtains thebest performance in ISOT-07 (Acc=0.7148), CICIDS-SSH(Acc=0.9019), and CICIDS-DoS (Acc=0.8510). Overall, ev-ery MFS-TL characteristic has different performance in adataset, and the performance of a characteristic is also differ-ent with different datasets. It shows the inconsistent behav-iors about MFS-TL characteristic to network state. Therefore,the intuitionistic fuzzy set ensemble method (IFSE-AD) isproposed to fuse the IFSs of multiple MFS-TL characteristicsto eliminate the impacts of the inconsistent performance. Thescore function and precision function are used to sort thefused IFS.
Finally we carried out extensive experiments on severalnetwork traffic datasets for anomaly detection. The detectaccuracy/F1 of the IFS-AD are 0.9444/0.8421 for ISOT-06, 0.9608/0.8750 for ISOT-07, 0.7843/0.7660 for CTU-4,0.9836/0.9855 for CTU-9, 0.9688/0.9630 for CICIDS-SSH,and 0.9730/0.9677 for CICIDS-DoS. The results demonstratethe superiority of our method to state-of-the-art approaches,validating the effectiveness of our method. Additionally, themethods based on the flow statistics and flow interaction havedifferent sensitivity to the data: the K-Means+ID3, Adaboost,and FIRE based on the flow statistics have a better perfor-mance in network traffic containing fewer anomaly activities.The Gaussian-Dist, IFS-AD, and IFSE-AD based on the flowinteraction have a better performance in which contains moreanomaly activities. All source code of our methods, the dataused in this work, and the more charts about parametersanalysis and statistical characteristics of MFS-TL are sharedopenly at http://file.mervin.me/project/internet-mfstl-ad
REFERENCES[1] M. H. Bhuyan, D. K. Bhattacharyya, and J. K. Kalita, “Network anomaly
detection: Methods, systems and tools,” IEEE Communications SurveysTutorials, vol. 16, no. 1, pp. 303–336, First 2014.
[2] D. J. Weller-Fahy, B. J. Borghetti, and A. A. Sodemann, “A survey ofdistance and similarity measures used within network intrusion anomalydetection,” IEEE Communications Surveys Tutorials, vol. 17, no. 1, pp.70–91, Firstquarter 2015.
[3] K. Xu, F. Wang, S. Bhattacharyya, and Z. L. Zhang, “A real-time networktraffic profiling system,” in 37th Annual IEEE/IFIP International Confer-ence on Dependable Systems and Networks (DSN’07), June 2007, pp. 595–605.
[4] Cisco, “Midyear cybersecurity report,” Cisco Systems, San Jose, CA, US,Tech. Rep., 2017.
[5] S. Liu, X. Gao, W. Fang, Q. Sun, S. Feng, X. Liu, and S. Guo, “Modelingthe complex network of multidimensional information time series tocharacterize the volatility pattern evolution,” IEEE Access, vol. 6, pp.29 088–29 097, 2018.
[6] S. Supriya, S. Siuly, H. Wang, J. Cao, and Y. Zhang, “Weighted visibilitygraph with complex network features in the detection of epilepsy,” IEEEAccess, vol. 4, pp. 6554–6566, 2016.
[7] J. F. WANG, H. ZHAO, X. LIU, and H. Q. LI, “Construction of pestrelationship network based on space influence domain and its analysis,”Journal of Northeastern University (Natural Science), vol. 37, no. 12, pp.1700 – 1704, 2016.
[8] A. Garcia-Robledo, A. Diaz-Perez, and G. Morales-Luna, “Correlationanalysis of complex network metrics on the topology of the internet,” in2013 10th International Conference and Expo on Emerging Technologiesfor a Smarter World (CEWIT), Oct 2013, pp. 1–6.
[9] J. Wang, S. Jia, H. Zhao, J. Xu, and C. Lin, “Internet anomaly detectionbased on complex network path,” IEICE Transactions on Communica-tions, vol. 101, no. 12, pp. 1–12, 2018.
[10] M. Iliofotou, P. Pappu, M. Faloutsos, M. Mitzenmacher, S. Singh, andG. Varghese, “Network monitoring using traffic dispersion graphs (tdgs),”in Proceedings of the 7th ACM SIGCOMM Conference on Internet Mea-surement, ser. IMC ’07. New York, NY, USA: ACM, 2007, pp. 315–320.
[11] K. Xu, F. Wang, and L. Gu, “Behavior analysis of internet traffic viabipartite graphs and one-mode projections,” IEEE/ACM Trans. Netw.,vol. 22, no. 3, pp. 931–942, jun 2014.
[12] J. Wang, H. Zhao, S. Si, H. Yu, S. Chao, and X. He, “Using ComplexNetwork Theory for Temporal Locality in Network Traffic Flows,” ArXive-prints, jul 2018.
[13] L. Akoglu, H. Tong, and D. Koutra, “Graph based anomaly detection anddescription: A survey,” Data Min. Knowl. Discov., vol. 29, no. 3, pp. 626–688, may 2015.
[14] S. Rayana and L. Akoglu, “Less is more: Building selective anomalyensembles,” ACM Trans. Knowl. Discov. Data, vol. 10, no. 4, pp. 42:1–42:33, May 2016.
[15] A. Jun, Z. Hai, K. M. Carley, S. Zhan, and L. Hui, “Evolution of ipv6internet topology with unusual sudden changes,” Chinese Physics B,vol. 22, no. 7, p. 078902, 2013.
[16] T. M. ZHU Xiao-Yan, LIU Zong-Hua, “Detrended fluctuation analysis oftraffic data,” Chinese Physics Letters, vol. 24, no. 7, pp. 2142–2145, 2007.
[17] Z. Zhang, Z. Hao, S. Zeadally, J. Zhang, B. Han, and H. C. Chao,“Multiple attributes decision fusion for wireless sensor networks based onintuitionistic fuzzy set,” IEEE Access, vol. 5, pp. 12 798–12 809, 2017.
[18] B. Kavitha, K. Subramanian, and S. M. P, “Emerging intuitionistic fuzzyclassifiers for intrusion detection system,” Journal of Advances in Infor-mation Technology, vol. 2, no. 2, pp. 99–108, 2011.
[19] Z. Xu and R. R. Yager, “Some geometric aggregation operators basedon intuitionistic fuzzy sets,” International Journal of General Systems,vol. 35, no. 4, pp. 417–433, 2006.
[20] M. Ahmed, A. N. Mahmood, and J. Hu, “A survey of network anomalydetection techniques,” Journal of Network and Computer Applications,vol. 60, pp. 19 – 31, 2016.
[21] Y. Sasaka, T. Ogawa, and M. Haseyama, “A novel framework for estimat-ing viewer interest by unsupervised multimodal anomaly detection,” IEEEAccess, vol. 6, pp. 8340–8350, 2018.
[22] C. Wang, Z. Zhao, L. Gong, L. Zhu, Z. Liu, and X. Cheng, “A distributedanomaly detection system for in-vehicle network using htm,” IEEE Access,vol. 6, pp. 9091–9098, 2018.
[23] Y. Wang, Z. Wu, Q. Li, and Y. Zhu, “A model of telecommunicationnetwork performance anomaly detection based on service features clus-tering,” IEEE Access, vol. 5, pp. 17 589–17 596, 2017.
[24] H. Ren, X. Li, Z. Li, and W. Pedrycz, “Data representation based oninterval-sets for anomaly detection in time series,” IEEE Access, vol. 6,pp. 27 473–27 479, 2018.
[25] X. Yin, W. Yurcik, Y. Li, K. Lakkaraju, and C. Abad, “Visflowconnect:providing security situational awareness by visualizing network trafficflows,” in IEEE International Conference on Performance, Computing,and Communications, 2004, 2004, pp. 601–607.
[26] X. Guan, T. Qin, W. Li, and P. Wang, “Dynamic feature analysis and mea-surement for large-scale network traffic monitoring,” IEEE Transactionson Information Forensics and Security, vol. 5, no. 4, pp. 905–919, Dec2010.
[27] Y. Zhou, G. Hu, and W. He, “Using graph to detect network trafficanomaly,” in 2009 International Conference on Communications, Circuitsand Systems, July 2009, pp. 341–345.
[28] E. Glatz, S. Mavromatidis, B. Ager, and X. Dimitropoulos, “Visualizingbig network traffic data using frequent pattern mining and hypergraphs,”Computing, vol. 96, no. 1, pp. 27–38, Jan 2014.
[29] J. Di, K. Yu, X. Wu, X. Zhang, and C. Xu, “A complex network viewon traffic flows of mobile internet,” in 2013 5th IEEE InternationalConference on Broadband Network Multimedia Technology, Nov 2013,pp. 99–104.
[30] H. Tsuruta and T. Shoudai, “Structure-based data mining and screeningfor network traffic data,” in 2013 Second IIAI International Conference onAdvanced Applied Informatics, Aug 2013, pp. 152–157.
14 VOLUME 4, 2016

J. Wang et al.: Using Intuitionistic Fuzzy Set for Anomaly Detection of Network Traffic from Flow Interaction
[31] C.-M. Ye, Z. Wang, S. Chen, and H. Shan, “Internet traffic classificationbased on hosts behavior analysis,” Dianzi Yu Xinxi Xuebao/Journal ofElectronics and Information Technology, vol. 36, pp. 2158–2165, 09 2014.
[32] H. Bunke, “Error correcting graph matching: on the influence of theunderlying cost function,” IEEE Transactions on Pattern Analysis andMachine Intelligence, vol. 21, no. 9, pp. 917–922, Sep 1999.
[33] H. Dai, F. Zhu, E. P. Lim, and H. Pang, “Detecting anomalies in bipartitegraphs with mutual dependency principles,” in 2012 IEEE 12th Interna-tional Conference on Data Mining, Dec 2012, pp. 171–180.
[34] W. Eberle and L. Holder, “Discovering structural anomalies in graph-based data,” in Seventh IEEE International Conference on Data MiningWorkshops (ICDMW 2007), Oct 2007, pp. 393–398.
[35] S. Gunnemann, I. Farber, B. Boden, and T. Seidl, “Subspace clusteringmeets dense subgraph mining: A synthesis of two paradigms,” in 2010IEEE International Conference on Data Mining, Dec 2010, pp. 845–850.
[36] Z. Li, H. Xiong, Y. Liu, and A. Zhou, “Detecting blackhole and volcanopatterns in directed networks,” in 2010 IEEE International Conference onData Mining, Dec 2010, pp. 294–303.
[37] J. Sun, H. Qu, D. Chakrabarti, and C. Faloutsos, “Neighborhood formationand anomaly detection in bipartite graphs,” in Fifth IEEE InternationalConference on Data Mining (ICDM’05), Nov 2005, pp. 8 pp.–.
[38] H. Sun, J. Huang, J. Han, H. Deng, P. Zhao, and B. Feng, “gskeletonclu:Density-based network clustering via structure-connected tree division oragglomeration,” in 2010 IEEE International Conference on Data Mining,Dec 2010, pp. 481–490.
[39] G. Wang, S. Xie, B. Liu, and P. S. Yu, “Review graph based online storereview spammer detection,” in 2011 IEEE 11th International Conferenceon Data Mining, Dec 2011, pp. 1242–1247.
[40] D. Q. Le, T. Jeong, H. E. Roman, and J. W.-K. Hong, “Traffic dispersiongraph based anomaly detection,” in Proceedings of the Second Symposiumon Information and Communication Technology, ser. SoICT ’11. NewYork, NY, USA: ACM, 2011, pp. 36–41.
[41] Y. ZHOU and G. HU, “Network-Wide Anomaly Detection Based onRouter Connection Relationships,” IEICE Transactions on Communica-tions, vol. E94-B, no. 8, pp. 2239–2242, aug 2011.
[42] K. Ishibashi, T. Kondoh, S. Harada, T. Mori, R. Kawahara, and S. Asano,“Detecting anomalous traffic using communication graphs,” in Telecom-munications: The Infrastructure for the 21st Century, Sept 2010, pp. 1–6.
[43] P. Mockapetris and K. J. Dunlap, “Development of the domain namesystem,” SIGCOMM Comput. Commun. Rev., vol. 18, no. 4, pp. 123–133,aug 1988.
[44] A. Mahanti, D. Eager, and C. Williamson, “Temporal locality and its im-pact on web proxy cache performance,” Performance Evaluation, vol. 42,no. 2, pp. 187 – 203, 2000.
[45] Z. Chen, Y. Li, X. Chen, C. Yang, and W. Gui, “Semantic network basedon intuitionistic fuzzy directed hyper-graphs and application to aluminum
electrolysis cell condition identification,” IEEE Access, vol. 5, pp. 20 145–20 156, 2017.
[46] T. Chaira, “A novel intuitionistic fuzzy c means clustering algorithm andits application to medical images,” Applied Soft Computing, vol. 11, no. 2,pp. 1711 – 1717, 2011, the Impact of Soft Computing for the Progress ofArtificial Intelligence.
[47] P. Burillo and H. Bustince, “Entropy on intuitionistic fuzzy sets and oninterval-valued fuzzy sets,” Fuzzy Sets and Systems, vol. 78, no. 3, pp. 305– 316, 1996.
[48] S.-M. Chen and J.-M. Tan, “Handling multicriteria fuzzy decision-makingproblems based on vague set theory,” Fuzzy Sets and Systems, vol. 67,no. 2, pp. 163 – 172, 1994.
[49] D. H. Hong and C.-H. Choi, “Multicriteria fuzzy decision-making prob-lems based on vague set theory,” Fuzzy Sets and Systems, vol. 114, no. 1,pp. 103 – 113, 2000.
[50] S. Saad, I. Traore, A. Ghorbani, B. Sayed, D. Zhao, W. Lu, J. Felix, andP. Hakimian, “Detecting p2p botnets through network behavior analysisand machine learning,” in 2011 Ninth Annual International Conference onPrivacy, Security and Trust, July 2011, pp. 174–180.
[51] S. Garcà a, M. Grill, J. Stiborek, and A. Zunino, “An empirical compar-ison of botnet detection methods,” Computers and Security, vol. 45, pp.100 – 123, 2014.
[52] F. Massicotte, F. Gagnon, Y. Labiche, L. Briand, and M. Couture, “Au-tomatic evaluation of intrusion detection systems,” in 2006 22nd AnnualComputer Security Applications Conference (ACSAC’06), Dec 2006, pp.361–370.
[53] G. E. Crooks, “Entropy production fluctuation theorem and the nonequi-librium work relation for free energy differences,” Phys. Rev. E, vol. 60,pp. 2721–2726, Sep 1999.
[54] W. Q. Meeker and L. A. Escobar, Statistical methods for reliability data.Hoboken, New Jersey, USA: John Wiley & Sons, 1998.
[55] S. R. Gaddam, V. V. Phoha, and K. S. Balagani, “K-means+id3: A novelmethod for supervised anomaly detection by cascading k-means clusteringand id3 decision tree learning methods,” IEEE Transactions on Knowledgeand Data Engineering, vol. 19, no. 3, pp. 345–354, March 2007.
[56] W. Hu, W. Hu, and S. Maybank, “Adaboost-based algorithm for networkintrusion detection,” IEEE Transactions on Systems, Man, and Cybernet-ics, Part B (Cybernetics), vol. 38, no. 2, pp. 577–583, April 2008.
[57] J. E. Dickerson and J. A. Dickerson, “Fuzzy network profiling for intrusiondetection,” in PeachFuzz 2000. 19th International Conference of theNorth American Fuzzy Information Processing Society - NAFIPS (Cat.No.00TH8500), 2000, pp. 301–306.
VOLUME 4, 2016 15