using high-strength self-compacting concrete in … number xx using high-strength self-compacting...
TRANSCRIPT

Paper Number XX
Using High-Strength Self-Compacting Concrete in
Reinforced Concrete Beam-Column Joints
2013 NZSEE Conference
M. Soleymani Ashtiani, R.P. Dhakal & A.N. Scott
Department of Civil and Natural Resources Engineering, University of Canterbury, Christchurch, New Zealand.
ABSTRACT: The capability of self-compacting concrete (SCC) in flowing through and
filling in even the most congested areas makes it ideal for being used in congested
reinforced concrete (RC) structural members such as beam-column joints (BCJ).
However, members of tall multi-storey structures impose high capacity requirements
where implementing normal-strength self-compacting concrete is not preferable. In the
present study, a commercially reproducible high-strength self-compacting concrete
(HSSCC), a conventionally vibrated high-strength concrete (CVHSC) and a normal
strength conventionally vibrated concrete (CVC) were designed using locally available
materials in Christchurch, New Zealand. Following the guidelines of the New Zealand
concrete standards NZS3101, seven beam-column joints (BCJ) were designed. Factors
such as the concrete type, grade of reinforcement, amount of joint shear stirrups, axial
load, and direction of casting were considered variables. All BCJs were tested under a
displacement-controlled quasi-static reversed cyclic regime. The cracking pattern at
different load levels and the mode of failure were also recorded. In addition, the load,
displacement, drift, ductility, joint shear deformations, and elongation of the plastic hinge
zone were also measured during the experiment. It was found that not only none of the
seismically important features were compromised by using HSSCC, but also the quality
of material and ease of construction boosted the performance of the BCJs.
1 INTRODUCTION
Due to its special fresh and mechanical properties, Self-compacting concrete (SCC) has been regarded
as one of the most important advances in concrete technology after its advent more than two decades
ago. It has a unique ability to flow into a uniform level under the influence of gravity with the ability
to compact by means of its self-weight without any internal or external vibration. Based on its
exceptional flowing properties, SCC is able to be implemented in complex formworks even in highly
congested reinforced concrete (RC) members. Therefore, the interest in utilizing SCC in members of
concrete framed structures has increased manifold over the recent years.
The intersection of beams and columns represents one of the most congested parts of RC framed
structures. Placing and consolidating concrete in such areas has often imposed difficulties which
results in imperfect compaction and/or segregation of concrete. This entails other side effects such as
deteriorated bond properties which leads to a greater column depth requirement than otherwise
required to meet the bond demand. The capability of SCC in flowing through and filling in even the
most congested areas makes it ideal for being used in congested RC members such as beam-column
joints (BCJ) of high-rise buildings. However, members of tall multi-storey structures impose high
capacity requirements where implementing normal-strength self-compacting concrete (NSSCC) is not
preferable. At the same time, BCJs are subjected to large horizontal shear forces in the joint panel
which requires large amount of shear reinforcement between the top and bottom beam bars. Therefore
considering the advantages of HSSCC (noise reduction, reduced labour force, higher material quality
and better surface finish) over conventionally vibrated concrete (CVC), if the seismic performance is
not compromised, the implementation of HSSCC in BCJs could be an answer to all of the mentioned
problems (i.e. compaction, bond and shear requirements).

2
Fresh and mechanical properties (compressive, splitting tensile, and flexural strengths as well as
modulus of elasticity, shrinkage and bond strength) of SCC including their comparison with that of
CVC have been extensively investigated (Soleymani Ashtiani et al. 2011, Soleymani Ashtiani et al.
2010, Desnerck et al. 2010, Valcuende and Parra 2009, De Almeida Filho et al. 2008, Domone 2006,
Persson 2001). More recently, researchers have also looked at the structural performance of RC
members cast with SCC under monotonic loads (Hassan et al. 2008, Lachemi et al. 2005, Sonebi et al.
2003). Nevertheless to the best of the authors’ knowledge, investigation of seismic behaviour of
reinforced concrete beam-column joints cast with SCC is very scarce in literature (Said and Nehdi
2007), and no studies have addressed seismic performance of HSSCC. Therefore, in this study seven
BCJs were designed and tested under a displacement-controlled quasi-static reversed cyclic regime.
Recorded data was used to calculate the load vs. displacement, ductility, beam elongation, deformation
components, and contribution of steel and concrete in the joint shear stress. The experimental results
of this study were used in identifying the pros and cons of using HSSCC in beam-column joints of the
RC structures.
2 SPECIMEN PROPERTIES AND TEST SETUP
In the present investigation, locally available materials in Christchurch, New Zealand were used in
order to design different concrete mixes. Details of the mix designs and physical properties of the
constituents materials as well as the mixing method and procedure are described in a previous study
(Soleymani Ashtiani et al. 2010). Seven standard beam-column joints (Table 1), namely BCJ1, BCJ2,
BCJ3 and BCJ4 (HSSCC), BCJ5 (CVHSC), BCJ6 (CVC), and BCJ7 (CVC with HSSCC in the joint
area) were designed following the current New Zealand Standard (NZS3101 2006) requirements to
achieve a strong-column-weak-beam hierarchy where the final expected mode of failure was hinging
of the beam at the column face. Based on capacity design principals, column was designed to remain
elastic throughout the test; this was ensured by keeping the ratio of the factored yield moment of the
column (φMy) to the over-strength moment of the beam (Mo,b) well above 1.0 for all specimens. The
detailing of the reinforcement was identical in all seven specimens except for slight variations in BCJ3
(amount and type of joint shear reinforcement) and BCJ4 (500 grade steel instead of 300 grade). BCJ2
was cast vertically and tested under lower axial force. Figure 1 shows detailing of the shear and
longitudinal reinforcement in the beam-column joints. Ratios of the longitudinal reinforcement in the
beam (tension side) and column were 0.011 and 0.025, respectively which were within the limits
specified by the New Zealand Standard (NZS3101 2006).
Table 1. Details of all beam-column joint specimens
Specimen
ID
Concrete
Type
Steel Grade
(MPa)
Axial Load
(kN) Beam (T/B) Column Joint
BCJ1 HSSCC 300 1500 2(D25+D20) 14 D20 2(HR12+HR10)
BCJ2 HSSCC 300 200 2(D25+D20) 14 D20 2(HR12+HR10)
BCJ3 HSSCC 300 1500 2(D25+D20) 14 D20 4 R10
BCJ4 HSSCC 500 1500 4 HD20 12 HD16 2HR12+HR10
BCJ5 CVHSC 300 1500 2(D25+D20) 14 D20 2(HR12+HR10)
BCJ6 CVC 300 650 2(D25+D20) 14 D20 2(HR12+HR10)
BCJ7 CVC 300 650 2(D25+D20) 14 D20 2(HR12+HR10)
In order to measure the local strains, strain gauges with 3 mm gauge length were installed on the top
and bottom longitudinal beam bars as well as the shear reinforcement in the joint, beam and column
(only the two stirrups adjacent to the joint). In addition, the beam plastic-hinge zone, beam-column
interface and the joint panel were instrumented with LVDTs (installed on the surface) in order to
measure the average strains, beam flexural and shear deformations, plastic-hinge zone elongation and
joint shear deformations. It should be noted that as the column was designed to remain elastic,
monitoring its deformations was not necessary; thus it was not instrumented with LVDTs or strain
gauges (Figure 1).

3
Figure 1. Details of the beam-column subassemblies and instrumentations (dimensions are in ‘mm’)
The lateral load was applied to the top of the column through a 400 kN capacity hydraulic actuator
(ram) and measured using a load-cell. The ram was supported on the west by a strong reaction frame
designed to take twice the actuator maximum capacity. The displacement was fed to the hydraulic
actuator through a portable computer and associated controller. This was measured with a rotary
potentiometer (located at the level of the actuator) which was connected to an independent frame to
make sure that any slack in the setup did not affect the loading history. The designed axial load was
applied through a 2500 kN capacity hydraulic jack and transferred to the column through the top and
bottom plates and Macalloy bars. The bottom of the column and beam-ends were fixed to the strong
floor using a pin and two roller supports, respectively. The generated loads at the end of the beams
were measured using two load-cells. Figure 2 shows a schematic view of the setup used to test the
beam-column subassemblies. A quasi-static displacement-controlled loading regime (Figure 2b) was
adopted following the ACI guidelines for moment resisting frames(ACI374.1-05 2005). The axial load
was monitored and maintained throughout the test (using a pressure transducer) such that the axial
load to capacity ratio remained almost the same for all specimens except for BCJ2 (0.07, 0.01, 0.08,
0.07, 0.1, 0.08, and 0.08 for BCJ1 to BCJ7, respectively).

4
-135
-105
-75
-45
-15
15
45
75
105
135
0 1000 2000 3000 4000 5000 6000 7000
-5
-4
-3
-2
-1
0
1
2
3
4
5
0 1000 2000 3000 4000 5000 6000 7000
Sto
rey
Dis
pla
cem
ent
(mm
)
Displacement Steps (Nos)
Sto
rey
Dri
ft -δ
(%)
Displacement Steps (Nos)
4.5%
3.5%
2.5%
2.0%
1.5%
1.0%
0.75%
0.1, 0.2, 0.35, 0.5%
b)
Figure 2. a) Schematic view of the test setup and b) Applied displacement history
3 RESULTS AND DISCUSSIONS
3.1 Hysteresis response
Figures 3a-f show the storey shear versus drift response for all specimens; except for BCJ4 for which
the results are omitted for space considerations (the hysteresis response of BCJ4 was similar in shape
to the one for BCJ6 but with higher lateral load capacity). Based on the ACI recommendations
(ACI374.1-05 2005) the limiting drift value for the RC moment resisting frames is 3.5%. However,
the adopted test setup in this study limited the maximum applicable drift to 4.5%, and none of the
specimens had failed when the test was terminated after applying the 4.5% drift cycles. According to
the hysteresis loops for an identical ultimate drift of 4.5%, all six BCJs proved to be almost equally
ductile. This contradicts the general notion that high-strength concrete (HSC) behaves in a brittle
manner; in fact the better bond between concrete and reinforcement resulted in higher strain
compatibility between the two materials; resulting in a relatively high ductility.
Figure 4 shows the physical condition of the joint in different specimens at positive drift ratios of
1.5%, 2.5% and 3.5%. It is clear from the pictures that BCJ2 (lower column axial load), BCJ6 (CVC)
and BCJ7 (CVC with HSSCC in its joint area) had most cracks on the joint panel. However the final
mode of failure in all specimens was the hinging of the beam. Although the amount of shear
reinforcement in BCJ3 was almost half of the required amount, no shear failure happened in this
specimen. In fact, even the amount and width of shear cracks were similar to the other specimens at
identical drift ratios.
-6.1 -4.9 -3.7 -2.5 -1.2 0.0 1.2 2.5 3.7 4.9 6.1
-200
-150
-100
-50
0
50
100
150
200
-5 -4 -3 -2 -1 0 1 2 3 4 5
Ductility - μ
Sto
rey
Sh
ea
r (
kN
)
Storey Drift - δ (%)
Predicted strength
δy = 0.82 %
Δy = 22.01 mm
μy = 1.0
Fy = 145.6 kN
End
End
Yield
Yield
δend = 4.58 %
Δend = 123.7 mm
μend = 5.6
Fend = 176 kN
a)
BCJ1
-4.7 -3.8 -2.8 -1.9 -0.9 0.0 0.9 1.9 2.8 3.8 4.7
-5 -4 -3 -2 -1 0 1 2 3 4 5
Ductility - μ
Storey Drift - δ (%)
Predicted strength
δy = 1.06 %
Δy = 28.53 mm
μy = 1.0
Fy = 146.2 kN
End
End
Yield
Yield
δend = 4.60 %
Δend = 124.3 mm
μend = 4.36
Fend = 175.9 kN
b)
BCJ2
-5.7 -4.6 -3.4 -2.3 -1.1 0.0 1.1 2.3 3.4 4.6 5.7
-200
-150
-100
-50
0
50
100
150
200
-5 -4 -3 -2 -1 0 1 2 3 4 5
Ductility - μ
Sto
rey S
hear (
kN
)
Storey Drift - δ (%)
Predicted strength
δy = 0.87 %
Δy = 23.57 mm
μy = 1.0
Fy = 157.8 kN
End
End
Yield
Yield
δend = 4.60 %
Δend = 124.2 mm
μend = 5.27
Fend = 186.9 kN
c)
BCJ3

5
-6.1 -4.9 -3.7 -2.4 -1.2 0.0 1.2 2.4 3.7 4.9 6.1
-200
-150
-100
-50
0
50
100
150
200
-5 -4 -3 -2 -1 0 1 2 3 4 5
Ductility - μS
torey S
hear (
kN
)
Storey Drift - δ (%)
Predicted strength
δy = 0.82 %
Δy = 22.07 mm
μy = 1.0
Fy = 148.2 kN
End
End
Yield
Yield
δend = 4.60 %
Δend = 124.2 mm
μend = 5.64
Fend = 178.6 kN
d)
BCJ5
-5 -4 -3 -2 -1 0 1 2 3 4 5
-5 -4 -3 -2 -1 0 1 2 3 4 5
Ductility - μ
Storey Drift - δ (%)
Predicted strength
δy = 1.00 %
Δy = 27.13 mm
μy = 1.0
Fy = 141.6 kN
End
End
Yield
Yield
δend = 4.60 %
Δend = 124.3 mm
μend = 4.65
Fend = 173.95 kN
e)
BCJ6
-5.4 -4.3 -3.2 -2.1 -1.1 0.0 1.1 2.1 3.2 4.3 5.4
-200
-150
-100
-50
0
50
100
150
200
-5 -4 -3 -2 -1 0 1 2 3 4 5
Ductility - μ
Sto
rey S
hear (
kN
)
Storey Drift - δ (%)
Predicted strength
δy = 0.87 %
Δy = 23.51 mm
μy = 1.0
Fy = 144.4 kN
End
End
Yield
Yield
δend = 4.60 %
Δend = 124.1 mm
μend = 4.97
Fend = 173 kN
f)
BCJ7
Figure 3. Storey shear vs. drift response of all specimens
BCJ1
1.5%
BCJ1
2.5%
BCJ1
3.5%
BCJ2
1.5%
BCJ2
2.5%
BCJ2
3.5%
BCJ3
1.5%
BCJ3
2.5%
BCJ3
3.5%
BCJ4
1.5%
BCJ4
2.5%
BCJ4
3.5%

6
Figure 4. Pictures of BCJs at drift ratios 1.5%, 2.5% and 3.5%
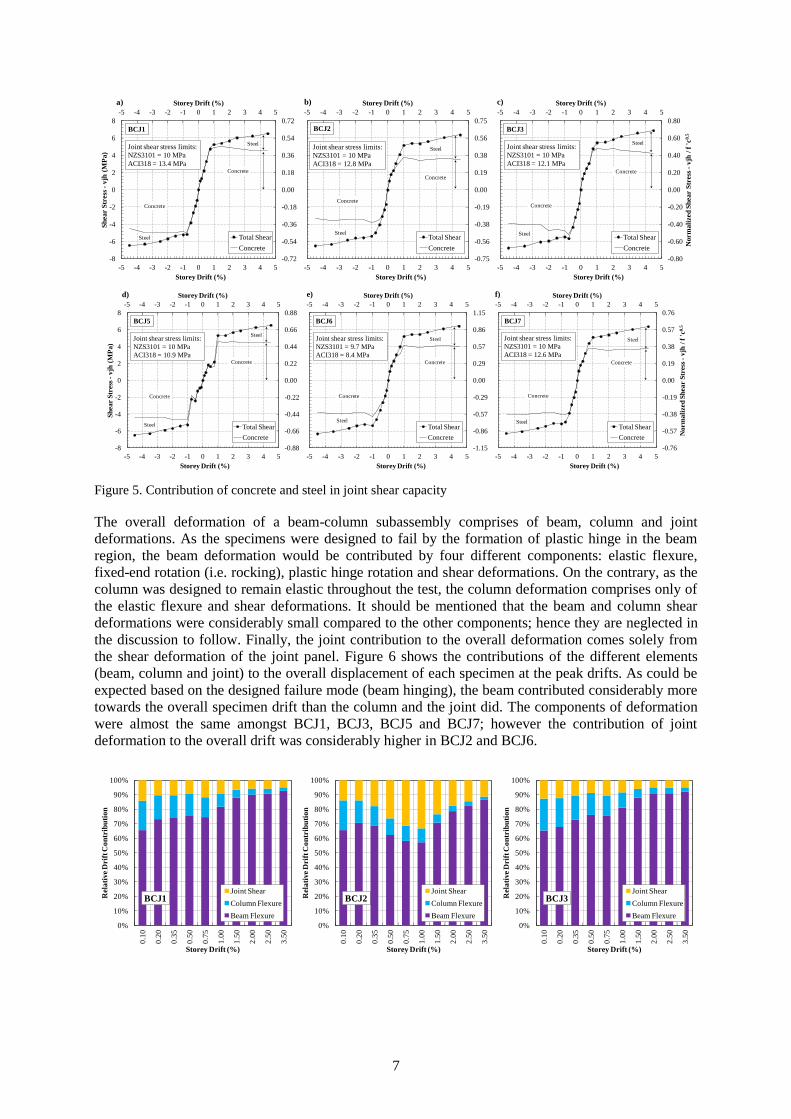
3.2 Joint shear response
The total joint shear force ‘Vjh’ and the horizontal joint shear stress ‘vjh’ at each drift peak were
calculated using the geometry of the test setup and specimens. The contribution of the joint shear
reinforcement to the total joint shear stress was calculated using the results of the strain gauges
installed on the joint stirrups. According to the strain gauge readings, even at the highest storey drift of
4.5% none of the joint stirrups yielded. In fact they all remained elastic around half-yield levels except
for the joint shear reinforcement of BCJ3 which passed the half-yield point but remained elastic.
Therefore stresses were calculated using Hooke’s law and the corresponding forces were determined
by multiplying the stresses and the area of stirrups. Shear stress of the joint was also normalized with
respect to the square root of concrete compressive strength ‘√f'c’ to provide an unbiased assessment of
the steel and concrete contributions to the total joint shear stress (Figure 5). Despite the joint shear
stress being similar in all specimens, the steel contribution to joint shear was more in BCJ2 and BCJ3
compared to the others. This is attributed to the lower amount of axial force ratio in BCJ2 (0.01 as
opposed to about 0.1 in the others) and less shear reinforcement in BCJ3 (only 56% of the required
amount based on code recommendations). The maximum limit of joint shear stress for all specimens,
calculated as per the American and New Zealand standards (ACI318M-08 2008, NZS3101 2006) are
also shown in Figure 5 for comparison. As mentioned earlier, all specimens were designed to the New
Zealand Standard (NZS3101 2006), therefore it was expected that the maximum joint shear stress
would not exceed the codal limits.
1.5% 2.5% 3.5%
BCJ7
1.5%
BCJ7
2.5%
BCJ7
3.5%
1.5% 2.5% 3.5%
BCJ6 BCJ6 BCJ6
BCJ5 BCJ5 BCJ5
7
-0.72
-0.54
-0.36
-0.18
0.00
0.18
0.36
0.54
0.72
-5 -4 -3 -2 -1 0 1 2 3 4 5
-8
-6
-4
-2
0
2
4
6
8
-5 -4 -3 -2 -1 0 1 2 3 4 5
Storey Drift (%)S
hear S
tress
-vjh
(M
Pa)
Storey Drift (%)
Total Shear
Concrete
Joint shear stress limits:
NZS3101 = 10 MPa
ACI318 = 13.4 MPa
a)
Steel
Steel
BCJ1
Concrete
Concrete
-0.75
-0.56
-0.38
-0.19
0.00
0.19
0.38
0.56
0.75
-5 -4 -3 -2 -1 0 1 2 3 4 5
-5 -4 -3 -2 -1 0 1 2 3 4 5
Storey Drift (%)
Storey Drift (%)
Total Shear
Concrete
Joint shear stress limits:
NZS3101 = 10 MPa
ACI318 = 12.8 MPa
b)
Steel
Steel
BCJ2
Concrete
Concrete
-0.80
-0.60
-0.40
-0.20
0.00
0.20
0.40
0.60
0.80
-5 -4 -3 -2 -1 0 1 2 3 4 5
-5 -4 -3 -2 -1 0 1 2 3 4 5
Norm
ali
zed
Sh
ear S
tress
-vjh
/ f
'c
0.5
Storey Drift (%)
Storey Drift (%)
Total Shear
Concrete
Joint shear stress limits:
NZS3101 = 10 MPa
ACI318 = 12.1 MPa
c)
Steel
Steel
BCJ3
Concrete
Concrete
-0.88
-0.66
-0.44
-0.22
0.00
0.22
0.44
0.66
0.88
-5 -4 -3 -2 -1 0 1 2 3 4 5
-8
-6
-4
-2
0
2
4
6
8
-5 -4 -3 -2 -1 0 1 2 3 4 5
Storey Drift (%)
Sh
ea
r S
tress
-v
jh (
MP
a)
Storey Drift (%)
Total Shear
Concrete
Joint shear stress limits:
NZS3101 = 10 MPa
ACI318 = 10.9 MPa
d)
Steel
Steel
BCJ5
Concrete
Concrete
-1.15
-0.86
-0.57
-0.29
0.00
0.29
0.57
0.86
1.15
-5 -4 -3 -2 -1 0 1 2 3 4 5
-5 -4 -3 -2 -1 0 1 2 3 4 5
Storey Drift (%)
Storey Drift (%)
Total Shear
Concrete
Joint shear stress limits:
NZS3101 = 9.7 MPa
ACI318 = 8.4 MPa
e)
Steel
Steel
BCJ6
Concrete
Concrete
-0.76
-0.57
-0.38
-0.19
0.00
0.19
0.38
0.57
0.76
-5 -4 -3 -2 -1 0 1 2 3 4 5
-5 -4 -3 -2 -1 0 1 2 3 4 5
No
rm
ali
zed
Sh
ea
r S
tress
-v
jh /
f '
c0.5
Storey Drift (%)
Storey Drift (%)
Total Shear
Concrete
Joint shear stress limits:
NZS3101 = 10 MPa
ACI318 = 12.6 MPa
f)
Steel
Steel
BCJ7
Concrete
Concrete
Figure 5. Contribution of concrete and steel in joint shear capacity
The overall deformation of a beam-column subassembly comprises of beam, column and joint
deformations. As the specimens were designed to fail by the formation of plastic hinge in the beam
region, the beam deformation would be contributed by four different components: elastic flexure,
fixed-end rotation (i.e. rocking), plastic hinge rotation and shear deformations. On the contrary, as the
column was designed to remain elastic throughout the test, the column deformation comprises only of
the elastic flexure and shear deformations. It should be mentioned that the beam and column shear
deformations were considerably small compared to the other components; hence they are neglected in
the discussion to follow. Finally, the joint contribution to the overall deformation comes solely from
the shear deformation of the joint panel. Figure 6 shows the contributions of the different elements
(beam, column and joint) to the overall displacement of each specimen at the peak drifts. As could be
expected based on the designed failure mode (beam hinging), the beam contributed considerably more
towards the overall specimen drift than the column and the joint did. The components of deformation
were almost the same amongst BCJ1, BCJ3, BCJ5 and BCJ7; however the contribution of joint
deformation to the overall drift was considerably higher in BCJ2 and BCJ6.
0%
10%
20%
30%
40%
50%
60%
70%
80%
90%
100%
0.1
0
0.2
0
0.3
5
0.5
0
0.7
5
1.0
0
1.5
0
2.0
0
2.5
0
3.5
0
Rel
ati
ve
Dri
ft C
on
trib
uti
on
Storey Drift (%)
Joint Shear
Column Flexure
Beam Flexure
BCJ1
0%
10%
20%
30%
40%
50%
60%
70%
80%
90%
100%
0.1
0
0.2
0
0.3
5
0.5
0
0.7
5
1.0
0
1.5
0
2.0
0
2.5
0
3.5
0
Rel
ati
ve
Dri
ft C
on
trib
uti
on
Storey Drift (%)
Joint Shear
Column Flexure
Beam Flexure
BCJ2
0%
10%
20%
30%
40%
50%
60%
70%
80%
90%
100%
0.1
0
0.2
0
0.3
5
0.5
0
0.7
5
1.0
0
1.5
0
2.0
0
2.5
0
3.5
0
Rel
ati
ve
Dri
ft C
on
trib
uti
on
Storey Drift (%)
Joint Shear
Column Flexure
Beam Flexure
BCJ3

8
0%
10%
20%
30%
40%
50%
60%
70%
80%
90%
100%
0.1
0
0.2
0
0.3
5
0.5
0
0.7
5
1.0
0
1.5
0
2.0
0
2.5
0
3.5
0
Rel
ati
ve
Dri
ft C
on
trib
uti
on
Storey Drift (%)
Joint Shear
Column Flexure
Beam Flexure
BCJ5
0%
10%
20%
30%
40%
50%
60%
70%
80%
90%
100%
0.1
0
0.2
0
0.3
5
0.5
0
0.7
5
1.0
0
1.5
0
2.0
0
2.5
0
3.5
0
Rel
ati
ve
Dri
ft C
on
trib
uti
on
Storey Drift (%)
Joint Shear
Column Flexure
Beam Flexure
BCJ6
0%
10%
20%
30%
40%
50%
60%
70%
80%
90%
100%
0.1
0
0.2
0
0.3
5
0.5
0
0.7
5
1.0
0
1.5
0
2.0
0
2.5
0
3.5
0
Rel
ati
ve
Dri
ft C
on
trib
uti
on
Storey Drift (%)
Joint Shear
Column Flexure
Beam Flexure
BCJ7
Figure 6. Relative contributions of different components to the overall specimen drift
3.3 Beam elongation
Using the LVDTs installed on the surface of specimens, the elongation of the plastic hinge zone was
also calculated for the west and east beams. Total elongation (sum of the west and east) of each
specimen is shown in Figure 7. A closer look at the elongation graphs reveals that before yielding the
elongation was very small and reversible to zero for all specimens. However, it started to increase and
become irreversible in nature at higher drifts (after yielding). This can be explained by the fact that
when the specimens were in their elastic response region, the cracks were small and closed completely
during unloading; consequently the elongations were small and reversible. However when the cracks
started to widen in the larger post yield drift cycles, small pieces of concrete dropped into the void
created by the cracks. In the reverse loading, these concrete parts started transferring the forces from
one side of the crack to the other before these cracks closed completely. As a result, the reinforcement
in the tension side started elongating before the cracks on the compression side fully closed down.
This caused the cracks to open up in the next cycle even more and this continued throughout the
loading regime; thereby gradually increasing the permanent elongation of the plastic hinge zone. In
addition to the explained phenomenon, plastic strain of the top and bottom beam bars after yielding
may also have added to the overall elongation of the plastic hinge zone. As can be seen in the figures,
all specimens elongated to similar extent; the total elongation (after 3.5% drift) in some specimens was
about 30 mm; which is more than 7% of the beam depth. However, for BCJ4 (500 grade steel) and
BCJ6 (CVC) elongation was slightly less; i.e. about 6%.
-4 -3 -2 -1 0 1 2 3 4
0
6
12
18
24
30
36
-4 -3 -2 -1 0 1 2 3 4
Storey Drift (%)
Beam
Elo
ngati
on
(m
m)
Storey Drift (%)
BCJ1
a)
-4 -3 -2 -1 0 1 2 3 4
-4 -3 -2 -1 0 1 2 3 4
Storey Drift (%)
Storey Drift (%)
BCJ2
b)
0.00%
1.00%
2.00%
3.00%
4.00%
5.00%
6.00%
7.00%
8.00%
-4 -3 -2 -1 0 1 2 3 4
-4 -3 -2 -1 0 1 2 3 4
Percen
tage o
f B
eam
Dep
th
Storey Drift (%)
Storey Drift (%)
BCJ3
c)

9
-4 -3 -2 -1 0 1 2 3 4
0
6
12
18
24
30
36
-4 -3 -2 -1 0 1 2 3 4
Storey Drift (%)
Beam
Elo
ngati
on
(m
m)
Storey Drift (%)
BCJ4
d)
-4 -3 -2 -1 0 1 2 3 4
-4 -3 -2 -1 0 1 2 3 4
Storey Drift (%)
Storey Drift (%)
BCJ5
e)
0.00%
1.00%
2.00%
3.00%
4.00%
5.00%
6.00%
7.00%
8.00%
-4 -3 -2 -1 0 1 2 3 4
-4 -3 -2 -1 0 1 2 3 4
Percen
tage o
f B
eam
Dep
th
Storey Drift (%)
Storey Drift (%)
BCJ6
f)
Figure 7. Total elongation of the plastic hinge zone (west and east beam)
4 CONCLUSIONS
Based on the cyclic test results of the specimens reported in this study, following conclusions are
drawn:
At a given drift ratio, more cracks had appeared in the joint area of the CVHSC and CVC specimens
compared to the other HSSCC ones. Higher compressive strength of the HSSCC and stronger bond
were the main reasons for this.
All specimens showed a relatively ductile behaviour as opposed to the general notion of brittle failure
in HSC. This can be attributed to the better strain compatibility between HSC and reinforcing steel.
Except for slight variations, the relative contribution of joint shear reinforcement and concrete in the
joint shear stress was similar amongst all specimens. As expected, the joint stirrups in the HSSCC
specimen with a lower quantity of shear reinforcement experienced higher strain compared to the other
two specimens. However, the joint stirrups remained well below the yielding level in all specimens.
As expected, the maximum shear stress in the joint remained within the allowable standard limits.
It was observed that the beam contributed the most towards the specimen overall drift in all
specimens; the contribution of column and joint were very small compared to that of the beam.
The beam elongation trends of all specimens (except for the 500G steel specimen) were similar; the
maximum total elongation (at 3.5% drift) was about 6% to 7% of the beam depth (i.e. about 24 to 30
mm). The lower beam elongation in the specimen with 500G steel resulted from the lower ductility of
the steel used.
Overall, seismic behaviour of the HSSCC specimens were quite similar to the CVHSC and CVC ones
and none of the key parameters related to seismic performance were compromised by using HSSCC.
In fact the better bond properties and very high compressive strength resulted in better overall
performance in HSSCC specimens. Hence, HSSCC may offer an easier option (compared to CVHSC
and CVC) for heavily congested areas like beam-column connections in RC frame structures.
5 REFERENCES
ACI318M-08 2008. ACI318M-08 Building Code Requirements for Structural Concrete and
Commentary. ACI Committee 318.
ACI374.1-05 2005. ACI374.1-05 Acceptance criteria for moment frames based on structural testing
and commentary. ACI Committee 374.
De Almeida Filho, F. M., El Debs, M. K. & El Debs, A. L. H. C. 2008. Bond-slip behavior of self-
compacting concrete and vibrated concrete using pull-out and beam tests. Materials and
Structures/Materiaux et Constructions, 41, 1073-1089.
Desnerck, P., De Schutter, G. & Taerwe, L. 2010. Bond behaviour of reinforcing bars in self-

10
compacting concrete: Experimental determination by using beam tests. Materials and
Structures/Materiaux et Constructions, 43, 53-62.
Domone, P. L. 2006. Self-compacting concrete: An analysis of 11 years of case studies. Cement and
Concrete Composites, 28, 197-208.
Hassan, A. A. A., Hossain, K. M. A. & Lachemi, M. 2008. Behavior of full-scale self-consolidating
concrete beams in shear. Cement and Concrete Composites, 30, 588-96.
Lachemi, M., Hossain, K. M. A. & Lambros, V. 2005. Shear resistance of self-consolidating concrete
beams - Experimental investigations. Canadian Journal of Civil Engineering, 32, 1103-1113.
NZS3101 2006. NZS3101 Concrete structures standard Parts 1 & 2: The Desing of Concrete
Structures and Commentary. Wellington, New Zealand: Standards New Zealand.
Persson, B. 2001. A comparison between mechanical properties of self-compacting concrete and the
corresponding properties of normal concrete. Cement and Concrete Research, 31, 193-198.
Said, A. & Nehdi, M. 2007. Behaviour of reinforced self-consolidating concrete frames. Proceedings
of the Institution of Civil Engineers: Structures and Buildings, 160, 95-104.
Soleymani Ashtiani, M., Dhakal, R. P. & Scott, A. N. 2011. Bond properties of reinforcement in high-
strength self-compacting concrete. Proceedings of the 9th Symposium on High Performance
Concrete Design, Verification and Utilization. Rotorua, New Zealand.
Soleymani Ashtiani, M., Scott, A. N. & Dhakal, R. P. 2010. Mechanical properties of high-strength
self-compacting concrete. Proceedings of the 21st Australasian Conference on the Mechanics
of Structures and Materials. Melbourne, Australia.
Sonebi, M., Tamimi, A. K. & Bartos, P. J. M. 2003. Performance and Cracking Behavior of
Reinforced Beams Cast with Self-Consolidating Concrete. ACI Materials Journal, 100, 492-
500.
Valcuende, M. & Parra, C. 2009. Bond behaviour of reinforcement in self-compacting concretes.
Construction and Building Materials, 23, 162-170.