using healthy heart data by rick frey, phd toiyabe indian health project, inc. a collection of...
TRANSCRIPT
Using Healthy Heart Databy Rick Frey, PhD
Toiyabe Indian Health Project, Inc.
A collection of PowerPoint slides that have been used in grant applications, Diabetes grant narratives, and Board of Directors’ reports over the past three years by the Preventive Medicine Department at Toiyabe.
Using program dataToiyabe Indian Health Project, Inc.
*The clinical measures listed on these documents were used by the programs over the past 10 years and were current at their time of use. However, these example documents are not intended to serve as current clinical guidelines. Programs using these documents will need to ensure the clinical measures are current for their intended use.
Toiyabe Indian Health Project, Inc.Toiyabe Indian Health Project, Inc.
Board of Directors PresentationJuly 25, 2008
Bridgeport Indian Colony
Preventive Medicine
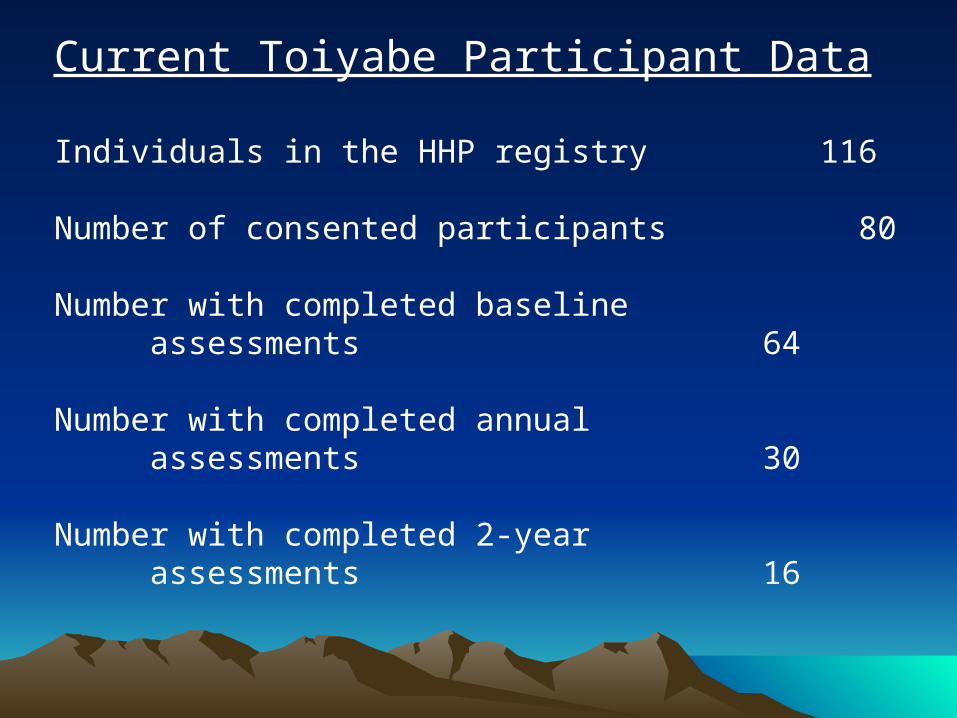
Current Toiyabe Participant Data
Individuals in the HHP registry 116
Number of consented participants 80
Number with completed baselineassessments 64
Number with completed annualassessments 30
Number with completed 2-yearassessments 16
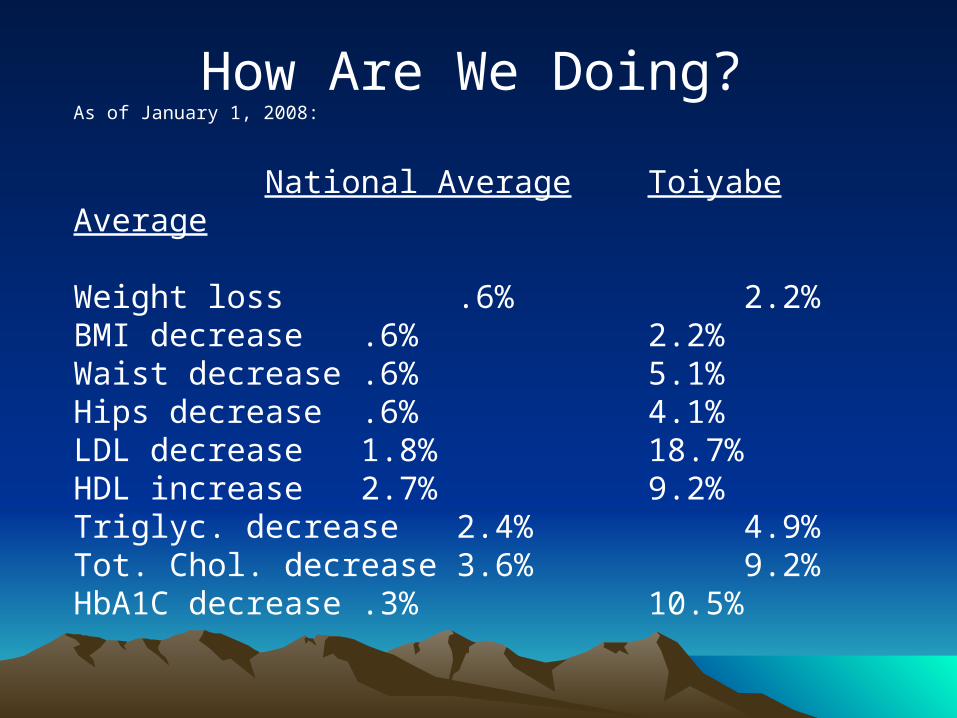
How Are We Doing?As of January 1, 2008:
National Average Toiyabe Average
Weight loss .6% 2.2%BMI decrease .6% 2.2%Waist decrease .6% 5.1%Hips decrease .6% 4.1%LDL decrease 1.8% 18.7%HDL increase 2.7% 9.2%Triglyc. decrease 2.4% 4.9%Tot. Chol. decrease 3.6% 9.2%HbA1C decrease .3% 10.5%

Perspective
A one point drop in HbA1C reduces diabetes-relatedcomplications by 40%.
Over a period of nine years, the 333 community-directed grants dropped their national average by 1 point.
In one year Toiyabe’s HHP participants dropped their average HbA1C level by .9 point.

Toiyabe Indian Health Project, Inc.Toiyabe Indian Health Project, Inc.
Board of Directors PresentationJuly 31, 2009
Bridgeport Indian Colony
Preventive MedicineDepartment
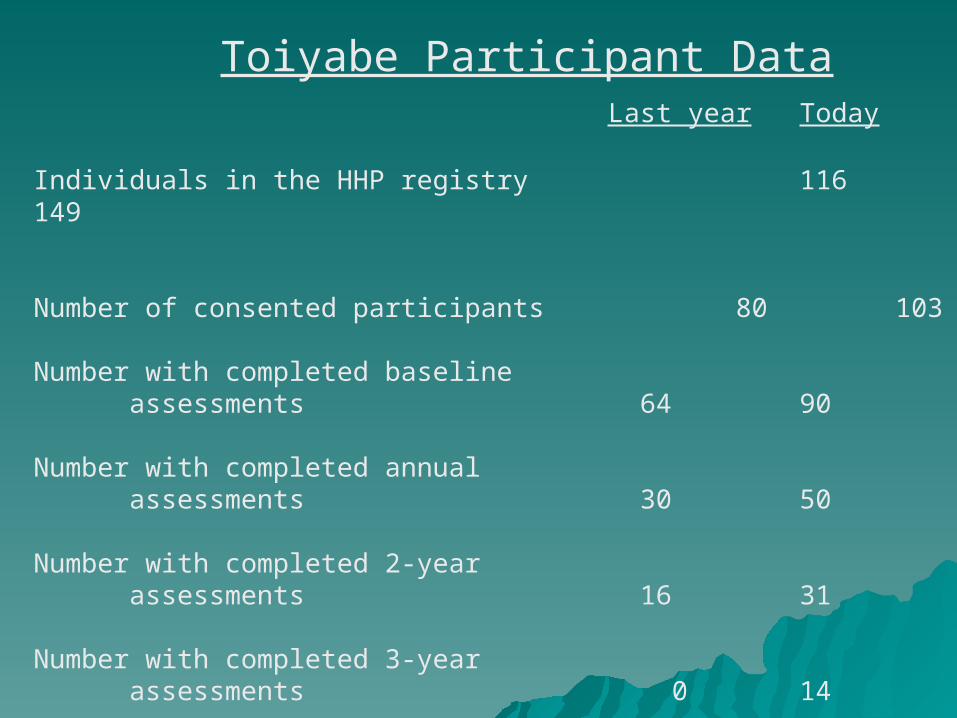
Toiyabe Participant DataLast year Today
Individuals in the HHP registry 116 149
Number of consented participants 80 103
Number with completed baselineassessments 64 90
Number with completed annualassessments 30 50
Number with completed 2-yearassessments 16 31
Number with completed 3-yearassessments 0 14
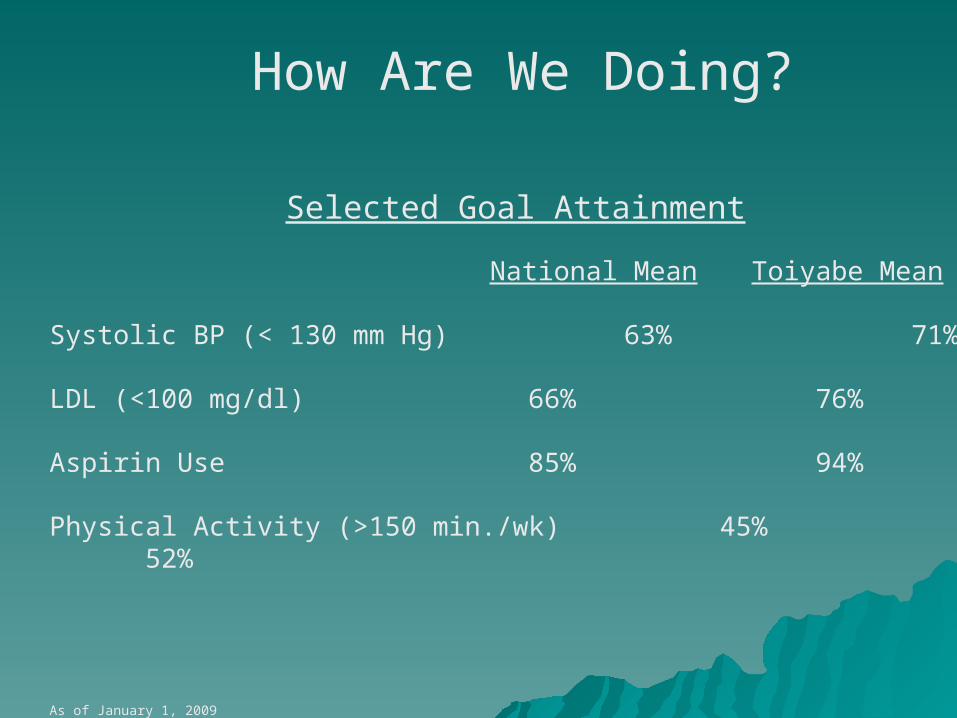
How Are We Doing?
Selected Goal Attainment
National Mean Toiyabe Mean
Systolic BP (< 130 mm Hg) 63% 71%
LDL (<100 mg/dl) 66% 76%
Aspirin Use 85% 94%
Physical Activity (>150 min./wk) 45% 52%
As of January 1, 2009

How Are We Doing?Selected Clinical Characteristics
National Mean Toiyabe Mean
Weight loss 1.7% 3.0%
HDL increase 1.6% 2.5%
Triglycerides decrease 8.5% 13.0%
Total Cholesterol decrease 3.6% 9.2%
HbA1C decrease 6.4% 10.0%
As of January 1, 2009

Just a Reminder
A one point drop in HbA1C reduces diabetes-relatedcomplications by 40%.
Over a period of nine years, the 333 community-directed grants dropped their national average by 1 point.
In two years Toiyabe’s HHP participants dropped their average HbA1C level by .8 point.
Toiyabe Indian Health Project, Inc.
Board of Directors PresentationJuly 30, 2010
Bridgeport Indian Colony
Preventive MedicineDepartment
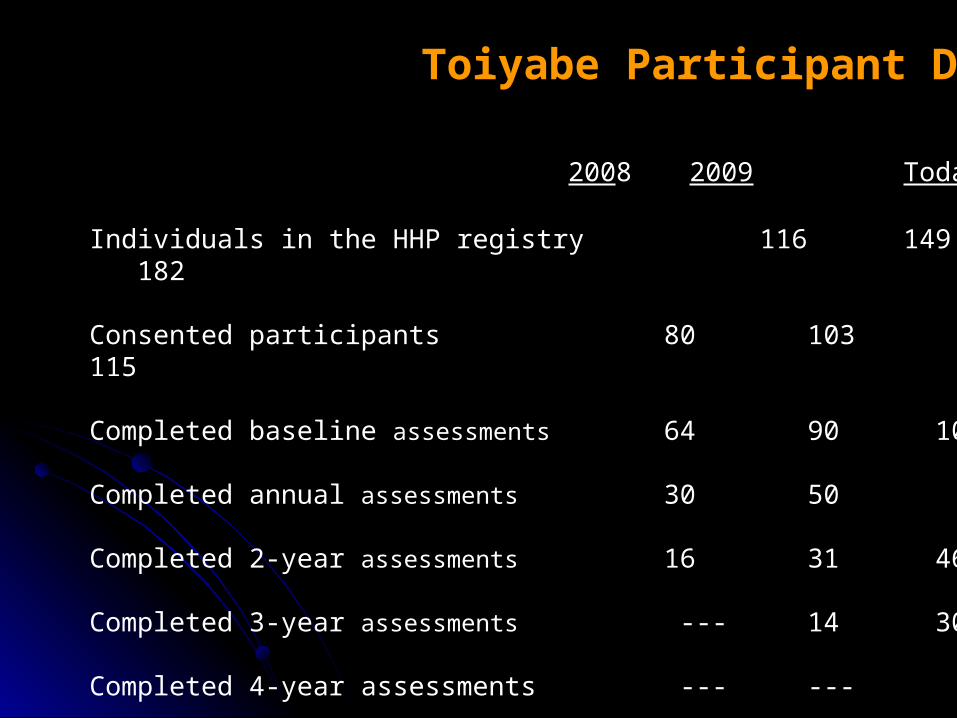
Toiyabe Participant Data
2008 2009 Today
Individuals in the HHP registry 116 149 182
Consented participants 80 103 115
Completed baseline assessments 64 90 106
Completed annual assessments 30 50 63
Completed 2-year assessments 16 31 46
Completed 3-year assessments --- 14 30
Completed 4-year assessments --- --- 12
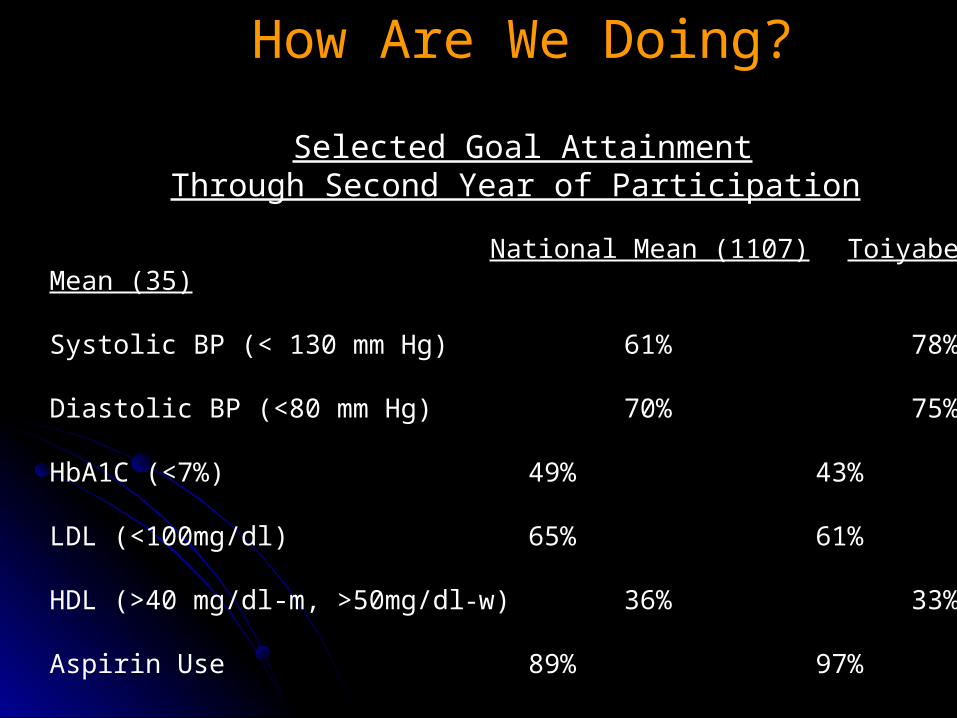
How Are We Doing?
Selected Goal AttainmentThrough Second Year of Participation
National Mean (1107) Toiyabe Mean (35)
Systolic BP (< 130 mm Hg) 61% 78%
Diastolic BP (<80 mm Hg) 70% 75%
HbA1C (<7%) 49% 43%
LDL (<100mg/dl) 65% 61%
HDL (>40 mg/dl-m, >50mg/dl-w) 36% 33%
Aspirin Use 89% 97%
As of January 1, 2010

How Are We Doing?Selected Clinical Characteristics
Change from Baseline through Second Year
National Mean Toiyabe Mean
Weight loss 1.5% 5.4%
BMI decrease .8% 3.0%
Systolic BP decrease 1.5% 3.2%
Diastolic BP decrease 2.5% 3.7%
As of January 1, 2010

How Are We Doing?Selected Clinical Characteristics
Change from Baseline through Second Year
National Mean Toiyabe Mean
LDL decrease 8.3% 1.6%
HDL increase 2.5% 5.9%
Triglycerides decrease 10.1% 9.4%
Total Cholesterol decrease 5.2% 3.0%
HbA1C decrease 3.8% 2.5%
As of January 1, 2010
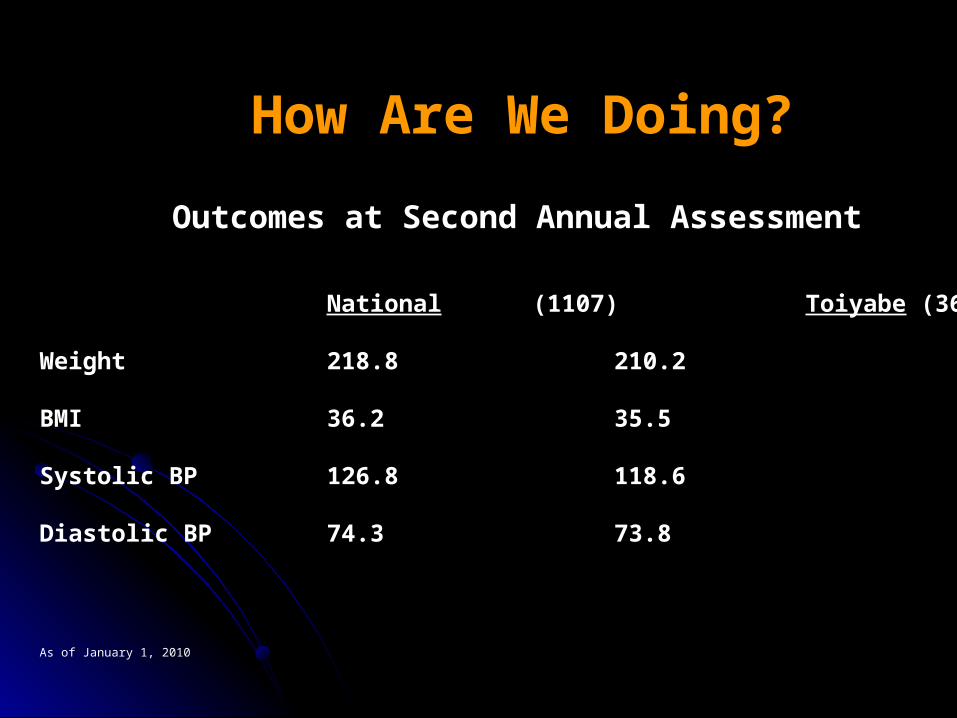
How Are We Doing?
Outcomes at Second Annual Assessment
National (1107) Toiyabe (36)
Weight 218.8 210.2
BMI 36.2 35.5
Systolic BP 126.8 118.6
Diastolic BP 74.3 73.8
As of January 1, 2010

How Are We Doing?
Outcomes at Second Annual Assessment
National (1107) Toiyabe (36)
LDL 90.2 88.2
HDL 44.7 46.6
Triglycerides 177 207
Total Cholesterol 167.4 165.2
HbA1C 7.5 7.7
As of January 1, 2010

Toiyabe Indian Health Project, Inc.
Healthy Heart Program
California AreaIHS Medical Conference
Sacramento, CA2010
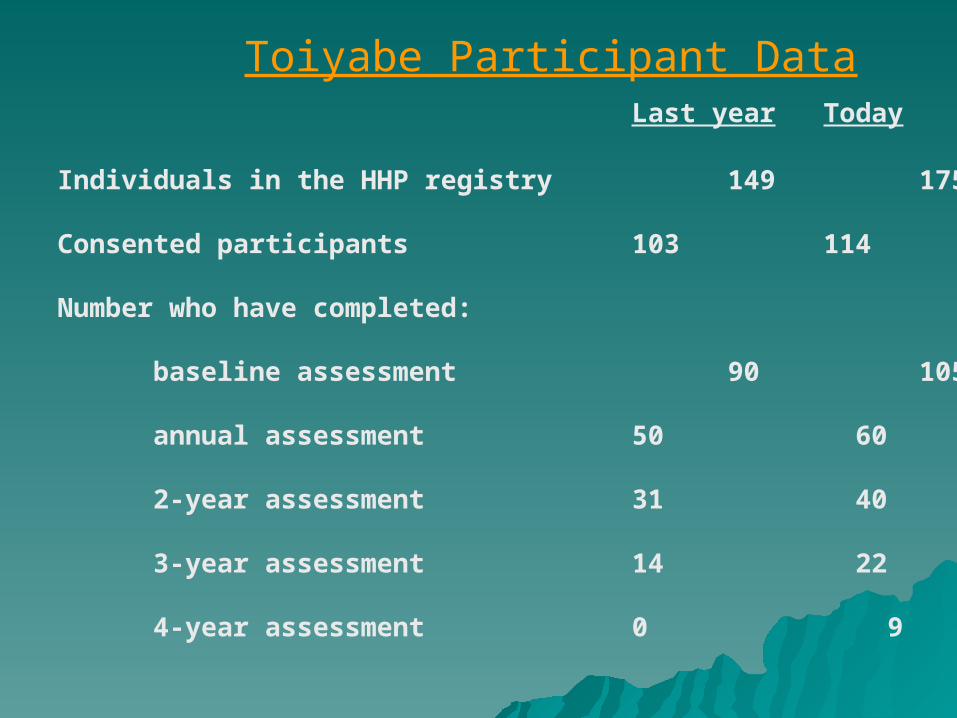
Toiyabe Participant DataLast year Today
Individuals in the HHP registry 149 175
Consented participants 103 114
Number who have completed:
baseline assessment 90 105
annual assessment 50 60
2-year assessment 31 40
3-year assessment 14 22
4-year assessment 0 9

Clinical Characteristics ComparisonNational and Toiyabe Healthy Heart Participants
through Second Year
National Toiyabe
Base 2nd Base 2nd (%) Change from Baseline(3331) (1107) (91) (36)
National ToiyabeWeight 222.2 218.8 222.2 210.2 1.5 5.4BMI 36.5 36.2 36.6 35.5 .8 3.0Waist 45.6 44.9 44.6 43.7 1.5 2.0Systolic 128.7 126.8 122.5 118.6 1.5 3.2Diastolic 76.2 74.3 76.6 73.8 2.5 3.7Cholesterol 176.5 167.4 170.3 165.2 5.2 3.0 LDL 98.4 90.2 89.6 88.2 8.3 1.6 HDL ↑ 43.6 44.7 44.0 46.6 2.5 5.9Triglycerides 196.9 177.0 228.8 207.4 10.1 9.4HbA1C 7.8 7.5 7.9 7.7 3.8 2.5
Data from SDPI HH Progress Report – 12/31/09

Toiyabe Indian Health Project, Inc.Comparison of Healthy Heart Participants
and DM patients (not in HH Program)September 2009
DM Group (%) HH Group (%) n=188 n=66
A1C < 8.0 33 50 BP < 130/80 26 58Cholesterol <200 mg/dl 33 70
LDL < 100 mg/dl 17 47HDL > 55 mg/dl 5 15
Triglycerides < 150 mg/dl 19 48Foot Exam 43 92Eye Exam 25 50Dental Exam 40 64Diet Education 36 91Exercise Education 32 80Depression Screening 36 74

Application to CDCApplication to CDCfor Community Transformation for Community Transformation
GrantGrant
July 15, 2011July 15, 2011
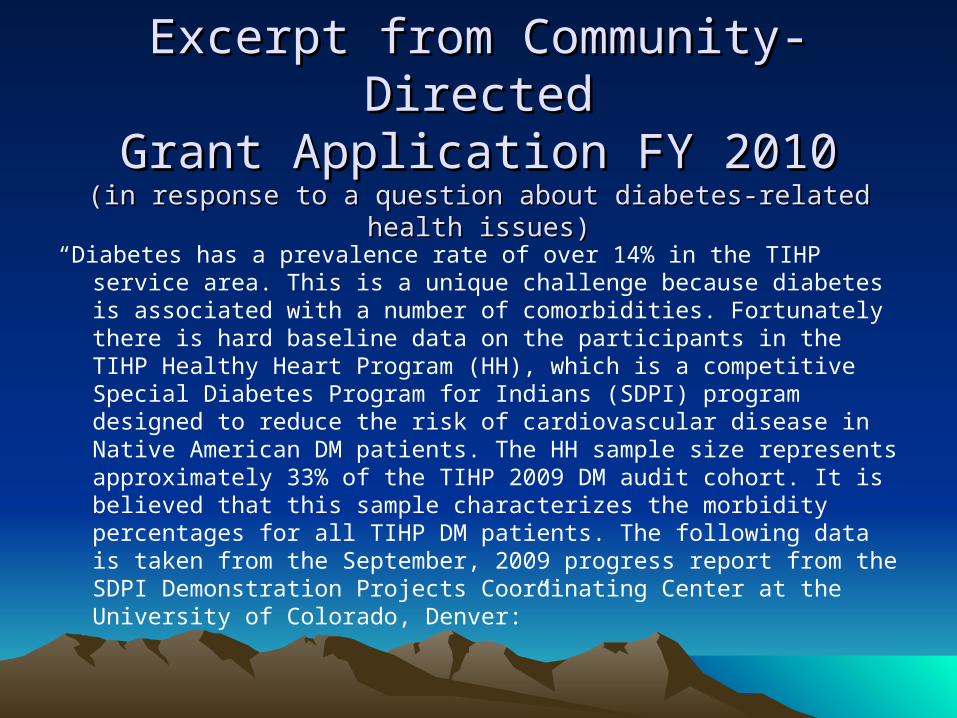
Excerpt from Community-DirectedExcerpt from Community-DirectedGrant Application FY 2010Grant Application FY 2010
(in response to a question about diabetes-related health issues)(in response to a question about diabetes-related health issues)
“Diabetes has a prevalence rate of over 14% in the TIHP service area. This is a unique challenge because diabetes is associated with a number of comorbidities. Fortunately there is hard baseline data on the participants in the TIHP Healthy Heart Program (HH), which is a competitive Special Diabetes Program for Indians (SDPI) program designed to reduce the risk of cardiovascular disease in Native American DM patients. The HH sample size represents approximately 33% of the TIHP 2009 DM audit cohort. It is believed that this sample characterizes the morbidity percentages for all TIHP DM patients. The following data is taken from the September, 2009 progress report from the SDPI Demonstration Projects Coordinating Center at the University of Colorado, Denver:”
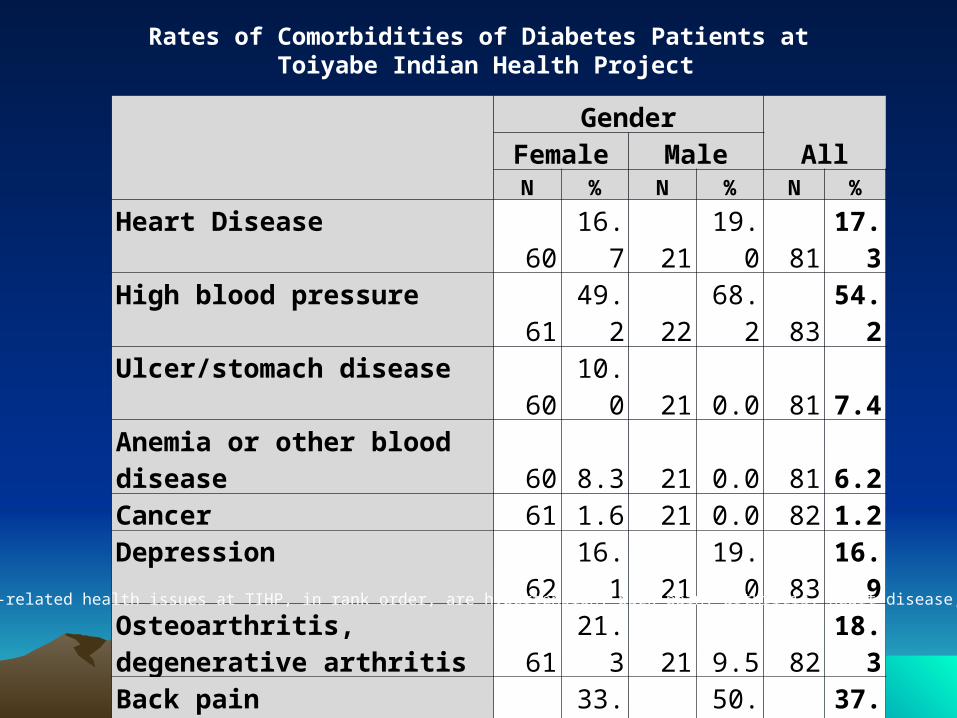
GenderAllFemale Male
N % N % N %
Heart Disease 60 16.7 21 19.0 81 17.3High blood pressure 61 49.2 22 68.2 83 54.2Ulcer/stomach disease 60 10.0 21 0.0 81 7.4Anemia or other blood disease
60 8.3 21 0.0 81 6.2Cancer 61 1.6 21 0.0 82 1.2Depression 62 16.1 21 19.0 83 16.9Osteoarthritis, degenerative arthritis 61 21.3 21 9.5 82 18.3Back pain 60 33.3 22 50.0 82 37.8Rheumatoid Arthritis 61 13.1 21 4.8 82 11.0
Rates of Comorbidities of Diabetes Patients at Toiyabe Indian Health Project
The top five DM-related health issues at TIHP, in rank order, are hypertension, back pain, arthritis, heart disease, and depression.