using hard cost data on resource consumption to measure
TRANSCRIPT

USING HARD COST DATA ON RESOURCE CONSUMPTION TO MEASURE
GREEN BUILDING PERFORMANCE
By
ERIC MEISTER
A THESIS PRESENTED TO THE GRADUATE SCHOOL OF THE UNIVERSITY OF FLORIDA IN PARTIAL FULFILLMENT
OF THE REQUIREMENTS FOR THE DEGREE OF MASTER OF SCIENCE IN BUILDING CONSTRUCTION
UNIVERSITY OF FLORIDA
2005

Copyright 2005
by
Eric Meister

iii
TABLE OF CONTENTS page
LIST OF TABLES............................................................................................................. iv
LIST OF FIGURES ........................................................................................................... vi
ABSTRACT...................................................................................................................... vii
CHAPTER
1 INTRODUCTION ........................................................................................................1
Statement of Problem ...................................................................................................1 Objective of Study ........................................................................................................2 Hypothesis ....................................................................................................................3 Overview.......................................................................................................................3
2 LITERATURE REVIEW .............................................................................................4
Cost Analysis ................................................................................................................9 Additional Benefits of Sustainable Design.................................................................11 Justification.................................................................................................................13
3 RESEARCH METHODOLOGY ...............................................................................15
Parameters...................................................................................................................15 Life-Cycle Cost Analysis............................................................................................16
4 RESULTS...................................................................................................................18
Rinker Hall Sustainable Design..................................................................................22 Direct Resource Consumption Comparison ...............................................................24 Summary Analysis......................................................................................................37 Life-Cycle Cost Analysis............................................................................................39
5 CONCLUSION...........................................................................................................45
LIST OF REFERENCES...................................................................................................49
BIOGRAPHICAL SKETCH .............................................................................................51

iv
LIST OF TABLES
Table page 2-1 Cost and Related Savings on Two Prototype Buildings ..........................................14
4-1 Building Properties...................................................................................................18
4-2 Rinker Hall Day-lighting Premium ..........................................................................22
4-3 Rinker Hall Energy Premium...................................................................................23
4-4 Rinker Hall Rainwater-Harvesting Premium ...........................................................23
4-5 Chilled Water Consumption (Kth) ...........................................................................25
4-6 Associated Costs for Chilled Water .........................................................................25
4-7 Electricity Usage (KWh)..........................................................................................26
4-8 Associated Costs for Electricity ...............................................................................26
4-9 Steam Consumption (Klbs) ......................................................................................27
4-10 Associated Costs for Steam Consumption ...............................................................27
4-11 Water Consumption (Kgal) ......................................................................................28
4-12 Associated Costs for Water Consumption ...............................................................28
4-13 Total Utility Consumption Costs..............................................................................29
4-14 Chilled Water Consumption (Kth) ...........................................................................32
4-15 Associated Costs for Chilled Water .........................................................................32
4-16 Electricity Consumption(Kwh) ................................................................................33
4-17 Associated Costs for Electricity ...............................................................................33
4-18 Steam Consumption (Klbs) ......................................................................................34
4-19 Associated Costs for Steam Consumption ...............................................................34
v
4-20 Water Consumption (Kgal) ......................................................................................35
4-21 Associated Costs for Water Consumption ...............................................................35
4-22 Total Utility Consumption Costs for Rinker Hall and Anderson Hall .....................36
4-23 Total Annual Values by Square Footage..................................................................38
4-24 Total Annual Values by Square Footage Adjusted for Hours of Operation ............38
vi
LIST OF FIGURES
Figure page 4-1 Rinker Hall Space Breakdown .................................................................................19
4-2 Anderson Hall Space Breakdown ............................................................................19
4-3 Frazier Rogers Hall Space Breakdown ....................................................................20
4-4 Chilled Water Consumption (Kth) For Frazier Hall vs. Rinker Hall .......................25
4-5 Electricity Consumption(KWh) for Frazier Hall vs. Rinker Hall ............................26
4-6 Steam Consumption (Klbs) for Frazier Hall vs. Rinker Hall ...................................27
4-7 Water Consumption (Kgal) for Frazier Hall vs. Rinker Hall ...................................28
4-8 Total Utility Cost for Frazier Hall vs. Rinker Hall ..................................................29
4-9 Chilled Water Consumption (Kth) for Anderson Hall vs. Rinker Hall....................32
4-10 Electricity Consumption(KWh) for Anderson Hall vs. Rinker Hall ........................33
4-11 Steam Consumption (Klbs) for Anderson Hall vs. Rinker Hall...............................34
4-12 Water Consumption (Kgal) for Anderson Hall vs. Rinker Hall...............................35
4-13 Total Annual Utility Cost for Anderson Hall vs. Rinker Hall .................................36
4-14 Life-Cycle Cost Analysis for Rinker Hall vs. Frazier Rogers Hall..........................40
4-15 Life Cycle-Cost Analysis for Rinker Hall vs. Anderson Hall..................................42
4-16 Graphical Display of Life-Cycle Cost Analysis.......................................................44

vii
Abstract of Thesis Presented to the Graduate School
of the University of Florida in Partial Fulfillment of the Requirements for the Degree of Master of Science in Building Construction
USING HARD COST DATA ON RESOURCE CONSUMPTION TO MEASURE GREEN BUILDING PERFORMANCE
By
Eric Meister
May 2005
Chair: Charles Kibert Major Department: Building Construction
In the rapidly expanding built environment, designers, owners, and constructors
alike are making strides to conserve natural elements and to plan with sustainable intent.
Although efforts are increasing at an exponential rate, the overall thrust of sustainable
design is still in its infancy. As with any innovative movement, sustainable design has
many skeptics. Many developers require considerable justification before they are willing
to spend between 2 and 5 percent in additional construction costs. The goal of those
involved with sustainable ideals is to develop designs and structures that do the
convincing by themselves, through ground-breaking increases in building efficiency and
overall effectiveness.
This study evaluated one such effort at M.E. Rinker Sr. Hall on the University of
Florida(UF) campus. Although numerous initiatives were carried out to earn a Leadership
in Energy and Environmental Design (LEED) “Gold” Certification, this study will
examine the steps taken to reduce resource consumption limited to chilled water, potable

viii
water, steam, and electricity. Our results provided feedback to the UF, and also provided
concrete evidence for future initiatives at the UF and other educational institutions.
By collecting and analyzing resource-consumption data, this study analyzed the
performance of M.E. Rinker Sr. Hall compared to two similar structures on the UF
campus; James N. Anderson Hall, and Frazier Rogers Hall. After qualifying data through
Gainesville, FL climate analysis, and building characteristics, we conducted a head-to-
head comparison of consumption and associated costs to present the first look into
resource usage. Next, a life-cycle cost analysis produced current dollar amounts for a
20-year projected life of the resource consumption of each building to evaluate cost
savings and pay-back for the Rinker Hall Sustainable Initiative. Final results laid the
foundation for a future, more comprehensive study analyzing tangible consumption and
performance costs, and also intangible positive results of the sustainable design efforts
for Rinker Hall.

1
CHAPTER 1 INTRODUCTION
The Green Building Movement is a relatively young phenomenon in the
construction world. New methods and materials are making the idea of sustainable
construction more believable every day. As more and more “green” buildings are
constructed, builders and designers are beginning to develop more effective techniques
for producing savings in both energy and materials usage. The push behind sustainable
design and green building lies nested heavily in environmental concerns; however,
pitching revolutionary ideas to owners and builders based only on environmental
protection would have proven quite difficult. While effects such as resource conservation,
pollutant reduction, and revitalization of nature are bragging rights for sustainable
innovations, so too is the financial performance of green buildings.
Statement of Problem
At the design phase of sustainable construction, designers begin to make selections
regarding materials, systems, processes and other major components. These choices are
driven simultaneously by both conservation and financial factors. Designers must attempt
to balance the added construction costs of implementing sustainable technologies with
the assumed life-cycle cost savings from the improved performance of the building.
Because of the relatively young nature of green construction, these design-phase
estimates of cost vs. savings are merely predictions, and are not necessarily reliable.
As a perspective owner, it is difficult to decide whether to add costs to your project
for sustainable design when there is no guarantee of building performance. Different

2
projects use different systems and different levels of integration of these systems within
their sustainable designs, making it difficult to compare two projects under like
conditions. Therefore, designers can face difficulty in explaining the feasibility of
proposed designs, and in convincing perspective developers. This poses an escalating
problem as the population continues to grow, and resource consumption continues to
increase drastically. Sustainable design is becoming essential to preserving the human
environment, and measures must be taken to help push green thinking to a much higher
priority level in the design-development process.
Objective of Study
Our objective was to validate the use of hard cost data on resource consumption
evaluate green building performance. We did this by producing a life-cycle-cost based,
direct-cost economic model comparing performance of a green building on the UF
campus to the performance of two additional, code-compliant structures. Buildings used
for comparison will be a fully functioning LEED certified building, (Rinker Hall), and
two additional structures, (one code-compliant structure completed in 2001, Frazier
Rogers Hall; and one older building re-furbished for 2002, Anderson Hall). All three
buildings are very similar in total amount of conditioned space, type of use, years of use,
and environmental exposure. These similarities account for the control of the experiment,
allowing true representation of “green” building performance in the Gainesville, FL
environment. The study examined consumption of the 4 highest-use utilities for the
buildings: electricity, steam, water, and chilled water. Our aim was to evaluate the actual
difference in building performance brought forth by the sustainable design efforts for
Rinker Hall. These findings will then be presented along with hard-cost data for the

3
buildings in an attempt to evaluate the current status of sustainable efforts in central
Florida higher education facilities.
Hypothesis
The true performance of Rinker Hall is the item in question in the study. The
$7 million, 47,270-square-foot building was designed to use half the electricity and
an even smaller fraction of the water of other buildings its size. While it would be
difficult to measure the effects of all the sustainable-design efforts in Rinker Hall, this
study tested whether a life-cycle costing analysis of hard-cost, resource consumption data
can effectively demonstrate the greenness of the structure as compared to similar
structures on the University of Florida Campus.
Overview
This study was intended to effectively model the annual financial impacts on
resource usage of the sustainable design of Rinker Hall. Author Hal R. Varian details the
steps used to explain the rational behind an effective model as follows: 1. the model must
address who makes the choices involved. 2. What constraints do the decision makers
face. 3. What interaction exists. 4. What information is being processed and what is being
predicted. 5. What adjusts to assure consistency ( Varien, 1997).

4
CHAPTER 2 LITERATURE REVIEW
Our literature review explored the growing momentum of sustainable design and
green building in today’s construction industry. Sustainable design is defined as “Design
that seeks to create spaces where materials, energy and water are used efficiently and
where the impact on the natural environment is minimized” (Means 2004). While
sustainable design extends far beyond physical structures, the built environment is
perhaps the largest component of sustainability. At its current state, sustainable design is
a young phenomenon of which the defining parameters are constantly changing.
Designers are learning with each sustainable undertaking, and through the occasional
mishap that “one who accepts an opportunity to design a project without clearly
understanding the concepts and costs involved places the owner—not to mention the
A/E’s reputation and economic stability— at risk” (Wyatt, 2004, p.33) Adding to the
problem is the vast amount of information available on the topic of sustainability; some
of which is useful, most of which is not (Wyatt, 2004). Despite what is believed by many
professionals, sustainable design is not achieved by simply amassing green products
under one roof, but is achieved through a much more systematic approach that deals with
not only bricks and mortar, but the entire environment, life cycle, and performance of the
project.
Once the designer has a grasp of the intent of the sustainable design at hand, he or
she must look closely at several factors. These factors are common to any type of
construction design, but have additional implications for green buildings. For example, in

5
any type of project, the designer must choose the building service systems to be installed.
In sustainable design numerous factors are added to the checklist that otherwise wouldn’t
exist. The same is true for material selection, building orientation, and various other
components. Another major component in the decision making process is the climate and
environment in which the structure will be put into place. “Today’s green designers
realize that any approach must improve quality, such as better control of temperature,
humidity, lighting effectiveness and indoor air” (Macaluso,2002, p.199). For example,
when designing for solar gain in a particular climate, measures must be taken to
adequately design for avoidance of excessive overheating in the summer while still
maximizing potential gains during the colder winter months.
Effective sustainable designs are unique to each individual project because the
needs of each project are unique in themselves. Individual owner’s ideas, material
availabilities, environmental impacts, and numerous other factors give each project an
individual identity. With this identity comes different critical factors for design. When
designing a particular structure for natural lighting, for example, numerous factors come
to mind. Relative heating, cooling and lighting requirements and potential heat gains
from people, equipment, lighting and the sun have to be examined in relation to building
form, orientation, occupancy patterns, and environmental requirements in order to ensure
that the full picture emerges prior to making major design decisions. Overall, designers
must keep one simple fact in mind, a solution that produces one successful commercial
building cannot automatically be applied to another (McElroy, 1999).
In order to help regulate the green building process, the United States Green
Building Council has established the Leadership in Energy and Environmental Design

6
(LEED) green building rating system. Members of the U.S. Green Building Council
representing all segments of the building industry developed LEED and continue to
contribute to its evolution. Based on well-founded scientific standards, LEED emphasizes
state of the art strategies for sustainable site development, water savings, energy
efficiency, materials selection and indoor environmental quality (USGBC, 2005). The
LEED system was created to
• Define "green building" by establishing a common standard of measurement • Promote integrated, whole-building design practices • Recognize environmental leadership in the building industry • Stimulate green competition • Raise consumer awareness of green building benefits • Transform the building market
Before the LEED system, energy-consumption designs were guided by the
American Society of Heating, Refrigerating, and Air-Conditioning Engineers (ASHREA)
Standard 90.1. The 90.1 code is a set of requirements for energy efficient design of
commercial buildings intended to promote the application of cost effective design
practices and technologies that minimize energy consumption without sacrificing either
the comfort or the productivity of the occupants (US Dept. of Energy, 2004). While
ASHREA guidelines promote the same ideas as LEED, they are less stringent, and center
only on space conditioning.
As one might expect, analyzing these added considerations also included an
element of added costs. In any case, the implementation of new technologies will add to
price tag of a project. Perspective owners often shy away from new methods or ideas due
to fear of unanticipated costs or problems, but recent history is beginning to show that
such concerns are less of a reality with sustainable design. A common misconception in
the construction field deals with the additional cost of the added design effort, time, and

7
materials required to achieve sustainable results. Some common figures overestimate the
cost increase to be as high as 30%. In actuality, a properly implemented design effort can
achieve a certified or “silver” rating under the LEED system with as little as 2.5 to 4%
increase in costs (Tuchman 2004). Some even believe that improvement to the point of
little or no cost increase can be achievable in the near future.
A 2003 study of thirty-three green buildings from throughout the United States
compared their up-front design costs with conventional design costs for identical
structures. The average price increase was surprisingly slightly less than 2%,($3 to $5/sf).
“The majority of this cost is due to the increased architectural and engineering
design time, modeling costs, and time necessary to integrate sustainable building
practices into projects” (Kats 2003, p. 3). One must realize that no true standard exists
for which factors are taken into account in this type of analysis. The 1.82% average cost
premium for Gold certified structures is very likely an underestimate of the added design
effort and materials costs required to achieve that level. It is at the discretion of the study
as to which items and factors are included in the cost premium, making such comparisons
simply ball-park figures rather than true evidence.
In any pre-construction situation, building costs should be analyzed including not
only up-front costs, but also future costs that occur over the lifetime of the facility,
system, or component (Macaluso, 2002). This is perhaps the most important point that a
sustainable designer can stress to a perspective owner. Detailed analysis of projected life
cycle costs are required to illustrate that the increases in efficiency of the building can
eventually outweigh the up-front increase in construction costs. It is also important for
the designer to carefully research each product or system before making this statement

8
however, as it is true in some cases that a green product can have both a higher up-front
cost and a higher operating cost. In this case, it is the job of the designer to show that the
unique advantages of the product outweigh both levels of cost increase. In somewhat rare
cases, products are available that not only run more efficiently, but also cost less during
construction, such as demand heaters in place of central hot water heaters, or smaller,
more efficient chillers. These situations are the designer’s dream, and can effortlessly
convince a prospective owner. According to the USGBC, high performance green
buildings (USGBC, 2003)
• Recover higher first costs, if any. Using integrated design can reduce first costs and higher costs for technology and controls.
• Are designed for cost-effectiveness. Added building efficiency produces savings in the 20% to 50% range as well as savings in building maintenance, landscaping, water, and wastewater costs. Integrated planning including site orientation, technology implementation and materials selection are the factors behind these savings.
• Boost employee productivity. Employers can realize significant bottom line savings through increased worker productivity. Simple investments in increased daylight, pleasant views, better sound control, and other features can reduce absenteeism, improve health and increase worker concentration/efficiency.
• Enhance health and well-being. High performance buildings offer healthier and more pleasing surroundings for their inhabitants. As results are becoming quantifiable, the improved indoor environments offered within green buildings are being used as recruiting tools for employers.
• Reduce liability. Focusing on the elimination of sick buildings and specific problems such as mold can reduce claims and litigation. Insurance companies are rumored to be investigating implementation of lower premiums for high performance buildings.
• Create value for tenants. Improved building efficiency and lowered operating costs can lead to decreased tenant turnover. Savings averaging $.50/sf per year greatly increase the likelihood of increased rental periods.
• Increase property value. LEED and Energy Star buildings which operate more efficiently and maintain high tenant capacity are more desirable for purchase. Also, the more efficient building frees up additional cash flow for outside investment

9
during ownership. These features ass assumed value to a high performance building and increase demand.
• Take advantage of incentive programs. Many states and private organizations offer financial and regulatory incentives for the development of green buildings. Government tax credits and private loan funds are effectively assisting developers of high performance projects. The number of these programs is likely to grow and may include, among other possibilities, reduced approval times, reduced permit fees, and lower property taxes.
• Benefit your community. “Properties that take advantage of brownfield and other infill redevelopment, while offering proximity to mass transit, walking, biking and shopping/daycare services have an automatic advantage in the race to attract top talent.” Though reducing congestion and pollution, and providing economic benefit to local transit, high performance buildings and their companies are being welcomed into community after community.
• Achieve more predictable results. Green building delivery use “best of class”in order to reduce uncertainty and risk and delivery the final project at the level promised. Through interactive design, life cycle analysis and energy modeling, designers are able to focus on the particular needs of an individual site and building. These practices help to minimize surprises and errors during construction, and to ensure the delivery of the high quality level promised to customers.
Despite the convincing nature of the current body of knowledge, owners may still
be asking themselves, “why build green?” The industry has yet another answer other than
long term cost savings. “Aside from the obvious hurdles and often higher initial costs,
there are some compelling, albeit long term financial advantages to building green. For
example, a “green” building shows that the owner will spend more to invest in nature,
quality, and innovation” (Macaluso, 2002, p.199.) At the current stage of the sustainable
world, any major green project is marquee, and is essentially free press for any owner.
Cost Analysis
Unknown to most; construction activity, including both new construction and
renovation, accounts for the nation’s largest manufacturing sector. With a contribution to
the U.S. economy of approximately $1.009 trillion, Construction accounts for over 15%
of the Gross Domestic Product. Costs of construction can be broken down into 3 major
10
categories, investment related costs, operational costs, and personnel costs. Contrary to
popular belief, when viewed over a 30 year period, initial building costs (investment)
account for only two percent of the total cost, and operations and maintenance costs
amount to six percent. The remaining 92 percent consists of personnel costs. While the
names are quite self-explanatory, the methods by which they are calculated differ greatly.
Investment related costs are incurred during the construction phase of the project, often
with a large lump sum, and additional periodic payments. Operational costs are constant
throughout the life of the building, and are incurred on a periodic basis as well. During
the design phase, after materials and systems are selected and priced, projected values for
operational costs are then estimated and inserted along side the investment related costs
to develop the projected life cycle costs analysis for the project. Taken a step further, an
analysis can be carried out using simply code compliant materials and systems and laid
out along side the sustainable design. The two will then be analyzed, to determine the
payback period for the additional investment costs of the sustainable design. If the
payback period ends early enough within the lifecycle to produce profit during the
building’s life, and the initial cost increase is a feasible undertaking for the owner, the
designer should then push for the sustainable option. Other systems used to help justify
costing are the Initial Rate of Return (IRR), the net savings, and the Savings to
Investment Ratio (SIR) (Fuller, 2002).
There are of course some difficulties in justifying the cost of sustainability, a major
example of which lies within the less tangible results of sustainable design. “How do you
put a price on clean air and clean water? What ultimately is the price of human life, and
how do we value the avoidance of its loss” (Lippiat, 2002, p.267)? An owner who is

11
willing to invest in sustainable design should also have a vested interest in its cause. By
owning a piece of the sustainable built environment, said owner is doing their part to help
preserve the environment for future generations. Some have begun to investigate how this
side of “green” building can be financially rewarding as well. Insurance companies as
well as government agencies and utility companies have begun looking seriously into
providing benefits to certified green buildings. Such moves could help to completely
offset the added costs of sustainable design. Another difficulty lies in the reliability of the
future cost estimates. It is estimated that a properly designed green building can produce
a 20 year net benefit of between $50 and $70 per square foot. This equates to over ten
times the additional cost associated with such efforts (Kats, 2003). Future energy and
environmental costs simply cannot be predicted accurately due to unknown factors that
are beyond a true measure of control. Also, standard periods of comparison between
code-compliant construction and sustainable construction should ideally be lengthened by
several years to better display the longevity of sustainable design in order to see the true
financial gains (Pitts, 2004).
Additional Benefits of Sustainable Design
Aside from the financial implications previously mentioned, green buildings
provide many additional potential benefits. These may include waste reduction, lowered
maintenance needs, improved public perception, and high indoor environmental
quality(IEQ).These types of gains are more difficult to quantify, yet still factor heavily
into the overall effectiveness of building design.
Of all the intangible factors, IEQ provides perhaps the heaviest influence on the
overall success of a design. Humans spend approximately 90% of their time indoors,
exposing themselves to concentrations of toxins typically 10 to 100 times higher than in

12
the outdoor environment. Health and productivity costs associated with poor indoor
environment have been roughly estimated to be as high as hundreds of billions of dollars
per year. (Kats, 2003) Thousands of studies, articles and reports have proven a
correlation between high indoor environmental quality and reductions in occupant illness
and employee absenteeism, as well as increases in general productivity.
Numerous characteristics of green buildings contribute greatly to improved IEQ.
LEED certified buildings implement less toxic materials found in many high frequency-
of-use items such as low-emitting adhesives & sealants, paints, carpets, and composite
wood products. Also, improved thermal comfort, ventilation, and HVAC efficiency are
staples of the sustainable design effort. These two efforts, combined with CO2
monitoring vastly improve breathable air quality and lessen the risk of airborne toxins or
contaminates such as mold or fungi. In addition to lowered health risks from improved
breathable air, IEQ also increases significantly through natural lighting efforts. LEED
accredited buildings implement modern daylight harvesting techniques, natural shading,
and glare control to reproduce a comfortable, natural environment. These efforts to
reproduce natural environments are centered upon multiple goals, the most important
being occupant productivity. “Green buildings are designed to be healthier and more
enjoyable working environments. Workplace qualities that improve the environment of
knowledge workers may also reduce stress and lead to longer lives for multi-disciplinary
teams” (Kats, 2003, p.6).
The design initiatives mentioned above have been positively linked to increases in
productivity by numerous sources. “Increases in occupant control of ventilation, lighting
and temperature have provided measured benefit from 0.5% up to 34%, with average

13
measured workforce productivity gains of 7.1% from lighting control, 1.8% with
ventilation control, and 1.2% with thermal control” ( Kats, 2003, p.6).
It is estimated, at the low end, that a 1% productivity and health gain can be
awarded to LEED certified and Silver rated buildings, and a 1.5% gain added to Gold and
Platinum rated structures. For each 1% increase in productivity, equal to approximately 5
minutes per work day, an increase of $600 to $700 per employee per year, or $3/SF per
year can be realized. Taking this into account, and applying a 5% discount rate over a 20
year period, the present value of productivity benefits is about $35/SF for LEED
certified and Silver rated buildings, and $55/SF for Gold and Platinum (Kats, 2003).
Justification
Recent literature shows that sustainable design and green buildings are rapidly
gaining momentum in society. At its current state, the movement has now reached the
maturity level to provide sufficient data to produce actual results in comparison to
standard construction. For example, the U.S. Department of Energy’s Pacific Northwest
National Laboratory (PNNL) and the National Renewable Energy Laboratory (NREL)
compared the costs and related savings of sustainable efforts on 2 prototype buildings. “A
base two-story, 20,000 square foot building with a cost of $2.4 million dollars and
meeting the requirements of ASHRAE Standard 90.1-1999 was modeled using two
energy simulation programs, DOE-2.1e and Energy-10, and compared to a high
performance building that added $47,210 in construction costs, or about 2% for its energy
saving features”(Kibert 2005, p.488). Results of this comparison, shown below in Table
2.1, are quite noteworthy as the realized annual performance gain nearly equals the
additional up-front cost in the first year alone.
14
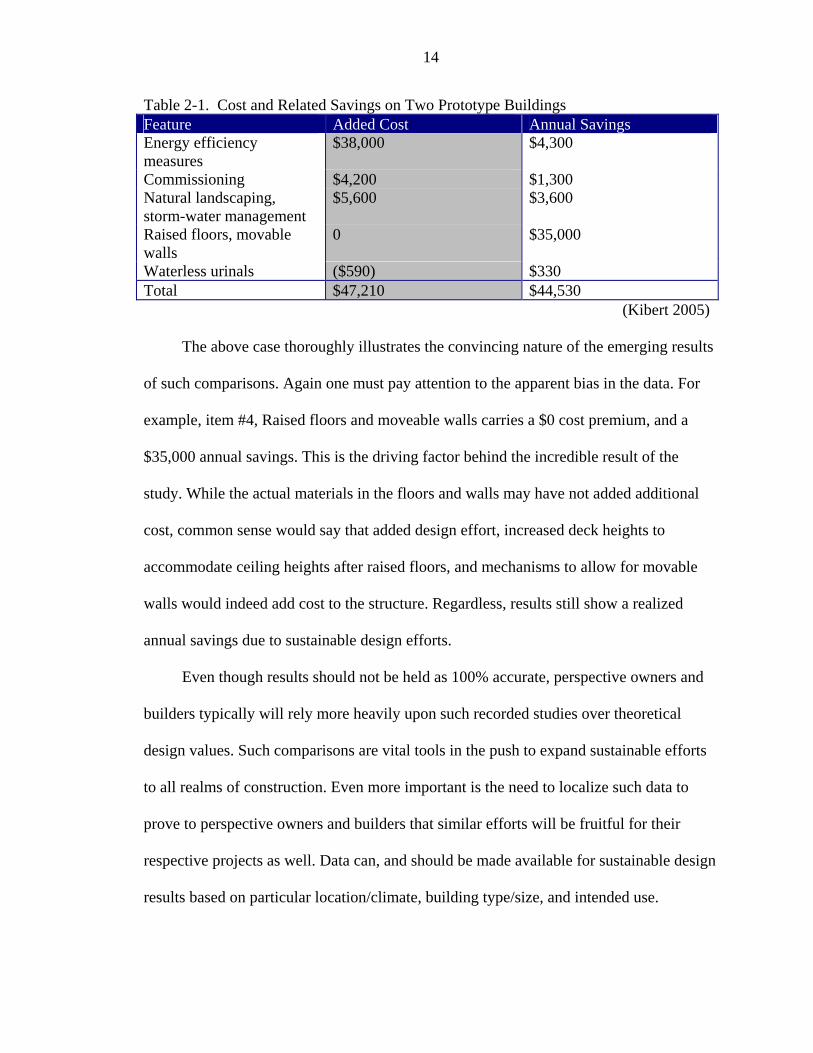
Table 2-1. Cost and Related Savings on Two Prototype Buildings Feature Added Cost Annual Savings Energy efficiency measures
$38,000 $4,300
Commissioning $4,200 $1,300 Natural landscaping, storm-water management
$5,600 $3,600
Raised floors, movable walls
0 $35,000
Waterless urinals ($590) $330 Total $47,210 $44,530 (Kibert 2005)
The above case thoroughly illustrates the convincing nature of the emerging results
of such comparisons. Again one must pay attention to the apparent bias in the data. For
example, item #4, Raised floors and moveable walls carries a $0 cost premium, and a
$35,000 annual savings. This is the driving factor behind the incredible result of the
study. While the actual materials in the floors and walls may have not added additional
cost, common sense would say that added design effort, increased deck heights to
accommodate ceiling heights after raised floors, and mechanisms to allow for movable
walls would indeed add cost to the structure. Regardless, results still show a realized
annual savings due to sustainable design efforts.
Even though results should not be held as 100% accurate, perspective owners and
builders typically will rely more heavily upon such recorded studies over theoretical
design values. Such comparisons are vital tools in the push to expand sustainable efforts
to all realms of construction. Even more important is the need to localize such data to
prove to perspective owners and builders that similar efforts will be fruitful for their
respective projects as well. Data can, and should be made available for sustainable design
results based on particular location/climate, building type/size, and intended use.

15
CHAPTER 3 RESEARCH METHODOLOGY
The objective of this study is to evaluate the effectiveness of the sustainable design
of Rinker Hall through life-cycle cost analysis of annual resource consumption hard cost
data. The two-fold aim of the study was 1.To establish a methodology for measuring
building “greenness” through use of hard cost data. and 2. To use a life-cycle cost
analysis of collected building performance data from three similar structures on the
campus to display improvements in building efficiency through sustainable design
efforts. The steps taken to carry out the aforementioned tasks are as follows
• A literature review was carried out on the history of “green building” and the associated economics. This was done with a two fold purpose; to determine the authenticity of the proposed study, and to gain increased knowledge of the topic.
• The required parameters to be analyzed were determined.
• Proper sources were identified from which to gather data.
• Data were collected for Rinker Hall, Anderson Hall, and Frazier-Rogers Hall.
• A building Life-cycle cost analysis was run on each of the three building’s consumption of four major utilities; water, steam, chilled water and electricity.
• A final conclusion was reached based on the produced result.
Parameters
The characteristics which determine environmental attributes for the University of
Florida were determined through collecting data on monthly average temperature,
humidity, precipitation, and heating degree day calculations. This data helps to justify the
building comparison for use in similar climates. This particular study centers upon the

16
mechanical systems performance analysis and therefore took into account consumption
data for four major resources; water, steam, chilled water, and electricity. Consumption
data was acquired through assistance from the University Florida Energy Office. While
these four utilities do not represent a truly complete building analysis, they provide an
accurate representation of performance efficiency. The results were then qualified based
on average hours of building operation, and total horsepower of each building’s
mechanical systems.
Life-Cycle Cost Analysis
The life-cycle costing analysis is a quantifiable determination of true cost of
ownership, calculated within a standard Microsoft Excel Spreadsheet. The purpose of
life-cycle costing is to analyze costs over a realized life of a building, and translate those
costs into current dollars. Contrary to simply averaging costs and realizing annual
expenditures, a life-cycle costing system will adjust for inflation and escalation, and
allow for more accurate decision making by taking future factors into account. This
particular life-cycle costing system will directly compare Rinker Hall with each
additional building through separate analysis for each. Either Anderson, or Frazier
Rogers Hall will serve as the control portion of the comparison, while Rinker Hall will be
presented as the variable. The added costs for the sustainable initiatives in the Rinker
Hall mechanical systems will be carried in the up-front cost portion of the life-cycle
spreadsheet for Rinker, while the other buildings will show zero up-front cost. The
annual total for each individual utility is then entered for each respective building as the
annual costs. The sum of these costs over a 20 year period is adjusted for such factors as
price escalation, inflation, and discount rate, then presented in equivalent current dollars

17
for comparison sake. This comparison will then give the present day total value of each
mechanical system and allow for the realization of savings over the 20 year period.

18
CHAPTER 4 RESULTS
In order to accumulate the appropriate data for the life cycle comparison, three
different classifications of construction were chosen within the same building genre;
higher education classroom/administration. The three structures chosen are as follows:
Table 4-1. Building Properties Rinker Hall Anderson Hall Frazier Rogers Hall Year Completed 2002 2002 2001 Building SF 48,906 47,757 53,543 Total Horsepower *193 96.64 *165 *Building horsepower for Rinker Hall and Frazier Rogers Hall is variable, ratings are for peak horsepower and actual operating power may be quite lower.
For this study, the term Building Horsepower refers to the total base horsepower
associated with the mechanical systems housed within each structure. These systems
include air handling units, fans, water pumps, and hot water heating units.

19
A
Rinker Hall Total GSF: 48,906
Classroom: 7,030
Teaching lab: 8,810
Office/Computer: 13,017
Campus Support: 370
Non-Assignable: 18,902
B
C D
Figure 4-1. Rinker Hall Space Breakdown (clockwise from left) A Space breakdown table. B Building Front C Large Classroom D Faculty office corridor
A
Anderson Hall Total GSF: 46,950 Classroom: 4,796 Study: 500 Office/Computer: 15,823 Other Assignable: 145 Non-Assignable: 18,160
B
C D Figure 4-2. Anderson Hall Space Breakdown (clockwise from left) A. Space breakdown
table. B. Building Front C. Typical Classroom D. Faculty office corridor

20
A
Frazier Rogers Hall Total GSF: 57,577
Classroom: 2,436
Research laboratory: 25,180
Office/Computer: 11,210
Other Assignable: 34
Non-Assignable: 15,776
B
C D
Figure 4-3. Frazier Rogers Hall Space Breakdown. (clockwise from left) A.Space breakdown table B. Building Front C. Faculty office corridor D. Research laboratory
In order to effectively provide perspective owners/builders with an accurate
prediction of how their project will perform, a true climate analysis should precede
analyzed results in order to qualify such predictions. This study used buildings located on
the University of Florida campus, located in Gainesville, FL. The National Climate Data
Center(NCDC) produced the following climate description. “Gainesville lies in the north
central part of the Florida peninsula, almost midway between the coasts of the Atlantic
Ocean and the Gulf of Mexico. The terrain is fairly level with several nearby lakes to the
east and south. Due to its centralized location, maritime influences are somewhat less
than they would be along coastlines at the same latitude. Maximum temperatures in
summer average slightly more than 90°F. From June to September, the number of days
when temperatures exceed 89 °F is 84 on average. Record high temperatures are in

21
excess of 100°F. Minimum temperatures in winter average a little more than 44°F. The
average number of days per year when temperatures are freezing or below is 18. Record
lows occur in the teens. Low temperatures are a consequence of cold winds from the
north or nighttime radiational cooling of the ground in contact with rather calm air.
Rainfall is appreciable in every month but is most abundant from showers and
thunderstorms in summer. The average number of thunderstorm hours yearly is
approximately 160. In winter, large-scale cyclone and frontal activity is responsible for
some of the precipitation. Monthly average values range from about 2 inches in
November to about 8 inches in August. Snowfall is practically unknown” (NCDC 2005).
Another indication of climatic factors on design is the calculation of degree days.
Although used more-often for residential design, degree-day data can also be used to help
qualify the impact of the Gainesville climate on the following study. Degree day
calculations are quite simple to understand. The base idea is that any time the outside
temperature is above or below a base-line temperature (in this case, 65 °F), the building
must be heated or cooled to maintain a comfortable interior environment. Varying
methods for calculating the total number of degree days exist, with some considering a 24
hour period above or below the baseline to be 1 degree day, and others counting that
same period as 24. This study will consider 24 hours above or below the threshold to be
24 degree days. Gainesville FL averages 1081 degree days (heating) per year. This means
that buildings may need to be heated for approximately 1081 hours in a given year
depending on interior comfort needs of occupants. In comparison, cooler climates such as
Washington DC average over 4,000 degree days annually, and mountain climates such as
Colorado Springs average nearly 7,000. In the hot summer months in Gainesville Florida,
22
temperatures are above a 65 degree baseline for approximately 3,600 hours in an average
year. These figures are not taken directly into account in the following comparisons,
however, should be taken into account as a measure of climatic impact on the structures,
especially by readers unfamiliar with the Gainesville climate.
Rinker Hall Sustainable Design
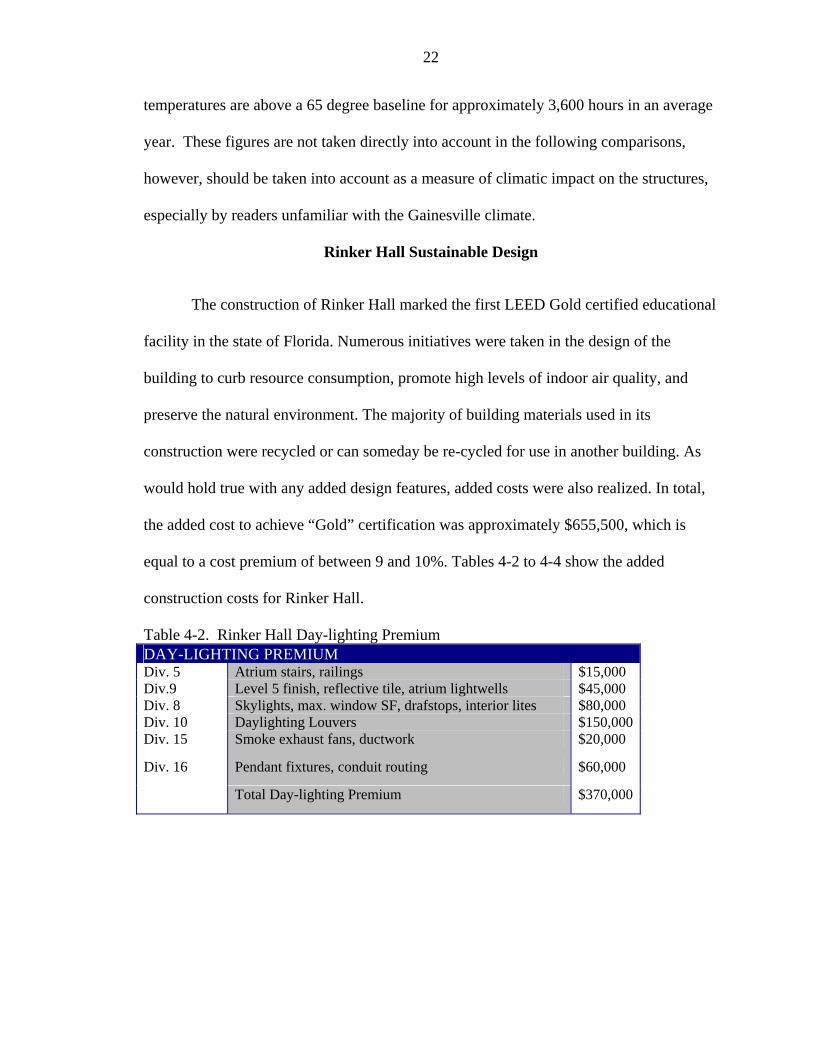
The construction of Rinker Hall marked the first LEED Gold certified educational
facility in the state of Florida. Numerous initiatives were taken in the design of the
building to curb resource consumption, promote high levels of indoor air quality, and
preserve the natural environment. The majority of building materials used in its
construction were recycled or can someday be re-cycled for use in another building. As
would hold true with any added design features, added costs were also realized. In total,
the added cost to achieve “Gold” certification was approximately $655,500, which is
equal to a cost premium of between 9 and 10%. Tables 4-2 to 4-4 show the added
construction costs for Rinker Hall.
Table 4-2. Rinker Hall Day-lighting Premium DAY-LIGHTING PREMIUM Div. 5 Atrium stairs, railings $15,000 Div.9 Level 5 finish, reflective tile, atrium lightwells $45,000 Div. 8 Skylights, max. window SF, drafstops, interior lites $80,000 Div. 10 Daylighting Louvers $150,000 Div. 15 Smoke exhaust fans, ductwork $20,000
Div. 16 Pendant fixtures, conduit routing $60,000
Total Day-lighting Premium $370,000
23
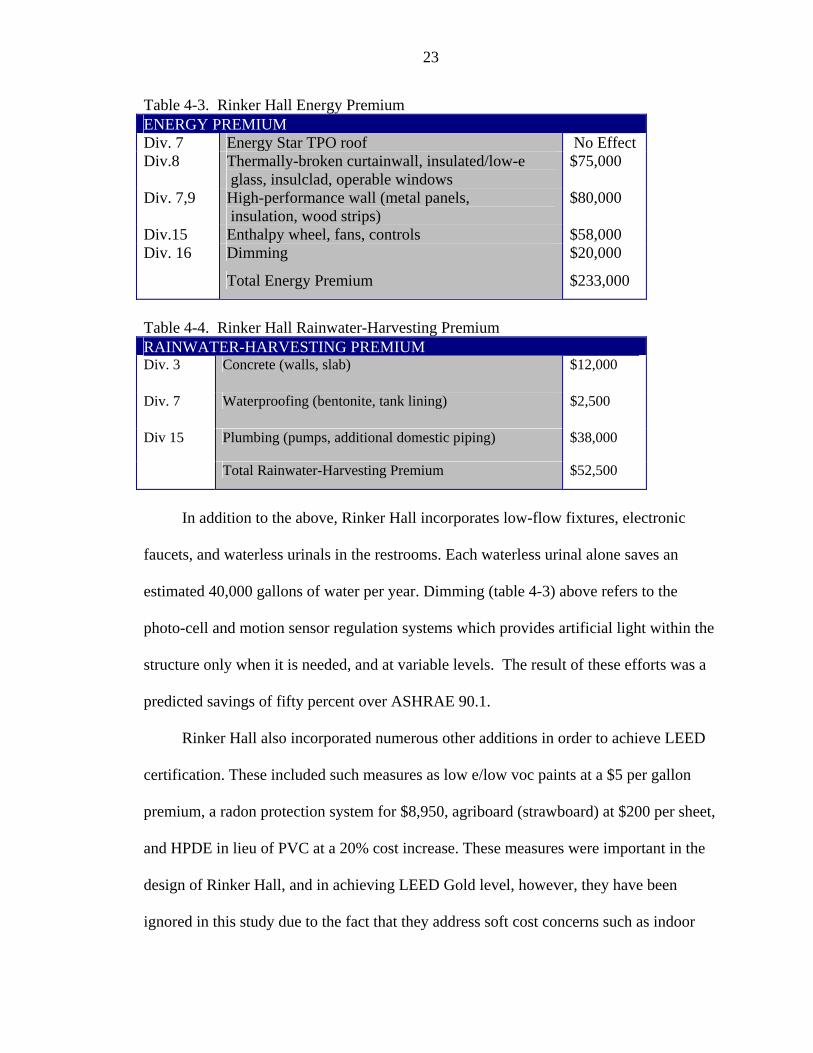
Table 4-3. Rinker Hall Energy Premium ENERGY PREMIUM Div. 7 Energy Star TPO roof No Effect Div.8 Thermally-broken curtainwall, insulated/low-e
glass, insulclad, operable windows $75,000
Div. 7,9 High-performance wall (metal panels, insulation, wood strips)
$80,000
Div.15 Enthalpy wheel, fans, controls $58,000 Div. 16 Dimming $20,000
Total Energy Premium $233,000
Table 4-4. Rinker Hall Rainwater-Harvesting Premium RAINWATER-HARVESTING PREMIUM Div. 3 Concrete (walls, slab) $12,000
Div. 7 Waterproofing (bentonite, tank lining) $2,500
Div 15 Plumbing (pumps, additional domestic piping) $38,000
Total Rainwater-Harvesting Premium $52,500
In addition to the above, Rinker Hall incorporates low-flow fixtures, electronic
faucets, and waterless urinals in the restrooms. Each waterless urinal alone saves an
estimated 40,000 gallons of water per year. Dimming (table 4-3) above refers to the
photo-cell and motion sensor regulation systems which provides artificial light within the
structure only when it is needed, and at variable levels. The result of these efforts was a
predicted savings of fifty percent over ASHRAE 90.1.
Rinker Hall also incorporated numerous other additions in order to achieve LEED
certification. These included such measures as low e/low voc paints at a $5 per gallon
premium, a radon protection system for $8,950, agriboard (strawboard) at $200 per sheet,
and HPDE in lieu of PVC at a 20% cost increase. These measures were important in the
design of Rinker Hall, and in achieving LEED Gold level, however, they have been
ignored in this study due to the fact that they address soft cost concerns such as indoor

24
environmental quality, and have little to no impact on the mechanical systems and the
resource consumption levels addressed in this comparison.
Direct Resource Consumption Comparison
To evaluate the effectiveness of these unique features over the life cycle of Rinker
Hall, building resource consumption data was collected in cooperation with the
University of Florida Energy Office. The data is presented below in the form of direct
building-to-building comparisons per resource between 1. Rinker Hall and Frazier-
Rogers Hall, and 2. Rinker Hall and Anderson Hall. Data presented below was produced
by the UF Energy Office for the complete calendar year of 2004.

25
Table 4-5. Chilled Water Consumption (Kth) Jan Feb Mar Apr May Jun Jul Aug Sep Oct Nov Dec Rinker 18.8 20.5 13.8 17.1 16.0 21.1 18.0 24.1 21.9 19.5 18.3 23.3 Frazier 16.9 13.5 26.6 30.0 54.0 75.6 83.2 91.9 84.2 64.6 42.5 33.1 Difference 1.9 7.0 -12.8 -12.9 -37.9 -54.4 -65.1 -67.7 -62.3 -45.1 -24.2 -9.8
Frazier Vs. Rinker
0.010.020.030.040.050.060.070.080.090.0
100.0
Jan Feb Mar Apr May Jun Jul Aug Sep Oct Nov DecMonth
Kth Frazier
Rinker
Figure 4-4. Chilled Water Consumption (Kth) For Frazier Hall vs. Rinker Hall
Table 4-6. Associated Costs for Chilled Water Jan Feb Mar Apr May Jun Jul Aug Sep Oct Nov Dec Rinker $1,535 $1,674 $1,125 $1,396 $1,309 $1,724 $1,613 $2,158 $1,962 $1,744 $1,641 $2,081Frazier $1,381 $1,104 $2,170 $2,450 $4,406 $6,169 $7,444 $8,221 $7,539 $5,780 $3,804 $2,959
26
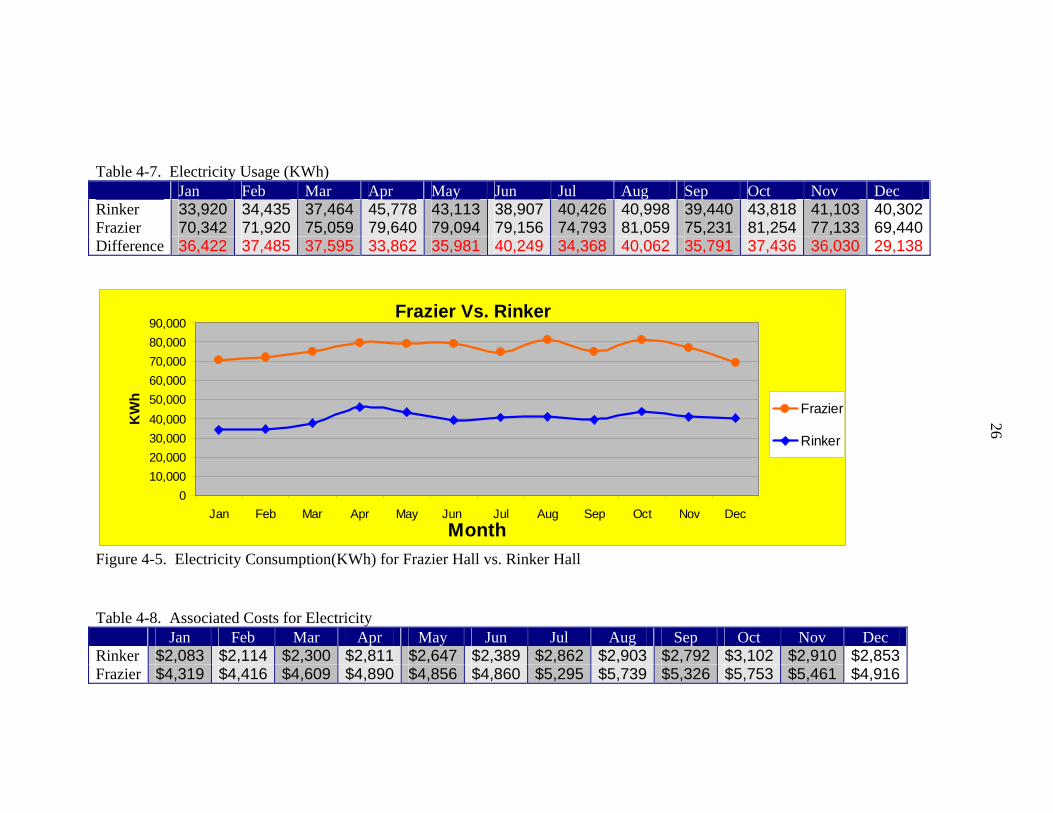
Table 4-7. Electricity Usage (KWh) Jan Feb Mar Apr May Jun Jul Aug Sep Oct Nov Dec Rinker 33,920 34,435 37,464 45,778 43,113 38,907 40,426 40,998 39,440 43,818 41,103 40,302Frazier 70,342 71,920 75,059 79,640 79,094 79,156 74,793 81,059 75,231 81,254 77,133 69,440Difference 36,422 37,485 37,595 33,862 35,981 40,249 34,368 40,062 35,791 37,436 36,030 29,138
Frazier Vs. Rinker
010,00020,00030,00040,00050,00060,00070,00080,00090,000
Jan Feb Mar Apr May Jun Jul Aug Sep Oct Nov DecMonth
KW
h
Frazier
Rinker
Figure 4-5. Electricity Consumption(KWh) for Frazier Hall vs. Rinker Hall
Table 4-8. Associated Costs for Electricity Jan Feb Mar Apr May Jun Jul Aug Sep Oct Nov Dec Rinker $2,083 $2,114 $2,300 $2,811 $2,647 $2,389 $2,862 $2,903 $2,792 $3,102 $2,910 $2,853Frazier $4,319 $4,416 $4,609 $4,890 $4,856 $4,860 $5,295 $5,739 $5,326 $5,753 $5,461 $4,916
27
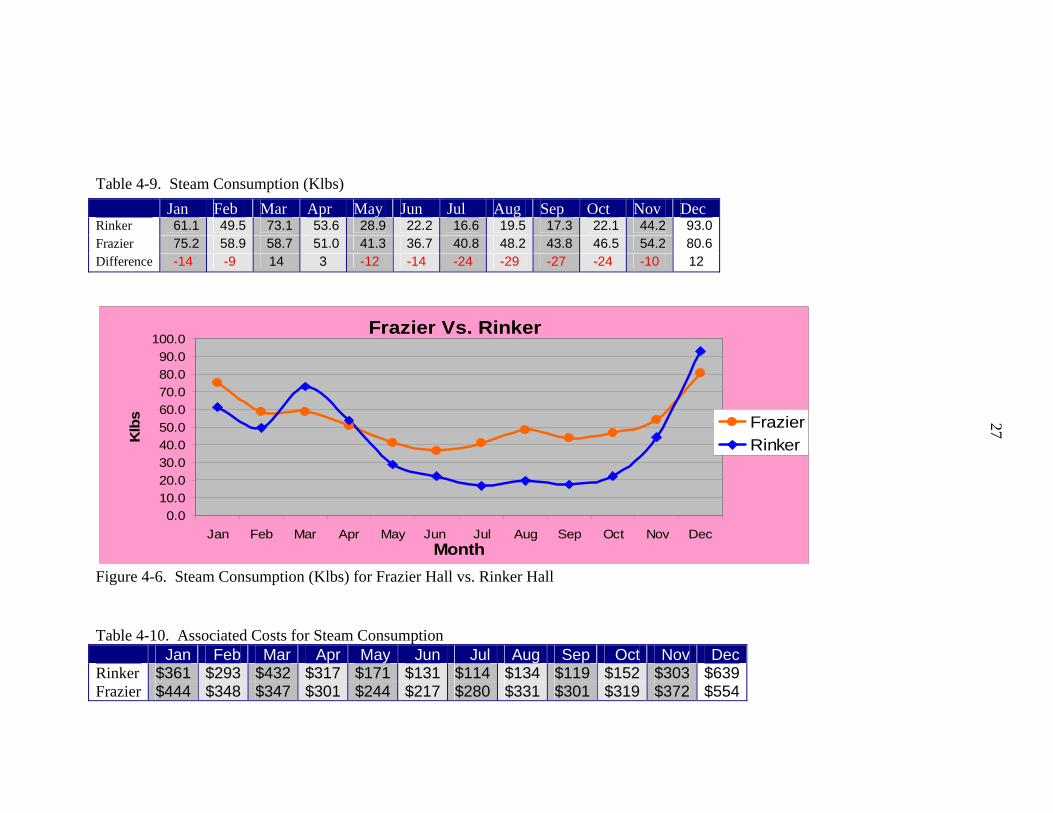
Table 4-9. Steam Consumption (Klbs)
Frazier Vs. Rinker
0.010.020.030.040.050.060.070.080.090.0
100.0
Jan Feb Mar Apr May Jun Jul Aug Sep Oct Nov DecMonth
Klb
s FrazierRinker
Figure 4-6. Steam Consumption (Klbs) for Frazier Hall vs. Rinker Hall
Table 4-10. Associated Costs for Steam Consumption Jan Feb Mar Apr May Jun Jul Aug Sep Oct Nov DecRinker $361 $293 $432 $317 $171 $131 $114 $134 $119 $152 $303 $639Frazier $444 $348 $347 $301 $244 $217 $280 $331 $301 $319 $372 $554
Jan Feb Mar Apr May Jun Jul Aug Sep Oct Nov Dec Rinker 61.1 49.5 73.1 53.6 28.9 22.2 16.6 19.5 17.3 22.1 44.2 93.0Frazier 75.2 58.9 58.7 51.0 41.3 36.7 40.8 48.2 43.8 46.5 54.2 80.6Difference -14 -9 14 3 -12 -14 -24 -29 -27 -24 -10 12

28
Table 4-11. Water Consumption (Kgal)
Frazier Vs. Rinker
0.050.0
100.0150.0200.0250.0300.0350.0400.0450.0
Jan Feb Mar Apr May Jun Jul Aug Sep Oct Nov DecMonth
Kga
l
Frazier
Rinker
Figure 4-7. Water Consumption (Kgal) for Frazier Hall vs. Rinker Hall
Table 4-12. Associated Costs for Water Consumption Jan Feb Mar Apr May Jun Jul Aug Sep Oct Nov DecRinker $7 $13 $8 $14 $6 $5 $5 $5 $5 $3 $8 $2Frazier $93 $198 $96 $396 $110 $110 $227 $230 $115 $172 $167 $0* *Due to meter malfunction, data not available
Jan Feb Mar Apr May Jun Jul Aug Sep Oct Nov Dec Rinker 7.4 13.2 7.9 14.2 6.1 5.1 5.3 5.0 4.7 2.7 8.3 1.9Frazier 93.9 200.0 96.9 400.0 110.7 111.1 226.8 229.6 115.4 172.2 166.7 0.0Difference -87 -187 -89 -386 -105 -106 -221 -225 -111 -170 -158 2

29
Table 4-13. Total Utility Consumption Costs
Frazier Rogers Vs. Rinker
$0$2,000$4,000$6,000$8,000
$10,000$12,000$14,000$16,000
Jan Feb Mar Apr May Jun Jul Aug Sep Oct Nov DecMonth
Cos
t
RinkerFrazier Rogers
Figure 4-8. Total Utility Cost for Frazier Hall vs. Rinker Hall
Jan Feb Mar Apr May Jun Jul Aug Sep Oct Nov Dec Rinker $3,986 $4,094 $3,865 $4,538 $4,133 $4,249 $4,594 $5,200 $4,878 $5,001 $4,863 $5,575
Frazier $6,237 $6,066 $7,221 $8,037 $9,616 $11,356 $13,246 $14,521 $13,282 $12,025 $9,804 $8,430
Difference $2,251 $1,972 $3,356 $3,499 $5,483 $7,107 $8,652 $9,321 $8,404 $7,024 $4,941 $2,854
30
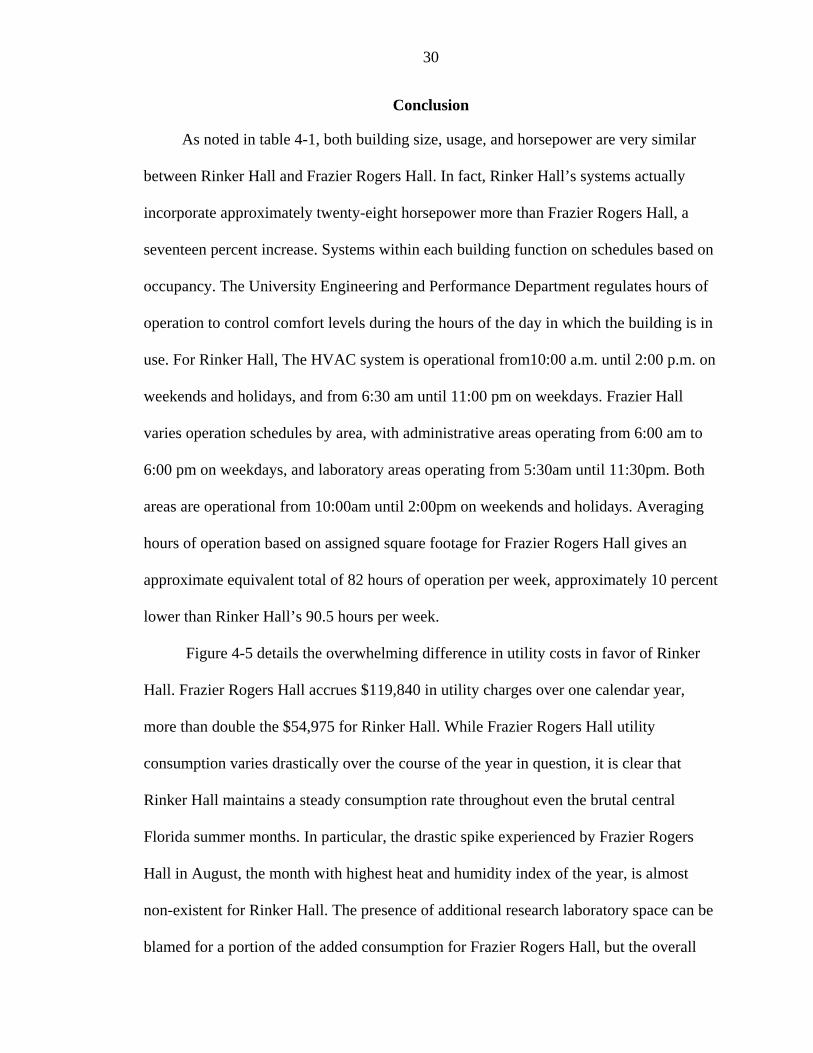
Conclusion
As noted in table 4-1, both building size, usage, and horsepower are very similar
between Rinker Hall and Frazier Rogers Hall. In fact, Rinker Hall’s systems actually
incorporate approximately twenty-eight horsepower more than Frazier Rogers Hall, a
seventeen percent increase. Systems within each building function on schedules based on
occupancy. The University Engineering and Performance Department regulates hours of
operation to control comfort levels during the hours of the day in which the building is in
use. For Rinker Hall, The HVAC system is operational from10:00 a.m. until 2:00 p.m. on
weekends and holidays, and from 6:30 am until 11:00 pm on weekdays. Frazier Hall
varies operation schedules by area, with administrative areas operating from 6:00 am to
6:00 pm on weekdays, and laboratory areas operating from 5:30am until 11:30pm. Both
areas are operational from 10:00am until 2:00pm on weekends and holidays. Averaging
hours of operation based on assigned square footage for Frazier Rogers Hall gives an
approximate equivalent total of 82 hours of operation per week, approximately 10 percent
lower than Rinker Hall’s 90.5 hours per week.
Figure 4-5 details the overwhelming difference in utility costs in favor of Rinker
Hall. Frazier Rogers Hall accrues $119,840 in utility charges over one calendar year,
more than double the $54,975 for Rinker Hall. While Frazier Rogers Hall utility
consumption varies drastically over the course of the year in question, it is clear that
Rinker Hall maintains a steady consumption rate throughout even the brutal central
Florida summer months. In particular, the drastic spike experienced by Frazier Rogers
Hall in August, the month with highest heat and humidity index of the year, is almost
non-existent for Rinker Hall. The presence of additional research laboratory space can be
blamed for a portion of the added consumption for Frazier Rogers Hall, but the overall

31
similarities in building size and systems lead to the high-performance design of Rinker
Hall accounting for the majority of the difference.

32
Table 4-14. Chilled Water Consumption (Kth)
Anderson Vs. Rinker
0.0
5.0
10.0
15.0
20.0
25.0
30.0
35.0
Jan Feb Mar Apr May Jun Jul Aug Sep Oct Nov DecMonth
Kth Anderson
Rinker
Figure 4-9. Chilled Water Consumption (Kth) for Anderson Hall vs. Rinker Hall
Table 4-15. Associated Costs for Chilled Water Jan Feb Mar Apr May Jun Jul Aug Sep Oct Nov Dec Rinker $1,535 $1,674 $1,125 $1,396 $1,309 $1,724 $1,613 $2,158 $1,962 $1,744 $1,641 $2,081Anderson $841 $1,102 $1,266 $1,576 $1,627 $2,177 $2,081 $2,561 $2,573 $2,302 $1,852 $1,448
Jan Feb Mar Apr May Jun Jul Aug Sep Oct Nov Dec Rinker 18.8 20.5 13.8 17.1 16.0 21.1 18.0 24.1 21.9 19.5 18.3 23.3Anderson 10.3 13.5 15.5 19.3 19.9 26.7 23.3 28.6 28.8 25.7 20.7 16.2Difference 8.5 7.0 -1.7 -2.2 -3.9 -5.6 -5.2 -4.5 -6.8 -6.2 -2.4 7.1

33
Table 4-16. Electricity Consumption(Kwh)
Anderson Vs. Rinker
05,000
10,00015,00020,00025,00030,00035,00040,00045,00050,000
Jan Feb Mar Apr May Jun Jul Aug Sep Oct Nov DecMonth
KW
h
Anderson
Rinker
Figure 4-10. Electricity Consumption(KWh) for Anderson Hall vs. Rinker Hall
Table 4-17. Associated Costs for Electricity Jan Feb Mar Apr May Jun Jul Aug Sep Oct Nov Dec Rinker $2,083 $2,114 $2,300 $2,811 $2,647 $2,389 $2,862 $2,903 $2,792 $3,102 $2,910 $2,853Anderson $2,121 $2,123 $2,162 $2,233 $2,121 $2,172 $2,565 $2,916 $2,601 $2,772 $2,754 $2,428
Jan Feb Mar Apr May Jun Jul Aug Sep Oct Nov Dec Rinker 33,920 34,435 37,464 45,778 43,113 38,907 40,426 40,998 39,440 43,818 41,103 40,302 Anderson 34,543 34,580 35,216 36,364 34,543 35,378 36,236 41,190 36,730 39,152 38,897 34,289 Difference -623 -145 2,248 9,414 8,570 3,529 4,190 -192 2,709 4,666 2,207 6,013

34
Table 4-18. Steam Consumption (Klbs)
Anderson Vs. Rinker
0.0
20.0
40.0
60.0
80.0
100.0
120.0
Jan Feb Mar Apr May Jun Jul Aug Sep Oct Nov DecMonth
Klb
s AndersonRinker
Figure 4-11. Steam Consumption (Klbs) for Anderson Hall vs. Rinker Hall
Table 4-19. Associated Costs for Steam Consumption Jan Feb Mar Apr May Jun Jul Aug Sep Oct Nov Dec Rinker $361 $293 $432 $317 $171 $131 $114 $134 $119 $152 $303 $639Anderson $489 $468 $308 $209 $98 $85 $77 $115 $103 $140 $199 $727
Jan Feb Mar Apr May Jun Jul Aug Sep Oct Nov Dec Rinker 61.1 49.5 73.1 53.6 28.9 22.2 16.6 19.5 17.3 22.1 44.2 93.0Anderson 82.7 79.2 52.0 35.4 16.6 14.4 11.3 16.7 15.0 20.4 29.0 105.8Difference -22 -30 21 18 12 8 5 3 2 2 15 -13

35
Table 4-20. Water Consumption (Kgal)
Anderson Vs. Rinker
0.010.020.030.040.050.060.070.080.090.0
100.0
Jan Feb Mar Apr May Jun Jul Aug Sep Oct Nov DecMonth
Kga
l
Anderson
Rinker
Figure 4-12. Water Consumption (Kgal) for Anderson Hall vs. Rinker Hall
Table 4-21. Associated Costs for Water Consumption Jan Feb Mar Apr May Jun Jul Aug Sep Oct Nov Dec Rinker $7 $13 $8 $14 $6 $5 $5 $5 $5 $3 $8 $2Anderson $43 $94 $46 $50 $45 $64 $55 $58 $52 $70 $56 $44
Jan Feb Mar Apr May Jun Jul Aug Sep Oct Nov Dec Rinker 7.4 13.2 7.9 14.2 6.1 5.1 5.3 5.0 4.7 2.7 8.3 1.9Anderson 43.4 94.9 46.1 50.5 45.6 64.6 55.1 58.5 52.3 70.1 55.7 44.5Difference -36 -82 -38 -36 -40 -59 -50 -54 -48 -67 -47 -43

36
Table 4-22. Total Utility Consumption Costs for Rinker Hall and Anderson Hall
Anderson Vs. Rinker
$0
$1,000
$2,000
$3,000
$4,000
$5,000
$6,000
Jan Feb Mar Apr May Jun Jul Aug Sep Oct Nov DecMonth
Cos
t
RinkerAnderson
Figure 4-13. Total Annual Utility Cost for Anderson Hall vs. Rinker Hall
Jan Feb Mar Apr May Jun Jul Aug Sep Oct Nov Dec Rinker $3,986 $4,094 $3,865 $4,538 $4,133 $4,249 $4,594 $5,200 $4,878 $5,001 $4,863 $5,575 Anderson $3,494 $3,788 $3,781 $4,068 $3,891 $4,499 $4,779 $5,650 $5,329 $5,285 $4,860 $4,646 Difference $492 $306 $84 $470 $242 -$250 -$184 -$451 -$451 -$284 $2 $929

37
Conclusion
At first glance, one may be surprised to find that at $54,070 Anderson Hall’s total
cost of utilities was nearly two percent lower than Rinker Hall’s $54,975 for the year
2004. However, several key determining factors must be taken into account in order to
accurately qualify the numbers presented figure 4-13. First is total building horsepower.
The two structures are within three percent of one another in total building square
footage, while the building horsepower for Rinker Hall is double that of Anderson Hall.
Similar to the above comparison with Frazier Hall, these results show that Rinker hall
performs considerably more efficiently based on horsepower levels than does Anderson
Hall. Second is total classroom area and student traffic. Anderson Hall houses eight
general purpose classrooms, while Rinker Hall contains six classrooms, six student
laboratories, and one large auditorium.
As noted above, Rinker Hall operates from 6:30am until 11:00pm, on weekdays
while Anderson is operational 7:00am until 8:00pm. Both buildings are operational for
four hours per day on weekends and holidays. Therefore, Anderson Hall’s 73 hours of
operation per week is nearly 25 percent lower than Rinker’s 90.5 hours and should more
than offset the two percent difference in annual utilities between the two buildings. One
should also note that during the harsh Florida summer months of June-September, Rinker
Hall ran more efficiently than Anderson despite the extensively larger systems at work
within the structure.
Summary Analysis
The above data for each comparison was consolidated into “total energy values”
and is presented in table 4-23

38
Table 4-23. Total Annual Values by Square Footage Cost BTU (all) Gal. KWh. (elec.)Rinker Hall $1.19 80,761.8 1.1 8.0 Frazier Rogers $2.93 148,689.8 28.6 13.0 Anderson Hall $1.18 77,350.1 10.4 7.0
“Cost” represents the total cost for Utility consumption divided by total building
square footage. “BTU” calculations take into account the total annual energy
consumption in BTU’s including Chilled Water, Steam, and Electricity. “Gal.” represents
total gallons of potable water consumed annually divided by building square footage. The
“KWh” column represents the annual electrical consumption per square foot with
electricity being the only resource taken into account. In consistency with earlier results,
Frazier Rogers hall is highly inefficient in comparison to the other two structures, and
Anderson Hall narrowly edges Rinker Hall by $.01 per square foot.
By modifying to take into account the hours of operation differences between the 3
structures, an approximation can be made on a theoretically more accurate level.
However, results are merely theoretical as the added hours to Anderson Hall and Frazier
Rogers Hall would not be during peak building load hours. Therefore, Table 4-24 is
adjusted to the average hours of operation per week for Rinker Hall, 90.5.
Table 4-24. Total Annual Values by Square Footage Adjusted for Hours of Operation Cost BTU (all) Gal. KWh. (elec.)Rinker Hall $1.19 80,761.8 1.1 8.0 Frazier Rogers $3.07 156,124.3 30.3 13.7 Anderson Hall $1.48 96,687.6 13 8.75
As is visible in figure 4-24, this theoretical comparison skews results
heavily in Rinker Hall’s favor. Anderson Hall operates on a uniform schedule and was
adjusted directly by a 25% increase in consumption to match Rinker Hall’s hours of
operation. Frazier Rogers Hall was modified based on square footages of usage type, with

39
an overall average increase in operation of approximately 5%. Although these values
cannot be held as factual or completely accurate, they serve as an effective tool for
displaying the added efficiency of Rinker Hall’s operations.
Life-Cycle Cost Analysis
In order to analyze the above data, a life-cycle costing system was used to
document predicted future expenses over a twenty year projected life and value them in
terms of current dollar amounts. In order to do so, recommendations were taken from the
National Institute of Standards and Technology Handbook #135 “Life-Cycle Costing
Manual for the Federal Energy Management Program.” An actual discount rate of 3%
was applied based on Department Of Energy(DOE) recommendations, and adjusted for
long-term inflation of 1.75%. The resulting nominal discount rate applied was equal to
4.8%. Individual resource prices were subjected to an averaged price escalation rate of
two percent per year over the twenty year life cycle. For each of the two comparisons,
Rinker Hall was presented as the alternative, with the sustainable design premiums
shown as initial costs, while both Anderson and Frazier Rogers Hall carried zero initial
cost due to their conventional code compliant designs. Presented in Microsoft Excel
format, results are shown in figures 4-14 and 4-15 below.

40
Sustainable Design Comparison
Subject: Utility ConsumptionDescription:Project Life Cycle = 20 YearsDiscount Rate = 4.80% Year Completed: 2001 Year Completed: 2002Present Time = Jan-05 Square Footage 53,543 Square Footage 46,530
INITIAL COSTS QuantityUM Unit Price Est. PW Est. PWConstruction CostsA. Daylighting Premium 1 LS $0.00 0 0 370,000 370,000B. Energy Premium 1 LS $0.00 0 0 233,000 233,000C. Water Conservation 1 LS $0.00 0 0 52,500 52,500D. ______________________ _____________ $0.00 __________ 0 __________ 0Total Initial Cost 0 655,500Initial Cost PW Savings (Compared to Alt. 1) (655,500)
ANNUAL COSTSDescription Escl. % PWA
A. Chilled Water 2.000% 15.234 $53,425 $813,889 $19,692 $299,992B. Water 2.000% 15.234 $2,087 31,794 $81 1,234C. Steam 2.000% 15.234 $4,060 61,851 $3,166 48,232D. Electricity 2.000% 15.234 $60,441 920,772 $31,767 483,946E. Waste Water Fees 2.000% 15.234 $3,965 60,408 $154 2,345Total Annual Costs (Present Worth) $1,888,714 $835,748
Total Life Cycle Costs (Present Worth) $1,888,714 $1,491,248Life Cycle Savings (Compared to Alt. 1) $397,466
Discounted Payback (Compared to Alt. 1) PP Factor 11.10 YearsTotal Life Cycle Costs (Annualized) 0.0789 148,996 Per Year 117,641 Per Year
**University Facilities Management does not charge Wastewater to buildings; however, UF Physical Plant division has established a wastwater processing fee of $1.90/kgal
Rinker HallFrazier-Rogers Hall
Figure 4-14. Life-Cycle Cost Analysis for Rinker Hall vs. Frazier Rogers Hall

41
Figure 4-14 shows results leaning heavily in favor of Rinker Hall. With the present
worth of annual costs of $835,748, Rinker operates at approximately forty-four percent of
the total cost of Frazier Rogers Hall’s $1,888,714 (in current dollars). As shown above, in
direct comparison with Frazier Rogers Hall, the life cycle model predicts that by simply
accounting for resource savings, a payback for the Rinker Hall sustainable design
premium can be realized in just over eleven years. Over the twenty year projected life
represented above, Rinker Hall will not only payback the additional up front expense, but
will generate a “savings” of $397,466. Using the ratio of total (of annual) operations
savings versus original cost, the Savings to Investment Ratio (S.I.R) for the above
comparison is calculated at 1.606. In terms of costs per square footage over the 20 year
life, utility costs for Rinker Hall are $17.96/sf, while Frazier Rogers Hall costs $35.27/sf.
Although there is considerably more research laboratory space in Frazier Rogers Hall, its
total energy consumption should be considered similar to that of an ASHREA 90.1
compliant version of Rinker Hall. Therefore, during the period between realized pay-back
in year eleven and the end of the twenty year life, Rinker Hall will be operating at a profit
in comparison to Frazier Rogers Hall.
42
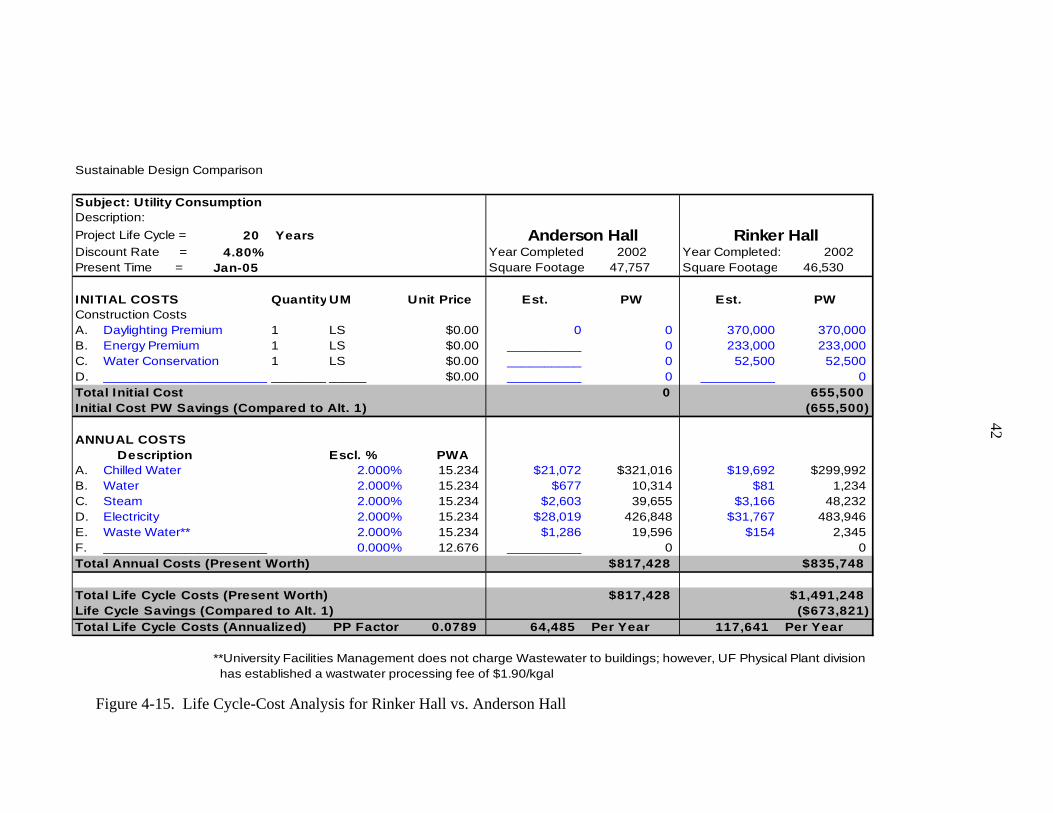
Sustainable Design Comparison
Subject: Utility ConsumptionDescription:Project Life Cycle = 20 YearsDiscount Rate = 4.80% Year Completed 2002 Year Completed: 2002Present Time = Jan-05 Square Footage 47,757 Square Footage 46,530
INITIAL COSTS QuantityUM Unit Price Est. PW Est. PWConstruction CostsA. Daylighting Premium 1 LS $0.00 0 0 370,000 370,000B. Energy Premium 1 LS $0.00 __________ 0 233,000 233,000C. Water Conservation 1 LS $0.00 __________ 0 52,500 52,500D. ______________________ _____________ $0.00 __________ 0 __________ 0Total Initial Cost 0 655,500Initial Cost PW Savings (Compared to Alt. 1) (655,500)
ANNUAL COSTSDescription Escl. % PWA
A. Chilled Water 2.000% 15.234 $21,072 $321,016 $19,692 $299,992B. Water 2.000% 15.234 $677 10,314 $81 1,234C. Steam 2.000% 15.234 $2,603 39,655 $3,166 48,232D. Electricity 2.000% 15.234 $28,019 426,848 $31,767 483,946E. Waste Water** 2.000% 15.234 $1,286 19,596 $154 2,345F. ______________________ 0.000% 12.676 __________ 0 0Total Annual Costs (Present Worth) $817,428 $835,748
Total Life Cycle Costs (Present Worth) $817,428 $1,491,248Life Cycle Savings (Compared to Alt. 1) ($673,821)Total Life Cycle Costs (Annualized) PP Factor 0.0789 64,485 Per Year 117,641 Per Year
**University Facilities Management does not charge Wastewater to buildings; however, UF Physical Plant division has established a wastwater processing fee of $1.90/kgal
Rinker HallAnderson Hall
Figure 4-15. Life Cycle-Cost Analysis for Rinker Hall vs. Anderson Hall

43
Anderson Hall is predominately an administration building which caters to a
smaller population traffic level than Rinker Hall, and contains no research or teaching
laboratory space. As shown in Table 4-1, total building horsepower for Anderson hall is
approximately half of the peak ratings for Rinker. These qualifications give insight into
the results shown in Figure 4-15. Over the 20 year life-cycle presented above, Anderson
Hall utility costs total out to $817,428, approximately 2.2% below Rinker Hall’s
$835,748. Due to this difference, expected payback period cannot be calculated as the
model would never make up for the initial up-front costs and the gap would increase
annually. The S.I.R. for the above comparison is -.028, showing a theoretical negative
return on investment. When related to square footage, Anderson Hall costs are equal to
$17.12/sf over the twenty year life span, $.84/sf lower than that of Rinker Hall. In
following traditional LCC methods of thought, Anderson Hall would prove to be the
more cost efficient building, however the above qualifications still lend credibility to the
design efforts present in Rinker Hall. Results are still quite profound and in favor of
Rinker when the complete facts behind the complexity of building systems are taken into
account.

44
Figure 4-16. Graphical Display of Life-Cycle Cost Analysis
The total Life-Cycle cost for resources in Frazier Rogers Hall easily exceeds the
combination of the cost premiums and the annual operational costs for Rinker Hall. When
viewing the bar representation of Anderson Hall, resource costs appear to be almost equal
to the graphical display for Rinker Hall.
45
CHAPTER 5 CONCLUSION
Sustainable design for Green building is without a doubt the way of the future.
High performance structures and systems are gaining momentum with each successive
implementation. This study showed an example of how clearly and easily the positive
results of sustainable design efforts can be realized. The brief existence of the structures
studied in the preceding pages allows for a larger than normal margin of error for the
realized results due to “quirks” not having been completely worked out of the systems in
question, especially in the more complex Rinker Hall.
At this point, outlying data cannot yet be determined due to lack of data population
size; however, portions of the collected building consumption data show potential for
outlying points, such as unexplained spikes in chilled water consumption during the
coldest months of the year, or highly fluctuating steam consumption. These irregularities,
as well as the cost similarities between Rinker Hall and Anderson Hall give rise to many
assumptions; first and foremost being the existence of minor flaws in the design of
Rinker Hall. As is often the case in commercial construction, despite the impressive
performance of the building, the mechanical system in Rinker Hall may in fact be over
designed. For example, why does Rinker Hall require a 50% increase in available
building horsepower over the equally sized Anderson Hall? Perhaps a lesser powered
structure could still produce the same efficient output at an even lower cost.
In Reference to Hal Varien’s criteria for an effective model, 1. The model must
address who makes the choices involved: Perspective owners are making the decision as

46
to whether or not they will assume the added construction costs to achieve a sustainable
design. 2. What constraints do the decision makers face? Again, decision makers must
determine if long-run cost savings will outweigh the initial up-front investment in
sustainability. 3. What interaction exists? Designers with a vested interest in
sustainability should be on board from the beginning of the design phase in order to
ensure the most efficient usage of green building technologies and strategies. 4. What
information is being processed and what is being predicted? At the design phase,
theoretical values are being processed to predict life-cycle savings. In the case of the
Rinker Hall model above, actual annual costs are used to provide evidence that the
savings do exist. 5. What adjusts to assure consistency? Adjustments for building
horsepower, and total hours of operation can be made in order to allow for even more
consistency.
The stated hypothesis of the thesis poses the question of whether or not hard cost
data on resource consumption can be used to accurately evaluate green building
performance. Through taking into account all applicable costs and modification factors to
establish a methodology for comparison, the previous study showed that hard cost data
can in fact be a reliable predictor of building performance. The fact that hard cost data
alone nearly pays back the up-front expenditures before taking into account other factors
such as soft cost savings, community/environmental implications, and others proves that
substantial improvement in resource consumption hard costs are an effective display of
the greenness of a high performance building.
Through conducting the literature review, it became apparent that there is a lack of
extensive data on actual performance for sustainable, high performance buildings. This is

47
due not only to the lack of available data, but also to lack of known methods for both
accumulation and analysis. The previous study merely took a conservative look into the
financial gains of sustainable construction efforts for higher educational facilities under
one particular set of conditions. By obtaining and evaluating resource consumption data
and related costs, quantifiable evidence was produced to help justify the realized gain
from sustainable design. These resource costs or “hard-costs” are easy to obtain, and
provide for simple direct comparisons between sustainable and conventional structures.
In order to create a true evaluation of the positive effects of sustainable design initiatives,
less tangible, or “soft cost” data must also be included.
These costs include such items as indoor environmental quality, consumer
satisfaction, student/faculty efficiency, and several others. These types of data are
difficult to obtain, and even more difficult to assign direct costs/savings. Further research
into methods of quantifying soft cost factors for sustainable construction will pave the
way for production of substantially more comprehensive economic performance models.
Hard cost data alone has proven to be very convincing when combined with theoretical
values for soft cost data. True results for soft cost savings will prove once and for all the
necessity of sustainable efforts in the built environment.
In order to carry out additional studies regarding similar data, or expanding upon
the above data, several courses of action can be recommended. First, the organizer of the
study should establish a list of contacts from the start. These contacts should cover every
aspect of the study. In the above case it was necessary to have contacts at several
departments within the University of Florida, as well as within the actual field of study.
Secondly, upon collecting data, use digression as to which are relevant to the particular

48
analysis. For example, any data relating to soft costs, or aesthetics for the structures in the
preceding study was discounted from the results as it had no impact on the variables of
the study. Finally, organizers of future studies must understand that historical data
available on similar topics is not regulated, and may very well be skewed in favor of the
intentions of the study. As shown by table 4-24, theoretical numbers can quickly sway
results in either direction.

49
LIST OF REFERENCES
Building Energy Codes Program US Department of Energy: Energy Efficiency and Renewable Energy http://www.energycodes.gov/comcheck/89_compliance_manual.stm
Fuller PhD., Sieglinde K. “Economic Analysis and Green Building” Green Building: Project Planning and Cost Estimating: A Practical Guide for Constructing Sustainable Buildings Editors: Andrea Keenan and Danielle Georges Published: Kingston, Mass. c2002
Fuller, Sieglinde K., Peterson, Stephen R. National Institute of Standards and Technology Handbook #135 1995 Edition Life-Cycle Costing Manual for the Federal Energy Management Program United States Department of Commerce, February 1996
GETTING TO GREEN: How to Get LEED Certified “Gold Level” M. E. Rinker, Sr. Hall Rinker School of Building Construction, University of Florida
Gottfried, David “A Blueprint for Green Building Economics” Found in Industry and Environment v26 n 2-3 April/September 2003 p 20-21
Kats, Gregory H. Green Building Costs and Financial Benefits Editors: Andrea Keenan and Danielle Georges Published: Kingston, Mass. c2002 Published for Massachusetts Technology Collaborative, 2003. Available online at the Capital E website, http://www.cap-e.com/
Kibert, Charles J. 2005. Sustainable Construction: Green Building Design and Delivery, New York: John Wiley & Sons.
LEED: Building Green. Everyone Profits. Copyright 2005. US Green Building Council www.USGBC.org/displaypage.aspx?categoryID=19
Lippiat, Barbara C. “Evaluating Products Over their Life-Cycle” Found in Green Building: Project Planning and Cost Estimating: A Practical Guide for Constructing Sustainable Buildings Editors: Andrea Keenan and Danielle Georges Published: Kingston, Mass. c2002

50
“Making the Business Case for High Performance Green Buildings”, U.S. Green Building Council(USGBC). 2003. Available for download at http://www.usgbc.org/
Macaluso, Joseph CCC. “Economic Incentives and Funding Sources” Found in Green Building: Project Planning and Cost Estimating: A Practical Guide for Constructing Sustainable Buildings Editors: Andrea Keenan and Danielle Georges Published: Kingston, Mass. c2002
McElroy, Lori “Technical Factors in the Design of Commercial Buildings” Sustainable Architecture: Second Edition Edwards, Brian Published: Architectural Press, 1999
Pitts, Adrian Planning and Design for Sustainability and Profit Published: Architectual Press 2004.
R.S.Means Online Construction Dictionary http://rsmeans.com/dictionary/index.asp 2004 Reed Business Information
Shultz. Laura L, Rushing, Amy S., Fuller, Sieglinde K. Annual Supplement to NIST Handbook #135 Energy Price Indices and Discount Factors for Life-Cycle Cost Analysis April-2004 United States Department of Commerce, February 2004
Wyatt, David J. “Look Before Leaping into Green Design” Found in Construction Specifier v57 n 6 June 2004 p32-34.

51
BIOGRAPHICAL SKETCH
Eric Meister received a Bachelor of Science in Business Administration (with a
concentration in management) from the Warrington College of Business Administration
at the University of Florida in Spring 2003. His interest in environmentally sustainable
design was spawned through course work at the University of Florida taken in effort to
earn his Master of Science in Building Construction.
.