using gis as a marketing decision support system to help amari
TRANSCRIPT
________________________________________________________________________________________
Johnson, Jacob B. 2010. Using GIS as a Marketing Decision Support System to Help Amari Studios Locate New
Customers and Effectively Direct Marketing and Advertising Efforts. Volume 12, Papers in Resource Analysis. 13
pp. Saint Mary’s University of Minnesota University Central Services Press. Winona, MN. Retrieved (date)
http://www.gis.smumn.edu.
Using GIS as a Marketing Decision Support System to Help Amari Studios Locate New
Customers and Effectively Direct Marketing and Advertising Efforts
Jacob B. Johnson1, 2
1Department of Resource Analysis, Saint Mary’s University of Minnesota, Winona,
MN 55987; 2Amari Studios, Sioux Falls, SD 57106
Keywords: GIS, ArcGIS, Spatial Analyst, Census Tract, Socioeconomic, Demographics, MKISS,
Block Group, Raster Data, Market Analysis, Market Research, Marketing, Raster Calculator,
Direct Marketing
Abstract
Amari Studios is a small yet very successful company. Currently the company gains customers
through word of mouth advertising, website promotion, and limited radio advertising. This has
worked well for Amari Studios and has allowed it to establish itself in the Sioux Falls, South
Dakota USA market. However, management believes it is ready to increase business by
enlarging its client base. Before Amari Studios begins searching for new customers, it must
define its customer profile and then geographically locate those consumer groups. A customer
profile defines the demographic and socioeconomic characteristics of a business’s target
customer segment (Sliwinski, 2002). For a business to grow, a business needs to know what type
of customer it serves and where to find more of them. This project analyzed the city’s census
data to locate census blocks containing high percentages of potential customers best-fitting
Amari Studios customer profile. These criteria were integrated into a GIS model. Once
identified, a subset of 100 of the best “ideal” census block addresses along with another 100
addresses from another census block not selected as “ideal” were used in a direct mailing
marketing campaign to determine the level of customer interest and validate the GIS model.
Introduction
Amari Studios is a guitar instruction
business located in southeastern Sioux Falls,
South Dakota. Historically, the business has
been very successful and is one of the
leading guitar lesson studios in southeastern
South Dakota. This success has increased
the company’s desire to enlarge its client
base and increase business.
The company is small (several
employees), young, and is in its
entrepreneurial stages and has yet to develop
a consistent and focused marketing/
advertising campaign.
As a result, understanding the
demographic and socioeconomic
characteristics of a market is an essential
part of marketing and advertising for long
term development and stability. Aaker,
Kumar, and Day (2001) state obtaining
information on consumer needs and
gathering marketing intelligence is of the
utmost importance if a company wishes to
satisfy customer needs effectively. Demand
for Amari Studios business services in the
Sioux Falls area continues to grow.
However, market intelligence is needed to
effectively expand the customer base. With
proper access to data, GIS technology can be
used to quickly and effectively breakdown
and analyze a market. Hess, Rubin, and
2
West (2004) believe GIS provides value for
marketing decision making through two
mechanisms: (1) GIS provides a way to
analyze internal or external marketing
intelligence data in a format particularly
suited to marketing decision making
departments; and (2) GIS provides the
ability to integrate both internal and external
marketing intelligence data to greatly
improve the effectiveness of these marketing
decisions. GIS not only increases market
consciousness, but facilitates decisions
based on newly acquired market
information.
Market research is a critical part of a
marketing intelligence system. It improves
management decision making by providing
relevant, accurate, and timely (RAT)
information (Marketing Research, 2010).
Every decision possesses unique needs for
information, and relevant strategies can be
developed based on the information
gathered though marketing research in
action (Aaker et al., 2001).
The goal of this research was to
analyze demographics to locate census
blocks having the highest concentration/
percentage of Amari Studios’ defined target
market. Hess et al. (2004) explains how
important it is for a business to have a
marketing information system (MKIS) in
place and how GIS can be used as an MKIS
to fundamentally alter the cost and
effectiveness of marketing decision making.
An analysis of US census data, Amari
Studios’ customer data, and other scholarly
material revealed there is substantial
business potential in Amari Studios’ current
service area and that they may be able to
reduce costs and reach a more ideal
customer base by targeting those that live
outside their current service area.
Study Area
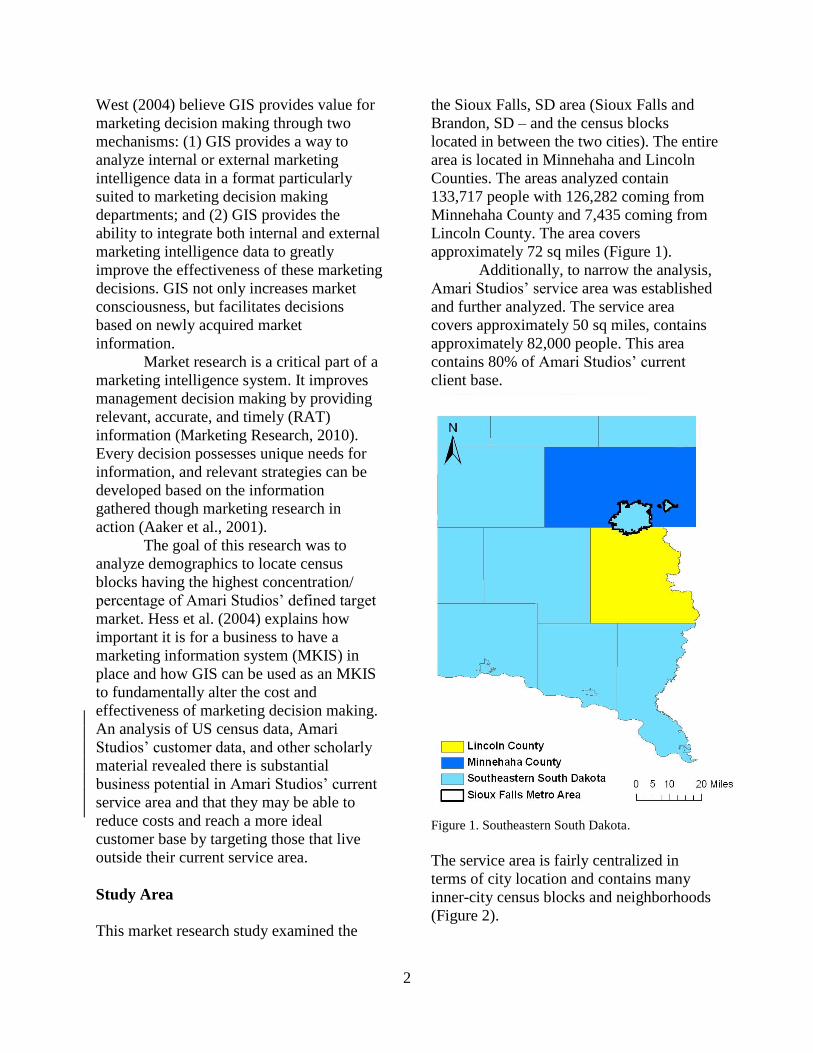
This market research study examined the
the Sioux Falls, SD area (Sioux Falls and
Brandon, SD – and the census blocks
located in between the two cities). The entire
area is located in Minnehaha and Lincoln
Counties. The areas analyzed contain
133,717 people with 126,282 coming from
Minnehaha County and 7,435 coming from
Lincoln County. The area covers
approximately 72 sq miles (Figure 1).
Additionally, to narrow the analysis,
Amari Studios’ service area was established
and further analyzed. The service area
covers approximately 50 sq miles, contains
approximately 82,000 people. This area
contains 80% of Amari Studios’ current
client base.
Figure 1. Southeastern South Dakota.
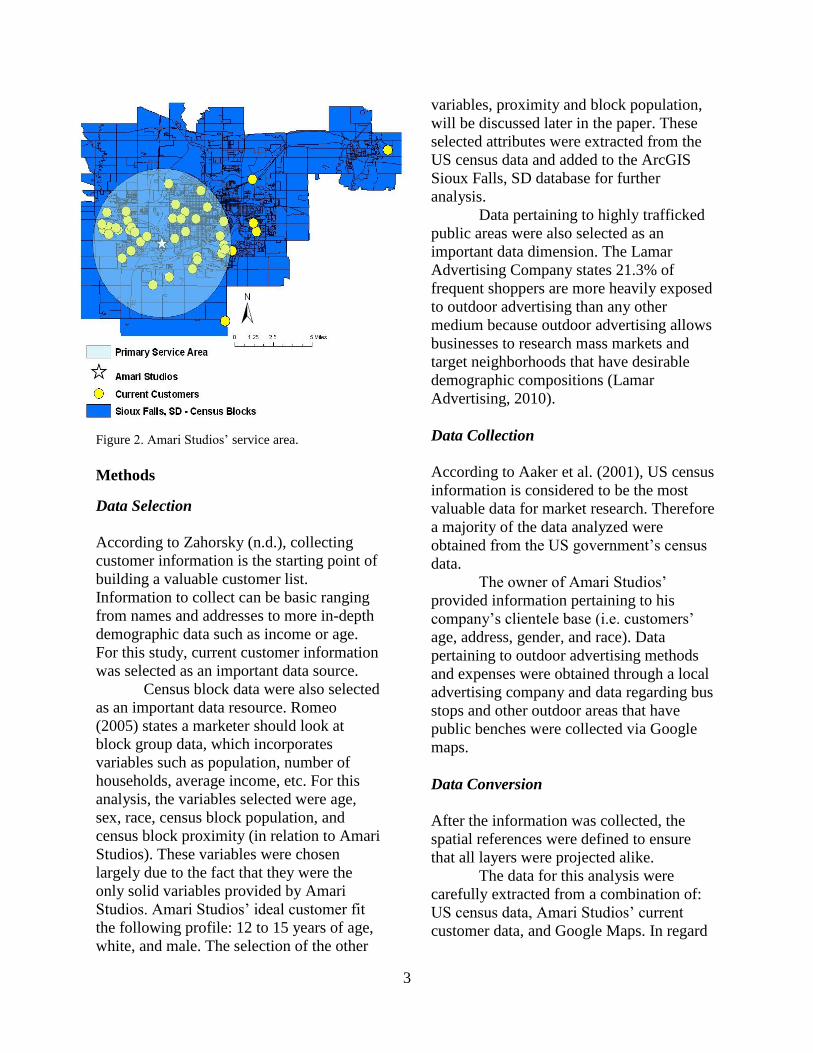
The service area is fairly centralized in
terms of city location and contains many
inner-city census blocks and neighborhoods
(Figure 2).
3
Figure 2. Amari Studios’ service area.
Methods
Data Selection
According to Zahorsky (n.d.), collecting
customer information is the starting point of
building a valuable customer list.
Information to collect can be basic ranging
from names and addresses to more in-depth
demographic data such as income or age.
For this study, current customer information
was selected as an important data source.
Census block data were also selected
as an important data resource. Romeo
(2005) states a marketer should look at
block group data, which incorporates
variables such as population, number of
households, average income, etc. For this
analysis, the variables selected were age,
sex, race, census block population, and
census block proximity (in relation to Amari
Studios). These variables were chosen
largely due to the fact that they were the
only solid variables provided by Amari
Studios. Amari Studios’ ideal customer fit
the following profile: 12 to 15 years of age,
white, and male. The selection of the other
variables, proximity and block population,
will be discussed later in the paper. These
selected attributes were extracted from the
US census data and added to the ArcGIS
Sioux Falls, SD database for further
analysis.
Data pertaining to highly trafficked
public areas were also selected as an
important data dimension. The Lamar
Advertising Company states 21.3% of
frequent shoppers are more heavily exposed
to outdoor advertising than any other
medium because outdoor advertising allows
businesses to research mass markets and
target neighborhoods that have desirable
demographic compositions (Lamar
Advertising, 2010).
Data Collection
According to Aaker et al. (2001), US census
information is considered to be the most
valuable data for market research. Therefore
a majority of the data analyzed were
obtained from the US government’s census
data.
The owner of Amari Studios’
provided information pertaining to his
company’s clientele base (i.e. customers’
age, address, gender, and race). Data
pertaining to outdoor advertising methods
and expenses were obtained through a local
advertising company and data regarding bus
stops and other outdoor areas that have
public benches were collected via Google
maps.
Data Conversion
After the information was collected, the
spatial references were defined to ensure
that all layers were projected alike.
The data for this analysis were
carefully extracted from a combination of:
US census data, Amari Studios’ current
customer data, and Google Maps. In regard
4
to the US census data, the Sioux Falls map
(displayed in ArcMap) was populated with
census block group information. Minnehaha
and Lincoln County census blocks that fell
within the Sioux Falls metro area were
selected and converted into a single layer.
This allowed for a more effective and
focused market analysis and many of the
large desolate census blocks were removed.
Attributes of this “Metro Area” layer, such
as race, sex, population, and age were
merged with the Sioux Falls shapefiles
based on the common field of STFID. Each
map was temporarily color coded to reveal
the quantity of the desired attribute in each
census block and then converted into raster
format. This step was repeated until all of
the desired attributes had been isolated and
converted into raster form.
Point shapefiles were placed at
addresses that matched Amari Studios’
current customer address list. Establishing
current customer proximities allowed for the
creation of a service area. Once the service
area was defined, a buffer around Amari
Studios was created and then converted into
a raster as well.
Data Manipulation
As stated by McDaniel (2010), “a market
analysis should follow a programmatic
technique and answer questions such as: Has
the target market changed? How? Does the
market exhibit any new segmentation
opportunities? Do some segments appear to
be more likely candidates than others for the
firm’s marketing efforts? What new product
or service opportunities lie in the various
segments?” Programmatic research helps
analyze marketing options through market
segmentation, market opportunity analysis,
and consumer attitude/ product usage studies
(Aaker et al., 2001).
One of the goals of this study was to
obtain and analyze market information and
specifically focus on new segmentation
opportunities by initiating a direct mailing
campaign. Since Amari Studios is a
relatively new company, and since no
market research has been conducted prior,
the programmatic research of this study
followed a step-by-step process to find new
business opportunities.
After the data was selected,
collected, and converted, it was subjected to
a series of spatial analysis processes using
the raster calculator. The raster data from the
“Metro Area” layer was grouped into five
different classification rankings. These
rankings included: total census block
population, total number of Caucasian
inhabitants per census block, total number of
inhabitants under the age of 5 (taking into
consideration that the information is ten
years old), total number of males per census
block, and lastly, blocks located within the
current service area. These raster data sets
were added with the raster calculator
creating a suitability map that ranked each
census block based on the desired attributes.
In other words, the final output of this
process displayed a map that ranked each
block from “high enrollment potential” to
“low enrollment potential.” Areas of “high
enrollment potential” had a relatively large
number of young, white males that lived
within the service area and areas of low
enrollment potential lacked the attributes
that Amari Studios was looking for. The
process was repeated once more, this time
for the whole study area. This revealed all
the Sioux Falls’ area census blocks
containing ideal customers.
With the “high enrollment potential”
blocks highlighted, the next step was to
select the blocks that had above average
numbers and create a map that displayed the
areas of high enrollment potential. These
areas were then converted into their own
layer and further analyzed. Once the above
average layer was created, it was then placed
under the nearly transparent “Metro Area”
5
layer so that the census block information
could be selected and read.
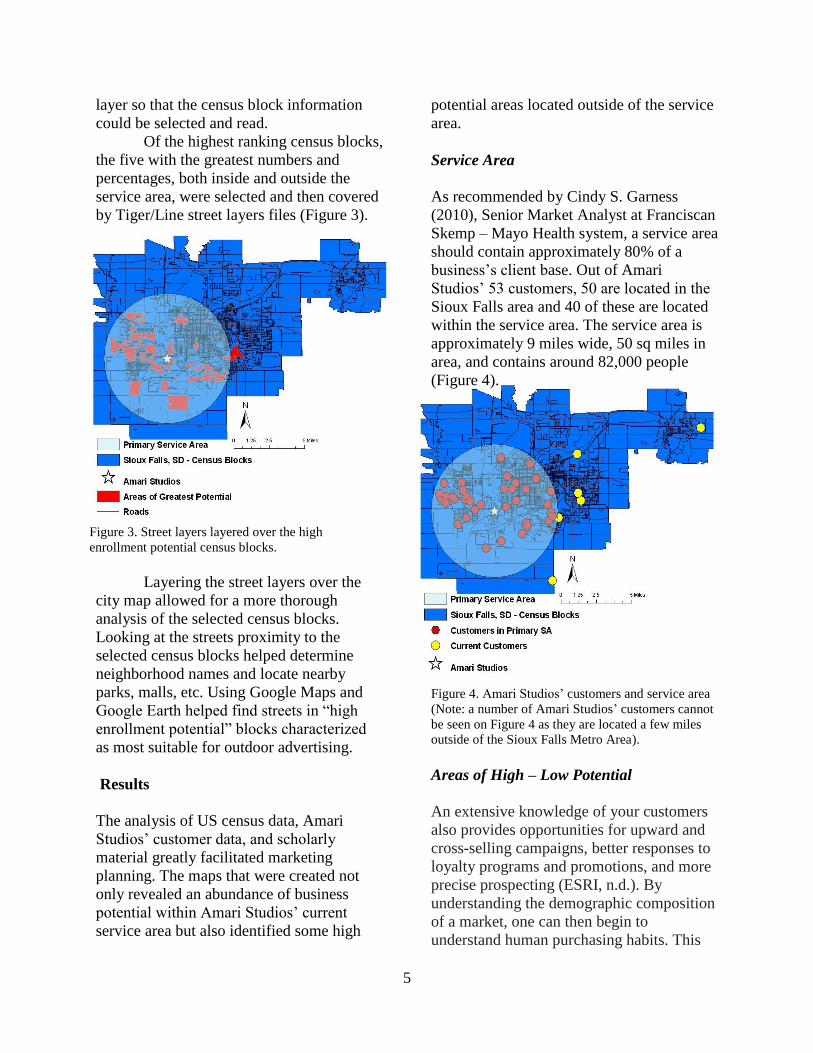
Of the highest ranking census blocks,
the five with the greatest numbers and
percentages, both inside and outside the
service area, were selected and then covered
by Tiger/Line street layers files (Figure 3).
Layering the street layers over the
city map allowed for a more thorough
analysis of the selected census blocks.
Looking at the streets proximity to the
selected census blocks helped determine
neighborhood names and locate nearby
parks, malls, etc. Using Google Maps and
Google Earth helped find streets in “high
enrollment potential” blocks characterized
as most suitable for outdoor advertising.
Results
The analysis of US census data, Amari
Studios’ customer data, and scholarly
material greatly facilitated marketing
planning. The maps that were created not
only revealed an abundance of business
potential within Amari Studios’ current
service area but also identified some high
potential areas located outside of the service
area.
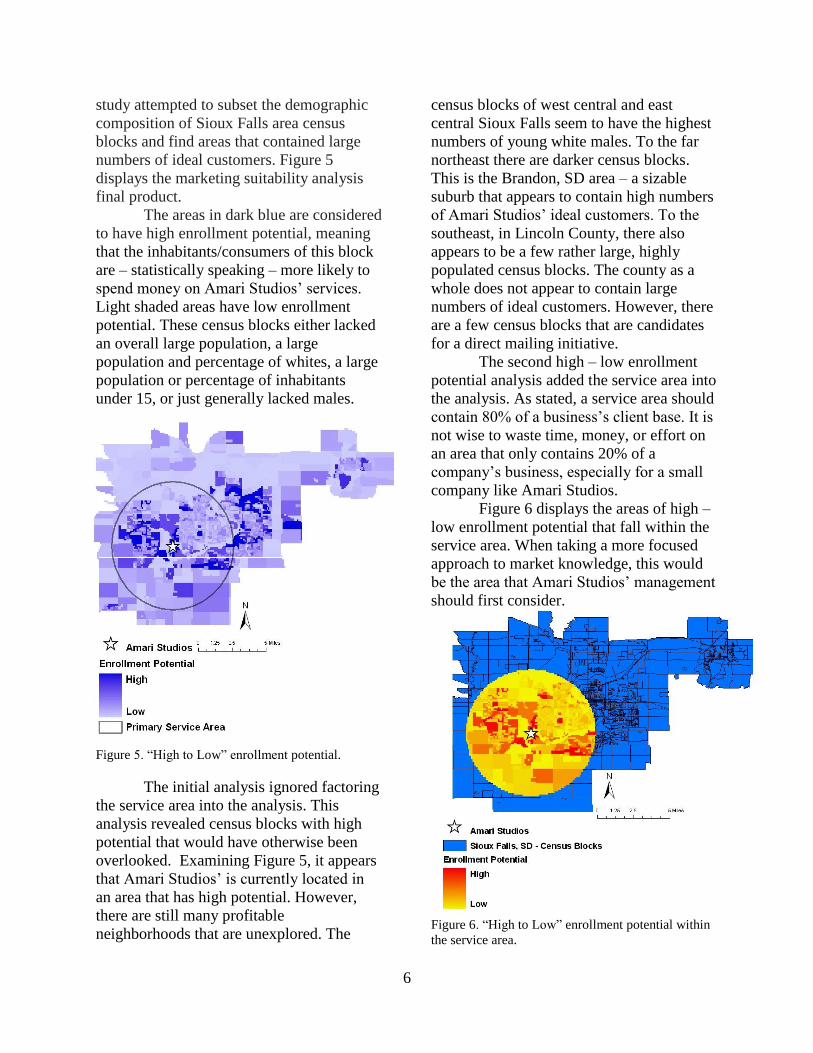
Service Area
As recommended by Cindy S. Garness
(2010), Senior Market Analyst at Franciscan
Skemp – Mayo Health system, a service area
should contain approximately 80% of a
business’s client base. Out of Amari
Studios’ 53 customers, 50 are located in the
Sioux Falls area and 40 of these are located
within the service area. The service area is
approximately 9 miles wide, 50 sq miles in
area, and contains around 82,000 people
(Figure 4).
Figure 4. Amari Studios’ customers and service area
(Note: a number of Amari Studios’ customers cannot
be seen on Figure 4 as they are located a few miles
outside of the Sioux Falls Metro Area).
Areas of High – Low Potential
An extensive knowledge of your customers
also provides opportunities for upward and
cross-selling campaigns, better responses to
loyalty programs and promotions, and more
precise prospecting (ESRI, n.d.). By
understanding the demographic composition
of a market, one can then begin to
understand human purchasing habits. This
Figure 3. Street layers layered over the high
enrollment potential census blocks.
6
study attempted to subset the demographic
composition of Sioux Falls area census
blocks and find areas that contained large
numbers of ideal customers. Figure 5
displays the marketing suitability analysis
final product.
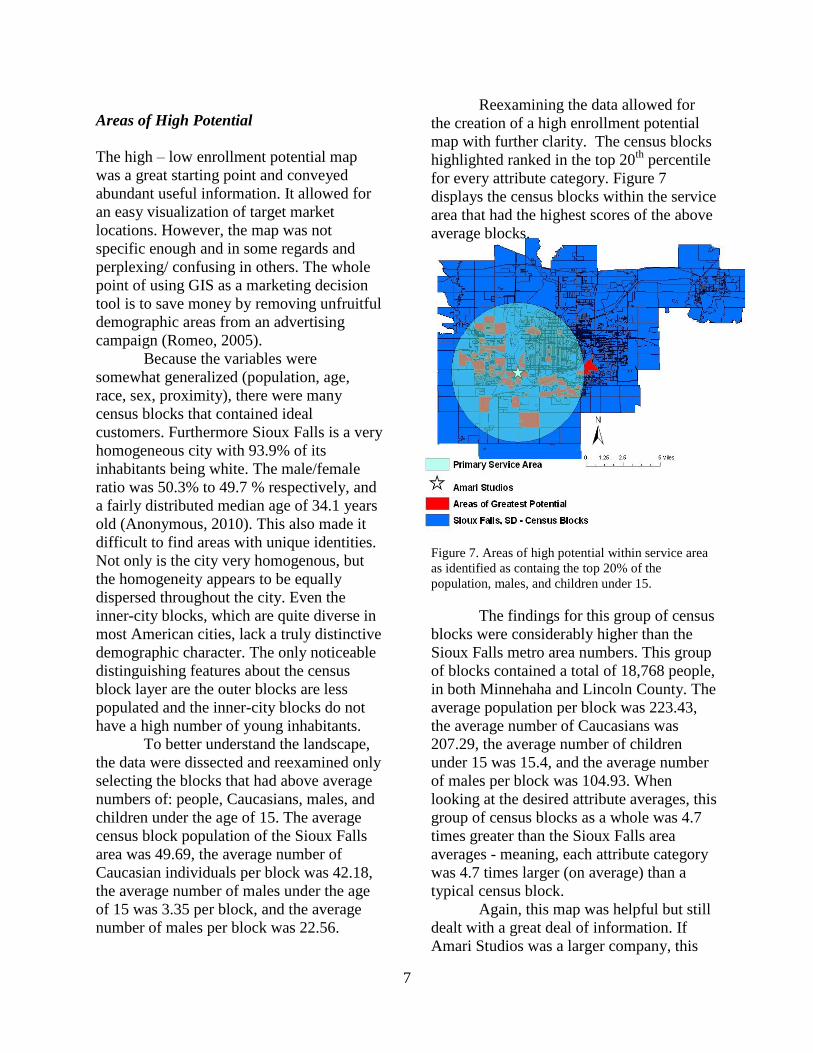
The areas in dark blue are considered
to have high enrollment potential, meaning
that the inhabitants/consumers of this block
are – statistically speaking – more likely to
spend money on Amari Studios’ services.
Light shaded areas have low enrollment
potential. These census blocks either lacked
an overall large population, a large
population and percentage of whites, a large
population or percentage of inhabitants
under 15, or just generally lacked males.
Figure 5. “High to Low” enrollment potential.
The initial analysis ignored factoring
the service area into the analysis. This
analysis revealed census blocks with high
potential that would have otherwise been
overlooked. Examining Figure 5, it appears
that Amari Studios’ is currently located in
an area that has high potential. However,
there are still many profitable
neighborhoods that are unexplored. The
census blocks of west central and east
central Sioux Falls seem to have the highest
numbers of young white males. To the far
northeast there are darker census blocks.
This is the Brandon, SD area – a sizable
suburb that appears to contain high numbers
of Amari Studios’ ideal customers. To the
southeast, in Lincoln County, there also
appears to be a few rather large, highly
populated census blocks. The county as a
whole does not appear to contain large
numbers of ideal customers. However, there
are a few census blocks that are candidates
for a direct mailing initiative.
The second high – low enrollment
potential analysis added the service area into
the analysis. As stated, a service area should
contain 80% of a business’s client base. It is
not wise to waste time, money, or effort on
an area that only contains 20% of a
company’s business, especially for a small
company like Amari Studios.
Figure 6 displays the areas of high –
low enrollment potential that fall within the
service area. When taking a more focused
approach to market knowledge, this would
be the area that Amari Studios’ management
should first consider.
Figure 6. “High to Low” enrollment potential within
the service area.
7
Areas of High Potential
The high – low enrollment potential map
was a great starting point and conveyed
abundant useful information. It allowed for
an easy visualization of target market
locations. However, the map was not
specific enough and in some regards and
perplexing/ confusing in others. The whole
point of using GIS as a marketing decision
tool is to save money by removing unfruitful
demographic areas from an advertising
campaign (Romeo, 2005).
Because the variables were
somewhat generalized (population, age,
race, sex, proximity), there were many
census blocks that contained ideal
customers. Furthermore Sioux Falls is a very
homogeneous city with 93.9% of its
inhabitants being white. The male/female
ratio was 50.3% to 49.7 % respectively, and
a fairly distributed median age of 34.1 years
old (Anonymous, 2010). This also made it
difficult to find areas with unique identities.
Not only is the city very homogenous, but
the homogeneity appears to be equally
dispersed throughout the city. Even the
inner-city blocks, which are quite diverse in
most American cities, lack a truly distinctive
demographic character. The only noticeable
distinguishing features about the census
block layer are the outer blocks are less
populated and the inner-city blocks do not
have a high number of young inhabitants.
To better understand the landscape,
the data were dissected and reexamined only
selecting the blocks that had above average
numbers of: people, Caucasians, males, and
children under the age of 15. The average
census block population of the Sioux Falls
area was 49.69, the average number of
Caucasian individuals per block was 42.18,
the average number of males under the age
of 15 was 3.35 per block, and the average
number of males per block was 22.56.
Reexamining the data allowed for
the creation of a high enrollment potential
map with further clarity. The census blocks
highlighted ranked in the top 20th
percentile
for every attribute category. Figure 7
displays the census blocks within the service
area that had the highest scores of the above
average blocks.
Figure 7. Areas of high potential within service area
as identified as containg the top 20% of the
population, males, and children under 15.
The findings for this group of census
blocks were considerably higher than the
Sioux Falls metro area numbers. This group
of blocks contained a total of 18,768 people,
in both Minnehaha and Lincoln County. The
average population per block was 223.43,
the average number of Caucasians was
207.29, the average number of children
under 15 was 15.4, and the average number
of males per block was 104.93. When
looking at the desired attribute averages, this
group of census blocks as a whole was 4.7
times greater than the Sioux Falls area
averages - meaning, each attribute category
was 4.7 times larger (on average) than a
typical census block.
Again, this map was helpful but still
dealt with a great deal of information. If
Amari Studios was a larger company, this

8
may have been a sufficient analysis, but
since they are still a growing company they
do not have the time or money to actively
pursue an 18,000 person client base.
Top 5 High Potential Areas
To narrow the analysis further, five of the
highest scoring census blocks were selected
for analysis (Figure 8) in which Amari
Studios might consider initiating a
marketing and advertising campaign.
Figure 8. Top 5 areas of high potential – inside and
outside of the service area.
The statistics for this group of census
blocks are as follows: Inside the service area
-- total population – 3160, average
population per block – 632, average number
of Caucasians per block – 586, average
number of children under the age of 15 per
block – 36, and average number of males
per block – 288.2. Outside the service area --
total population – 2181, average population
per block – 436.2, average number of
Caucasians per block – 344, average number
of children under the age of 15 per block –
58.8, and average number of males per
block – 203.2. On average, the top five
census blocks selected within the service
area had numbers that were 12.8 times
greater that the Sioux Falls metro area
average. The group of blocks located outside
of the service had total averages roughly
11.5 times greater than that of the Sioux
Falls metro area and with a notable increase
in the average number of children under 15
– which was at 58.8 per block.
Figure 9 displays the selected
demographic averages of Sioux Falls census
blocks versus the five census blocks that this
study selected as having the highest
potential.
Figure 9. Sioux Falls census vs. top 5 census blocks.
The five highest ranking census
blocks were: block 4050, block 1040, block
2005, block 2043, and block 1307. These
blocks are also in close proximity to major
parks and schools and are also near a few of
the major metro transit stops which are ideal
for outdoor advertising locations. The blocks
located outside of the service area – blocks
(1030, 1029, 3004, 2002, and 2121) – are
interesting in that they contain above
average numbers but are farther away and
may require more effort at marketing than
Amari Studios desires. These blocks also
contain the highest average number of
children under the age 15 – almost 1.6 times
0
100
200
300
400
500
600
700
Nu
mb
er o
f P
eo
ple
Top 5 Census Blocks
Sioux Falls Metro Area
Census Blocks
Population Whites Children <15 Males
Sioux Falls Census Blocks vs Top Five Census Blocks

9
greater than any other area average. These
blocks may not be as populated but they
contain the greatest number of children.
Reaching customers is the next step.
Potential customers have been identified, but
Amari Studios’ management has to decide
what approach to take to reach them. Direct
mailing is considered to be the most
effective medium for direct marketing (if it
reaches the proper target) (Bult and
Wansbeek, 1995). Classified ads are another
option but this is a less focused method of
marketing. E-mail is a great way to stay
connected with current customers but is
somewhat useless when it come to recruiting
new customers of a specific demographic
(Cruz, n.d.). Outdoor advertising is another
method that would work well for Amari
Studios as this method allows for 24/7
viewing in a specific location.
Testing the Areas of High Enrollment
Potential
With the areas of high enrollment potential
located, it was time to test the hypothesis
that this market analysis assumed: the areas
with a population demographic similar to
Amari Studios’ current customer base would
have a higher enrollment potential (or at
least show more interest) than other census
blocks. To assess this hypothesis, a small-
scale, direct mailing campaign was
designed. Two nearly identical promotional
flyers were created; the flyers had a
contemporary design with the Amari
Studios’ logo and contact information. The
difference was in the attached promotional
message. The promotional message read
“Mention the promotional code when you
call to schedule a free lesson.”, and also
included a promotional code – either 1001
or 1002. The flyers with the code 1001 were
distributed to houses that fell within the
census block with highest enrollment
potential and the flyers with the code 1002
were distributed to houses that fell within
the census block that had equivalent
population numbers but did not have the
desired demographic characteristics (Figure
10).
.
Figure 10. The promotional messages and codes that
were attached to the Amari Studios flyers.
The delivery of the flyers was done
in a less traditional manner. Due to lack of
funding, mailing lists were unobtainable. So
instead, the flyers were hand delivered. Each
flyer was placed either between a
household’s glass door and front door or in
the newspaper box (usually located directly
beneath or close to a household’s mailbox).
With the targeted census blocks/
neighborhoods located in an ArcGIS map, it
was easy to enter their addresses into a GPS
and locate them firsthand. Each group of
census blocks – both high enrollment
potential and low enrollment potential –
received 100 promotional flyers (200 flyers
distributed total).
Since the recipients of the flyers
were encouraged to mention the promotional
code when they called in to inquire about the
advertisement, locating the targeted area in
which they lived was relatively simple.
Recipients who mentioned the code 10001
revealed that they were located in the high
enrollment potential areas while recipients
who mentioned the code 10002 revealed that
they were from the areas that were predicted
to have low enrollment potential. Responses
to the promotional flyer allowed for the
creation of a response rate map – which
displayed the level of interest within the
target area.

10
Census block 4050 - the predicted
high enrollment potential area – had a
response rate of 15%, whereas census block
3000 – the area of predicted low enrollment
potential – had a response rate of 3%. The
recipients were given a two week period to
respond. However, most of the inquiries
came within the first five days.
Figure 11 displays the two census
blocks targeted by the direct mailing
campaign. Figure 12 provides a closer look
at the neighborhoods that were targeted by
this study.
Figure 11. The census blocks targeted by the direct
mailing campaign.
Figure 12. A closer look as census blocks 4050 and
3000.
The results from the direct mailing
effort supports this study’s hypothesis that
targeting neighborhoods that have
demographic characteristics similar to that
of Amari Studios’ client base will generate
more interest than targeting neighborhoods
that do not have similar demographic
characteristics. The direct mail study was
done on a small-scale but the numbers do
reveal a greater interest in the high
enrollment potential areas. The results of
this direct mailing effort, and the study as a
whole, suggest that Amari Studios should
focus their advertising and marketing efforts
on the areas that this study has labeled as
areas of high enrollment potential.
Outdoor Advertising Locations
As mentioned, the top five service area
census blocks do not only contain high
numbers of ideal candidates but are also
located next to highly trafficked public areas
making them great locations to initiate an
advertising effort. The highest ranking
census block, 4050, is located in between 8th
St. West and Holly Avenue in the
northwestern corner of Sioux Falls. This
neighborhood is located near N Western
Ave and Burnside Park and would be a great
spot to place an outdoor advertisement of
some sort.
The second highest ranking block
was census block 1040, located near West
Brooks PI and Louise Ave, which is also
near Sioux Falls’ main mall (The Empire
Mall). The third highest ranking block was
census block 2005, located near 12th
St and
Valley View Dr. and is near a number of
Sioux Falls metro transit stops. The fourth
and fifth ranking census blocks were 1307
and 2043. Block 1307 is located just off
Valhalla Blvd, near the Empire mall as well,
and block 2043 is located in Lincoln County
near E 69th
street and the Sioux Falls
Christian School. These neighborhoods/
11
census blocks are ideally situated to host
some type of outdoor advertisement.
Figure 13 displays the general location of
where the outdoor advertisements might be
considered for placement.
Figure 13. Outdoor advertisement location in relation
to the selected census blocks.
In Sioux Falls, SD, the company
Creative Outdoor Advertising appears to
have the lowest price and the largest
selection of outdoor advertising options. For
approximately $89.00 - $150.00 dollars a
month (depending on location), Amari
Studios can rent an outdoor advertising
medium (Creative Outdoor Advertising,
2006). If Amari Studios decided to advertise
at all locations, the annual cost would be
approximately $5340.00 – $21000.00 per
year.
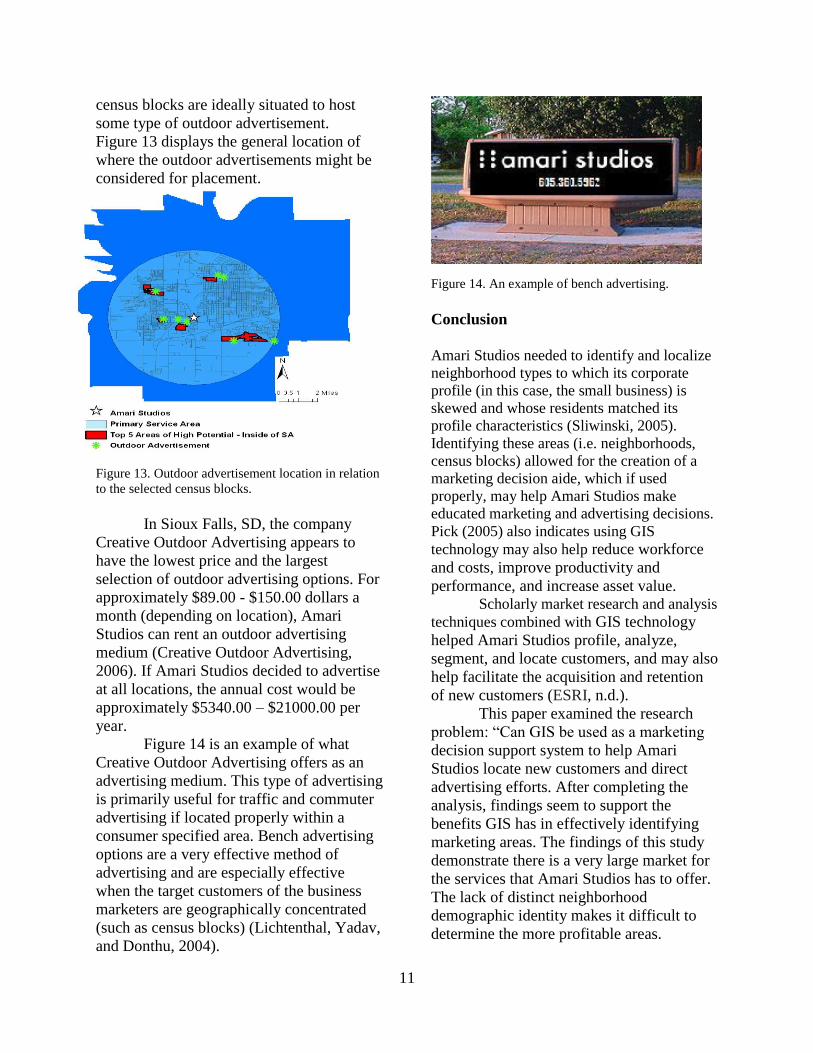
Figure 14 is an example of what
Creative Outdoor Advertising offers as an
advertising medium. This type of advertising
is primarily useful for traffic and commuter
advertising if located properly within a
consumer specified area. Bench advertising
options are a very effective method of
advertising and are especially effective
when the target customers of the business
marketers are geographically concentrated
(such as census blocks) (Lichtenthal, Yadav,
and Donthu, 2004).
Figure 14. An example of bench advertising.
Conclusion
Amari Studios needed to identify and localize
neighborhood types to which its corporate
profile (in this case, the small business) is
skewed and whose residents matched its
profile characteristics (Sliwinski, 2005).
Identifying these areas (i.e. neighborhoods,
census blocks) allowed for the creation of a
marketing decision aide, which if used
properly, may help Amari Studios make
educated marketing and advertising decisions.
Pick (2005) also indicates using GIS
technology may also help reduce workforce
and costs, improve productivity and
performance, and increase asset value. Scholarly market research and analysis
techniques combined with GIS technology
helped Amari Studios profile, analyze,
segment, and locate customers, and may also
help facilitate the acquisition and retention
of new customers (ESRI, n.d.).
This paper examined the research
problem: “Can GIS be used as a marketing
decision support system to help Amari
Studios locate new customers and direct
advertising efforts. After completing the
analysis, findings seem to support the
benefits GIS has in effectively identifying
marketing areas. The findings of this study
demonstrate there is a very large market for
the services that Amari Studios has to offer.
The lack of distinct neighborhood
demographic identity makes it difficult to
determine the more profitable areas.

12
However, despite the homogeny of Sioux
Falls, this study was able to locate a number
of census blocks that contain high numbers
of Amari Studios’ potential customer. Areas
such as blocks 4050, 1040, 2005, 2043, and
1307 contain sizable populations, and
averages that are nearly 13 times greater
than the Sioux Falls metro area average.
Also, there are some interesting blocks
located outside of Amari Studios’ service
area. Blocks 1030, 1029, 3004, 2002, and
2121 contain above average numbers of
inhabitants with the desired demographic
characteristics and although they are farther
from Amari Studios, they may be highly
profitable areas worth examining further.
The results of the direct mailing
assessment further support this study’s
findings. With the response rate being 12%
higher in the “high enrollment potential”
areas (vs. the “low enrollment potential”
areas), it would be fruitful for Amari Studios
to continue marketing their services in those
locations.
The biggest limitation of this study
was the age of the census data that were
analyzed. Highly detailed census data are
only released once every ten years and
because this study took place in early 2010,
available data consisted of 2000 census data.
Newer census data will become available
later in 2010 year. However, the
methodology behind the data analysis would
be exactly the same, regardless of its age.
Since this market analysis process is
developed, the new 2010 census data could
be easily interchanged with the older data.
Also, since this information is old, Amari
Studio’s decision to act on this study’s
findings may not yield the greatest results.
On the other hand, Hogan (1970) argues
there is a great deal of community
socioeconomic stability over a ten year
period. So in other words, the community
composition is most likely similar to what it
was ten years prior, in 2000. Either way, the
study would have more legitimacy if the
2010 census data were available.
In the end, this study supports using
GIS as a marketing decision support system
to help Amari Studios locate new customers
and effectively direct its marketing and
advertising efforts and gave Amari Studios a
better understanding of where its ideal
customers are located. This helps affirm
ideas of Geographic Information Systems’
usefulness in business decision-making by
adding a spatial component to the decision
process (Pick, 2005).
Acknowledgments
I would like to thank the Saint Mary’s
University of Minnesota Resource Analysis
department. Dr. David McConville,
Professor Patrick Thorsell, and Professor
John Ebert have all been very helpful
throughout this project. I would like to thank
Micah Wetzel and his wife Tanya Wetzel
and the rest of Amari Studios for making
this study possible and providing me with all
the information I needed. I also want to
thank my supervisors and coworkers at
Franciscan Skemp in La Crosse, WI for
giving me the opportunity to work with
them and learn some effective and useful
market research techniques.
References
Aaker, D. A., Kumar, V., and Day, G. 2001.
A decision-making perspective on
marketing research. In D. A. Aaker, V.
Kumar, and G. Day, Marketing Research
(pp. 1-36). Hoboken: John Wiley and
Sons, Inc..
Anonymous. 2010. A Population Center.
Retrieved March 12, 2010 from Sioux
Falls Development Center: http://www.
siouxfallsdevelopment.com/demographics.
cfm.

13
Bult, J. R., and Wansbeek, T. 1995. Optimal
Selection for Direct Mail. Marketing
Science, 378. University of Groningen.
Groningen, Netherlands.
Creative Outdoor Advertising. 2006.
Retrieved March 20, 2010 from
creativeoutdoor.com: http://www.
creativeoutdoor.com/FindLocations/FindL
ocation/ShowFindLocationTablePage.aspx
Cruz, D. n.d. Smart Alternatives to Direct
Mail. Retrieved March 15, 2010 from
4hb.com:http://www.4hb.com/0135smartal
tern.html.
Garness, C. 2010. Personal Communication
Franciscan Skemp Mayo Health Systems.
Professional Arts Building, La Crosse,
Wisconsin.
ESRI. n.d. GIS for Direct Marketing.
Retrieved Feb 1, 2010, from ESRI.com:
http://www .esri.com/library/brochures/
pdfs/gis-for-direct-marketing.pdf.
Hess, R. L., Rubin, R. S., and West, L. A.
2004. Geographic information systems as a
marketing information system technology.
Decision Support Systems , 198-211.
Elsevier Science Publishers B. V.
Amsterdam, Netherlands.
Hogan, T. P. 1970. Using Old
Socioeconomic Data For Defining Norm
Groups. Journal of Educational
Measurement, 279. National Council on
Measurement in Education. Washington,
DC.
Lamar Advertising. 2010. Retrieved Feb 28,
2010 from In The Right Place, At The
Right Time: http://www.lamaroutdoor
.com/index.html.
Lichtenthal, J. D., Yadav, V., and Donthu,
N. 2004. Outdoor Advertising For
Business Markets. The University of
Pensilvania. University Park, Pensilvania.
Marketing Research. 2010. Retrieved April
17, 2010 from Diakrisi Management and
Technology Services: http://www.diakrisi.
gr/NEWSEN/MarketingResearch.html.
McDaniel, C. 2010. Marketing research
essentials, 1-24. John Wiley & Sons.
Koboken, New Jersey.
Pick, J. B. 2005. Geographic Information
Systems In Business, 7-133. Retrieved Feb
2, 2010, from Scribd.com: http://www.
scribd.com/doc/20074691/Geographic-
Information-Systems-in-Business
Romeo, J. 2005. Target Marketing with
GIS. Geospatial Solutions, pp. 2-6. Bend,
Oregon.
Sliwinski, A. 2002. Spatial Point Pattern
Analysis for Targeting Prospective New
Customers: Bringing GIS Functionality
into Direct Marketing. Journal of
Geographic Information and Decision
Analysis, 31-48. Institute of Geography,
University of Mnster. Münster, Germany.
Zahorsky, D. n.d. Customer Data Mining for
Gold. Retrieved Feb 12, 2010 from
About.com: Small Business Information:
http://sbinformation.about.com/cs/marketre
search/a/custdata.htm.