using garp to invest in the fastest-growing companies in ... · using garp to invest in the...
TRANSCRIPT
barrons400etf.com | 1.855.724.0450
The Barron’s 400 ETF: Using GARP to Invest in the Fastest-Growing Companies in the U.S.
BFOR
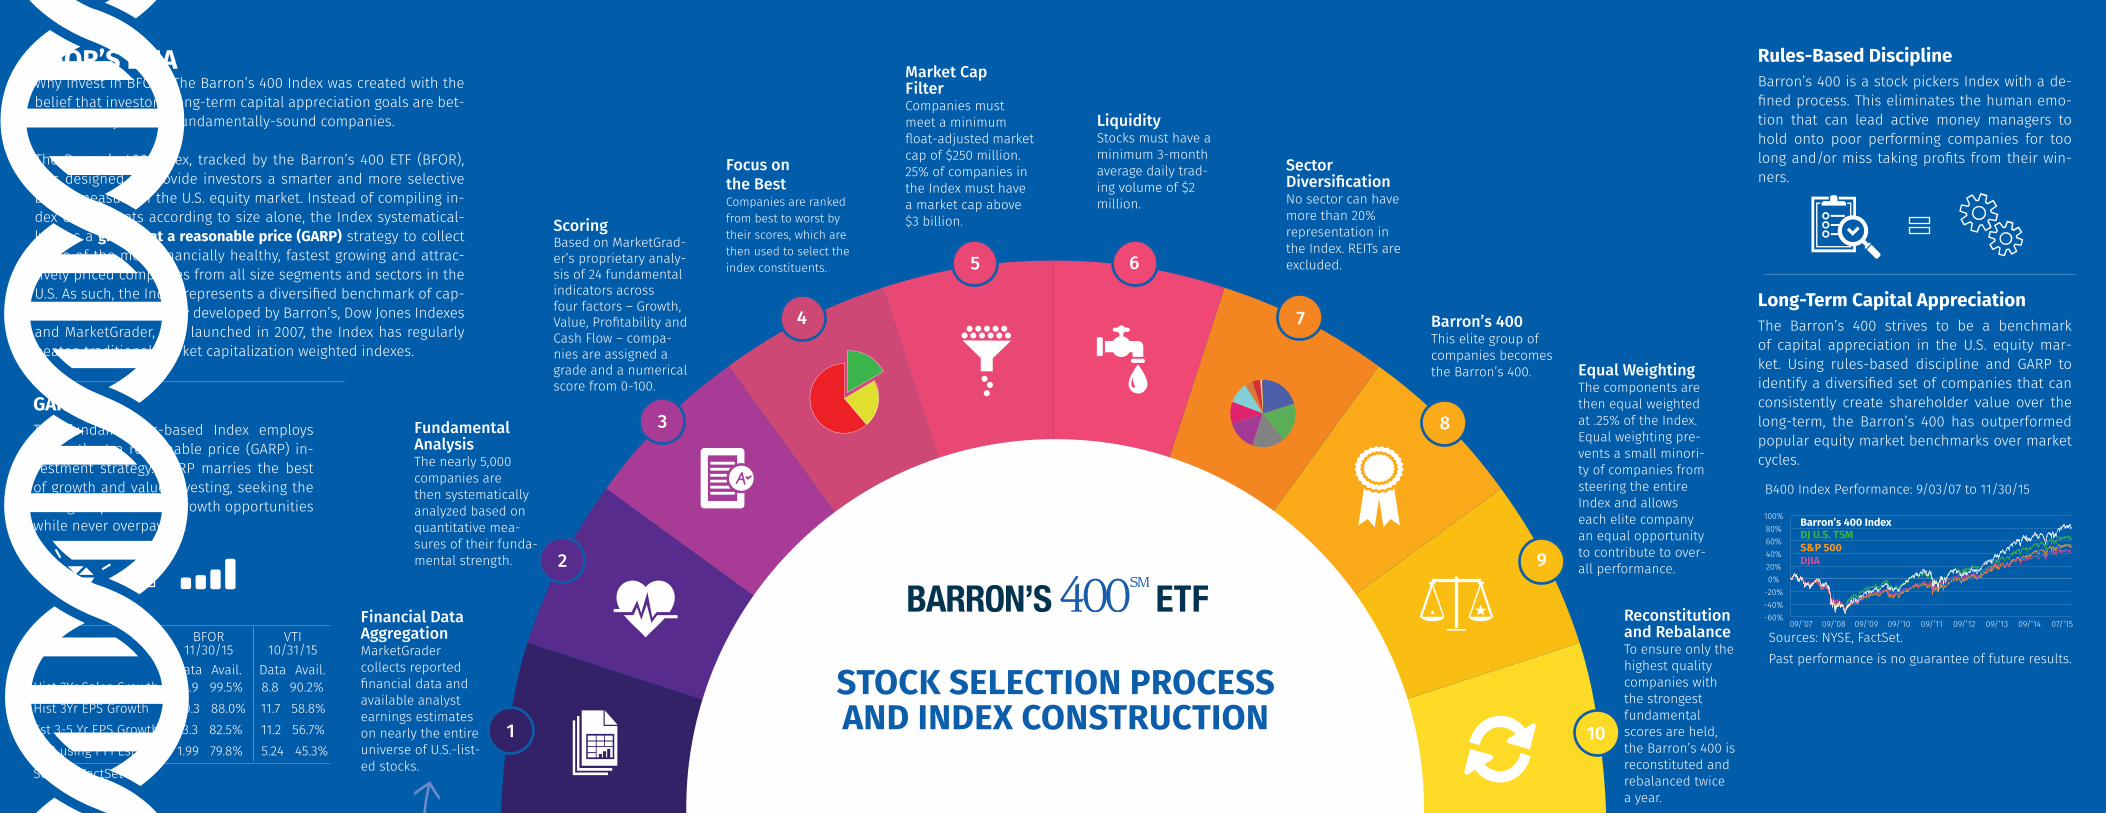
BFOR’S DNAWhy invest in BFOR? The Barron’s 400 Index was created with the belief that investors’ long-term capital appreciation goals are bet-ter served by owning fundamentally-sound companies.
The Barron’s 400 Index, tracked by the Barron’s 400 ETF (BFOR), was designed to provide investors a smarter and more selective broad measure of the U.S. equity market. Instead of compiling in-dex components according to size alone, the Index systematical-ly uses a growth at a reasonable price (GARP) strategy to collect some of the most financially healthy, fastest growing and attrac-tively priced companies from all size segments and sectors in the U.S. As such, the Index represents a diversified benchmark of cap-ital appreciation. Jointly developed by Barron’s, Dow Jones Indexes and MarketGrader, and launched in 2007, the Index has regularly beaten traditional market capitalization weighted indexes.
Financial DataAggregation MarketGrader collects reported financial data and available analyst earnings estimates on nearly the entire universe of U.S.-list-ed stocks.
Fundamental AnalysisThe nearly 5,000 companies are then systematically analyzed based on quantitative mea-sures of their funda-mental strength.
Scoring Based on MarketGrad-er’s proprietary analy-sis of 24 fundamental indicators across four factors – Growth, Value, Profitability and Cash Flow – compa-nies are assigned a grade and a numerical score from 0-100.
Focus on the Best Companies are ranked from best to worst by their scores, which are then used to select the index constituents.
Market Cap Filter Companies must meet a minimum float-adjusted market cap of $250 million. 25% of companies in the Index must have a market cap above $3 billion.
Liquidity Stocks must have a minimum 3-month average daily trad-ing volume of $2 million.
Sector DiversificationNo sector can have more than 20% representation in the Index. REITs are excluded.
Barron’s 400 This elite group of companies becomes the Barron’s 400. Equal Weighting
The components are then equal weighted at .25% of the Index. Equal weighting pre-vents a small minori-ty of companies from steering the entire Index and allows each elite company an equal opportunity to contribute to over-all performance.
B400 Index Performance: 9/03/07 to 11/30/15
Reconstitution and Rebalance To ensure only the highest quality companies with the strongest fundamental scores are held, the Barron’s 400 is reconstituted and rebalanced twice a year.
1
2
3
4
5 6
7
8
9
10
Long-Term Capital AppreciationThe Barron’s 400 strives to be a benchmark of capital appreciation in the U.S. equity mar-ket. Using rules-based discipline and GARP to identify a diversified set of companies that can consistently create shareholder value over the long-term, the Barron’s 400 has outperformed popular equity market benchmarks over market cycles.
Rules-Based DisciplineBarron’s 400 is a stock pickers Index with a de-fined process. This eliminates the human emo-tion that can lead active money managers to hold onto poor performing companies for too long and/or miss taking profits from their win-ners.
GARPThe fundamentals-based Index employs a growth at a reasonable price (GARP) in-vestment strategy. GARP marries the best of growth and value investing, seeking the strongest-performing growth opportunities while never overpaying.
‘09 ‘10 ‘11 ‘12 ‘13 ‘14 ‘15‘08‘07‘06‘05‘04‘03‘02‘01‘00‘99‘98-50%0%50%100%150%200%250%300%350%400%450%500%
-60%-40%-20%0%20%40%60%80%100%
09/‘09 09/‘10 09/‘11 09/‘12 09/‘13 09/‘14 07/‘1509/‘0809/’07
Barron’s 400 Index
DJIA
DJ U.S. TSMS&P 500
STOCK SELECTION PROCESS AND INDEX CONSTRUCTION
Hist 3Yr Sales Growth 15.9 99.5% 8.8 90.2%Hist 3Yr EPS Growth 20.3 88.0% 11.7 58.8%Est 3-5 Yr EPS Growth 13.3 82.5% 11.2 56.7%PEG using FY1 Est 1.99 79.8% 5.24 45.3%Source: FactSet
BFOR11/30/15
Data DataAvail. Avail.
VTI10/31/15
Sources: NYSE, FactSet.Past performance is no guarantee of future results.
barrons400etf.com | 1.855.724.0450
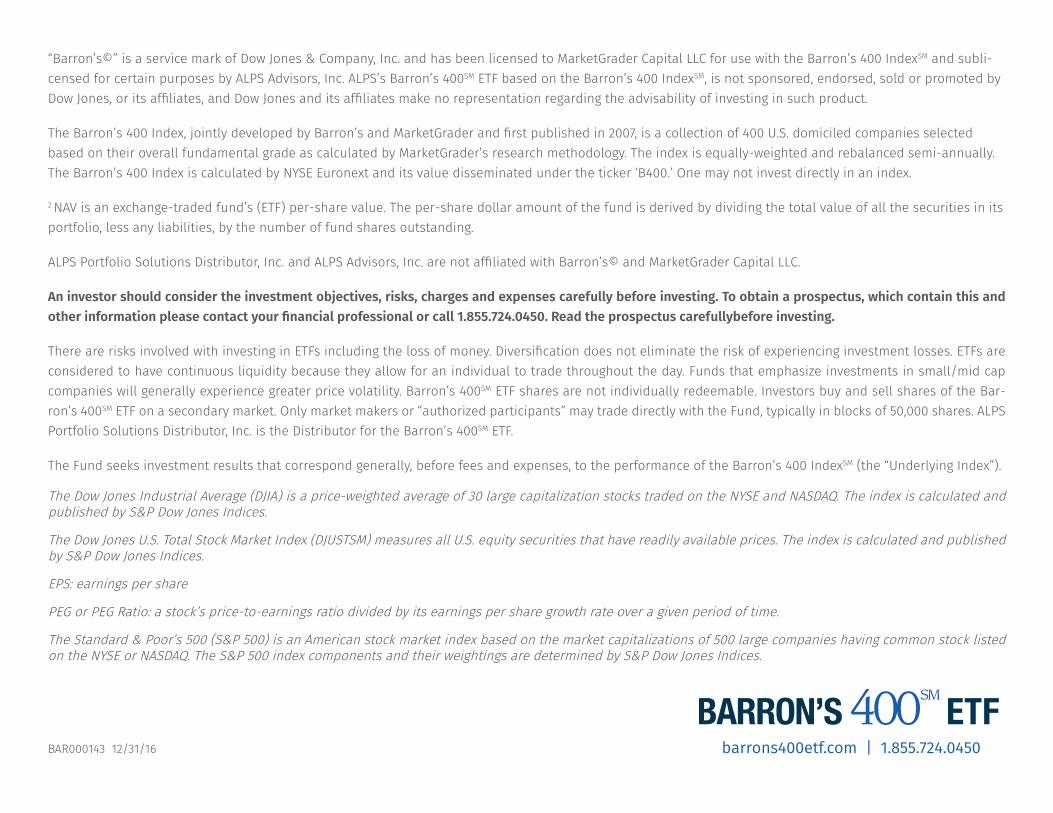
“Barron’s©” is a service mark of Dow Jones & Company, Inc. and has been licensed to MarketGrader Capital LLC for use with the Barron’s 400 IndexSM and subli-censed for certain purposes by ALPS Advisors, Inc. ALPS’s Barron’s 400SM ETF based on the Barron’s 400 IndexSM, is not sponsored, endorsed, sold or promoted by Dow Jones, or its affiliates, and Dow Jones and its affiliates make no representation regarding the advisability of investing in such product.
The Barron’s 400 Index, jointly developed by Barron’s and MarketGrader and first published in 2007, is a collection of 400 U.S. domiciled companies selected based on their overall fundamental grade as calculated by MarketGrader’s research methodology. The index is equally-weighted and rebalanced semi-annually. The Barron’s 400 Index is calculated by NYSE Euronext and its value disseminated under the ticker ‘B400.’ One may not invest directly in an index.
2 NAV is an exchange-traded fund’s (ETF) per-share value. The per-share dollar amount of the fund is derived by dividing the total value of all the securities in its portfolio, less any liabilities, by the number of fund shares outstanding.
ALPS Portfolio Solutions Distributor, Inc. and ALPS Advisors, Inc. are not affiliated with Barron’s© and MarketGrader Capital LLC.
An investor should consider the investment objectives, risks, charges and expenses carefully before investing. To obtain a prospectus, which contain this and other information please contact your financial professional or call 1.855.724.0450. Read the prospectus carefullybefore investing.
There are risks involved with investing in ETFs including the loss of money. Diversification does not eliminate the risk of experiencing investment losses. ETFs are considered to have continuous liquidity because they allow for an individual to trade throughout the day. Funds that emphasize investments in small/mid cap companies will generally experience greater price volatility. Barron’s 400SM ETF shares are not individually redeemable. Investors buy and sell shares of the Bar-ron’s 400SM ETF on a secondary market. Only market makers or “authorized participants” may trade directly with the Fund, typically in blocks of 50,000 shares. ALPS Portfolio Solutions Distributor, Inc. is the Distributor for the Barron’s 400SM ETF.
The Fund seeks investment results that correspond generally, before fees and expenses, to the performance of the Barron’s 400 IndexSM (the “Underlying Index”).
The Dow Jones Industrial Average (DJIA) is a price-weighted average of 30 large capitalization stocks traded on the NYSE and NASDAQ. The index is calculated and published by S&P Dow Jones Indices.
The Dow Jones U.S. Total Stock Market Index (DJUSTSM) measures all U.S. equity securities that have readily available prices. The index is calculated and published by S&P Dow Jones Indices.
EPS: earnings per share
PEG or PEG Ratio: a stock’s price-to-earnings ratio divided by its earnings per share growth rate over a given period of time.
The Standard & Poor’s 500 (S&P 500) is an American stock market index based on the market capitalizations of 500 large companies having common stock listed on the NYSE or NASDAQ. The S&P 500 index components and their weightings are determined by S&P Dow Jones Indices.
BAR000143 12/31/16