using flexibility to enhance the alignment between ... · email: [email protected] ... strategic...
TRANSCRIPT
0
Using Flexibility to Enhance the Alignment between Information Systems and Business Strategy: Implications for IT Business Value
Draft #1
Paul P. Tallon
Wallace E. Carroll School of Management Fulton Hall 452A, 140 Commonwealth Ave.
Boston College, Chestnut Hill, MA 02467-3808
Phone: (617) 552-4277 Fax: (617) 552-0433
email: [email protected]
Kenneth L. Kraemer Center for Research on Information Technology and Organizations,
Graduate School of Management, University of California, Irvine, CA 92697-4650
Please do not cite or reference.
April 20, 2003
This research has been supported by grants from the CISE/IIS/CSS Division of the U.S. National Science Foundation and the NSF Industry/University Cooperative Research Center (CISE/EEC) to the Center for Research on Information Technology and Organizations (CRITO) at the University of California, Irvine. Industry sponsors include: the Boeing Company, Canon Development Americas, Conexant Systems, IBM, IDC, Intel, Microsoft, Quantum|ATL, Technology Solutions Company and the U.S. Department of Defense.
Key Words: Business Value of Information Technology; Flexibility; Strategic Alignment, Strategic Intent
1
Using Flexibility to Enhance the Alignment between Information Systems and Business Strategy: Implications for IT Business Value
ABSTRACT
While executives continue to rate strategic alignment – denoting the fit between information technology
(IT) and the business strategy – as a key IT management issue, the rise in business uncertainty in the late
1990s may have given executives cause to question whether attempts to increase strategic alignment limit
their ability to maintain strategic flexibility. How corporations structure their IT decisions has implications
for how easily and quickly they can respond to events in their external and internal environment.
Using the theory of dynamic capabilities, we develop a model to examine how IT and strategic flexibility
interact with, and shape, strategic alignment. By allowing strategic alignment to mediate the link between
IT and strategic flexibility and IT business value, we can assess whether capabilities around flexibility can
enable corporations to realize greater payoffs from IT investment.
Using survey data from 208 U.S. corporations, we find that where corporations have clearly defined goals
for IT, there is no tradeoff between IT flexibility and strategic alignment. Instead, IT flexibility enhances
strategic alignment and leads to improved IT business value. To investigate this further, we develop a two
dimensional framework based on IT flexibility and IT business value, and through the use of measures of
industry clockspeed, find that a tradeoff only takes place in highly dynamic environments. In contrast, in
stable environments, corporations may have no need for IT flexibility. Even while operating in uncertain
and rapidly changing industries, one-third of the firms in our sample successfully combined high strategic
alignment with IT flexibility, confirming that IT flexibility and strategic alignment can be complementary,
rather than mutually exclusive.

2
1. Introduction
Since the early 1990s, business and information technology (IT) executives have repeatedly rated
strategic alignment or the fit between information systems (IS) and business strategy as one of the most
critical management issues facing their corporations (CSC 2001). Executives’ perceptions of the value of
strategic alignment have been validated by research that confirms that strategic alignment can improve IS
effectiveness, firm performance, market growth, innovation and competitive advantage (Chan et al. 1997;
Kearns and Lederer 2001; Sabherwal and Kirs 1994; Tallon et al. 2000). As these results are internalized
by senior management, it may be inferred that more is better and that corporations should try to achieve
even tighter fit or integration between their IS and business strategy.
While we do not dispute these results, an increase in economic uncertainty in the years following
the collapse of the Internet bubble may have given corporations cause to question the value of increased
alignment. Research shows that as economic uncertainty and environmental turbulence create threatening
business conditions, corporations may respond with flexible, agile and highly adaptable business models
(Hitt, Keats and DeMarie 1998). While corporations who adapt their strategy and business activities may
enjoy an advantage over others who fail to adapt, success will ultimately be contingent upon whether IT is
flexible enough to support a reconfigured business strategy. If IT is so tightly integrated with the current
business strategy that IT cannot support a change in the business strategy, executives may cite inadequate
flexibility1 as evidence against pursuing increased alignment. Faced, therefore, with a tradeoff between
alignment and flexibility, some corporations may prefer less than perfect alignment in the short-term in
order to retain flexibility, even though a lack of alignment could undermine IT support for critical areas of
the business and lead to a decline in firm performance. On the other hand, where corporations have been
1 In this paper, we use the definition of flexibility given by Byrd and Turner (2000), namely “the degree to which
an organization possesses a variety of actual and potential procedures, and the rapidity with which it can implement these procedures to increase the control capability of management and improve the controllability of the organization over its environment” (p. 170). Therefore, IT flexibility reflects the ability to easily and quickly introduce new sources of IT support for the business strategy, while strategic flexibility reflects the ability to easily and quickly change key aspects of the business strategy in areas such as pricing, market reach, etc.

3
able to build flexibility directly into their IT investment decisions, increased flexibility may complement
and enhance, rather than restrict, strategic alignment (Jarvenpaa and Ives 1994; Weill et al. 2002).
Since flexibility is synonymous with the creation of real options (Benaroch and Kauffman 1999),
an increase in IT or strategic flexibility could have a positive impact on IT business value, reflecting the
contribution of IT to firm performance. In addition, the logic of compound or multi-stage options (Panayi
and Trigeorgis 1998) might suggest that IT flexibility could have a direct impact on strategic flexibility as
senior management recognize that their ability to change certain aspects of their business strategy may be
reinforced by their ability to use IT to support those changes. These arguments culminate in three primary
research questions that form the basis for this paper, namely:
1. As corporations pursue increased strategic alignment, are their efforts enhanced or constrained by
the need for IT or strategic flexibility, particularly during periods of heightened uncertainty?
2. How does the interaction between strategic alignment and flexibility impact the business value of
IT? For example, if IT flexibility or strategic flexibility complements strategic alignment, what is
the impact on IT business value? Alternatively, if corporations must choose between increased IT
or strategic flexibility and tighter strategic alignment, how will this impact IT business value?
3. What is the relationship between IT flexibility and strategic flexibility? Specifically, will greater
IT flexibility improve the corporation’s ability to enact critical changes in its business strategy?
To address these questions, we present in Figure 1 a conceptual model depicting the relationship
between IT flexibility, strategic flexibility, strategic alignment and IT business value. Using the theory of
dynamic capabilities (Teece, Pisano and Shuen 1997), we argue that flexibility influences the degree of
Figure 1. Conceptual Model
IT Business Value
IT Flexibility
Strategic Flexibility
Strategic Intent for IT
Firm Performance
Environmental Uncertainty
Strategic Alignment

4
alignment between IT and the business strategy. Since IT business value reflects the actual rather than the
anticipated contribution of IT to firm performance, an attempt to link strategic alignment with IT business
value means that strategic alignment must reflect the link between the actual or implemented business and
IS strategy rather than planned or intended strategies (Mintzberg 1978). Since strategies are implemented
through activities (Nelson and Winter 1982), this allows us to model strategic alignment as an interaction
between key business activities and IT support for those activities. Finally, since corporations frequently
pursue different goals or strategic intent for IT, the interaction between flexibility and strategic alignment
may vary within the value chain. For example, an operations-focused corporation may prefer flexibility in
production and operations whereas a market-focused corporation might prefer flexibility in marketing and
sales. Therefore, strategic intent for IT is an important control variable in our conceptual model. Lastly, a
growing body of research on the productivity paradox shows that IT spending contributes to productivity
at the firm level (Brynjolfsson and Hitt 1996). Our conceptualization of IT business value is broader than
just productivity, reflecting the diversity of IT impacts at different points along the value chain.
The remainder of this paper is organized as follows. In section 2, we present a theoretical basis
for our model and describe our research hypotheses. In section 3, we describe variable construction, data
collection and analysis. Then in section 4, we review our findings and present a theoretical framework to
evaluate the link between strategic alignment and IT flexibility under different degrees of environmental
uncertainty. Finally, in section 5, we discuss managerial implications and research limitations, identify
areas for future research and provide an overall conclusion.
2. Theoretical Development
The resource-based view of the firm argues that the scale and scope of a corporation’s resources
and capabilities are critical determinants of its profitability2 (Penrose 1959; Wernerfelt 1984). Within this
framework, Grant (1991) suggests that, “business strategy should be viewed less as a quest for monopoly
2 Resources are broadly defined as “all assets, capabilities, organizational processes, firm attributes, information,
knowledge, etc. controlled by a firm to conceive of and implement strategies that improve its efficiency and effectiveness” (Barney 1991: p. 101).

5
rents (the returns to market power) and more as a quest for Ricardian rents (the returns to the resources
which confer competitive advantage)” (p. 117). While the resource-based view has emerged as a popular
and useful theory in relating organizational resources to firm performance, a common criticism is that the
theory’s static “resource picking” perspective overlooks the need for corporations to perform an ongoing
or dynamic assessment of their resource needs in response to changing business conditions (Mahoney and
Pandian 1992; Makadok 2001). As corporations adopt “new combinations of resources” (Penrose 1959: p.
85), the source of value goes beyond the possession and use of resources to include the capabilities that
corporations use to renew and deploy their resources over time. This emphasis on dynamic capabilities3 is
consistent with views on how corporations realize value from repeated waves of innovation (Schumpeter
1950) and with Grant’s argument that if “resources are the source of a firm’s capabilities, capabilities are
the main source of its competitive advantage” (1991: p. 119).
2.1 Leveraging IT Flexibility
Previous research has highlighted the relationship between IT capabilities and firm performance.
For example, using a matched-sample methodology, Bharadwaj (2000) found that firms with superior IT
capabilities in such areas as IT infrastructure, human IT resources and IT-enabled intangibles performed
better on a variety of profit and cost metrics. Santhanam and Hartono (2003) reported a similar result after
adjusting for prior financial performance.
Superior IT capabilities allow a corporation to respond quickly to perceived environmental threats
and to proactively seek out new competitive opportunities, although as Allen and Boynton (1991) reveal,
there is often a cost associated with building IT capabilities that facilitate this level of responsiveness and
flexibility. Whether corporations are willing to accept this cost or not depends on the degree of stability in
their environment. For example, in a stable environment, corporations can develop a core competence and
drive greater efficiency through a narrow range of business activities (Miller and Friesen 1994), although
as Leonard-Barton argues, core competencies can become core rigidities if corporations fail to respond to
3 Teece et al. (1997) define dynamic capabilities as a way to “renew competences so as to achieve congruence
with the changing business environment” (p. 515).
6
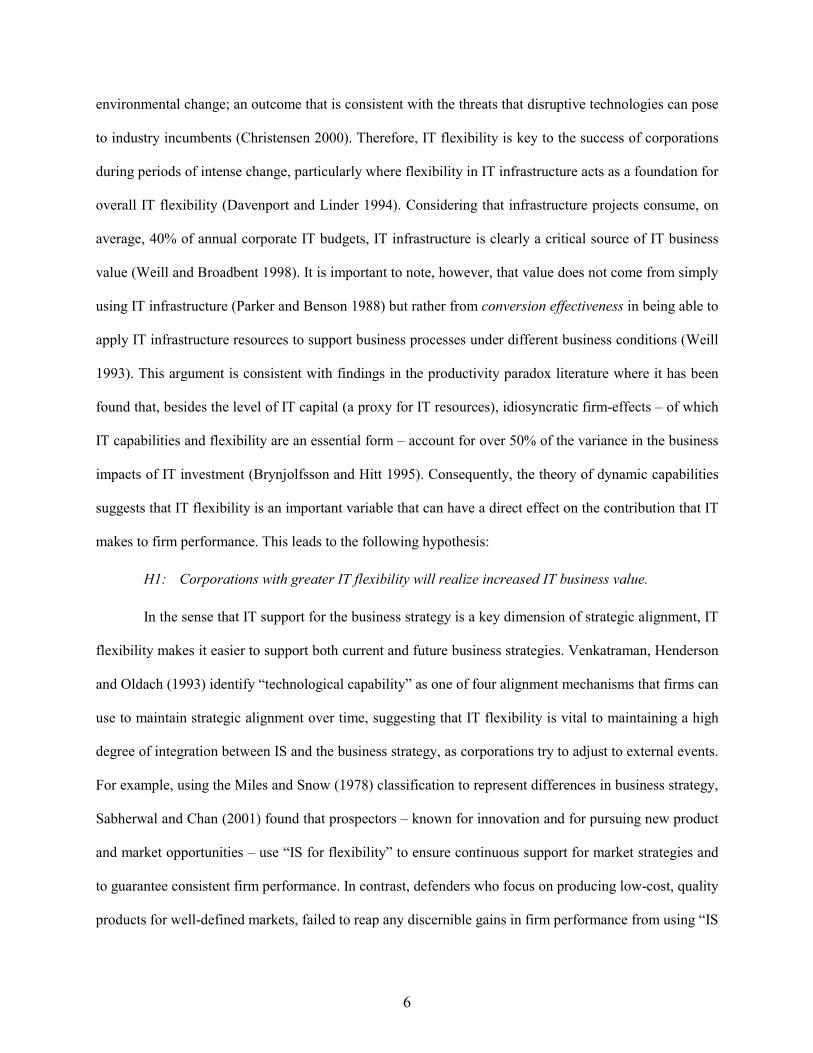
environmental change; an outcome that is consistent with the threats that disruptive technologies can pose
to industry incumbents (Christensen 2000). Therefore, IT flexibility is key to the success of corporations
during periods of intense change, particularly where flexibility in IT infrastructure acts as a foundation for
overall IT flexibility (Davenport and Linder 1994). Considering that infrastructure projects consume, on
average, 40% of annual corporate IT budgets, IT infrastructure is clearly a critical source of IT business
value (Weill and Broadbent 1998). It is important to note, however, that value does not come from simply
using IT infrastructure (Parker and Benson 1988) but rather from conversion effectiveness in being able to
apply IT infrastructure resources to support business processes under different business conditions (Weill
1993). This argument is consistent with findings in the productivity paradox literature where it has been
found that, besides the level of IT capital (a proxy for IT resources), idiosyncratic firm-effects – of which
IT capabilities and flexibility are an essential form – account for over 50% of the variance in the business
impacts of IT investment (Brynjolfsson and Hitt 1995). Consequently, the theory of dynamic capabilities
suggests that IT flexibility is an important variable that can have a direct effect on the contribution that IT
makes to firm performance. This leads to the following hypothesis:
H1: Corporations with greater IT flexibility will realize increased IT business value.
In the sense that IT support for the business strategy is a key dimension of strategic alignment, IT
flexibility makes it easier to support both current and future business strategies. Venkatraman, Henderson
and Oldach (1993) identify “technological capability” as one of four alignment mechanisms that firms can
use to maintain strategic alignment over time, suggesting that IT flexibility is vital to maintaining a high
degree of integration between IS and the business strategy, as corporations try to adjust to external events.
For example, using the Miles and Snow (1978) classification to represent differences in business strategy,
Sabherwal and Chan (2001) found that prospectors – known for innovation and for pursuing new product
and market opportunities – use “IS for flexibility” to ensure continuous support for market strategies and
to guarantee consistent firm performance. In contrast, defenders who focus on producing low-cost, quality
products for well-defined markets, failed to reap any discernible gains in firm performance from using “IS

7
for efficiency” to support a niche strategy. This result complements our earlier discussion of the potential
for tradeoff between flexibility and strategic alignment suggesting that corporations can use IT flexibility
to improve integration between IS and the business strategy, while for corporations lacking IT flexibility,
the path to realizing improved business value from strategic alignment is much more difficult (Weill et al.
2002). These arguments lead to the following hypothesis:
H2: Corporations with greater IT flexibility will achieve tighter strategic alignment.
Besides using IT to support existing business activities, the IS literature increasingly recognizes
the proactive ability of IT to create new business opportunities outside the existing business strategy. For
example, IT can allow a corporation to identify new market segments and to design innovative marketing
plans (Pine et al. 1995; Porter and Millar 1985). In the area of operations, IT is credited with enabling
flexible manufacturing and with creating significant potential for cost savings through flexible production
systems (Sethi and Sethi 1990; Srinivasan et al. 1994). While these examples illustrate the actual use of
IT capabilities, other researchers have focused on having the flexibility or potential to use IT capabilities.
For example, Sanchez (1995) argues that, “strategic flexibility depends jointly on the inherent flexibilities
of the resources available to the firm and on the firm’s flexibilities in applying those resources” (p. 138).
Sambamurthy (2000) argues that IT resources and capabilities enable strategic flexibility by lowering the
cost of pursuing new market opportunities, while in the area of IT infrastructure design, Fichman (2002)
notes that IT flexibility facilitates different IT infrastructure configurations that satisfy the future needs of
the business. Implicit in these opinions is the argument that IT flexibility gives a firm the option to deploy
its IT resources and capabilities in a number of ways, based on their business needs and the degree of
environmental uncertainty. Considering the need for fit between the environment and business strategy
(Venkatraman and Prescott 1990), corporations may want flexibility in how they adapt their business
strategy to fit with a changing environment. If IT flexibility exists, corporations may see an improvement
in their ability to react to environmental change by having the option to change their business strategy.
Within the framework of the theory of dynamic capabilities, we can then argue that capabilities in the area

8
of flexibility can be linked in such a way that IT options or IT flexibility can provide corporations with
strategic options or strategic flexibility in how they respond to environmental change. Hence:
H3: Corporations with greater IT flexibility will have greater strategic flexibility.
2.2 Performance Impacts of Strategic Flexibility
Although strategic alignment has traditionally been viewed as a unidimensional variable denoting
IT support for the business strategy, recognition of the strategic capabilities of IT has allowed strategic
alignment to take on a multi-dimensional theme, reflecting the bi-directional relationship between IS and
the business strategy. In the same way that IT has evolved to support business strategy, corporations have
seen the potential to evolve or develop the business strategy to take account of their IT capabilities (Itami
and Numagami 1992; Rockart and Scott-Morton 1984). These bi-directional links can, however, move at
a different pace so a perfect state of alignment may never be achieved. This perspective is consistent with
Broadbent and Weill (1993) who argue that, “non-alignment is the natural state of organizations and
strategic alignment is temporal in nature” (p. 177). This implies that strategic alignment is an ongoing,
evolutionary process that may benefit from both IT flexibility and strategic flexibility (Henderson and
Venkatraman 1993). Therefore, an absence of strategic alignment could be due to a failure to support the
business strategy (perhaps because of a lack of IT resources) or to an inability to evolve the business
strategy to take advantage of IT capabilities (perhaps because of organizational structure issues that have
given rise to a lack of strategic flexibility). This leads to the following hypothesis:
H4: Corporations with greater strategic flexibility will achieve tighter strategic alignment.
Where corporations already possess an abundance of IT resources and capabilities and attempt to
make greater use of those resources and capabilities through the creation of new business opportunities, it
seems likely that the corporation will enjoy a gain in the contribution that IT makes to firm performance.
Researchers have already argued that strategic flexibility contributes to competitive advantage (Hitt et al.
1998) and to firm performance (Paik and Jacobson 2002). Strategic flexibility that makes greater use of
existing IT resources and capabilities will arguably contribute to greater IT business value. Therefore:

9
H5: Corporations with greater strategic flexibility will realize increased IT business value.
2.3 Achieving IT Business Value from Strategic Alignment
Although strategic alignment and IT business value are often seen as separate issues, researchers
have argued that a corporation’s inability to realize sufficient value from its IT investments is due in part
to an absence of strategic alignment (Henderson and Venkatraman 1993). Research has indeed shown that
strategic alignment is positively associated with IS effectiveness (Chan et al. 1997; Ma et al. 1998), firm
performance (Chan et al. 1997), competitive advantage (Kearns and Lederer 2001) and IT business value
(Tallon et al. 2000). While these studies examined the business impacts of strategic alignment through a
single time period or static lens, recent research has found that efforts to maintain strategic alignment over
time can sometimes falter for reasons of paradoxical decisions, excessive transformations, and uncertain
turnarounds (Hirschheim and Sabherwal 2001; Sabherwal et al. 2001). The question, therefore, is whether
there is a sustainable relationship between strategic alignment and IT business value as corporations try to
adjust their IS and business strategy to take account of environmental change. This leads to the following
hypothesis:
H6: Corporations with tighter strategic alignment will realize increased IT business value.
3. Data and Methodology
In order to test the foregoing hypotheses, during the latter months of 2002, we mailed a four-page
survey to a sample of IT executives in 1,600 small and medium-sized4 U.S. firms, randomly drawn from a
population of 2,826 firms, identified in Compustat as having year 2000 revenues between $100 million
and $3 billion5. The survey was directed at the most senior IT executive in each firm, identified in a Fall
2002 directory of IT executives compiled by Applied Computer Research. Responses were received from
4 Our decision to focus on small and medium-sized corporations was motivated in large part by the argument that
smaller corporations tend to be more nimble and agile than larger firms. Combined with the fact that small firms enjoy a disproportionate return on their IT investment (Brynjolfsson et al. 1994) led us to question if flexibility was somehow facilitating these higher returns from IT.
5 The U.S. Bureau of Labor Statistics defines small and medium-sized firms (SMEs) as having fewer than 1,000 employees. However, as financial information is unlikely to be available for many smaller, privately held firms, we decided to expand this definition to include a wider population for which financial data would be available.

10
208 corporations, yielding an overall response rate of 13%, with average 2001 revenues of $906 million –
summary characteristics of our 208 responses are shown in Table 1. To test for non-response bias, we ran
a one-way analysis of variance (ANOVA) on data for revenues and profits. The results from that analysis
confirmed that our responses are representative of the firms in our sample and in the population. Further
analysis also confirmed the absence of respondent and industry effects.
Table 1. Characteristics of the Responses (N=208) Variable Frequency Percent Revenues (2001)
Less than $100m 13 6.4 $100m − $250m 68 32.5 $250m − $500m 47 22.7 $500m − $1b 36 17.2 $1b − $3b 42 20.2 More than $3b 2 1.0
Industry Group Pharmaceuticals 11 5.3 Metals & Plastics 13 6.3 Business & Professional Services 19 9.1 Finance, Insurance & Real Estate 36 17.3 Wholesale / Retail 40 19.2 Electronic & Computing Machinery 60 28.9 Other 29 13.9
Respondents CIO 77 37.0 IT Director 43 20.7 SVP, VP Information Technology 38 18.3 CFO 22 10.6 Other VP 12 5.8 IT Manager 16 7.6
3.1 Measuring IT Flexibility
IT flexibility was measured using a subset of the items tested and validated by Byrd and Turner
(2000). These items reflected prior work by Duncan (1995) where IT infrastructure flexibility was defined
in terms of three dimensions: connectivity, compatibility and modularity. Connectivity and compatibility
are closely linked to the notion of reach and range (Keen 1991) where the focus is on sharing a common
set of IT resources (hardware, software and data) with internal and external users. In this way, Byrd and
Turner (2000) define connectivity as “the ability of any technology component to attach to any of the

11
other components inside and outside the organizational environment” (p. 171) while compatibility is “the
ability to share any type of information across any technology component” (p. 171). Finally modularity is
defined as “the ability to add, modify and remove any software, hardware or data components of the
infrastructure with ease and with no major overall effect” (p. 171). This emphasizes software reuse, rapid
systems development and use of open standards. Using these three constructs, we created a set of 15 items
– five items per construct – to assess the degree of flexibility in IT infrastructure (all items are shown in
the appendix). Using a 7-point Likert scale, respondents were asked to identify their agreement with each
item, where 1 denotes “do not agree” and 7 denotes “agree completely”.
Table 2. Factor Analysis (IT Flexibility) N=208.
Survey Items Modularity Compatibility Connectivity Mod3 0.781 Mod5 0.751 Mod2 0.716 Mod4 0.618 Mod1 0.603 Comp2 0.728 Comp3 0.725 Comp1 0.592 Comp4 0.515 Comp5 0.459 Connect3 0.829 Connect4 0.660 Connect5 0.566 Connect2 0.729 0.397 Connect1 0.727 0.350 Eigenvalue 6.008 1.345 1.079 Variance Explained 40.05% 8.97% 7.19% Cronbach’s Alpha* 0.834 0.715 0.748
* Reliability is computed on the basis that the survey items, connect1 and connect2, load on connectivity rather than modularity.
To test if the 15 IT flexibility items would factor into their respective dimensions, we performed
an exploratory factor analysis (principal component analysis with varimax rotation). As shown in Table 2,
a three-factor structure emerged explaining 56.21% of the total variance. Two of the items (connect1: our
system has a high degree of systems inter-connectivity, and connect2: our systems are sufficiently flexible
to incorporate electronic links to external parties) loaded on modularity rather than connectivity. On the

12
basis of face validity and considering the size of the cross-loadings on connectivity, we opted to retain the
original structure and allow both items to load on connectivity.6 Reliability for each construct was greater
than 0.70, which Nunnally (1978) notes is acceptable in the initial stages of survey-based research.
3.2 Measuring Strategic Flexibility
Strategic flexibility was measured using 8 items derived from prior research by Nemetz and Fry
(1988), Sethi and Sethi (1990) and Sanchez (1995). These items emphasized process development (i.e.,
changes in capacity based on demand fluctuation, market expansion, product and service pricing changes,
launching new products and services, process efficiency (i.e., adoption of new technology and supplier
selection), and product and service development (i.e., mass customization, and product and service mix).
For each item, respondents were asked to assess the extent to which their corporation could easily
and quickly perform each activity. Responses were measured using a 7-point Likert scale where 1 denotes
“do not agree” and 7 denotes “agree completely”. In analyzing the responses, exploratory factor analysis
found a single factor that explained 42.1% of the total variance. Cronbach’s alpha was measured at 0.79.
3.3 Measuring Strategic Alignment
Consistent with the approach adopted by Chan et al. (1997), we measured strategic alignment as a
series of interaction terms between multiple measures of business strategy and multiple measures of IS
strategy. However, where Chan et al. (1997) focused on different types of strategic orientation as a proxy
for business strategy (based on research by Venkatraman 1989a), we focused instead on how strategy had
been implemented at the process level by asking each respondent to assess the extent to which critical
business activities has been implemented in six key areas or processes of the value chain, i.e., process
planning, supplier relations, production and operations, product and service enhancement, marketing and
sales, and customer relations (Porter 1985). Each question used a 7-point Likert scale where 1 denotes
6 To determine if this correction biased the factor structure, we used structural equation modeling with EQS to
perform a confirmatory factor analysis of the 15 survey items. The fit of the resulting model with three latent constructs denoting modularity, compatibility and connectivity, reveals that the factor structure is appropriate (χ2 = 188.4, df = 87, p<0.001; CFI = 0.91). Structural equation modeling was also used to test for convergent and discriminant validity. Once again, no problems were encountered.

13
“not implemented” and 7 denotes “fully implemented”. IS strategy was then operationalized as IT support
for these six process-oriented measures of business strategy. Once again, a 7-point Likert scale was used
where 1 denotes “low IT use” and 7 denotes “high IT use” – all questions are shown in the appendix.
Figure 1. Computing Strategic Alignment from Strategy Measures
With six measures of business strategy and six measures of IT support for the business strategy,
we computed six interaction or product terms7 to represent strategic alignment.8 We then rescaled each
process-oriented measure of strategic alignment to fit within the range 0 to 1. As shown in Figure 1, each
process-oriented measure of strategic alignment closely tracked the corresponding items for both business
and IS strategy. The average measure of alignment was 0.45, indicating that there is still significant scope
for improvement in virtually all processes within the value chain.
7 The precise functional form of the strategic alignment interaction term can be complex (Venkatraman 1989b).
For example, interaction can be modeled as a product (XY) of the business (X) and IS strategy (Y) items or as a more complex functional form based on parabolic curvilinearity (for example, X2+Y2+XY). We tested a variety of functional forms in our model but found that the overall structure of the results remained unchanged from that given by the simpler XY term. We, therefore, decided to model strategic alignment as a product term.
8 We tested this approach to measuring strategic alignment in 2000 using data collected from CIOs and strategic planners through matched surveys. In that research, we measured business strategy using 30 intra-process items (six processes, five items per process). Similarly, IS strategy was measured using 30 intra-process items that mapped directly to the 30 business strategy items. Based on factor analysis and reliability scores, we determined that business strategy and IS strategy could each be measured using six items (one item per process), rather than 30 intra-process items. We also found through inter-rater reliability that a single respondent could be used.
����������������������������������������������������������������������
���������������������������������������������������������������������������������
���������������������������������������������������������������
������������������������������������������������������������������������������������������
���������������������������������������������������������������������������������
������������������������������������������������������������������������������������������������������������������������
��������������������������������������������������������������������������������
���������������������������������������������������������������
���������������������������������������������������������������������������������������������������
���������������������������������������������������������������������������������
���������������������������������������������������������������������������������������������������
������������������������������������������������������������������������������������������������������������������������������������������������
3.0
3.5
4.0
4.5
5.0
5.5
6.0
Marketing &Sales
Product / ServiceEnhancement
SupplierRelations
ProcessPlanning
CustomerRelations
Production &Operations
Busi
ness
and
IS S
trate
gy (1
-7)
0.3
0.4
0.4
0.5
0.5
0.6
0.6
Strategic Alignment (0-1)
�����������IS Strategy
�����������Business Strategy Strategic Alignment
14
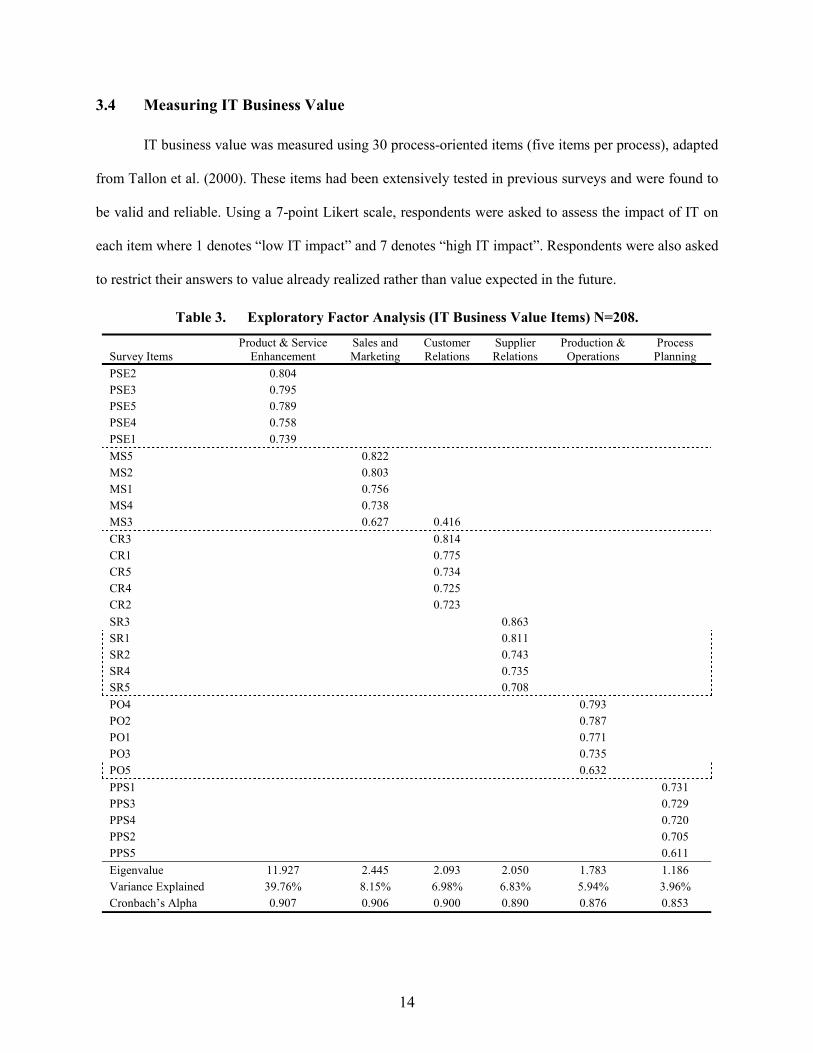
3.4 Measuring IT Business Value
IT business value was measured using 30 process-oriented items (five items per process), adapted
from Tallon et al. (2000). These items had been extensively tested in previous surveys and were found to
be valid and reliable. Using a 7-point Likert scale, respondents were asked to assess the impact of IT on
each item where 1 denotes “low IT impact” and 7 denotes “high IT impact”. Respondents were also asked
to restrict their answers to value already realized rather than value expected in the future.
Table 3. Exploratory Factor Analysis (IT Business Value Items) N=208.
Survey Items
Product & Service Enhancement
Sales and Marketing
Customer Relations
Supplier Relations
Production & Operations
Process Planning
PSE2 0.804 PSE3 0.795 PSE5 0.789 PSE4 0.758 PSE1 0.739 MS5 0.822 MS2 0.803 MS1 0.756 MS4 0.738 MS3 0.627 0.416 CR3 0.814 CR1 0.775 CR5 0.734 CR4 0.725 CR2 0.723 SR3 0.863 SR1 0.811 SR2 0.743 SR4 0.735 SR5 0.708 PO4 0.793 PO2 0.787 PO1 0.771 PO3 0.735 PO5 0.632 PPS1 0.731 PPS3 0.729 PPS4 0.720 PPS2 0.705 PPS5 0.611 Eigenvalue 11.927 2.445 2.093 2.050 1.783 1.186 Variance Explained 39.76% 8.15% 6.98% 6.83% 5.94% 3.96% Cronbach’s Alpha 0.907 0.906 0.900 0.890 0.876 0.853

15
To test if the 30 business value items would factor into their respective processes, we performed a
principal components analysis with varimax rotation. As shown in Table 3, a six-factor structure emerged
explaining 71.62% of the total variance. All 30 items factored under their respective process headings.
Reliability was also assessed using Cronbach’s Alpha and in each case was found to exceed a suggested
minimum of 0.70 (Nunnally 1978).9
3.4 Strategic Intent for IT
Differences in corporate goals or strategic intent for IT could play an important role in identifying
how corporations consider flexibility and strategic alignment. Porter (1996) argues that strategic focus is
related to firm performance via operational effectiveness (performing similar activities better than rivals)
and strategic positioning (performing different activities to rivals or performing similar activities but in a
very different way). As shown in Figure 2, this contrast allows us to create a two-dimensional framework
using “low” to “high” scales, to represent possible differences in strategic intent for IT.
Figure 2. Classification of Firms by Strategic Intent for IT
For example, firms in the lower left quadrant have little or no focus on operational effectiveness
or strategic positioning and so are labeled unfocused as a way to highly their apparent indifference to IT.
9 As before, we used structural equation modeling to perform a confirmatory factor analysis of the 30 items with
six latent variables. The fit of this model further confirmed that the 30 IT business value items factor correctly (χ2 = 567.27, df = 390, p<0.001; CFI = 0.92). We also found support for convergent and discriminant validity.
Low
High
Operational Effectiveness
Operations-Focus
Low High Strategic Positioning
Goals for IT emphasize cost control, quality and speed, productivity, throughput and enhancing effectiveness.
Dual-Focus Goals for IT emphasize both operations and market needs; mature use of IT directed at competitive advantage.
Unfocused IT is not seen as critical to thebusiness strategy; goals for ITlack direction and direction;firms are indifferent to IT.
Market-Focus Goals for IT focus on creating new markets, growing current markets, and changing market and industry practices.

16
In contrast, firms in the upper left quadrant have well-defined goals around operational effectiveness, but
have relatively less focus on using IT for strategic positioning. We label these firms as operations-focus
to denote their use of IT to control operating costs and to boost operating effectiveness through quality,
speed, flexibility and time-to-market. Firms in the lower right quadrant have a reverse emphasis on IT –
they focus on using IT for strategic positioning rather than operational effectiveness. These market-focus
firms use IT for strategic positioning in order to built a value proposition for their customer base. While
market-focus firms concentrate on more external or market-based initiatives, they may still be proficient
at using IT in operations though this is purely a way to support their market-oriented needs. Finally, in the
upper right quadrant, firms reveal a dual-focus on both operational effectiveness and strategic positioning.
Strategic intent for IT was measured using four items adapted from Tallon et al. (2000) – two
items identified goals for IT in the area of operational effectiveness, while two items focused on strategic
positioning. Respondents were asked to rate their agreement with each item on a 7-point Likert scale
where 1 denotes “do not agree” and 7 denotes “agree completely”. Based on the responses to these items,
firms were assigned to one of four quadrants shown in Figure 2. For example, if respondents rated four or
below on each item, they were assigned to the unfocused group as their responses suggested they had no
clear goals for IT. Respondents who rated five or above on both operational effectiveness items and four
or below on both strategic positioning items were labeled operations-focus. Respondents who rated five
or above on the strategic positioning items and four or below on the operational effectiveness items were
labeled market-focus. Finally, where respondents rated five or above on all four items, they were labeled
dual-focus. In this way, the 208 corporations in our study were assigned as follows: unfocused: 23 (11%);
operations-focus: 109 (52%); market-focus: 12 (6%); dual-focus: 64 (31%).
Table 4. Discriminant Analysis on Goals for IT
Focus Type Actual Predicted Correct Unfocused 23 25 20 (87.0%) Operations-focus 109 100 95 (87.2%) Market-focus 12 19 9 (75.0%) Dual-focus 64 64 54 (84.4%) Total 208 208 178 (85.6%)

17
To assess the robustness of our classification approach, we performed a discriminant analysis on
the four items. As shown in Table 4, our analysis correctly predicted 85.6% of our case assignments, and
so we decided to retain our initial classification.10 It is worth noting that over half of our respondents are
operations-focus reflecting the dominant goal of using IT to reduce costs, improve productivity, speed and
efficiency. Relatively few corporations were classified as unfocused confirming that the majority of firms
have specific goals for IT. There were also relatively few market-focus firms suggesting that in order for
firms to develop competencies in using IT to create new markets and extend existing markets, they must
have already an established focus on using IT to drive operational efficiency.
Table 5. Differences based on Strategic Intent for IT (N=208) Conceptual Model Constructs
Number of Items
Unfocused
Operations Focus
Market Focus
Dual Focus
Analysis of Variance
Strategy Alignment Process Planning and Support 1 0.29 0.42 0.39 0.56 11.386 *** Supplier Relations 1 0.38 0.40 0.44 0.49 02.768 ** Production and Operations 1 0.37 0.56 0.58 0.65 11.243 *** Product / Service Enhancement 1 0.24 0.34 0.39 0.58 24.981 *** Sales and Marketing 1 0.32 0.34 0.40 0.52 09.914 *** Customer Relations 1 0.34 0.43 0.48 0.55 05.424 ***
Average 0.32 0.42 0.45 0.55 18.500 *** IT Business Value
Process Planning and Support 5 3.68 4.42 4.98 5.04 11.922 *** Supplier Relations 5 3.11 3.92 4.60 4.62 10.262 *** Production and Operations 5 3.85 4.70 4.80 5.27 10.646 *** Product / Service Enhancement 5 2.69 3.72 4.07 4.79 18.547 *** Sales and Marketing 5 2.97 3.60 4.29 4.55 13.276 *** Customer Relations 5 3.17 4.35 4.68 4.97 14.714 ***
Average 3.25 4.12 4.58 4.88 26.376 *** IT Flexibility
Modularity 5 3.56 4.19 4.42 4.89 07.552 *** Compatibility 5 3.64 4.21 4.68 5.12 13.611 *** Connectivity 5 4.49 5.00 5.18 5.68 08.985 ***
Strategic Flexibility Changes in Aggregate Demand 1 3.83 4.62 4.42 5.23 08.443 *** Mass Customization 1 4.57 5.08 4.83 5.11 00.809 NS Product and Service Launch 1 3.96 4.40 4.00 4.88 04.918 *** Market Expansion 1 4.87 5.36 4.50 5.58 03.597 ** Pricing Schedules 1 4.30 4.33 3.83 5.22 05.986 *** Product and Service Mix 1 4.35 4.36 3.83 5.13 06.215 *** Product and Service Innovation 1 3.35 4.19 4.00 4.83 08.674 *** Switch Suppliers 1 4.65 4.59 4.08 5.23 04.125 ***
NS: not significant * p < 0.1 ** p < 0.05 *** p < 0.01
10 A further test is to use k-means cluster analysis (k=4). This approach returned the following cluster membership
information: unfocused: 34 (16%), operations-focus: 83 (40%), market-focus: 22 (11%) and dual-focus: 69 (33%), and had a 70% overlap with our original classification.

18
We also reviewed differences in our data and constructs using a one-way analysis of variance by
strategic intent for IT. As shown in Table 5, there are significant differences between the four groups for
all but one of the variables in our study. These differences are interesting in several respects. First, as
corporations expand their focus or strategic intent from IT, from unfocused through dual-focus, they are
rewarded with increased payoffs from IT. Second, strategic alignment increases as corporations expand
their focus around IT. Third, IT flexibility also increases as focus expands, though particularly in the area
of connectivity. Fourth, market-focus firms report lower levels of strategic flexibility than operations and
dual-focus firms. Given the announced market orientation of these firms, the lack of strategic flexibility is
a concern that highlights potential risks from market fluctuations.
Overall, these differences reveal an interesting pattern and lead us to question whether the nature
of the relationships between flexibility, strategic alignment and IT business value may vary in intensity
and importance based on corporations’ espoused strategic intent for IT. For example, unfocused firms are
unlikely to consider strategic alignment as a strategic priority, and therefore, IT flexibility may not be the
subject of managerial attention. In contrast, dual-focus firms are clearly focused on using IT for strategic
ends, and so there may be a more concrete association between flexibility, strategic alignment and payoffs
from IT.
3.5 Model Estimation
To estimate the relationships in our conceptual model, we used structural equation modeling with
PLS.11 PLS offers several advantages over covariance-based techniques used in software packages such
as EQS and Lisrel (Chin and Newsted 1999). For example, PLS is not stymied by sample size issues that
sometimes restrict covariance modeling. As a rule of thumb, we would need 350 responses to estimate our
model using EQS or Lisrel, significantly more than our 208 responses. In addition, PLS does not make
distribution assumptions regarding the observed variables, although non-normality was not an issue here
as Kolmogorov-Smirnov tests were insignificant for all variables.
11 The software used was PLS Graph, version 2.91.03.04 (beta) by Wynne W. Chin and Timothy A. Frye.
19
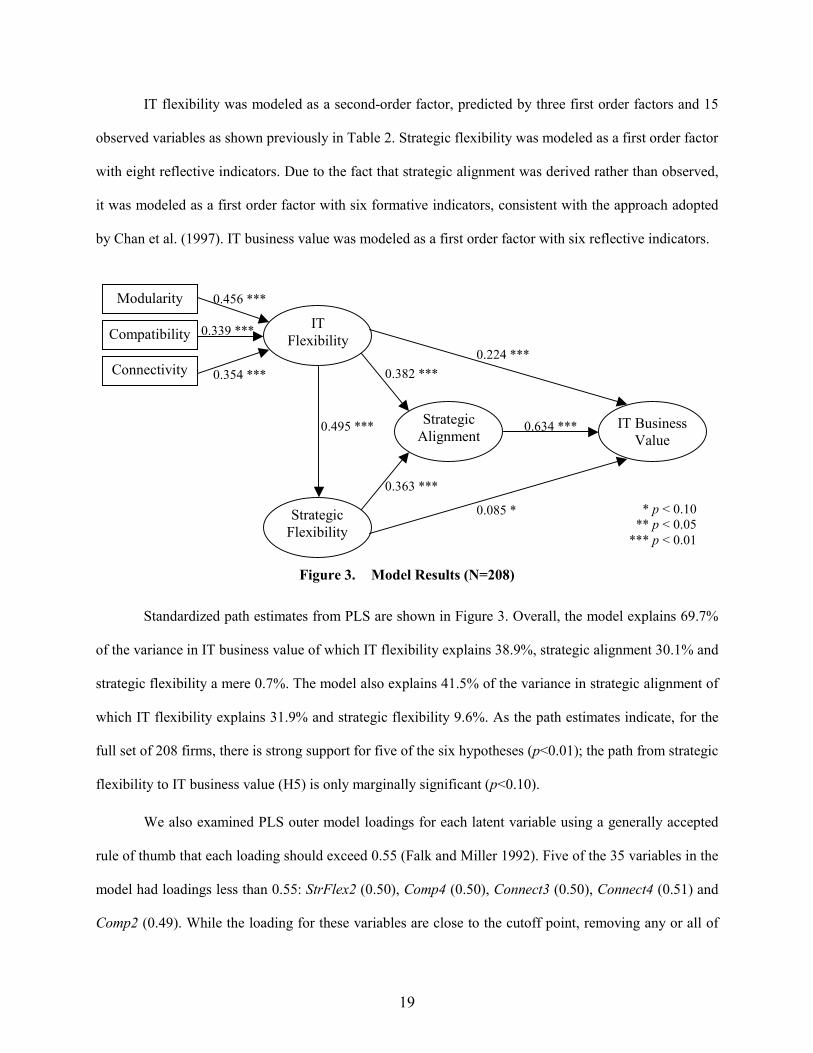
IT flexibility was modeled as a second-order factor, predicted by three first order factors and 15
observed variables as shown previously in Table 2. Strategic flexibility was modeled as a first order factor
with eight reflective indicators. Due to the fact that strategic alignment was derived rather than observed,
it was modeled as a first order factor with six formative indicators, consistent with the approach adopted
by Chan et al. (1997). IT business value was modeled as a first order factor with six reflective indicators.
Figure 3. Model Results (N=208)
Standardized path estimates from PLS are shown in Figure 3. Overall, the model explains 69.7%
of the variance in IT business value of which IT flexibility explains 38.9%, strategic alignment 30.1% and
strategic flexibility a mere 0.7%. The model also explains 41.5% of the variance in strategic alignment of
which IT flexibility explains 31.9% and strategic flexibility 9.6%. As the path estimates indicate, for the
full set of 208 firms, there is strong support for five of the six hypotheses (p<0.01); the path from strategic
flexibility to IT business value (H5) is only marginally significant (p<0.10).
We also examined PLS outer model loadings for each latent variable using a generally accepted
rule of thumb that each loading should exceed 0.55 (Falk and Miller 1992). Five of the 35 variables in the
model had loadings less than 0.55: StrFlex2 (0.50), Comp4 (0.50), Connect3 (0.50), Connect4 (0.51) and
Comp2 (0.49). While the loading for these variables are close to the cutoff point, removing any or all of
Strategic Alignment
IT Business Value
IT Flexibility
Strategic Flexibility
Modularity
Compatibility
Connectivity 0.224 ***
0.085 *
0.382 ***
0.363 ***
0.495 *** 0.634 ***
0.339 ***
0.354 ***
0.456 ***
* p < 0.10 ** p < 0.05
*** p < 0.01
20
the variables had almost no impact on any of the path estimates and so the overall structure of the results
is unchanged. As a further test of the robustness and validity of the model, we examined statistical power
assuming a large effect size and a 0.05 significance level (see Chin and Newsted (1999) for a discussion
of power in PLS models). Where power is measured on the basis of the number of independent constructs
in the model, our analysis shows that a sample size of 208 returns a power level of 1.0. Even with a more
conservative medium effect size, statistical power remains high at 0.99.12
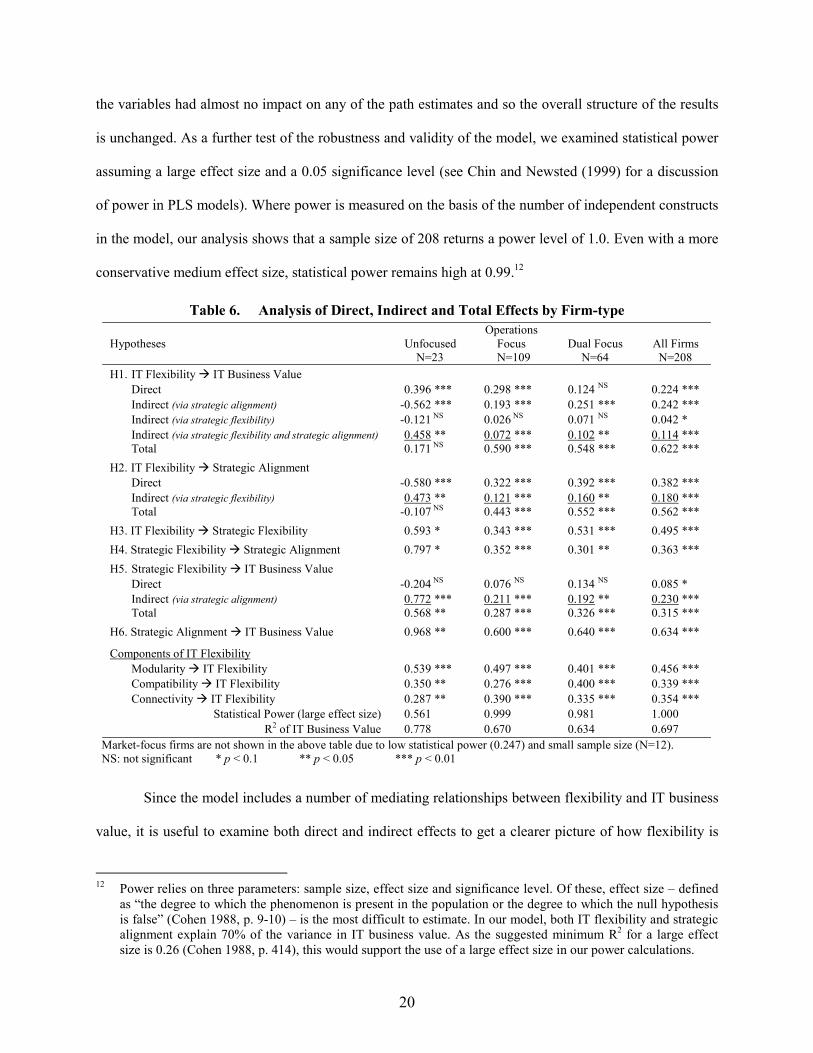
Table 6. Analysis of Direct, Indirect and Total Effects by Firm-type Hypotheses
Unfocused
Operations Focus
Dual Focus
All Firms
N=23 N=109 N=64 N=208 H1. IT Flexibility IT Business Value
Direct -0.396 *** 0.298 *** 0.124 NS 0.224 *** Indirect (via strategic alignment) -0.562 *** 0.193 *** 0.251 *** 0.242 *** Indirect (via strategic flexibility) -0.121 NS 0.026 NS 0.071 NS 0.042 * Indirect (via strategic flexibility and strategic alignment) -0.458 ** 0.072 *** 0.102 ** 0.114 *** Total -0.171 NS 0.590 *** 0.548 *** 0.622 ***
H2. IT Flexibility Strategic Alignment Direct -0.580 *** 0.322 *** 0.392 *** 0.382 *** Indirect (via strategic flexibility) -0.473 ** 0.121 *** 0.160 ** 0.180 *** Total -0.107 NS 0.443 *** 0.552 *** 0.562 ***
H3. IT Flexibility Strategic Flexibility -0.593 * 0.343 *** 0.531 *** 0.495 *** H4. Strategic Flexibility Strategic Alignment -0.797 * 0.352 *** 0.301 ** 0.363 *** H5. Strategic Flexibility IT Business Value
Direct -0.204 NS 0.076 NS 0.134 NS 0.085 * Indirect (via strategic alignment) -0.772 *** 0.211 *** 0.192 ** 0.230 *** Total -0.568 ** 0.287 *** 0.326 *** 0.315 ***
H6. Strategic Alignment IT Business Value -0.968 ** 0.600 *** 0.640 *** 0.634 ***
Components of IT Flexibility Modularity IT Flexibility -0.539 *** 0.497 *** 0.401 *** 0.456 *** Compatibility IT Flexibility -0.350 ** 0.276 *** 0.400 *** 0.339 *** Connectivity IT Flexibility -0.287 ** 0.390 *** 0.335 *** 0.354 ***
Statistical Power (large effect size) -0.561 0.999 0.981 1.000 R2 of IT Business Value -0.778 0.670 0.634 0.697
Market-focus firms are not shown in the above table due to low statistical power (0.247) and small sample size (N=12). NS: not significant * p < 0.1 ** p < 0.05 *** p < 0.01
Since the model includes a number of mediating relationships between flexibility and IT business
value, it is useful to examine both direct and indirect effects to get a clearer picture of how flexibility is
12 Power relies on three parameters: sample size, effect size and significance level. Of these, effect size – defined
as “the degree to which the phenomenon is present in the population or the degree to which the null hypothesis is false” (Cohen 1988, p. 9-10) – is the most difficult to estimate. In our model, both IT flexibility and strategic alignment explain 70% of the variance in IT business value. As the suggested minimum R2 for a large effect size is 0.26 (Cohen 1988, p. 414), this would support the use of a large effect size in our power calculations.

21
shaping strategic alignment and IT business value. As shown in Table 6, we identified indirect effects for
each mediating variable and added these to the direct effects, shown in Figure 3, to reveal an overall total
effect. As strategic intent for IT was identified as a control variable, we repeated this analysis for groups
with similar strategic intent for IT – we did not examine market-focus firms, however, as low sample size
(N=12) made the effect estimates unreliable.
As we examine the total effects for the entire sample in Table 6, we note that while IT flexibility
has a significant direct effect on IT business value (0.224), the indirect effect due to strategic alignment
(0.242) is just as important. Direct effects reflect the ability of IT flexibility to increase speed, quality and
responsiveness whereas indirect effects reflect the extra value that IT flexibility can provide by supporting
individual business activities. For example, networked systems can facilitate real-time data sharing which,
in the hands of a customer service specialist, could be used to identify specific customer needs that align
better with a niche market strategy. For firms trying to be the lowest-cost producer, electronic links to key
suppliers could facilitate better inventory management.
Indeed, as we examined direct and indirect effect by firm-type (based on strategic intent for IT),
we found that for dual-focus firms, modularity is key to IT business value in production and operations,
sales and marketing, and customer relations. This is consistent with dual-focus firms’ desire to implement
mass customization models and to dynamically build and evaluate pricing models in response to changing
market conditions. Meanwhile, for operations-focus firms, we found that connectivity and compatibility is
critical to IT business value in supplier relations, and production and operations, confirming the value of
linking to suppliers and of integrating supply chain activities with other parts of the value chain such as
product design and production planning.
We noted also that for unfocused firms, IT flexibility has no overall impact on IT business value.
While the direct effect is positive and significant, this is offset by a negative and significant indirect effect
through strategic flexibility. This suggests that unfocused firms make a tradeoff between IT flexibility and
strategic alignment, but that IT business value is ultimately decided, not by how easily IT can adjust to the
needs of the business, but on whether the business is able to make better use of the existing IT resources.

22
For operations and dual-focus firms, IT flexibility has a positive and significant impact on both
strategic alignment and IT business value confirming that these flexibility and alignment are complements
rather than mutually exclusive (Jarvenpaa and Ives 1993). Meanwhile, for unfocused firms, the lack of a
significant total-effect between IT flexibility, strategic alignment and IT business value suggests that IT
flexibility and strategic alignment are mutually exclusive and denote competing choices for IT executives.
For each of the three groups analyzed, the only impact that strategic flexibility had on IT business
value was when strategic alignment was included as a mediating variable. In some ways, it is possible that
increased strategic flexibility could put pressure on existing IT capabilities. For example, expanding into
new market segments or increasing output in response to increased consumer demand could force the firm
to stretch its existing IT resources, unless there is a commensurate increase in IT investment. This could
help to explain why the direct effect of strategic flexibility on IT business value is relatively insignificant.
Therefore, IT business value can only be improved through strategic flexibility when there is sufficient IT
flexibility (i.e., slack resources or capabilities) available to meet the growing demands of the business.
4. Discussion
Our results indicate that for the majority of firms with defined goals for IT, both IT and strategic
flexibility complement and enhance strategic alignment, rather than creating a tradeoff situation in which
corporations choose between improved flexibility and tighter fit between IT and the business strategy. As
business conditions grow more turbulent and uncertain, these firms will have the option of revising their
business strategy, knowing that their IT infrastructure is sufficiently flexible to support any new business
decisions they may be forced to make. Consequently, IT and strategic flexibility can facilitate a dynamic
state of alignment between IS and the business strategy, leading to what Boynton and Victor (1991) refer
to as dynamically stable corporations. If, on the other hand, business conditions are predictable and stable,
there may be less need for flexibility allowing firms to develop IT competencies in very narrow domains.
By defining strategic alignment as a bi-directional relationship between IS and business strategy,
we show how strategic alignment can be improved by investing in a highly scalable IT infrastructure that

23
can support a wide range of business activities, or by developing new business opportunities that take full
advantage of the known capabilities of the existing IT infrastructure. Strategic alignment can, therefore,
be improved by improving the reach and range of existing IT resources (Keen 1991).
Our results confirm that flexibility is especially important for dual-focus firms on account of their
combined focus on operations and market activities. While our research does not address the issue of how
firms achieve flexibility (other than through modularity, compatibility and connectivity), in conversations
with CIOs at two dual-focus financial services firms, we learned that both pursued IT flexibility through a
best-of-breed architecture supported by highly scalable middleware systems. In one case, this architecture
proved so adaptable that the firm was able to offer excess capacity to other firms in its industry through
an ASP model. In a previous case study at Dell Corporation, we noted that a proposal to implement SAP
was rejected due to concerns for the flexibility of Dell’s direct model and potential restrictions on market
growth (Kraemer et al. 2000). These examples offer some basic insights into how executives think about
flexibility at a strategic and operations level. At the same time, executives acknowledge that the cost of
providing flexibility in the form of unused processing capacity, expensive middleware solutions, security
and data access costs, must be borne by the corporation. Unless there is a clear business need for flexible
IT systems, calls for restraint in IT budgets may force IT executives to limit their spending to projects that
clearly support existing business activities rather than building IT capabilities that may never be used.
4.1 Developing a Framework using IT flexibility and Strategic Alignment
These arguments suggest that future strategic alignment and IT business value can be assessed or
predicted through a two dimensional framework based on the existing state of IT flexibility and strategic
alignment. As shown in Figure 4, firms with low IT flexibility and low strategic alignment are unlikely to
see a recovery in IT business value. Firms with low IT flexibility and high strategic alignment may suffer
a decline in IT business value if adverse change occurs. Meanwhile, firms with high IT flexibility and low
strategic alignment could see some potential for growth in IT business value while corporations with high
IT flexibility and high strategic alignment are ideally positioned for sustained future payoffs from IT.
24
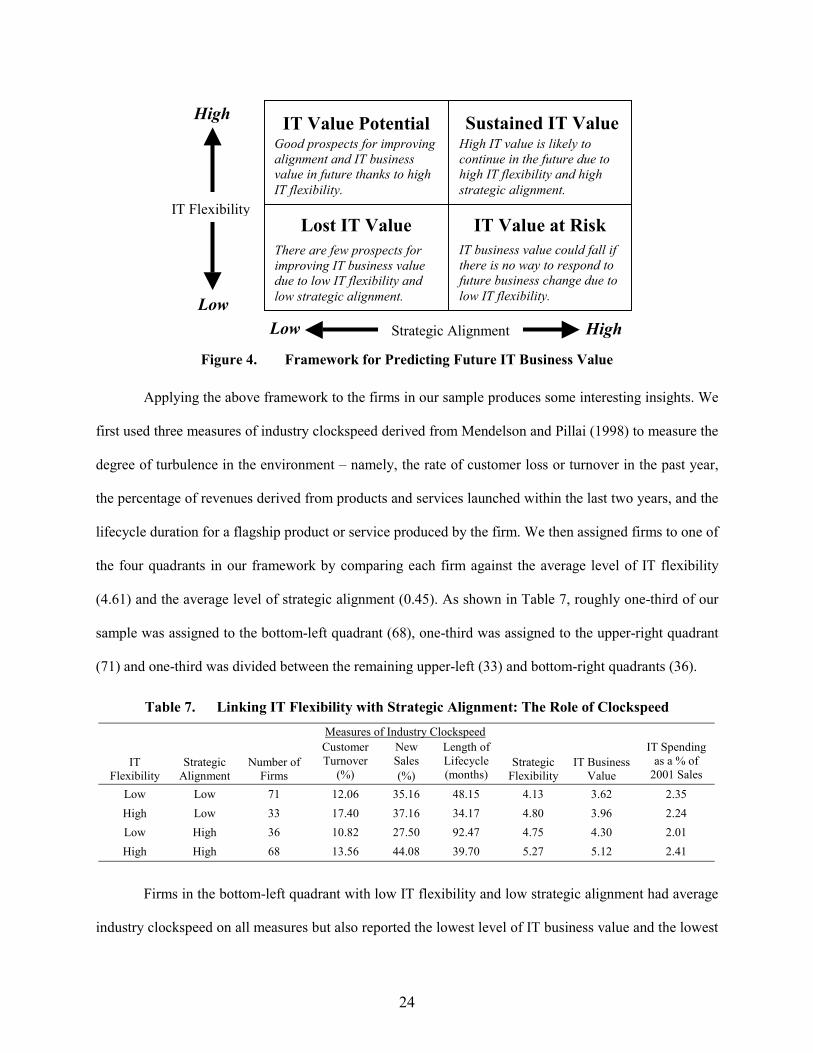
Figure 4. Framework for Predicting Future IT Business Value
Applying the above framework to the firms in our sample produces some interesting insights. We
first used three measures of industry clockspeed derived from Mendelson and Pillai (1998) to measure the
degree of turbulence in the environment – namely, the rate of customer loss or turnover in the past year,
the percentage of revenues derived from products and services launched within the last two years, and the
lifecycle duration for a flagship product or service produced by the firm. We then assigned firms to one of
the four quadrants in our framework by comparing each firm against the average level of IT flexibility
(4.61) and the average level of strategic alignment (0.45). As shown in Table 7, roughly one-third of our
sample was assigned to the bottom-left quadrant (68), one-third was assigned to the upper-right quadrant
(71) and one-third was divided between the remaining upper-left (33) and bottom-right quadrants (36).
Table 7. Linking IT Flexibility with Strategic Alignment: The Role of Clockspeed Measures of Industry Clockspeed
IT
Flexibility
Strategic
Alignment
Number of
Firms
Customer Turnover
(%)
New Sales (%)
Length of Lifecycle (months)
Strategic
Flexibility
IT Business
Value
IT Spending as a % of
2001 Sales Low Low 71 12.06 35.16 48.15 4.13 3.62 2.35 High Low 33 17.40 37.16 34.17 4.80 3.96 2.24 Low High 36 10.82 27.50 92.47 4.75 4.30 2.01 High High 68 13.56 44.08 39.70 5.27 5.12 2.41
Firms in the bottom-left quadrant with low IT flexibility and low strategic alignment had average
industry clockspeed on all measures but also reported the lowest level of IT business value and the lowest
Low
High
IT Flexibility
IT Value Potential
Low High Strategic Alignment
Good prospects for improving alignment and IT business value in future thanks to high IT flexibility.
Sustained IT Value High IT value is likely to continue in the future due to high IT flexibility and high strategic alignment.
Lost IT Value There are few prospects for improving IT business value due to low IT flexibility and low strategic alignment.
IT Value at Risk IT business value could fall if there is no way to respond to future business change due to low IT flexibility.

25
level of strategic flexibility. As regards strategic intent for IT, almost all of the firms in this quadrant are
either unfocused or operations-focus. We also noted that firms in this quadrant spend more on IT as a
percentage of revenues than any other quadrant. While one could argue that these firms may be trying to
spend more to “catch up” with their peers, a more likely scenario is that IT spending is driven by the need
to maintain legacy systems or is suggestive of over-spending on under-performing IT investments.
Firms in the upper-left quadrant, where there is a very high rate of customer turnover, very short
lifecycles and a high degree of reliance on sales from new products and services, may be able to remain
competitive and strategically flexible on account of having high IT flexibility. While current IT business
value is low, these firms are continuing to spend a large percentage of their revenues on IT. A substantial
percentage of these firms are operations-focus, based in either the electronics or financial services sectors.
In contrast, firms in the bottom-right quadrant have very low customer turnover, longer lifecycles
and rely less on sales from new products and services. The bulk of these firms are operations-focus, based
in the wholesale/retail or metals and plastics sectors. Faced with low industry clockspeed and a relatively
stable environment, there is less perceived need for IT flexibility and so the rate of IT spending is lower.
Predictable business conditions help these firms to pursue IT-enabled efficiency and to improve strategic
alignment and so IT business value is higher here than in the previous two quadrants we have discussed.
Finally, firms in the upper-right quadrant have relatively high customer turnover, rely heavily on
sales from new products and services, and have relatively short lifecycles. In terms of strategic intent for
IT, these 68 firms tend to be classified as dual-focus or operations-focus, many of which are based in the
fast paced electronics or financial services sectors. These firms are mature users of IT and while their IT
spending is higher than in other quadrants, much of this spending goes towards strategic IT development.
IT business value is already at high levels while strategic flexibility is also high. Clearly, these firms are
well positioning to sustain their existing high levels of IT business value into the future. Considering that
their industries are changing at a rapid pace, their investment in IT flexibility is likely to enable them to
withstand competitive threats and to maintain premium market positioning.

26
4.2 Making a Tradeoff between IT Flexibility and Strategy Alignment
One of the uses of the above framework is that we can identify instances where corporations have
the ability to make a tradeoff between greater IT flexibility and tighter strategic alignment, specifically in
the upper-left and bottom-right quadrants of the framework. Given the contrast between IT flexibility and
strategic alignment in these quadrants, our analysis shows that this tradeoff is influenced by the degree of
uncertainty in the environment as reflected in the different measures of industry clockspeed.
For example, for firms in the upper-left quadrant, where the pace of change might be described as
frantic, IT flexibility may be a necessity for business survival. Our analysis of recent IT budgets for these
firms revealed a lower percentage of spending on software (32% of annual IT budgets as against 37% for
all other firms) and a higher percentage of spending on services (30% versus 27% for all other firms). It
appears that these firms have made a serious effort to utilize IT outsourcing as a way to introduce critical
flexibility into their business model since industry clockspeed here is the highest overall. They recognize
that their competence may not be in designing agile and flexible IT systems to manage change but rather
in managing relationships with outsourcing vendors who can provide flexibility on an as-needed basis.
This is consistent with the findings of a 2002 report by IDG that identified transformational outsourcing
or outsourcing for flexibility as a growing trend among firms in highly volatile industries (IDG 2002).
A review of strategic alignment in these firms found a paucity of strategic alignment in supplier
relations and product and service enhancement, while strategic alignment is highest in production and
operations. One possibility is that in the area of new product development, these firms are fast-followers
rather than early-stage innovators. We noted that many of the financial services firms in this quadrant are
small regional banks struggling to retain market share and to remain competitive against stronger national
banks, while the electronics firms in this sector are also struggling to maintain a presence in niche markets
that are becoming increasingly crowded. What this confirms is that tight alignment, while beneficial from
an IT value perspective, could impose unwanted constraints on firms trying to keep a step ahead of their
major competitors. Executives may be worried that with the frantic pace of industry change, they may be
27
unable to use IT to respond to competitors where they have become locked into an ineffective or out-
dated business strategy. High strategic alignment in production and operations is clearly needed to be able
to deliver new products and services and IT flexibility is likely concentrated in this area of the value chain
in the form of systems that support mass customization and dynamic pricing structures.
For firms in the bottom-right quadrant, where the pace of industry change and clockspeed is more
relaxed, there may be less need for IT flexibility. We found that strategic alignment is low in the area of
product and service enhancement where there is less need to meet tight development deadlines but is high
in both supplier relations and production and operations. We noted that many of the wholesale/retail firms
in this quadrant operate in stable and established channels where there is a focus on low-cost competition
and, therefore, a need for efficiency and economies of scale. The plastics and metals firms in this quadrant
are an example of firms operating in stable and predictable markets where IT can drive greater efficiency
through key areas of the value chain such as supplier relations and production and operations. Strategic
alignment may be regarded as a competitive necessity in this quadrant while in light of the low pace of
industry clockspeed, IT flexibility may provide capabilities that are unwarranted and cost prohibitive.
These arguments show that a tradeoff between IT flexibility and strategic alignment is possible in
high clockspeed instances (upper-left quadrant) where IT flexibility is clearly needed to accommodate the
fact pace of change but where high strategic alignment may create undesirable technology lock-in. On the
other hand, if industry clockspeed is low, strategic alignment is clearly preferable to IT flexibility and so
no tradeoff is necessary.
4.3 Combining IT Flexibility with Strategy Alignment
In contrast to firms that have viewed IT flexibility and strategic alignment as mutually exclusive,
some firms have been able to combine high IT flexibility with high degrees of integration between IS and
the business strategy. While the pace of industry change remains high, these firms have been able to use
IT flexibility to provide support for a wide range of business activities that can be molded or reconfigured
in response to external change. Such actions represent best practices in being able to use IT flexibility to

28
derive greater fit or integration between IS and the business strategy. Our analysis also noted that these
firms are highly networked with both suppliers and customers confirming the importance of being able to
connect systems and share data across organizational boundaries. Considering the flexibility afforded by
web-based technologies, the advent of web services may appeal to these firms in trying to improve their
ability to communicate with business partners in real time.
Prahalad et al. (2002) argue that managerial effectiveness and knowledge is key to building IT
infrastructure for agility. The ability to enact a sense and respond strategy requires embedded knowledge
of how IT can respond to business challenges. Analysis of the firms in this upper-right quadrant found a
high level of cohesion between IS and business executives, where business executives play an active role
in shaping IS strategy and are openly supportive of using IT for strategic purposes. On the other hand, IT
executives are equally active in shaping business strategy and in promoting the use of IT to solve business
problems. Both groups of executives share a common goal for IT and work together to solve business and
IT issues. On this basis, there is significant scope for collaboration and knowledge sharing that can make
each group of executives aware of their respective future business and IT needs.
For firms that value strategic alignment, one of the interesting challenges in implementing IT
flexibility is not just the ability to add IT resources as and when needed, but knowing when and how to
retire excess IT resources once they have outlived their usefulness or when their continued use is likely to
lead to excessive cost levels. Dawn Lepore, CIO at Charles Schwab & Co. noted that one of Schwab’s
primary challenges in the period following the 2000 market downturn was knowing how much processing
capacity to retire without compromising customer service and the ability to re-install key application
servers and capacity should the fall in trading activity suddenly reverse (Jones 2001). For leading-edge
firms like Schwab, there is a fine line between having IT flexibility and maintaining strategic alignment.
5. Conclusion
The use of this framework and the results of our earlier PLS model combine to offer some useful
insights into the theory of dynamic capabilities and the resource based view of the firm. For many firms,

29
IT flexibility is a valuable, firm-specific capability that can contribute to increased payoffs from IT. Our
analysis confirms that the value of IT flexibility is conditional on industry clockspeed, as a proxy for the
pace of environmental change and turbulence. For example, in a stable environment, IT flexibility may be
seen as unnecessary and could, paradoxically, impose a financial burden on the firm that far outstrips any
potential advantage. In contrast, in a dynamic, fast paced environment, firms may see significant value in
IT flexibility from being able to implement IT support for a host of business activities that may undergo
change and reconfiguration based on the degree of change. In such cases, firms may view high degrees of
strategic alignment as imposing undue constraints on their ability to “spin on a dime”. The value created
by IT flexibility, whether in the form of greater IT support for critical business activities or being able to
avoid the opportunity cost from being locked into an ineffective business strategy may exceed the benefits
of tighter strategic alignment. For these firms, IT capabilities around flexibility are key to organizational
survival.
The critical message in the theory of dynamic capabilities is that firms need to create procedures
to ensure that their resource endowment is consistent with the needs of their business environment, while
the resource-based view is chiefly concerned with how firms select and manage heterogeneous resources
that can lead to sustainable competitive advantage. Our contribution to these theoretical perspectives is to
add that IT flexibility can be a dynamic capability, but that this determination is critically dependent on
the environmental conditions facing each firm.
Related to our research questions, this research contributes to the IS literature in three key ways.
First, we offer an empirical assessment of the link between IT flexibility and strategic alignment, showing
that while some firms see both variables as complements, others see them as mutually exclusive. Related
to this, show how IT flexibility can have both direct and indirect effects on IT business value. Second, we
identify how strategic intent or corporate goals for IT can play an important role in how corporations use
IT and strategic flexibility to enhance the fit between IS and business strategy. Third, we show that for all
firms, IT flexibility is a valuable determinant of strategic flexibility, allowing corporations the flexibility

30
to engage in different business activities or to reconfigure their business strategy to conform to the needs
of their environment. By implication, business and IS executives can apply these lessons to reconfirm the
importance of IT and strategic flexibility to their corporations or can identify that while IT flexibility may
be a useful organizational capability, it is not universally required for all firms in all environments.
There are several limitations in this research pertaining to our model design, data and estimation
technique. While our model tries to explain how flexibility will impact strategic alignment, the historical
or path dependent nature of strategic alignment makes it difficult for us to tease apart the marginal impact
of IT flexibility on the change in strategic alignment from one time period to the next. As our dependent
variable, we used IT business value as opposed to firm performance, believing that IT business value is a
better intermediate assessment of strategic alignment. Our data could also be biased owing to the fact that
a single respondent was used in each corporation. We tried to exercise care in developing the items as part
of a matched survey methodology, and while we found a high degree of consistency in how respondents
replied to those test items, there is no guarantee that our respondents in this study were no biased in their
views. We are also somewhat limited in what we can say about the real level of value generated by IT as
respondents’ perceptions of IT business value are at best a proxy for the real thing. The use of structural
modeling, and perhaps PLS more so than covariance-based techniques, is also open to criticism in that it
sometimes fails to reject problematic models.
Our goal for future research is to undertake a number of case studies of firms in different parts of
the framework shown in Figure 4. Although our research offers some useful insights into the dimensions
of IT flexibility, we cannot say how corporations build flexibility into their IT investment decisions. Case
studies can provide this level of detail allowing both academics and practitioners within the IS community
to understand the investment process in a more informed, light. We encourage our fellow IS researchers
to build upon our research and to think about alternative theories or models to show the value, or perhaps
the threat, to corporations of greater IT flexibility.

31
References
Allen, B. R. and A. C. Boynton, “Information Architecture: In Search of Efficient Flexibility,” MIS Quarterly, 15, 4(1991), 435-445.
Barney, J. B., “Firm Resources and Sustained Competitive Advantage,” Journal of Management, 17, 1(1991), 99-120.
Benaroch, M. and R. J. Kauffman, “A Case for Using Real Options Pricing Analysis to Evaluate Information Technology Project Investments,” Information Systems Research, 10, 1(1999), 70-86.
Bharadwaj, A., “A Resource-based Perspective on Information Technology Capability and Firm Performance: An Empirical Investigation,” MIS Quarterly, 24, 1(2000), 169-196.
Boynton, A. C. and B. Victor, “Beyond Flexibility: Building and Managing the Dynamically Stable Organization,” California Management Review, 34, 1(1991), 53-66.
Broadbent, M. and P. Weill, “Improving Business and Information Strategy Alignment: Learning from the Banking Industry,” IBM Systems Journal, 32, 1(1993), 162-179.
Brynjolfsson, E. and L. Hitt, “Information Technology as a Factor of Production: The Role of Differences among Firms,” Economics of Innovation and New Technology, 3, 4(1995), 183-200.
Brynjolfsson, E. and L. Hitt, “Paradox Lost? Firm-Level Evidence on the Returns to Information Systems Spending,” Management Science, 42, 4(1996), 541-558.
Brynjolfsson, E., T. Malone, V. Gurbaxani and A. Kambil, “Does Information Technology Lead to Smaller Firms?” Management Science, 40, 12(1994), 1645-1662.
Byrd, T. and D. Turner, “Measuring the Flexibility of Information Technology Infrastructure: Exploratory Analysis of a Construct,” Journal of Management Information Systems, 17, 1(2000), 167-208.
Chan, Y. E., S. L. Huff, D. W. Barclay and D. G. Copeland, “Business Strategy Orientation, Information Systems Orientation and Strategic Alignment,” Information Systems Research, 8, 2(1997), 125-150.
Chin, W. C. and P. R. Newsted, “Structural Equation Modeling Analysis with Small Samples Using Partial Least Squares,” in R. H. Hoyle (Ed.), Statistical Strategies for Small Sample Research. Thousand Oaks, CA: Sage Publications, 1999, 307-341.
Christensen, C. The Innovator’s Dilemma, New York, NY: Harper Business, 2000. Cohen, J., Statistical Power Analysis for the Behavioral Sciences (Second Edition). Hillsdale, NJ:
Erlbaum Associates, 1988. CSC, “Computer Sciences Corporation: 14th Annual Survey of IS Management Issues,” 2001,
http://www.csc.com/aboutus/uploads/CI_Report.pdf (link valid as of December 9, 2002). Davenport, T. and J. Linder, “Information Management Infrastructure: The New Competitive Weapon,”
Proceedings of the 27th Annual Hawaii International Conference on Systems Sciences, IEEE, 1994, 885-899.
Duncan, N., “Capturing Flexibility of Information Technology Infrastructure: A Study of Resource Characteristics and their Measure,” Journal of Management Information Systems, 12, 2(1995), 37-57.
Falk, R. and N. Miller, A Primer for Soft Modeling. Akron, OH: University of Akron Press, 1992. Fichman, R., “Real Options and IT Platform Adoption: Implications for Theory and Practice”, Working
Paper, Boston College, 2002. Grant, R. M., “The Resource-Based Theory of Competitive Advantage: Implications for Strategy
Formulation,” California Management Review, 33, 3(1991), 114-135. Henderson, J. C. and N. Venkatraman, “Strategic Alignment: Leveraging Information Technology for
Transforming Organizations,” IBM Systems Journal, 32, 1(1993), 4-16. Hirschheim, R. and R. Sabherwal, “Detours in the Path Toward Strategic Information Systems
Alignment,” California Management Review, 44, 1(2001), 87-108.

32
Hitt, M., B. Keats and S. DeMarie, “Navigating in the New Competitive Landscape: Building Strategic Flexibility and Competitive Advantage in the 21st Century,” Academy of Management Executive, 12, 4(1998), 22-41.
IDG, Transformational Outsourcing: Helping Companies Adapt to a Volatile Future, 2002. Itami, H. and T. Numagami, “Dynamic Interaction between Strategy and Technology,” Strategic
Management Journal, 13, 8(1992), 119-135. Jarvenpaa, S. L. and B. Ives, “Organizational Fit and Flexibility: IT Design Principles for a Globally
Competing Firm,” in C. C. Snow (Editor), Strategy, Organization Design and Human Resource Management, 3, Greenwich, Connecticut: JAI Press Inc., 1994, 1-39.
Jones, J., “Schwab: Flexibility and Customer Focus are Key,” ComputerWorld, April 4, 2001. Kearns, G. S. and A. Lederer, “Strategic IT Alignment: A Model for Competitive Advantage,”
Proceedings of the 22nd International Conference on Information Systems, New Orleans, 2001. Keen, P. Shaping the Future: Business Design Through Information Technology. Boston, MA: Harvard
Business School Press, 1991. Kraemer, K. L. J. Dedrick and S. Yamashiro, “Refining and Extending the Business Model with
Information Technology: Dell Computer Corporation,” The Information Society, 16, 2000, 5-21. Ma, L. C. K., J. M. Burn, R. D. Galliers and P. Powell, “Successful Management of Information
Technology: A Strategic Alignment Perspective,” Proceedings of the 31st Hawaii International Conference on Systems Sciences, 1998, 13-22.
Makadok, R., “Toward a Synthesis of the Resource-based and Dynamic-Capability Views of Rent Creation, Strategic Management Journal, 22, 5(2001), 387-401.
Mahoney, J. T. and J. R. Pandian, “The Resource-based View Within the Conversation of Strategic Management, Strategic Management Journal, 13, 5(1992), 363-380.
Mendelson, H. and R. R. Pillai, “Clockspeed and Informational Response: Evidence from the Information Technology Industry,” Information Systems Research, 9, 4(1998), 415-433.
Miles, R. E. and C. C. Snow Organizational Strategy, Structure and Process. New York, NY: McGraw Hill, 1978.
Miller, D. and P. H. Friesen Organizations: A Quantum View, Englewood Cliffs, NJ: Prentice-Hall, 1984. Mintzberg, H., “Patterns in Strategy Formation,” Management Science, 24, 9 (1978), 934-948. Nelson, R. and S. Winter, An Evolutionary Theory of Economic Change. Cambridge, MA: Harvard
University Press, 1982. Nemetz, P. L. and L. W. Fry, “Flexible Manufacturing Organizations: Implications for Strategy
Formulation and Organization Design,” Academy of Management Review, 13, 4(1988), 627-638. Nunnally, J. C. Psychometric Theory (Second Edition). New York, NY: McGraw-Hill, 1978. Paik, Y. and R. Jacobson, “The Competitive Advantage of Flexibility,” Working Paper, Department of
Management, Loyola Marymount University, 2002. Panayi, S. and L. Trigeorgis, “Multi-stage Real Options: The Cases of Information Technology
Infrastructure and International Bank Expansion,” Quarterly Review of Economics and Finance, 38, 4(1998), 675-692.
Parker, M. M. and R. J. Benson Information Economics: Linking Business Performance to Information Technology, Englewood Cliffs, NJ: Prentice Hall, 1988.
Penrose, E., The Theory of the Growth of the Firm. Basil Blackwell: London, 1959. Pine, B. J. II, D. Peppers and M. Rogers, “Do You Want to Keep Your Customer Forever?” Harvard
Business Review, 73, 2(1995), 103-108. Porter, M. E., Competitive Advantage. New York, NY: Free Press, 1985. Porter, M. E., “What is Strategy?” Harvard Business Review, 74, 6(1996), 61-77.

33
Porter, M. E. and V. E. Millar, “How Information Gives You Competitive Advantage,” Harvard Business Review, 63, 4(1985), 149-160.
Prahalad, C. K., M. S. Krishnan and V. Ramaswamy, “Manager as Consumer: The Essence of Agility”, University of Michigan Business School Working Paper #02-013, 2002.
Rockart, J. F. and M. S. Scott Morton, “Implications of Changes in Information Technology for Corporate Strategy,” Interfaces, 14, 1(1984), 84-95.
Sabherwal, R. and Y. Chan, “Alignment between Business and IS Strategies: A Study of Prospectors, Analyzers and Defenders,” Information Systems Research, 12, 1(2001), 11-33.
Sabherwal, R., R. Hirschheim and T. Goles, “The Dynamics of Alignment: Insights from a Punctuated Equilibrium Model,” Organization Science, 12, 2(2001), 179-197.
Sabherwal, R. and P. Kirs, “The Alignment between Organizational Critical Success Factors and Information Technology Capability in Academic Institutions,” Decision Sciences, 25, 2(1994), 301-330.
Sambamurthy, V., “Business Strategy in Hyper-competitive Environments: Rethinking the Logic of IT Differentiation,” in Framing the Domains of IT Management: Projecting the Future through the Past, Zmud, R. (editor), Cincinnati, OH: Pinnaflex, pp. 245-261.
Sanchez, R., “Strategic Flexibility in Product Competition,” Strategic Management Journal, 16, 5(1995), 135-159.
Santhanam, R. and E. Hartono, “Issues in Linking Information technology Capability to Firm Performance,” MIS Quarterly, 27, 1(2003), 125-153.
Schumpeter, J. A. Capitalism, Socialism and Democracy. Harper & Row: New York, NY, 1950. Sethi, A. K. and S. P. Sethi, “Flexibility in Manufacturing: A Survey,” International Journal of Flexible
Manufacturing Systems, 2 (1990), 289-328. Srinivasan, K., S. Kekre and T. Mukhopadhyay, “Impact of Electronic Data Interchange Technology on
JIT Shipments,” Management Science, 40, 10(1994), 1291-1304. Tallon, P. P. K. L. Kraemer and V. Gurbaxani, “Executives’ Perceptions of the Business Value of
Information Technology: A Process-Oriented Approach,” Journal of Management Information Systems, 16, 4(2000), 145-173.
Teece, D., G. Pisano and A. Shuen, “Dynamic Capabilities and Strategic Management,” Strategic Management Journal, 18, 7(1997), 509-533.
Venkatraman, N., “Strategic Orientation of Business Enterprises: The Construct and Its Measurement,” Management Science, 35, 8(1989a), 942-962.
Venkatraman, N., “The Concept of Fit in Strategy Research: Toward Verbal and Statistical Correspondence,” Academy of Management Review, 14, 3(1989b), 423-444.
Venkatraman, N., J. C. Henderson and S. H. Oldach, “Continuous Strategic Alignment: Exploiting IT Capabilities for Competitive Success,” European Management Journal, 11, 2(1993), 139-149.
Venkatraman, N. and Prescott, J. E., “Environment-Strategy Coalignment: An Empirical Test of its Performance Implications,” Strategic Management Journal, 11, 1(1990), 1-23.
Weill, P., “The Role and Value of Information Technology Infrastructure: Some Empirical Observations,” in Strategic Information Technology Management: Perspectives on Organizational Growth and Competitive Advantage (Editors: R. D. Banker, R. J. Kauffman, M. A. Mahmood), Harrisburg, PA: Idea Publishing Group, 1993.
Weill, P. and M. Broadbent Leveraging the New Infrastructure: How Market Leaders Capitalize on Information Technology, Harvard Business School Press: Cambridge, MA, 1998.
Weill, P., M. Subramani and M. Broadbent, “Building IT Infrastructure for Strategic Agility,” Sloan Management Review, 44, 1(2002), 57-65.

34
Wernerfelt, B., “A Resource-based View of the Firm,” Strategic Management Journal, 5, 2(1984), 171-180.

35
Appendix Questions used in Survey
IT Business Value Q. How much impact has IT had on your firm’s performance in the following areas? Please restrict your appraisal to value
already realized rather than value expected in the future.
Process Planning and Support (PPS1 – PPS5) Low IT Impact High IT
Impact 1 2 3 4 5 6 7 Improve communication and coordination. 1 2 3 4 5 6 7 Strengthen strategic planning. 1 2 3 4 5 6 7 Enable your organization to adopt new
organizational structures. 1 2 3 4 5 6 7 Improve managerial decision-making. 1 2 3 4 5 6 7 Improve business intelligence.
Supplier Relations (SR1 – SR5) Low IT Impact High IT
Impact 1 2 3 4 5 6 7 Help your corporation gain leverage over
its suppliers. 1 2 3 4 5 6 7 Reduce variance in supplier lead times. 1 2 3 4 5 6 7 Help develop close relationships with
suppliers. 1 2 3 4 5 6 7 Improve monitoring of the quality of
products and services from suppliers. 1 2 3 4 5 6 7 Enable electronic transactions with
suppliers. Product and Service Enhancement (PSE1 – PSE5) Low IT Impact High IT
Impact 1 2 3 4 5 6 7 Enhance the value of products and services
by embedding IT in them. 1 2 3 4 5 6 7 Decrease the cost of designing new
products and services. 1 2 3 4 5 6 7 Reduce the time-to-market for new
products and services. 1 2 3 4 5 6 7 Enhance product and service quality. 1 2 3 4 5 6 7 Support product / service innovation.
Production and Operations (PO1 – PO5) Low IT Impact High IT
Impact 1 2 3 4 5 6 7 Improve throughput or service volumes. 1 2 3 4 5 6 7 Improve operating flexibility. 1 2 3 4 5 6 7 Enhance utilization of machinery and
equipment. 1 2 3 4 5 6 7 Improve the productivity of labor. 1 2 3 4 5 6 7 Streamline business processes.
Customer Relations (CR1 – CR5) Low IT Impact High IT
Impact 1 2 3 4 5 6 7 Enhance your ability to provide after-sales
service and support. 1 2 3 4 5 6 7 Improve product / service distribution. 1 2 3 4 5 6 7 Enhance flexibility and responsiveness to
customer needs. 1 2 3 4 5 6 7 Enhance your ability to attract and retain
customers. 1 2 3 4 5 6 7 Enable you to support customers during
the sales process. Marketing and Sales (MS1 – MS5) Low IT Impact High IT
Impact 1 2 3 4 5 6 7 Help track market response to pricing
strategies. 1 2 3 4 5 6 7 Increase your ability to anticipate customer
needs. 1 2 3 4 5 6 7 Enable sales people to increase sales per
customer. 1 2 3 4 5 6 7 Improve accuracy of sales forecasts. 1 2 3 4 5 6 7 Enable identification of market trends.
Strategic Flexibility (StrFlex1 – StrFlex8) Q. To what extent do you agree that your corporation can easily and quickly perform the following business actions?
Do Not Agree
Agree Completely
Respond to changes in aggregate consumer demand. 1 2 3 4 5 6 7 Customize a product or service to suit an individual customer. 1 2 3 4 5 6 7 React to new product or service launches by competitors. 1 2 3 4 5 6 7 Introduce new pricing schedules in response to changes in competitors’ prices. 1 2 3 4 5 6 7 Expand into new regional or international markets. 1 2 3 4 5 6 7 Change (i.e., expand or reduce) the variety of products and services available for sale. 1 2 3 4 5 6 7 Adopt new technologies to produce better, faster and cheaper products and services. 1 2 3 4 5 6 7 Switch to new suppliers to avail of lower costs, better quality or improved delivery times. 1 2 3 4 5 6 7
Strategic Intent for IT Q. What are your corporations’ goals for current IT investments?
Do Not Agree
Agree Completely
1 2 3 4 5 6 7 IT should reduce our costs, increase quality, speed and efficiency. 1 2 3 4 5 6 7 IT should enhance the effectiveness of our overall performance. 1 2 3 4 5 6 7 IT should extend our market and geographic reach. 1 2 3 4 5 6 7 IT should help us to change industry and market practices.

36
Business Strategy (BS1 – BS5) Q. Business strategy is reflected in the execution of business activities throughout the corporation. For each of the six
business processes shown below, please consider the critical business activities shown on the right, and identify the extent to which these activities have been implemented or enacted by your corporation.
Activities Implemented
Not Implemented Fully
Implemented Business Processes Critical Business Activities
1 2 3 4 5 6 7 Process Planning and Support { Strategic planning; internal communication / coordination; support for decision-making; business intelligence gathering.
1 2 3 4 5 6 7 Supplier Relations { Forge closer links with suppliers; monitor quality; monitor delivery times; gain leverage over suppliers; negotiate pricing.
1 2 3 4 5 6 7 Production and Operations { Improve throughput, boost labor productivity, improve flexibility and equipment utilization; streamline operations.
1 2 3 4 5 6 7 Product & Service Enhancement { Embed IT in products; increase pace of development / R&D; monitor design cost; improve quality; support innovation.
1 2 3 4 5 6 7 Marketing and Sales { Spot market trends; anticipate customer needs; build market share; improve forecast accuracy; evaluate pricing options.
1 2 3 4 5 6 7 Customer Relations { Respond to customer needs; provide after-sales service and support; improve distribution; create customer loyalty.
IT Flexibility Q. To what extent do you agree with the following statements on IT infrastructure in your corporation?
Connectivity (Connect1 – Connect5) Do Not Agree
Agree Completely
Our systems are sufficiently flexible to incorporate electronic links to external parties. 1 2 3 4 5 6 7 Our company has a high degree of systems inter-connectivity. 1 2 3 4 5 6 7 All remote offices and mobile personnel can connect to a central office. 1 2 3 4 5 6 7 Our firm applies open systems network mechanisms to boost connectivity (e.g., ATM). 1 2 3 4 5 6 7 Corporate databases are accessed through many different protocols (e.g., SQL). 1 2 3 4 5 6 7
Modularity (Mod1 – Mod5) Do Not Agree Agree
Completely
Reusable software modules are widely used throughout our systems development group. 1 2 3 4 5 6 7 Legacy systems within our firm do not hamper the development of new IT applications. 1 2 3 4 5 6 7 Functionality can be quickly added to critical applications based on end-user requests. 1 2 3 4 5 6 7 Data is captured and made available to everyone in the company in real time. 1 2 3 4 5 6 7 Data rules and relations (e.g., tax rules, pricing) are not hard coded into applications. 1 2 3 4 5 6 7
Compatibility (Comp1 – Comp5) Do Not Agree Agree
Completely Our firm uses enterprise systems to achieve integration (e.g., Oracle, SAP, PeopleSoft). 1 2 3 4 5 6 7 Our business is not limited by our choice of operating system (e.g., UNIX, Windows). 1 2 3 4 5 6 7 Software applications can be easily transported and used across multiple platforms. 1 2 3 4 5 6 7 Our company makes extensive use of middleware to integrate key enterprise applications. 1 2 3 4 5 6 7 Our company offers multiple interfaces or entry points (e.g., web access) to external users. 1 2 3 4 5 6 7
IT Strategy (ITStr1 – ITStr5) Q. To what extent is IT used to support critical business activities within each of the following business processes?
Low IT Use High IT
Use 1 2 3 4 5 6 7 Process Planning and Support 1 2 3 4 5 6 7 Supplier Relations 1 2 3 4 5 6 7 Production and Operations
Low IT Use High IT
Use 2 3 4 5 6 7 Product and Service Enhancement 2 3 4 5 6 7 Marketing and Sales 2 3 4 5 6 7 Customer Relations
Industry Clockspeed Q. Please complete the following for a flagship product or service sold by your corporation.
N= ___ Average length of the life cycle of the product or service (in months). %= ___ What % of customers is turned over (i.e., lost or replaced) in a year? %= ___ What % of sales comes from products or services launched in the last 2 years?