using example projects, code and scripts to jump-start ... · pdf fileusing example projects,...
TRANSCRIPT

Application ReportSPRA766 - June 2001
1
Using Example Projects, Code and Scripts to Jump-StartCustomers With Code Composer Studio 2.0
Steve White, Senior Applications Code Composer Studio, Applications Engineering
ABSTRACT
This application note describes the new and improved features of Code Composer Studio(CCS) 2.0 and provides instructions on how to use the new features. This is done by utilizingexisting examples and sample code that are shipped with Code Composer Studio 2.0. Thisnote attempts to correlate the new features with the Code Development cycle.
Contents
1 Introduction 3. . . . . . . . . . . . . . . . . . . . . . . . . . . . . . . . . . . . . . . . . . . . . . . . . . . . . . . . . . . . . . . . . . . . . . . . .
2 Code Composer Studio and the Code Development Cycle 3. . . . . . . . . . . . . . . . . . . . . . . . . . . . . . 2.1 The Code Phase 3. . . . . . . . . . . . . . . . . . . . . . . . . . . . . . . . . . . . . . . . . . . . . . . . . . . . . . . . . . . . . . . . . 2.2 The Debug Phase 3. . . . . . . . . . . . . . . . . . . . . . . . . . . . . . . . . . . . . . . . . . . . . . . . . . . . . . . . . . . . . . . . 2.3 The Analyze Phase 4. . . . . . . . . . . . . . . . . . . . . . . . . . . . . . . . . . . . . . . . . . . . . . . . . . . . . . . . . . . . . . . 2.4 The Optimization Phase 4. . . . . . . . . . . . . . . . . . . . . . . . . . . . . . . . . . . . . . . . . . . . . . . . . . . . . . . . . . . 2.5 New Features of Code Composer Studio 2.0 4. . . . . . . . . . . . . . . . . . . . . . . . . . . . . . . . . . . . . . . . .
3 Configuring and Launching Code Composer Studio 4. . . . . . . . . . . . . . . . . . . . . . . . . . . . . . . . . . . . 3.1 Choosing Your Code Composer Studio Configuration 5. . . . . . . . . . . . . . . . . . . . . . . . . . . . . . . . . 3.2 Code Composer Studio Setup 6. . . . . . . . . . . . . . . . . . . . . . . . . . . . . . . . . . . . . . . . . . . . . . . . . . . . . .
4 Before Beginning Your First Code Composer Studio Session 8. . . . . . . . . . . . . . . . . . . . . . . . . . . 4.1 Choosing an External Editor 8. . . . . . . . . . . . . . . . . . . . . . . . . . . . . . . . . . . . . . . . . . . . . . . . . . . . . . . 4.2 Enabling and Disabling the External Editor 8. . . . . . . . . . . . . . . . . . . . . . . . . . . . . . . . . . . . . . . . . . . 4.3 Other Tabs on the Customize Dialog Box 9. . . . . . . . . . . . . . . . . . . . . . . . . . . . . . . . . . . . . . . . . . . .
5 Code Composer Studio and Source Control 12. . . . . . . . . . . . . . . . . . . . . . . . . . . . . . . . . . . . . . . . . . 5.1 Setting up Source Control 12. . . . . . . . . . . . . . . . . . . . . . . . . . . . . . . . . . . . . . . . . . . . . . . . . . . . . . . . 5.2 Source Control Tool Options 12. . . . . . . . . . . . . . . . . . . . . . . . . . . . . . . . . . . . . . . . . . . . . . . . . . . . . .
6 A Simple Project With Code Composer Studio 2.0 – Code Phase 13. . . . . . . . . . . . . . . . . . . . . . . 6.1 Adding Files to Your Project 13. . . . . . . . . . . . . . . . . . . . . . . . . . . . . . . . . . . . . . . . . . . . . . . . . . . . . . . 6.2 Description of the Project Files 15. . . . . . . . . . . . . . . . . . . . . . . . . . . . . . . . . . . . . . . . . . . . . . . . . . . . 6.3 The Code Composer Studio Project Manager 16. . . . . . . . . . . . . . . . . . . . . . . . . . . . . . . . . . . . . . . 6.4 Code Composer Studio and GEL Files 17. . . . . . . . . . . . . . . . . . . . . . . . . . . . . . . . . . . . . . . . . . . . .
7 Building a Project With Code Composer Studio 2.0 17. . . . . . . . . . . . . . . . . . . . . . . . . . . . . . . . . . . . 7.1 Code Composer Studio Build Options 19. . . . . . . . . . . . . . . . . . . . . . . . . . . . . . . . . . . . . . . . . . . . . . 7.2 Using the Visual Linker 21. . . . . . . . . . . . . . . . . . . . . . . . . . . . . . . . . . . . . . . . . . . . . . . . . . . . . . . . . . .
Code Composer is a trademark of Texas Instruments.
All trademarks are the property of their respective owners.

SPRA766
2 Using Example Projects, Code and Scripts to Jump-Start Customers With Code Composer Studio 2.0
8 Code Composer Studio 2.0 and the Debug Phase 23. . . . . . . . . . . . . . . . . . . . . . . . . . . . . . . . . . . . . 8.1 Using the New Watch Window 24. . . . . . . . . . . . . . . . . . . . . . . . . . . . . . . . . . . . . . . . . . . . . . . . . . . . 8.2 Working With the Symbol Browser 24. . . . . . . . . . . . . . . . . . . . . . . . . . . . . . . . . . . . . . . . . . . . . . . . . 8.3 C++ Support With Code Composer Studio 2.0 25. . . . . . . . . . . . . . . . . . . . . . . . . . . . . . . . . . . . . . .
9 Code Composer Studio and the Analyze Phase 26. . . . . . . . . . . . . . . . . . . . . . . . . . . . . . . . . . . . . . . 9.1 Using DSP/BIOS With Code Composer Studio 2.0 26. . . . . . . . . . . . . . . . . . . . . . . . . . . . . . . . . . . 9.2 Advanced Event Triggering (AET) 29. . . . . . . . . . . . . . . . . . . . . . . . . . . . . . . . . . . . . . . . . . . . . . . . . 9.3 Graphing With Code Composer Studio 30. . . . . . . . . . . . . . . . . . . . . . . . . . . . . . . . . . . . . . . . . . . . .
10 Code Composer Studio and the Optimize Phase 32. . . . . . . . . . . . . . . . . . . . . . . . . . . . . . . . . . . . . . 10.1 Using the Profiler 32. . . . . . . . . . . . . . . . . . . . . . . . . . . . . . . . . . . . . . . . . . . . . . . . . . . . . . . . . . . . . . . . 10.2 Profile Based Compilation (PBC) 34. . . . . . . . . . . . . . . . . . . . . . . . . . . . . . . . . . . . . . . . . . . . . . . . . .
11 Summary 35. . . . . . . . . . . . . . . . . . . . . . . . . . . . . . . . . . . . . . . . . . . . . . . . . . . . . . . . . . . . . . . . . . . . . . . . . . .
12 Glossary of New Features in CCS 2.0 36. . . . . . . . . . . . . . . . . . . . . . . . . . . . . . . . . . . . . . . . . . . . . . . . .
List of Figures
Figure 1. Code Composer Studio Setup Dialog and Import Configuration Dialog 5. . . . . . . . . . . . . . . . . . Figure 2. Board Properties Dialog Box 7. . . . . . . . . . . . . . . . . . . . . . . . . . . . . . . . . . . . . . . . . . . . . . . . . . . . . . . Figure 3. Customize Dialog Box With Editor Properties Tab 9. . . . . . . . . . . . . . . . . . . . . . . . . . . . . . . . . . . . Figure 4. Select Source Control Provider Dialog 12. . . . . . . . . . . . . . . . . . . . . . . . . . . . . . . . . . . . . . . . . . . . . Figure 5. Source Control Setup Options 13. . . . . . . . . . . . . . . . . . . . . . . . . . . . . . . . . . . . . . . . . . . . . . . . . . . . Figure 6. Add Files to Project Dialog 14. . . . . . . . . . . . . . . . . . . . . . . . . . . . . . . . . . . . . . . . . . . . . . . . . . . . . . . Figure 7. Project Manager With Project Files 15. . . . . . . . . . . . . . . . . . . . . . . . . . . . . . . . . . . . . . . . . . . . . . . . Figure 8. Build Window Output 18. . . . . . . . . . . . . . . . . . . . . . . . . . . . . . . . . . . . . . . . . . . . . . . . . . . . . . . . . . . . Figure 9. Build Options Dialog 19. . . . . . . . . . . . . . . . . . . . . . . . . . . . . . . . . . . . . . . . . . . . . . . . . . . . . . . . . . . . . Figure 10. Linker Configuration Dialog 21. . . . . . . . . . . . . . . . . . . . . . . . . . . . . . . . . . . . . . . . . . . . . . . . . . . . . . Figure 11. Build Window Utilizing Visual Linker 22. . . . . . . . . . . . . . . . . . . . . . . . . . . . . . . . . . . . . . . . . . . . . . Figure 12. Visual Linker Recipe Screen 23. . . . . . . . . . . . . . . . . . . . . . . . . . . . . . . . . . . . . . . . . . . . . . . . . . . . . Figure 13. Symbol Browser Window 25. . . . . . . . . . . . . . . . . . . . . . . . . . . . . . . . . . . . . . . . . . . . . . . . . . . . . . . . Figure 14. DSP/BIOS Configuration Template Window 27. . . . . . . . . . . . . . . . . . . . . . . . . . . . . . . . . . . . . . . . Figure 15. DSP/BIOS Configuration File 28. . . . . . . . . . . . . . . . . . . . . . . . . . . . . . . . . . . . . . . . . . . . . . . . . . . . Figure 16. Graph Window 31. . . . . . . . . . . . . . . . . . . . . . . . . . . . . . . . . . . . . . . . . . . . . . . . . . . . . . . . . . . . . . . . . Figure 17. Watch Window 31. . . . . . . . . . . . . . . . . . . . . . . . . . . . . . . . . . . . . . . . . . . . . . . . . . . . . . . . . . . . . . . . . Figure 18. Profile Statistics Window 33. . . . . . . . . . . . . . . . . . . . . . . . . . . . . . . . . . . . . . . . . . . . . . . . . . . . . . . . Figure 19. Profile Range Example 34. . . . . . . . . . . . . . . . . . . . . . . . . . . . . . . . . . . . . . . . . . . . . . . . . . . . . . . . . Figure 20. PBC Wizard Dialog 35. . . . . . . . . . . . . . . . . . . . . . . . . . . . . . . . . . . . . . . . . . . . . . . . . . . . . . . . . . . . .

SPRA766
3 Using Example Projects, Code and Scripts to Jump-Start Customers With Code Composer Studio 2.0
1 Introduction
This application note uses existing code and sample files that ship with Code Composer Studio2.0 to walk through the code development cycle. It also highlights the new features that are partof this release and utilizes them while explaining the development cycle.
The purpose of this application note is to provide an introduction to Code Composer Studio 2.0,and allow developers to acquaint themselves with the latest features offered by the IDE.
For the purpose of this application note, the Code Composer Studio 2.0 simulator is used,configured as a TMS320C64x , (C64x ) using fast sim and little-endian configuration. Forsimplicity, the HELLO2 tutorial that is included with Code Composer Studio is used. You shouldalso bear in mind that the following steps and principles can be applied to actual DSP hardwaretargets and most ISAs (Instruction Set Architectures).
TIP – The Code Composer Studio simulator does not support multiple processors.
TIP – Code Composer Studio does not affect, add or modify any environment variablesnor is there a need for you to make any additions or changes to the autoexec.bat file(depending on whether you are using Windows 98, Windows 2000 or Windows NT). Thisinformation is stored in the registry. If you need to build from a command line or set anyenvironment variables, please run the batch file DosRun.bat (generated and located inthe c:\ti directory during default installation).
2 Code Composer Studio and the Code Development Cycle
2.1 The Code Phase
Code Composer Studio is an integrated development environment that is tuned for DSPdevelopment that can assist you in many ways during the entire development cycle. CodeComposer Studio enables you to decrease time to market and it shortens your learning curve.
In this section, the existing features of Code Composer Studio are covered as well as the newfunctionality included with the product. The features covered include the Editor, Project Manager,Visual Linker, PBC (profile based compilation), GEL (General Extension Language), SourceControl and the extensive online help as they relate to writing your application.
2.2 The Debug Phase
This section walks you through a typical debugging session with example code that is providedwith the Code Composer Studio software. The features highlighted are the Watch Window, GEL(General Extension Language) and Breakpoints. Symbol Browser functionality of the software iscovered.
TMS320C64x and C64x are trademarks of Texas Instruments.

SPRA766
4 Using Example Projects, Code and Scripts to Jump-Start Customers With Code Composer Studio 2.0
2.3 The Analyze Phase
During the analysis phase of the development cycle, you will be concerned with scheduling andReal Time Analysis in order to ensure your code is correct. This section covers DSP/BIOS,which is a scalable, real-time kernel designed to work with applications requiring real-timescheduling, synchronization or instrumentation. Details are provided on the graphing capabilityof the software as well as Advanced Event Triggering and Advanced Breakpoints.
2.4 The Optimization Phase
This section details how you can use the new Code Composer Studio Profiler and PBC (ProfileBased Compilation) to benchmark your code for optimal performance and size. Todays’ DSPapplications need to keep in mind the memory limitations and speed of new and existinghardware. The optimize phase of the cycle covers how to trim code to optimal size and ensure itruns efficiently on the hardware it is written for.
2.5 New Features of Code Composer Studio 2.0
This section goes into some detail about the functionality that is new to Code Composer Studio2.0. It also describes new features that have been included in moving from Code ComposerStudio 1.2 to Code Composer Studio 2.0. Information is provided on features such as ProfileBased Compilation (PBC), Advanced Event Triggering, DSP/BIOS, Symbol Browser, SourceControl, and External Editor. The goal is to tie all these new features and existing functionalityinto use of the Code Composer Studio environment while working through a simple developmentproject. At the end of this application note is a glossary of features that are new to CodeComposer Studio 2.0 and features that are new in going from Code Composer Studio 1.2 toCode Composer Studio 2.0.
3 Configuring and Launching Code Composer Studio
(*This section is recommended reading if you are new to Code Composer Studio.)
After installing the Code Composer Studio software, you will see that there are two CodeComposer Studio icons on your desktop. One of these icons is to configure the software and theother is to launch the application.
Please double-click on the icon titled Setup CCS 2.0 – this opens up the Code Composer StudioSetup dialog box along with the Import Configuration dialog box. The two dialog boxes shown inFigure 1 appear and you have a choice as to what configuration you wish to choose. In theImport Configuration dialog, there is a list of configurations that are supplied with CodeComposer Studio.

SPRA766
5 Using Example Projects, Code and Scripts to Jump-Start Customers With Code Composer Studio 2.0
Figure 1. Code Composer Studio Setup Dialog and Import Configuration Dialog
3.1 Choosing Your Code Composer Studio Configuration
Once the dialog boxes shown in Figure 1 appear, you are ready to set up the software for usewith your particular hardware. As mentioned in section 1, the examples this application notedetails are demonstrated on a C64x simulator. However, if you choose to not use a C64xsimulator, you need to configure Code Composer Studio to use your hardware. Failure toconfigure the software correctly prohibits any communication between the host and target DSP.
Code Composer Studio Setup comes bundled with an assortment of configuration files that aredesigned to work with the most common system configurations. Simply go through the list andwhen you see a supplied file that matches your system configuration, highlight that file and clickon the Import button in the Import Configuration dialog box. This action loads a configuration fileinto the Code Composer Studio setup utility and prepares to start a Code Composer Studiosession.
There are three pull-down menus in the Filters section of the Import Configuration dialog asfollows:
Family – Allows you to choose a particular family of DSPs, such as C6000, C64x or all includedwith this installation of Code Composer Studio.

SPRA766
6 Using Example Projects, Code and Scripts to Jump-Start Customers With Code Composer Studio 2.0
Platform – Allows you choose the proper hardware platform that you are working with on aparticular session such as DSK, EVM, Simulator, All, etc.
Endianness – Allows you to choose the type of endianness that you want to build your codewith. The choices are: big, little or all.
When you highlight any configuration file in the Import Configuration dialog, the detailedinformation on that configuration file populates the Configuration Description field. This field isdirectly below the Filters section. This information tells you what DSP target the configuration filesupports and other information. In some cases the description also informs you of the peripheraldevices the file does and does not support, such as McBSP and DMA. The Advanced>> buttonoffers some other functionality such as the capability to import configuration files from otherdirectories and the ability to deal with duplicate filenames.
3.2 Code Composer Studio Setup
There are three panes on this dialog box (see Figure 1). Once you have imported the desiredconfiguration file, it should appear in the leftmost pane of the Setup dialog under the SystemConfiguration heading. The center pane of the Setup dialog provides you with a list of availableboard and simulator types. If you click on any of the available board or simulator types in thecenter pane of this dialog, the rightmost pane of the dialog is populated with details of theparticular board/simulator type you have highlighted. The details presented are the location ofthe driver, revision of the driver, description, and boards supported by the driver. This informationis very useful to know for not only you but also for the Technical Support organization if you needassistance.
By right-clicking on any board or simulator type in either the left-most or center panes, CodeComposer Studio will present you with more options such as: remove board, rename board,properties, install, uninstall, and add to system.
When a board is highlighted, the Properties... option presents the Board Properties dialog box(see Figure 2).

SPRA766
7 Using Example Projects, Code and Scripts to Jump-Start Customers With Code Composer Studio 2.0
Figure 2. Board Properties Dialog Box
The first tab, Board Name & Data File, allows you to see what type of board is configured andthe device driver location. The Board Properties tab informs you what configuration file andendianness the software is using. The Processor Configuration tab allows you to select a singleprocessor, add multiple processors, or remove one or more processors from the configuration.The Startup Gel File(s) tab enables the running of a GEL (General Extension Language) file toinitialize and configure the target DSP. This is required because sometimes, depending on thetarget DSP, certain registers and memory must be configured in order for the target DSP toreceive and run code properly, and for proper operation of the DSP as well as debugging yourcode.
For more detailed information on any part of the setup procedure or component thereof, pleaseconsult the extensive online documentation. After going through the setup procedure, you areprompted to Save the configuration. If Yes is chosen, you are prompted to Start Code ComposerStudio on exit. Answering Yes opens up the Code Composer Studio application while a Noresponse simply saves your setup information without opening the application. Once you havechosen your configuration and saved it, this setup information is stored in the registry and in theccBrd.dat file. This file is binary and is non-editable.

SPRA766
8 Using Example Projects, Code and Scripts to Jump-Start Customers With Code Composer Studio 2.0
4 Before Beginning Your First Code Composer Studio SessionNow that you have configured this copy of Code Composer Studio for the DSP target you areplanning to use, you are ready to set up the environment for the first coding session. CodeComposer Studio allows for much flexibility as far as permitting you to use an external editor orsource control, or to set hotkeys and shortcuts. In the following sections, some of the issues youmay encounter in setting up the Code Composer Studio interface are detailed. Before the use ofan external editor is discussed, it would be prudent to present some information on the CodeComposer Studio built-in editor. As described below, there are some features that are availablewith the built-in editor that are not available when using a third party editor, such as advancededitor properties. However, the built-in editor does have some limitations regarding its use. Themaximum number of characters per line is 3500 and the maximum number of lines per file is2,147, 483, 648. The built-in editor also offers the capability of using bookmarks, which are aneasy way to quickly locate a particular line of code in your source file. These bookmarks areused for location and/or maintainability purposes in a source file and they can be set at any lineof any source file.
The built-in editor offers the following features that may not be available when using an externaleditor. The Code Composer Studio editor has had the file limitations removed in that you canwork with unlimited file size and unlimited line length. The Selection Margin provides rangemarkers for breakpoints, Probe Points, and Profile Points. You can do automatic codecompletion, view structure member listings, and have access to tool tip variable watching.
4.1 Choosing an External Editor
One of the new features of Code Composer Studio is the ability to integrate and use an externalthird party editor, such as Codewright, UltraEdit or VI. You may prefer to use an external editorthat you are familiar with or as dictated by Company policy. For the purpose of this exercise,Codewright 5.1a is used. Once this external editor is enabled, the external editor launcheswhenever a new blank document is created or an existing document is opened.
Please bear in mind that this external editor can only be used to edit files. In order to debug thefiles, the Code Composer Studio integrated editor must be used. The Code Composer Studioeditor is integrated with the Code Generation Tools and debugging tools. Therefore, certainoperations such as set/clear breakpoints, set/clear Probe Points, single step, automatic locate ofsyntax errors can only be performed by the Code Composer Studio integrated editor. When it istime to debug, you must remember to disable the external editor in order to gain access to thedebugging functions.
4.2 Enabling and Disabling the External Editor
In order to enable an external editor, you need to ensure that Code Composer Studio is openand then go to the Option menu. Once in the Option menu, at the bottom of the list is theCustomize selection. Click on this selection and when the dialog opens, choose the EditorProperties tab (see Figure 3). Once you are on this tab, in the top right of this dialog there areoptions for External Editor Support. You need to ensure that the Use External Editor checkbox ischecked and that the path to the editor is correct. If it is not known, clicking on the Browse buttonallows you to path out to the location of the external editor directory. After configuring yourexternal editor, go to the Edit menu and down to the Enable External Editor option. When theexternal editor is enabled, a checkmark will be in front of the Enable External Editor command.Conversely, simply go to the Edit menu and uncheck the Enable External Editor option to disableexternal editor support.

SPRA766
9 Using Example Projects, Code and Scripts to Jump-Start Customers With Code Composer Studio 2.0
Once you have set up Code Composer Studio to use an external editor in the Customize dialogbox, just click on the Apply button and then the OK button for the changes to take effect.
See Figure 3 for a look at the Customize dialog box. For more detailed information on ExternalEditor Support, please refer to the Code Composer Studio online help.
Figure 3. Customize Dialog Box With Editor Properties Tab
4.3 Other Tabs on the Customize Dialog Box
Animate Speed Tab – The first tab on the Customize dialog box is the Animate Speed tab.When you have loaded your executable code after compiling all your source files, and you run itcontinuously on the target DSP, this is called animating. Using this tab, you can set the minimumtime between breakpoints that you have set in your code. When you are animating your code,execution does not resume until the minimum time has lapsed since the last breakpoint. This taboffers you the flexibility to set this minimum time or animate speed from one (1) to nine (9)seconds.

SPRA766
10 Using Example Projects, Code and Scripts to Jump-Start Customers With Code Composer Studio 2.0
Directories Tab – This tab allows you to specify the path that the debugger uses to locate thesource files that are included in your project. The directories list displays the defined search pathand the debugger searches the directories listed in order from top to bottom. If two files have thesame name but are in different directories, the file in the directory that is highest in the list haspriority over the file in the lower directory. This dialog allows you to add a new directory, delete adirectory already in the list or to move a directory in the list either up or down in priority.
Color Tab – This tab enables you to change the default colors of different screen elements ofthe Code Composer Studio environment. Once a color is changed and applied, this informationis stored in the Code composer Studio workspace (covered later). You can change the colors ofvarious texts, backgrounds, graph and axis backgrounds, grids, sets of keywords and functionnames.
Editor Properties – This tab not only allows you to choose and utilize an external editor asdiscussed in section 4.2, but enables you to set tab stops, browse files while debugging, openfiles as read-only, auto-save before build and prompt before reloading. You can also select theCursor mode. In Stream mode your editor acts similarly to the way Microsoft Word selects andinserts text. In Virtual whitespace mode you can use the mouse or arrows keys to move thecursor to any place within the document window. The editor automatically fills in any whitespacebetween the cursor and the end of line with spaces. You can also set keyword color highlightingto suit your own development standards or according to target processor and file type, includingGEL files. To do this, you can create your own custom keyword files or use one of the fourprovided keyword files. You can also choose the functionality of your selection margin, which bydefault, is displayed on the left side of the Code Composer Studio editor and on disassemblywindows. There are colored icons in the selection margin that tell you where you have abreakpoint (red dot) or a Probe Point (blue dot) set at a particular location. A yellow arrowindicates the location of the program counter. This feature also allows you to display linenumbers and marker points associated with a particular line of code. You can also change thewidth of the selection margin by entering a number between 20 and 999 as well as the mode ofoperation, to Normal mode or Range mode. For more detailed information on this dialog tab orany features listed, please consult the Code Composer Studio online help.
TIP – This functionality not available with an external editor.
Keyboard Properties Tab – There are a number of default keyboard shortcuts that come withCode Composer Studio that enable you to save time in performing repetitive or multiplekeyboard/mouse commands by using a single key or combination of keys. Among the defaultshortcuts are the ability to: move insertion point, scroll and select text, delete, insert or copy text,window management, mark text, various debugging shortcuts and so on. You can also assigncustom keyboard shortcuts or change the default shortcuts for any editing or debug commandsthat can be invoked from any document window. There is more information on using thisfunctionality in the Code Composer Studio online help.
TIP – Please take note that these features are only available in document windows.

SPRA766
11 Using Example Projects, Code and Scripts to Jump-Start Customers With Code Composer Studio 2.0
Program Load Options Tab – This tab allows you to select certain actions that are toautomatically happen when programs or symbols are loaded onto the DSP or simulated DSP.The options available here are: Perform verification after Program Load, which enables CodeComposer Studio to verify the program was loaded onto the target correctly. It does this byreading back selected memory from the target. The next option is Load Program After Build,which automatically loads your executable right after it has been built or modified. Thisguarantees that you have loaded the latest symbol information onto your target. Finally, the lastoption is Add Symbols With Offsets, which enables you to specify a code offset and a data offsetwhen a new symbol file is loaded using the Add Symbols command. The symbol file specifiesthe code and data addresses where symbols are to be loaded.
Control Window Display Tab – The topmost section, Title Bar Displays, allows you flexibility inthe information that is displayed in the title bar of the Code Composer Studio control window. Insome cases, you may be working on several projects simultaneously. Some of these projectsmay have different board names, processor names or types and these may be specific to aproduct that is to be released. You may find it easier to administer and work with projects thathave additional details in the title. The next section of this tab enables Code Composer Studio todisplay the full pathname to the source files. You can also select whether to close all windows ofthe project when the Project close option is selected or to close projects when exiting the ControlWindow.
File Access Tab – This tab allows you to select the maximum number of recent files to displayin the list in the Code Composer Studio File and Project menus. Recent source files, Programsand Workspaces can be selected from the File menu. You can select from 1–10 files to displayand the default is 4. You can also select between 1–10 (maximum) project files to display in theProject menu. Code Composer Studio allows you to Reset All File Directories when a project isopened by simply ensuring that box is checked.
Shared Memory Configuration Tab – The operations on this tab allow you to halt allprocessors with executable code on a shared block of memory to ensure that no breakpoints aremissed and so that invalid code is not executed. The second option allows you to override thedefault action when stepping over a breakpoint that is set in a shared memory block. Whenstepping over a software breakpoint, the breakpoint has to be cleared first, then the processorsteps, then the breakpoint is reset. Any other processors executing code in that shared memoryblock could miss the breakpoint. By default, when specified as a shared memory attribute, allprocessors that have executable code on that memory block are halted until the code hasstepped over the breakpoint.
Advanced Editor Features Tab – This tab allows you to enable or disable certain features ofthe integrated editor. The Code Composer Studio editor prompts you with a tooltip as it attemptsto recognize the word you are typing. The editor also tries to complete any words you are typing:simply type a few letters and hit the Tab key to be presented with a list of possible selections.The integrated editor also attempts to select the correct case for any keyword you are typing ifthis feature is enabled. You can enable Code Composer Studio to display a list of membersavailable for an object by typing a period that separates the object name and the member name.
TIP – This functionality is not available when using an external editor.

SPRA766
12 Using Example Projects, Code and Scripts to Jump-Start Customers With Code Composer Studio 2.0
5 Code Composer Studio and Source ControlCode Composer Studio Integrated Development Environment also allows you to implement anysource code control software that utilizes the Microsoft SCC interface. For managing large andcomplex development projects, source code control is necessary. With projects such as these,often there are many engineers working on the project and these engineers can be at differentgeographic locations. Source Code Control tools provide a mechanism to keep track of allchanges that are made to individual source files and to prevent files from being accessed bymore than one engineer at a time.
Once you have chosen a source code control tool and configured Code Composer Studio to useit, those tools are used whenever any source code control commands are issued. This tool canalso be changed at any time you wish. A Code Composer Studio project that is not underSource Control can be placed under it at any time. When a Code Composer Studio project hasbeen associated with a source control tool, whenever the project is opened, it is automaticallyconnected to the correct source control tool.
Whenever a project is opened that has not been placed under source control, you will beprompted to add the project to a new or existing source control project. You also have the optionto leave the project without source code control.
5.1 Setting up Source Control
Open up the Code Composer Studio interface and go to the Project menu. From the Projectmenu, choose the Source Control option. Then go to the Select Provider option and choose thesource control tool of choice that is available on your PC. Once you have selected your sourcecontrol tool, in order to open or start the tool – go to the Project menu, Source Control optionand select Launch Client Tool. A Source Control tool was not selected in this case, therefore, thedialog in Figure 4 is reporting No Source Control Provider.
Figure 4. Select Source Control Provider Dialog
5.2 Source Control Tool Options
The Source Control functionality of Code Composer Studio offers standard features that arecommon with the popular Source Control tools in use. The selections include: prompt for optionson get latest, …options on check-in, …options on check-out, …undo check-out, …on add, …onremove, …on show difference and so on. You are at liberty to choose those options you requireor must use as per company policy. This option is displayed when you choose Project→SourceControl→Options from the Code Composer Studio Project menu:

SPRA766
13 Using Example Projects, Code and Scripts to Jump-Start Customers With Code Composer Studio 2.0
Figure 5. Source Control Setup Options
6 A Simple Project With Code Composer Studio 2.0 – Code PhaseOnce you have completed configuring the Code Composer Studio environment for initial use interms of setting up which external editor and what source control tool to use, you are ready tobegin creating or coding your first project.
For the purposes of this application note, the supplied files and project from the HELLO2 tutorialare used. However, you can create your own code as well.
In order to begin, launch the Code Composer Studio software and go to the Project menu andchoose the New option. The Project Creation dialog box appears and requests that you type in aproject name. For demonstration purposes, the name used was Hello. The IDE automaticallyadds the .pjt extension to signify that it is a project file. The full name of this project is: Hello.pjt.This file stores all the settings for this project and references the various files that are used bythis project.
Now that the Hello2 project environment is setup, you need to add source files to the project. Goto the File menu and choose the New option. If the external editor is functioning correctly, youshould see the Codewright editor window open on top of the Code Composer Studio projectwindow. At this point, you can either copy the contents of the HELLO.C file from the followingdefault installation directory: C:\ti\tutorial\sim64xx\hello2, into the Codewright editor screen orwrite your own C source code in the same screen. You could also choose File→Open fromCodewright and open the HELLO.C file.
You need to follow the above procedure for the following files in order to successfully build thisproject: VECTORS.ASM and HELLO.CMD. They can be found in the following default directory:C:\ti\tutorial\sim64xx\hello2. Clicking on the File→New menu item displays a dialog that allowsyou to choose whether the new file is a source file, a DSP/BIOS configuration file, a VisualLinker recipe or an Active X document. The last three are discussed later in this text.
6.1 Adding Files to Your Project
Once the procedure detailed in section 6 is completed, you can begin to add the source andother files needed to build a project, generate an executable, and load it onto the DSP target.
Code Composer Studio has provided you with multiple ways to add files to your project. Selectany of the following methods:
SPRA766
14 Using Example Projects, Code and Scripts to Jump-Start Customers With Code Composer Studio 2.0
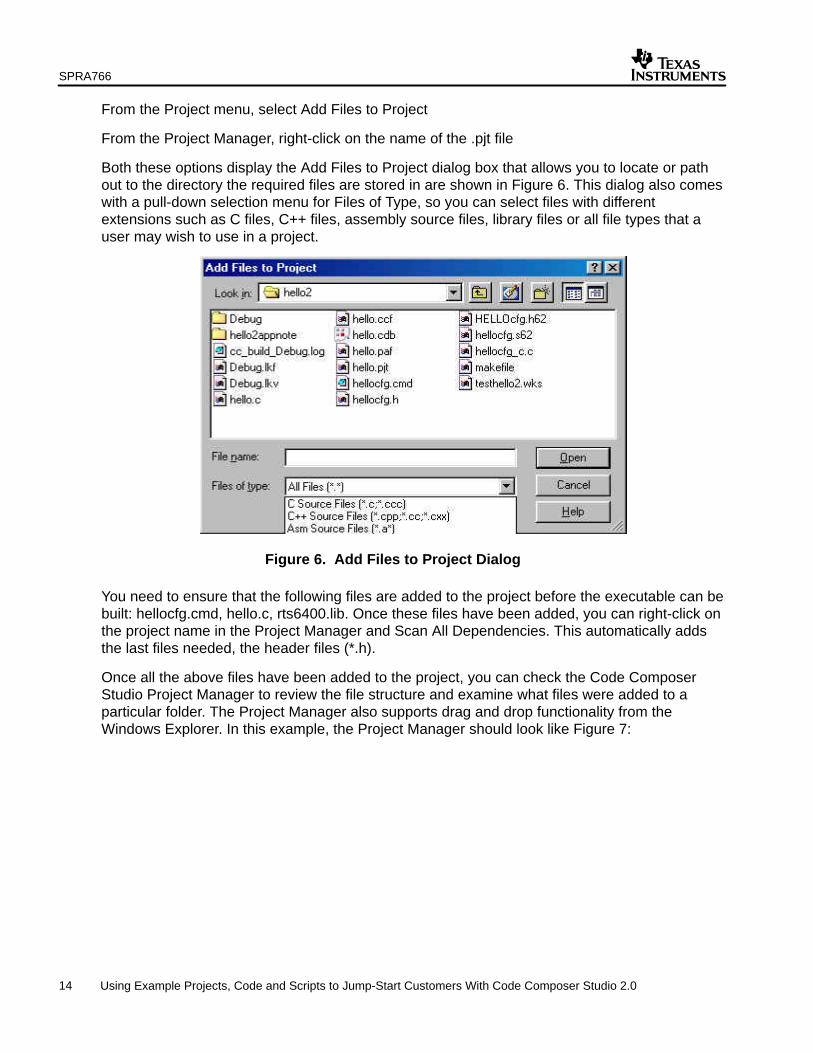
From the Project menu, select Add Files to Project
From the Project Manager, right-click on the name of the .pjt file
Both these options display the Add Files to Project dialog box that allows you to locate or pathout to the directory the required files are stored in are shown in Figure 6. This dialog also comeswith a pull-down selection menu for Files of Type, so you can select files with differentextensions such as C files, C++ files, assembly source files, library files or all file types that auser may wish to use in a project.
Figure 6. Add Files to Project Dialog
You need to ensure that the following files are added to the project before the executable can bebuilt: hellocfg.cmd, hello.c, rts6400.lib. Once these files have been added, you can right-click onthe project name in the Project Manager and Scan All Dependencies. This automatically addsthe last files needed, the header files (*.h).
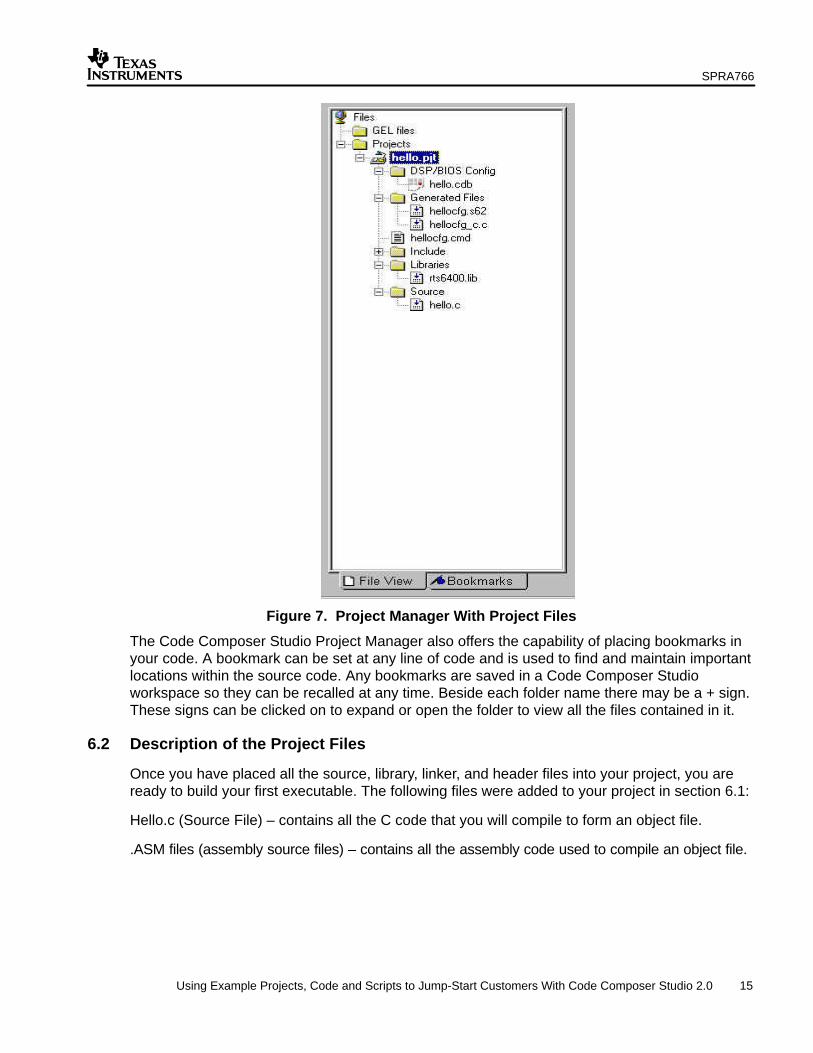
Once all the above files have been added to the project, you can check the Code ComposerStudio Project Manager to review the file structure and examine what files were added to aparticular folder. The Project Manager also supports drag and drop functionality from theWindows Explorer. In this example, the Project Manager should look like Figure 7:
SPRA766
15 Using Example Projects, Code and Scripts to Jump-Start Customers With Code Composer Studio 2.0
Figure 7. Project Manager With Project Files
The Code Composer Studio Project Manager also offers the capability of placing bookmarks inyour code. A bookmark can be set at any line of code and is used to find and maintain importantlocations within the source code. Any bookmarks are saved in a Code Composer Studioworkspace so they can be recalled at any time. Beside each folder name there may be a + sign.These signs can be clicked on to expand or open the folder to view all the files contained in it.
6.2 Description of the Project Files
Once you have placed all the source, library, linker, and header files into your project, you areready to build your first executable. The following files were added to your project in section 6.1:
Hello.c (Source File) – contains all the C code that you will compile to form an object file.
.ASM files (assembly source files) – contains all the assembly code used to compile an object file.

SPRA766
16 Using Example Projects, Code and Scripts to Jump-Start Customers With Code Composer Studio 2.0
RTS6400.lib – (library file) – is the run-time-support object library for use with C/C++ code. Itcontains the following:
ANSI C/C++ standard library
C I/O library
Low Level support functions that provide Input/Output to the host system
Intrinsic arithmetic routines
System startup routine, _c_int00
Functions and Macros that allow C/C++ to access certain instructions
*.h – (header files) – contain variable declarations and function definitions. These files areautomatically added to your project if referenced in your C source file. Others are created as aresult of using DSP/BIOS. This is explained in more detail later.
*.cmd – (linker command file) – contains linker options and names the input files for the linker. Italso defines memory on the DSP and tells your code what areas it can write to.
Hellocfg.cmd – is the DSP/BIOS linker command file
Hellocfg.h – includes DSP/BIOS module header files and declares external variables for objectsthat are created in the configuration file.
Hellocfg_c.c – contains code for the CSL (chip Support Library) structures and settings, and isgenerated by the DSP/BIOS Configuration tool. It is recommended that this file is not modified.
Hellocfg.s62 – is an assembly language source file for DSP/BIOS settings.
Hellocfg.h62 – is an assembly language header file that is included by Hellocfg.s62.
Hello.cdb – is a DSP/BIOS configuration database file which stores the DSP/BIOS configurationsettings.
GEL files – are .gel extension files that are either supplied with Code Composer Studio or arecreated by you. When added to a project, they can be used for customizing the environment,automating testing, configuring the DSPs’ memory and registers and creating dialog and sliderbars.
HELLO.CCF – exists in the project directory. This file is temporary and only exists when theconfiguration file is open. It is strongly recommended that this file is not modified, opened ordeleted.
TIP – It is strongly recommended that the HELLO.CFG file is not opened, modified or deleted.
6.3 The Code Composer Studio Project Manager
The Code Composer Studio Project Manager for version 2.0 offers many features that aredesigned to make life easier for the DSP developer. This section provides some details on thesenew features.
The Project Manager offers the capability to work with multiple projects where many projectswithin the workspace are open, but only one project is active at a time.
The Project Manager provides you with the ability to save a currently active project, using theProject→Save command, before moving on to another project within the workspace.

SPRA766
17 Using Example Projects, Code and Scripts to Jump-Start Customers With Code Composer Studio 2.0
Multiple configurations are supported with the Project Manager in that you are permitted toutilize separate build options for each configuration. You can also create Release or Debug(created by default) configurations and are free to add custom configurations. These projectconfigurations define sets of project level build options and when specified, they apply to everyfile in a particular project.
Code Composer Studio also allows you to specify the order in which all the files in your projectare to be linked. In other words, this functionality allows you to control the order that object filesand libraries are linked at build time.
More information is available on the Project Manager topics in the Code Composer Studio onlinehelp.
6.4 Code Composer Studio and GEL Files
Code Composer Studio comes with its own scripting language that is called GEL, which is asubset of the C programming language. GEL stands for General Extension Language and canbe used for many different functions in the Code Composer Studio environment in order toextend its functionality and capabilities. Any GEL file has the .gel extension appended to the endof the file. Currently, the software comes with about 35 built in functions that enable you tocontrol the state of the target, access and control target memory, display results in an outputwindow, and create dialog/slider boxes. You can also create your own GEL files to initialize andcontrol the target DSP, for menu items, to have a particular GEL file run when Code ComposerStudio is started or when a GEL menu item is selected, to setup a target memory map a certainway, and so on. These GEL files are completely portable and reusable (provided any target ormemory map information is consistent) and very easy to maintain. You can also use GEL tocustomize your workspace and automate testing. GEL functions can also be added to the WatchWindow so that they execute at every breakpoint. The GEL scripting language supports thefollowing: function definitions and parameters, calling GEL functions, return and if-elsestatements, while statements, GEL comments, and preprocessing statements. Please refer tothe Code Composer Studio online help for more detailed information.
7 Building a Project With Code Composer Studio 2.0At this point, all the required files have been added to the HELLO project that are needed togenerate an executable. Code Composer Studio saves any changes to the project setup as youmake them, so if you closed the software after loading your files into the project – all you need todo is open Code Composer Studio and do a Project→Open. You also need to go to the Filemenu and issue a Load GEL command, which displays a dialog box that allows you to path outto where the GEL files are stored. In this case, the GEL files are stored in the following directory:C:\ti\cc\gel\init64xxsim.gel
This GEL file is needed and should be run in order to clear any breakpoints and to setup theEMIF (External Memory Interface) registers so that you can take advantage of this memory.
If you are using an actual hardware target, you may want to rest the target so that the DSP andits registers are ready to go to work. This can be done in a couple of different ways. First, go tothe Debug menu and click on Reset DSP; this issues a software reset to the DSP (or simulatedDSP). The other ways to reset the DSP are to either toggle the power to the target, or to use athird party reset utility. If you get an error message that Code Composer Studio cannot initializethe target, then you must reset the DSP target in order to re-establish communication with thehardware.

SPRA766
18 Using Example Projects, Code and Scripts to Jump-Start Customers With Code Composer Studio 2.0
Once all the files are loaded, you can check the Load Program After Build checkbox in theCustomize dialog that was described in section 4.3. This ensures that the executable is loadedimmediately after a successful build. Please ensure that you have loaded and run the correctGEL file to setup the DSP target to receive your executable. In this case, the init64xxsim.gel filemust be loaded and run by clicking on the GEL menu item and then theResets→ClearBreakPts_Reset_EMIFset.
There are three ways to issue a Build command, from the menu or from the icon and they are asfollows: select Project→Build, click the icon beside the active configuration dialog box, orright-click on the project name in the Project Manager (in this case, HELLO.PJT). Once youhave chosen your preferred method to build, a Build window opens in the lower section of theCode Composer Studio interface. It will look like that shown in Figure 8.
Any errors and unresolved dependencies will appear in this window in red text. Provided youhave all source files relating to this project loaded, double-clicking on any line containing anerror in the build window causes one of two actions: if using the Code Composer Studio editor,the source file automatically opens up with the cursor flashing at the offending line or, if you areusing an external editor, it becomes active in the task bar at the bottom of your PC screen andhas the cursor flashing at the offending line of code that needs to be corrected. You also havethe option to turn off the external editor by clicking on the icon at the top right corner of the iconbar within the Code Composer Studio environment. This allows you to selectively use one editoror the other or to toggle back and forth between editors.
Figure 8. Build Window Output
Your build window may not look exactly like the one in Figure 8 because your directory structuremay be different than the test system that was used for the purposes of this application note.Double-clicking on any line in red in the build window opens the source file associated with theerror in either your external editor or the Code Composer Studio editor and takes you to thesuspect line of code. Errors are something that must be addressed before you can proceed withyour development, but warnings are something that you can choose to ignore because they willnot impede your progress.

SPRA766
19 Using Example Projects, Code and Scripts to Jump-Start Customers With Code Composer Studio 2.0
7.1 Code Composer Studio Build Options
Code Composer Studio allows you to control all the aspects of the build process byincorporating the ability to customize the build options that you choose to use. You can setproject-level options as well as file-specific options. The difference between these two levels ofoptions is how they effect files. Project-level options are applied globally to all the files in theproject. File-specific options apply specifically to the optimization of individual source files andoverride project level options. The reasons that you may wish to apply different build options todifferent files within the project are, for example, if you would like to build with more optimizationon one file than another or to build with file size being more important than speed or vice versa.
TIP – If a custom build requires launching TI Code Generation Tools (with use of anExternal Editor, for example), the batch file DosRun.bat must be run in order to setupproper path and environment variables. It is advised that you run this batch file prior todoing a build. This file is located in the C:\ti directory if the default installation was done.
The Code Composer Studio Build Options provide you with the ability to control build order forthe project, build steps for an individual file, the order that files are linked into the project, beforeand after build steps, and so on. The various tabs from the Code Composer Studio BuildOptions dialog are covered below. Figure 9 illustrates the actual Build Options dialog for C6000.
Figure 9. Build Options Dialog

SPRA766
20 Using Example Projects, Code and Scripts to Jump-Start Customers With Code Composer Studio 2.0
As can be seen in Figure 9, there are four tabs on this dialog that provide a great deal offlexibility when building a project. These tabs each have your own purpose as is describedbelow.
General Tab – This tab allows you to specify the order of the initial and final build steps, placeadditional steps in either the initial or final steps, change the order, apply custom build steps,delete any build step, exclude a particular step from the build process, remove any files thathave been generated by the build, define a path and filename for the executable and any otherfiles created during the build process, etc.
Compiler Tab – This tab is used to allow you to choose commonly used compiler options,optimization speed versus size, optimization level, and program-level optimization. The othercategories provide you with the ability to choose endianness and memory model, controlaliasing, provide feedback banners during the build, specify .obj and listing directories (amongothers), control the assembly process, control the parser and preprocessor functions, and selectdiagnostics. At the top of the Compiler options tab, there is a window (scrollable) that providesyou with a line summary of all the options to be used during the final build. When checking orhighlighting any particular category from Basic to Diagnostics, you are presented with variouscheckboxes, pull-down menus and/or text boxes. These features can be used with the defaultoptions or if preferred, you can select the options and functionality you prefer or need for aparticular project. When any option is chosen, you can see the options change in the scrollablewindow at the top of the Build Options dialog. You can also simply add your own options to thisscrollable window, but in many cases this requires a thorough knowledge of the actual textcommands for the options requested. As can be seen in the scrollable window, the examplestring provides the path of the project .obj files, the configuration of the project (in this case,debug) and target information. You can also see that this project will be compiled with fullsymbolic debug (–g option), with no banners (–q option) and with symbols defined (–d option).
Linker Tab – Similarly to the Compiler tab window at the top of the screen, the Linker tab alsoprovides a scrollable window that provides you with a summary of all the options that will beused during the link phase of the build. As described for the Compiler tab, whenever an option ischosen on the Linker tab, you can see the line summary or string change in the scrollablewindow. This scrollable window supports not only direct editing, but the ability to specify optionsthat are not listed in the dialog. The executable filename and the directory of the executable arealso present in this scrollable window.
TIP – Whenever options are typed directly into the scrollable window in either theCompiler tab or the Linker tab, you must click inside the window in order to update thedisplay.
Link Order Tab – This tab allows you to choose the order that object and library files are linkedinto the project during the build. If you have implemented multiple versions of the same functionin different files, link order is very important to ensure that the correct version is linked into theprogram being built. This tab allows you to specify the link order, change the link order, remove afile from the list of files to be linked, and so on. In the lower window on this tab, you arepresented with a list of the files that are not in any order to be linked. This list of files will executeafter the files in the link order window.
For more information on any of the Build Option tabs or categories, please refer to the CodeComposer Studio online help.

SPRA766
21 Using Example Projects, Code and Scripts to Jump-Start Customers With Code Composer Studio 2.0
As well as using the text linker through the Linker tab, you can also use the Visual Linker that issupplied with Code Composer Studio. The difference between these two methods is that the textlinker generates a single COFF (Common Object File Format) object module from the objectfiles of a particular project. The linker instructions in the linker command file (.cmd) enable you tounite object file sections and to attach sections or symbols to addresses or memory ranges. Youcan also define or redefine global symbols within the project.
Where the text linker combines the object files from a project to generate a COFF object moduleor executable file, the Visual Linker allows interaction from you when linking to create anexecutable. This method uses object files and a memory description as input. You can then dragand drop the object files to arrange a graphical model of memory. When you have chosen asatisfactory memory model, the executable (.OUT) can be generated.
7.2 Using the Visual Linker
The first step in using the Visual Linker functionality is to generate a recipe (.rcp) file. This recipefile tells us how to link an application and contains input files, hardware descriptions, andinstructions on how to combine them.
You must first tell Code Composer Studio that the text linker is no longer desired and the VisualLinker is to be used from here on in. When the Visual Linker is chosen via the Linkerconfiguration tool, it is selected at IDE level, not just at project level. This means that the VisualLinker will be used for every project for this particular target, not just for this one project. Thissetup remains in effect until you reopen the Linker Configuration tool and deselect this option. Inshort, the Visual Linker translates the linker command file (.cmd) from the text linker into a recipe(.rcp) file for use with the Visual Linker.
In order to generate the recipe file, you need to go into the Code Composer Studio Tools menuand select the Linker Configuration option. That presents you with the dialog box shown inFigure 10.
Figure 10. Linker Configuration Dialog
From the Linker Configuration dialog, you can select whether to use the Visual Linker or thelegacy text linker. Once the option for the Visual Linker has been selected, simply click OK andthen select Project→Rebuild All from within the Code Composer Studio environment. CodeComposer Studio then proceeds in going through the build process. Please bear in mind that theproject does not progress beyond the link stage due to the fact that the Visual Linker has beenselected.

SPRA766
22 Using Example Projects, Code and Scripts to Jump-Start Customers With Code Composer Studio 2.0
Once the software has progressed to the link stage, you are presented with a series ofmessages as detailed in Figure 11.
Figure 11. Build Window Utilizing Visual Linker
Code Composer Studio has now informed you that there is no visual Linker recipe file in thisproject. In order to generate one, simply double-click on the lower of the error messages as itsays.
Once you have done this, Code Composer Studio presents a Visual Linker Wizard to walk youthrough the process. There are a total of nine steps to this process that walk you through it.
During this process, you have the flexibility to choose when to initialize global variables, to do afull or partial link, and then present a summary of the features of the recipe that is about to becreated. You can then choose to accept these features or continue on through the Wizard inorder to change them.
The Wizard next prompts you to translate the SECTIONS directives and provides severaloptions for you to choose. You also have the option not to translate these directives.
Following the options for SECTIONS directives, you are provided with output file information andthe opportunity to change the name and/or location of both the output file and the map file fromthe ones Code Composer Studio has detected.
Moving forward through the Wizard, you can choose to accept the default sizes for the stack andheap size, or change them to increase or decrease the sizes.
In step 7 of the Wizard, Code Composer Studio has detected a code entry point and section forinterrupt vectors. Here, you have the choice of accepting what Code Composer Studio hasdetected or to change these options.
The next step involving the Wizard is the Roots portion. This page provides a list of all the inputsections that are not reachable from the noted code entry point or interrupt vector section. Anysection listed here can be included in the linked image by checking the appropriate box besidethe section.
The final step of the Wizard is some information about the Mission of the Wizard. It informs youthat the recipe file has been added to the project and can be found in the Code ComposerStudio Project Manager. The name of this file will be HELLO.RCP. In order to use this file, youonly need to double-click on it and the screen in Figure 12 should appear.

SPRA766
23 Using Example Projects, Code and Scripts to Jump-Start Customers With Code Composer Studio 2.0
Figure 12. Visual Linker Recipe Screen
The screen in Figure 12 indicates that a recipe file has been successfully created. You canresize the window so that all four panes are visible. Depending on the target configuration, theelements contained in this file may vary and may not be exactly as depicted in Figure 12.
If you want to accept the recipe that the Visual Linker has generated, then continue with buildingyour code. However, if you want to obtain more information on the specifics and particulars ofusing the Visual Linker or how to allocate or change a program in memory, it is stronglyrecommended that you refer to the online help.
8 Code Composer Studio 2.0 and the Debug Phase
A number of features have been added and/or improved upon in this version of Code ComposerStudio. Those who have grown accustomed to the Watch Window in previous versions of CodeComposer Studio will note that the new Watch Window provides more functionality and morefeatures. These new features and improved functionality assist you during the debug phase ofthe code development cycle by allowing you to watch local variables and to freeze updates.
Texas Instruments has also added a Symbol Browser to the environment and this featureprovides information on files, labels, and variables of a loaded project and executable.
Code Composer Studio 2.0 also provides C++ support for those who prefer to work with thatlanguage to develop and debug target code.
More information on the new features and functionality is provided in section 8.1.

SPRA766
24 Using Example Projects, Code and Scripts to Jump-Start Customers With Code Composer Studio 2.0
8.1 Using the New Watch Window
When you are writing and testing programs, there are often cases where you will need tocheck/verify the value of a variable while your program is executing. A good way to do this is touse the Code Composer Studio Watch Window.
In order to use the Watch Window, you need to ensure that Code Composer Studio has beenlaunched and that your executable has been launched on the target. In this case, you open theHELLO2 tutorial and load the executable file, HELLO.OUT. Once this is done, you set abreakpoint at the line: LOG_printf(&trace, hello world!);
The breakpoint can be set using either a double-click in the selection margin or by right-clickingon the line of code you wish to set the breakpoint at, then selecting the Toggle Breakpointoption. Breakpoints can also be set using the F9 key or by using the icon that looks like an openhand.
At this point, you can either use the different colored icons in the selection margin to indicatebreakpoints, Probe Points or Profile Points or use the Customize dialog box to choose the optionof the whole line to change color wherever a breakpoint, Probe Point or Profile Point is set. Youcan even get creative and select any color you want to indicate the various types of breakpointsin the selection margin.
TIP – Please ensure that whatever color you choose does not obscure the keywords inthe editor because colors similar to your keywords makes seeing them difficult.
You then need to open the Watch Window by going to the Code Composer Studio View menuand selecting the Watch Window option. The Watch Window opens at the bottom-right corner ofthe Code Composer Studio environment. This area shows the value of watched variables whenrunning your code. The default mode of the Watch Window displays the Local variables tab todisplay variables local to the function being executed.
In order to add a variable or variables to the Watch Window, several methods have beenimplemented to achieve this. You can click on the expression icon in the Name field of the WatchWindow and simply type the name of the variable in this field or you can highlight the variable inthe source window, right-click and choose the Add to Watch Window option.
You can also use the Watch Window to watch structures, and by double-clicking on any elementin the structure, the value for that element can be edited. The same principle applies with arrays.Please note that whenever a variable is changed, the change is reflected in the Watch Windowand the value is in red. The red color of the variables indicates that the value has changed mostrecently.
8.2 Working With the Symbol Browser
The Symbol Browser can be used to look at and review files, functions, labels, globals and typesof a loaded COFF or executable (.out) file. The Symbol Browser is invoked by going to the CodeComposer Studio Tools menu and then down to the Symbol Browser option. There are five tabsin the Symbol Browser, each connected to a different window. Each of these windows displaysinformation on files, functions, labels, globals, and types. Each window has information thatrepresents various symbols and if a plus (+) sign precedes this information, that means that theinformation or node can be expanded.

SPRA766
25 Using Example Projects, Code and Scripts to Jump-Start Customers With Code Composer Studio 2.0
The Files tab displays a list of all the files that are in the currently loaded executable. If you clickon the plus (+) sign in front of the executable filename, a complete list of all the files that are inthe output file is presented. Each file listed can be further expanded to show all the functions inthat file and each function can be expanded to show the local variables in the function and soon. Double-clicking on a filename displays the files’ source code in a document window. Thisaction holds true for the other tabs within the Symbol Browser as well.
Figure 13. Symbol Browser Window
8.3 C++ Support With Code Composer Studio 2.0
The latest version of Code Generation Tools and Code Composer Studio 2.0 allows you to writeand debug C++ code using standard debug tools. The Code Composer Studio IDE and theCode Generation Tools have both been enhanced to support C++ project build options.
There are some limitations when using GEL expressions with C++ and they are summarized asfollows:
• No pointer adjustment is made when casting to or from a virtual base class
• Identifiers after a “.” Or “–>” operator cannot be qualified
• The destructor of a class cannot be named
• Pointer to member values appear as implementation structures
• Type synonyms defined with typedef are not available
• Types must be fully qualified and cannot be partly qualified the same way as identifiers
• The IDE does not identify dynamic or run-time type objects that base class pointers refer to
• GEL expressions must dereference C++ references, otherwise they appear as pointers
It is recommended that you be familiar with C++ and that the online help be reviewed beforemoving forward in working with C++.

SPRA766
26 Using Example Projects, Code and Scripts to Jump-Start Customers With Code Composer Studio 2.0
9 Code Composer Studio and the Analyze Phase
You are now ready to begin the analyze phase of the code development cycle. In this phase,you get information from the system returned through specific analysis tools. This informationallows you to monitor and measure the performance of a particular program, in this case theHELLO2 tutorial.
The tools demonstrated in this section are DSP/BIOS, RTA and Advanced Event Triggering(AET). Using DSP/BIOS allows you to view the status and performance of a particular programin real-time. By having access to this information, you can debug and optimize your system. Anyproject that has a DSP/BIOS configuration file can use these analysis tools.
Advanced Event Triggering consists of several tools that add to your ability to debug target codemore quickly. The tools that comprise Advanced Event Triggering are: Event Analysis and theEvent Sequencer.
Event Analysis assists you to set up regular hardware debug functionality while the EventSequencer lets you search for certain conditions to occur in your executable and to causespecific actions to occur when those conditions are met.
Code Composer Studio also allows you to view your target code visually by graphing your codeas it progresses. This is beneficial as you can detect or inject noise and actually view what thealgorithm is doing as it progresses. The IDE supports the following types of graphs: eyediagrams, FFT plots, image displays, time/frequency graphs, and constellation plots. CodeComposer Studio also allows you to inject or extract data at any point in the algorithm and copyit to or from a file.
9.1 Using DSP/BIOS With Code Composer Studio 2.0
DSP/BIOS can be used on any application that needs to be probed, traced or monitored inreal-time. Each module of DSP/BIOS can be linked into an application as required and onlythose referenced in the application will be called.
DSP/BIOS consists of the following components: DSP/BIOS Configuration Tool, DSP/BIOSReal-Time Analysis Tools and the DSP/BIOS APIs. For more information on any of thesecomponents, please refer to the Code Composer Studio online help.
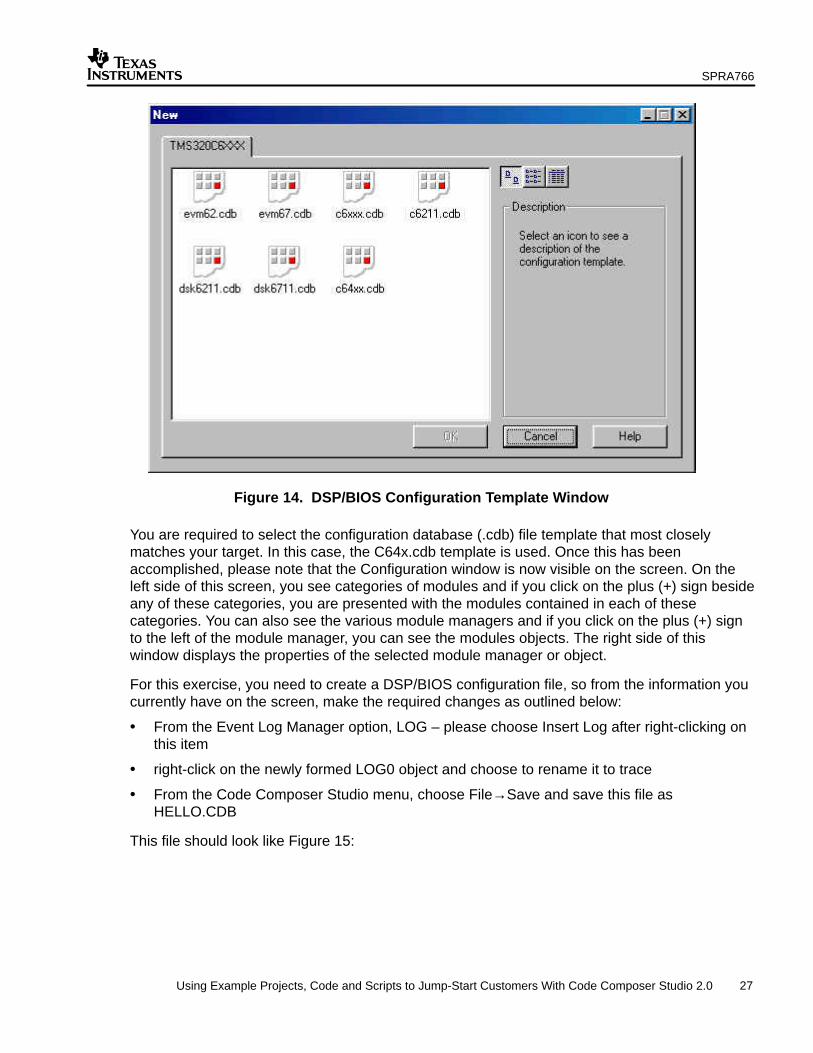
In order to proceed with using DSP/BIOS, you must ensure that Code Composer Studio is openand that your project is loaded. You must also ensure the file STD.H is loaded in order to utilizethe DSP/BIOS API and any other header or .h files for modules your program may use. Youmust also include a DSP/BIOS configuration file included with your project in order to takeadvantage of the DSP/BIOS API. This configuration file defines all objects and properties thatwill be used by the application program. Go to the File→New menu and choose the DSP/BIOSConfiguration option. At this point, you are presented with the window in Figure 14:
SPRA766
27 Using Example Projects, Code and Scripts to Jump-Start Customers With Code Composer Studio 2.0
Figure 14. DSP/BIOS Configuration Template Window
You are required to select the configuration database (.cdb) file template that most closelymatches your target. In this case, the C64x.cdb template is used. Once this has beenaccomplished, please note that the Configuration window is now visible on the screen. On theleft side of this screen, you see categories of modules and if you click on the plus (+) sign besideany of these categories, you are presented with the modules contained in each of thesecategories. You can also see the various module managers and if you click on the plus (+) signto the left of the module manager, you can see the modules objects. The right side of thiswindow displays the properties of the selected module manager or object.
For this exercise, you need to create a DSP/BIOS configuration file, so from the information youcurrently have on the screen, make the required changes as outlined below:
• From the Event Log Manager option, LOG – please choose Insert Log after right-clicking onthis item
• right-click on the newly formed LOG0 object and choose to rename it to trace
• From the Code Composer Studio menu, choose File→Save and save this file asHELLO.CDB
This file should look like Figure 15:

SPRA766
28 Using Example Projects, Code and Scripts to Jump-Start Customers With Code Composer Studio 2.0
Figure 15. DSP/BIOS Configuration File
Saving the configuration in Figure 15 generates a series of files. These files are header files,linker command files, BIOS header files, and so on. You also need to remove the library file thatyou used previously. A file named hello.ccf, which is a temporary file that is spawned whenopening the configuration file, is shown. It is not recommended to open, modify or delete this file.
You then need to add the specific DSP/BIOS files to the project as you did in the beginning.Once these DSP/BIOS generated files have been added to the project, you need to remove thefiles they have replaced. In this case, the files hello.cdb and hello.cfg.cmd, are added or need tobe added to the project. Once you have added these files, ensure you are also working with theVisual Linker or the text linker as the case may be, and go to Project→Rebuild All.
Please ensure that the executable has been loaded after the Rebuild All step and then go to theDSP/BIOS message log. In order to launch this, simply go to the DSP/BIOS menu item anddown to the Message Log option. This step presents the message log at the bottom of your codeComposer Studio screen. In order to test the program, right-click on the message log screen andchoose Properties Page. The Message Log Properties dialog appears. At this point, you need tocheck the Log to File checkbox and click OK. Go to the Debug menu and click on the Runoption. After a few seconds, the HELLO WORLD string should appear in the message logwindow. Right-click on the message log window and then do a File→Open and in the Debugfolder, there should be a HELLO.TXT file. If you open up this file, it should contain the samemessage that was just in the Message Log window. If you don’t see anything in the HELLO.TXTfile, it is likely because you did not close the Message Log window.

SPRA766
29 Using Example Projects, Code and Scripts to Jump-Start Customers With Code Composer Studio 2.0
At this time, it is also recommended that you disable the RTDX functionality, because Profiling isused in section 10.1. In order to do this, go to Tools→RTDX→Configuration Control in the CodeComposer Studio environment. This should be done because on most DSP platforms, theprofiler and RTDX cannot be used at the same time. For more detailed information on movingforward with DSP/BIOS and the Real Time Analysis Tools, it is recommended that you refer tothe Code Composer Studio tutorial and online help.
There is also the new functionality of the Chip Support Library (CSL) which is a C languageinterface for configuring and controlling peripherals that are on chip. These peripherals includetimers, DMA, and McBSP. It consists of modules that are built and archived into a library file.More information is available on this topic in the online help.
9.2 Advanced Event Triggering (AET)
Advanced Event Triggering or AET consists of the following components: Event Sequencer andthe Event Analyzer. Both of these components add to your ability to debug and analyze yourDSP code.
Event Analysis assists you to configure hardware debug tasks called jobs. You can setbreakpoints, action points and counters by right-clicking or by drag and drop.
Event Sequencing allows you to check for certain conditions to be met in a target DSP programand to trigger actions to occur when those specific conditions are met.
In order to setup a job with the Event Analysis component of Advanced Event Triggering, thetarget processor must contain and support on-chip analysis capabilities. Event Analysis can beselected from the Code Composer Studio Tools menu, under the Advanced Event Triggeringoption. The DSP simulator (C64x) used for this exercise does not currently support AdvancedEvent Triggering, so a brief description on how to setup this functionality is provided. For moredetailed information, it is advised you refer to the Code Composer Studio tutorial and/or theonline help. The Advanced Event Triggering tutorial has been designed to run with the C6211DSK and C6711 DSK DSPs, so it is recommended that you have one available in order to workthrough the tutorial lessons.
If you right-click in the Event Analysis window and choose a particular job, the job menu isactively built. The job menu is dependent on the target DSP setup or configuration. Onceenabled, a job performs analysis on your code when it is run on the target. If a job is notsupported on any particular target, the job is grayed out and not accessible.
If you choose to select a job from a source file, you can select information in the CodeComposer Studio Editor such as line, variables or code range and the Event Analysis toolassists you to fill in the job dialog.
You can view the job status by observing the icon in the Enable column. The following jobs canbe performed using this tool: hardware breakpoints and hardware breakpoints with count,chained breakpoints, data and program actionpoints, watchpoints and watchpoints with data,data access counter, watchdog timer, count, and counter in range. The status of a job can bemodified in two ways: right-clicking on an icon on the Event Analysis display or by selecting a jobin the Event Analysis display, modifying it and then clicking on Apply.
In order to create an Event Sequencer program, you can create Global Actions, Global Ifstatements, and states from the toolbar. These icons can be dragged and dropped from theSequencer toolbar into the Sequence Program Editor window in order to create a sequencerprogram.

SPRA766
30 Using Example Projects, Code and Scripts to Jump-Start Customers With Code Composer Studio 2.0
For more information on Advanced Event Triggering, please consult the online help and ideally,work through the Code Composer Studio tutorial.
9.3 Graphing With Code Composer Studio
Due to the fact that graphing is one of the original features of Code Composer Studio and thisdocument is intended to illustrate the new features and functionality, little time is spent on thesecapabilities within Code Composer Studio.
This advanced signal analysis interface enables you to critically and thoroughly monitor signaldata. The Code Composer Studio Graph menu provides a lot of flexibility through the manyoptions that it offers. Code Composer Studio allows you to select from a variety of graph typessuch as: FFT, image, eye, constellation, and time/frequency.
In order to visually analyze your code, for simplicity, the volume1 tutorial that is supplied withCode Composer Studio is used. You need to open the project file volume.pjt and load thevolume.out executable. When the executable is loaded, please issue a DEBUG RESTART andthen a DEBUG GO MAIN to set the program counter to the main() routine, and set a breakpointand a probepoint (using a right-click) on the following line in the volume.c file: processing(input,output);
Once you have done this, you need to go to the File menu and down to the File I/O option toconfigure the input to stream into the executable file you are about to graph. If you do not dothis, you will get invalid waveforms in your graph. Please click on the Add File button and checkthe Wrap Around checkbox. Once you have clicked on the Add File button, you should see aFile Input dialog and look for a file called SINE.DAT. Please select this file.
The File I/O dialog appears on screen with the File Input tab displayed. There are three fieldsunderneath the File Input field as follows: Probe, Address and Length. The Probe field tellswhether the point you wish to input data to is connected or not. The Address field identifies thestart address to input or output the data to or from. The Length field tells us how many samplesare transferred every time a Probe Point is reached.
The Address field accepts labels or numeric addresses. In this case, enter inp_buffer. ForLength, please enter 0x64. then click on Add Probe Point. This displays the Break/Probe PointManager dialog. You can click on the entry in the Probe Point field in order to highlight it and fillin the fields above the Probe Point field. Click on the Connect To pull down and select the File In….sine.dat option. Click Replace and then OK. The File I/O dialog should show that this point isnow Connected. Next you need to go to the View menu and to the Graph option and choose theTime Frequency graph. This displays a Properties dialog that allows you to select or changevarious graphing options. Name this graph Input , the start address is inp_buffer and theAcquisition Buffer and Display data size are set to 100 and click ok.
Once you begin to Animate your executable, you should see a perfect sine wave as illustrated inFigure 16.
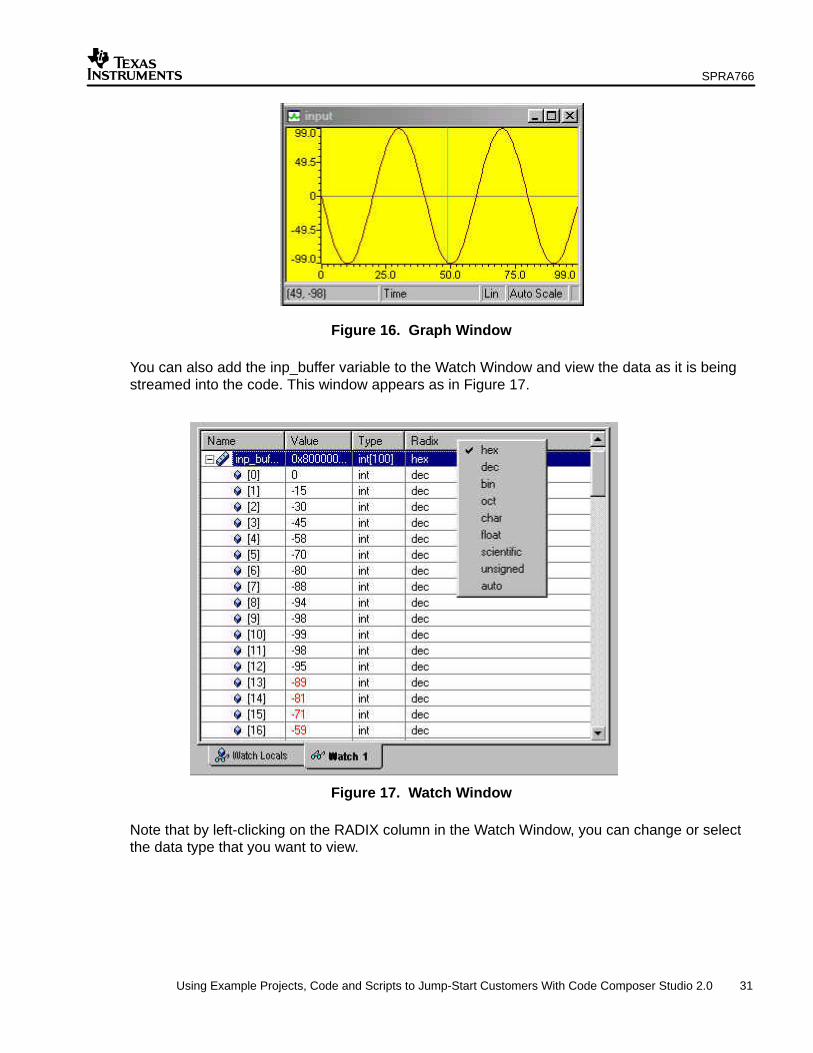
SPRA766
31 Using Example Projects, Code and Scripts to Jump-Start Customers With Code Composer Studio 2.0
Figure 16. Graph Window
You can also add the inp_buffer variable to the Watch Window and view the data as it is beingstreamed into the code. This window appears as in Figure 17.
Figure 17. Watch Window
Note that by left-clicking on the RADIX column in the Watch Window, you can change or selectthe data type that you want to view.
SPRA766
32 Using Example Projects, Code and Scripts to Jump-Start Customers With Code Composer Studio 2.0
10 Code Composer Studio and the Optimize Phase
10.1 Using the Profiler
In the optimize phase of the code development cycle, the goal is to profile or benchmark yourcode so that it is of small size and runs at optimal speed. By profiling the code, you can seewhere the most CPU cycles are being used and in turn, you can focus on these areas andattempt to optimize code performance and size. Code Composer Studio offers two methods ofdoing this: using the Code Composer Studio profiler and using a feature new to this release, theProfile Based Compiler or PBC.
The Code Composer Studio profiler analyzes your executable code and determines areas thatare need of optimization. In order to begin using the Code Composer Studio profiler, you mustkeep several things in mind as follows:
• You must remember to not reset the profile clock between the start and end breakpoints,otherwise the profile statistics or results will not be correct. Start and end breakpoints are setby the profiler to determine a range to be profiled and in turn, optimized.
• You should be aware that more branches and function calls that are within an area to beprofiled will cause the profiler to run slower. The profiler sets start and end breakpoints todefine the profile range and the profiler also sets breakpoints before and after each branchand function call. Each of these breakpoints causes the processor to halt in order to behandled and this slows performance of the profiler.
• You also need to bear in mind that when profiling in ROM, hardware breakpoints need to beused. The number of breakpoints that can be set are dependent on the processor itself andas a result, you may not be able to profile a range of code that contains branches. There is aworkaround to this issue in the online help.
In order to begin using the profiler, you must first have a project opened and an executableloaded onto the target. Once this has been done, go to the Profiler menu and choose the EnableClock option. The other selections from the Profiler menu are: Clock Setup, View Clock andStart New Session.
Clock Setup – allows you to choose whether to count CPU cycles, branches or NOPs. You canalso select the Instruction Cycle time in nanoseconds and select a Pipeline Adjustment.
View Clock – allows you to simply view the CLK variable.
Start New Session – presents you with a dialog with which to name a particular profile session.The default name is MySession.
When you have named your profile session and clicked OK, a Profile Statistics window opens atthe bottom of the Code Composer Studio screen. It should look similar to Figure 18.

SPRA766
33 Using Example Projects, Code and Scripts to Jump-Start Customers With Code Composer Studio 2.0
Figure 18. Profile Statistics Window
This window was actually too big to fit on the page for the purposes of this application note, butas can be seen, it provides the capability to calculate inclusive and exclusive counts, informationon file size, information on functions, ranges, and setup. The setup tab provides information onthe start and end points that you have chosen. The icons on the left side of the profile statisticswindow allow you to enable or disable a session, profile all the functions in your code, create aprofile area (for profiling a few lines at a time), create start and end points of where to profile,and to enable or disable a profile area. Another feature of this window is the ability to generatereports on the profiling statistics after you have profiled your code.
For the purpose of this application note, the Profile All Functions option was selected from theSatistics window. A Profile Range has been set up in the left-hand selection margin of the C source code and that should look similar to that in Figure 19:

SPRA766
34 Using Example Projects, Code and Scripts to Jump-Start Customers With Code Composer Studio 2.0
Figure 19. Profile Range Example
Once you begin to animate (Debug→Animate) the code, the various fields within the profilerstats window begin to populate with data obtained from the profiling process. From here, youcan determine where the majority of the CPU cycles are being used, and can begin to optimizefrom there with the goal of executable speed or size.
10.2 Profile Based Compilation (PBC)
Code Composer Studio also incorporates some new profiling functionality and that is ProfileBased Compilation. This feature allows you to choose between code size and code speed. PBCaccomplishes this by building your application with various compiler options and executing eachversion, collecting profile statistic information as it goes. Once it has collected all this informationfrom the various builds it has completed, PBC determines the best configurations andassignments of compiler options for each function. Then it is up to you to determine whichconfiguration or assignment is best for your specific application.
In order to enable to the PBC, simply go to the PBC menu at the top of the screen and down tothe Enable option. This displays the PBC Startup dialog that walks you through either the tutorialor the Getting Started phase of using this tool. Clicking OK opens up the PBC Wizard, whichwalks you through the process of creating configurations for your application. The PBC Wizard isillustrasted in Figure 20:

SPRA766
35 Using Example Projects, Code and Scripts to Jump-Start Customers With Code Composer Studio 2.0
Figure 20. PBC Wizard Dialog
Each tab is numbered to allow you to follow the process through in logical progression. Passingthe cursor over each tab displays options for each step in the process.
The Setup tab allows you to select Exit Points, Profile Ranges, and PBC Configurations.
The Profile tab provides the ability to Build and Profile a configuration, or to ReBuild andReProfile a configuration.
The Select Configuration tab lets you view your selected configuration and view or apply anyoverrides. Overrides are specific compiler options that have been ignored for a particularfunction.
The Save tab lets you verify your configuration and save it to a project.
When building and profiling from the Profile tab, please ensure that you have created an exitpoint for any application you wish to profile that is not self-terminating, otherwise the build andprofile stage could go on indefinitely. For more information on Profile Based Compilation, pleaserefer to either the online help or the PBC Wizard to walk you through the process.
11 Summary
Over the past pages of this application note, many things were accomplished and many newfeatures and functionality were introduced. In summary the following were discussed:
• The building of code using the Code Composer Studio Editor and Project Manager
• How to link a program with the Visual Linker and to configure CCS to use either the VisualLinker or the text linker
• How to set up CCS to use an external editor and source control
• The debug phase of the development cycle where the Symbol Browser and C++ Supportwere introduced
• Steps to analyze code, and DSP/BIOS, Chip Support Library, Advanced Event Triggering,and graphing functionality
• The CCS profiler and Profile Based Compilation

SPRA766
36 Using Example Projects, Code and Scripts to Jump-Start Customers With Code Composer Studio 2.0
By now, you should have a basic understanding of the Code Composer Studio environment andwhat all the features included with the software do. Unfortunately, it is impossible to provide thedetailed information in this application note to make one an expert with the software. That willcome with exposure and practice with the environment as well as reading through the onlinehelp and working with the examples that are supplied.
12 Glossary of New Features in CCS 2.0
Chip Support Library – a C-language interface for configuring and controlling on-chipperipherals. Included are a set of macros for accessing specific registers and bit fields as well aseXpressDSP naming conventions. Texas Instruments has also included support for XBUS andPCI and have standardized the naming conventions for CSL header files to CSL_
Code Composer Studio Setup – has been enhanced to include many new target-specificconfiguration files to reflect the many new TI DSPs on the market.
Code Generation Tools – the Texas Instruments compiler has been enhanced to support C++.There is also a new linker option to enable function subsections and the run-time librariessupport both C and C++.
CCS Debugger – has been upgraded so you can specify the search path for include files and toview local variables while debugging. There is also support for shared memory and a series ofnew GEL functions have been added.
DSP/BIOS – now supports C55x and C64x platforms as well as C++. There is also a HWIdispatcher that supports the C54x platform. The configuration and analysis tools have also beenenhanced.
CCS Project Manager – has been enhanced to support multiple projects and allow you to savean active project before switching to another project. There is also support for multipleconfigurations and the ability to specify a link order when building a project. External make filesupport and source code control has also been added.
RTDX – Real Time Data Exchange has been added to allow you to transfer data between hostand target without interfering with the target application. This allows you to monitor your systemin real-time which is important for providing a realistic representation of your system in timecritical applications.
Text Editor – has been upgraded to provide you with more flexibility for choosing cursor mode,editor properties, selection margin, keyword highlighting, choosing a third party editor, etc.
TI Command Window – many new features have been incorporated into this area and they areas follows: Profile Based Compiler, Watch Window, Symbol Browser, Component Manager,Update Advisor, and Advanced Event Triggering.
TMS320 Algorithm Standard – TI has created this algorithm standard to provide a commonplatform or template for any algorithms to run on TI DSPs. This allows these algorithms to beportable and standardized.
Visual Linker – allows you to visually see and configure your code into a graphic representationof memory on the DSP.

IMPORTANT NOTICE
Texas Instruments and its subsidiaries (TI) reserve the right to make changes to their products or to discontinueany product or service without notice, and advise customers to obtain the latest version of relevant informationto verify, before placing orders, that information being relied on is current and complete. All products are soldsubject to the terms and conditions of sale supplied at the time of order acknowledgment, including thosepertaining to warranty, patent infringement, and limitation of liability.
TI warrants performance of its products to the specifications applicable at the time of sale in accordance withTI’s standard warranty. Testing and other quality control techniques are utilized to the extent TI deems necessaryto support this warranty. Specific testing of all parameters of each device is not necessarily performed, exceptthose mandated by government requirements.
Customers are responsible for their applications using TI components.
In order to minimize risks associated with the customer’s applications, adequate design and operatingsafeguards must be provided by the customer to minimize inherent or procedural hazards.
TI assumes no liability for applications assistance or customer product design. TI does not warrant or representthat any license, either express or implied, is granted under any patent right, copyright, mask work right, or otherintellectual property right of TI covering or relating to any combination, machine, or process in which suchproducts or services might be or are used. TI’s publication of information regarding any third party’s productsor services does not constitute TI’s approval, license, warranty or endorsement thereof.
Reproduction of information in TI data books or data sheets is permissible only if reproduction is withoutalteration and is accompanied by all associated warranties, conditions, limitations and notices. Representationor reproduction of this information with alteration voids all warranties provided for an associated TI product orservice, is an unfair and deceptive business practice, and TI is not responsible nor liable for any such use.
Resale of TI’s products or services with statements different from or beyond the parameters stated by TI forthat product or service voids all express and any implied warranties for the associated TI product or service,is an unfair and deceptive business practice, and TI is not responsible nor liable for any such use.
Also see: Standard Terms and Conditions of Sale for Semiconductor Products. www.ti.com/sc/docs/stdterms.htm
Mailing Address:
Texas InstrumentsPost Office Box 655303Dallas, Texas 75265
Copyright 2001, Texas Instruments Incorporated