using data to set achievable goals - successline · pdf fileusing data to set achievable goals...
TRANSCRIPT

0
Using Datato Set Achievable Goals
Presented by
DeborahWahlstrom
For the Fine Educators Supported byHeartland AEA II
May 2002Copyrighted 2002 Successline Inc Do not reproduce without permission

1
Today’s Targets1. Set challenging, yet attainable goals based on
high standards for desired levels of student achievement.
2. Identify options available for setting goals with subgroups of students.
3. Recognize that small increments of continuous growth in student achievement are more than acceptable progress.
Copyrighted 2002 Successline Inc Do not reproduce without permission

2
3 Types of DataOutcome Demographic Process
What they got Who got it How/why they got it
Source: Using Data to Improve Student Achievement by Deborah Wahlstrom
Percentage of students in highest proficiency level on district assessment
Percentage of students earning an A or B in language arts
Percentage of students scoring at the 50th percentile or above on norm-referenced test
Percentage of minority students in highest proficiency level on district assessment
Percentage of ELL students earning an A or B in language arts
Percentage of low SES students scoring at the 50th percentile or above on norm-referenced test
Amount of time students read during the school day
Listing of types of writing students do in school
Report of alignment results — reading textbook to district standards
Copyrighted 2002 Successline Inc Do not reproduce without permission

3
3 Types of DataOutcome Demographic Process
Source: Using Data to Improve Student Achievement by Deborah Wahlstrom
ACT score results
ITBS results —Mathematics
NWEA results
AP Exam results
Course grades
Race/ethnicity
Gender
SES
Students with disabilities
ELL
Migrant
Percent of time students spend reading
Types of writing assignments
Alignment of textbook to curriculum
Alignment of test to curriculum
Copyrighted 2002 Successline Inc Do not reproduce without permission

4
Examples ofStudent Achievement Data
Reading Mathematics Science
• Iowa Tests of Basic Skills• Iowa Tests of
Educational Development• District-wide Assessment• Commercially-produced
AssessmentTests for Higher AchievementHarcourt-BraceNWEA
• Student Grades (A, B, C, D, F)
• Students Reading on Grade Level
• Students Mastering District Standards
• ACT• SAT• AP Exams
• Iowa Tests of Basic Skills• Iowa Tests of
Educational Development• District-wide Assessment• Commercially-produced
AssessmentTests for Higher AchievementHarcourt-BraceNWEA
• Student Grades (A, B, C, D, F)
• Students Mastering District Standards
• ACT• SAT• AP Exams
• Iowa Tests of Basic Skills• Iowa Tests of
Educational Development• District-wide Assessment• Commercially-produced
AssessmentTests for Higher AchievementHarcourt-BraceNWEA
• Student Grades (A, B, C, D, F)
• Students Mastering District Standards
• AP Exams
Source: Using Data to Improve Student Achievement by Deborah Wahlstrom
Copyrighted 2002 Successline Inc Do not reproduce without permission

5
Use Questions to Help You Focus Data1. Do we have quality?
2. Do we have equity? Are subgroups of students performing at similar levels on the same test? Are there differences in achievement between groups of students?
3. How do our scores compare to the scores for the school district? The state? How do our scores compare to where we want to be?
4. How do the percentages of students in each achievement level compare from one year to the next? Does a greater percentage of students achieve in the advanced range each year?
5. What areas of weakness do we need to address? These may be areas we want to reteach and remediate.
Source: Using Data to Improve Student Achievement by Deborah Wahlstrom
6. What are our areas of strength? These are areas we want to maintain and reinforce.
7. Did our 8th grade students make progress in reading this year?
8. What effect did increasing the amount of time for reading (from 30 minutes to 45 minutes daily) have on the reading achievement of our students?
Copyrighted 2002 Successline Inc Do not reproduce without permission

6
Definition
Quality Indicators for
A long-range goal is a statement of the desired measurable student outcome that has been derived from the prioritized needs of the school.
Long-range goals span three to five years.
Meets Requirements Exceeds Requirements
1. Addresses improvement of student achievement.
2. Aligned with needs assessment data.
3. Exists for reading, math, and science.
4. Based on one data source.
5. Annual improvement goals are clearly aligned with them.
1. Anchored in student behaviors — demonstrations of what students know and can do.
2. Focuses on one student behavior.
3. Exists in areas other than reading, math, and science.
4. Based on multiple sources of data.
5. Monitored by progress with annual improvement goals.
6. Aligned with school’s mission/vision.
7. Aligned with standards.
Long-Range Improvement Goals
Adapted from: Data Analysis to Goal Setting: Writing Quality Goals, Iowa Department of EducationCopyrighted 2002 Successline Inc Do not reproduce without permission
7
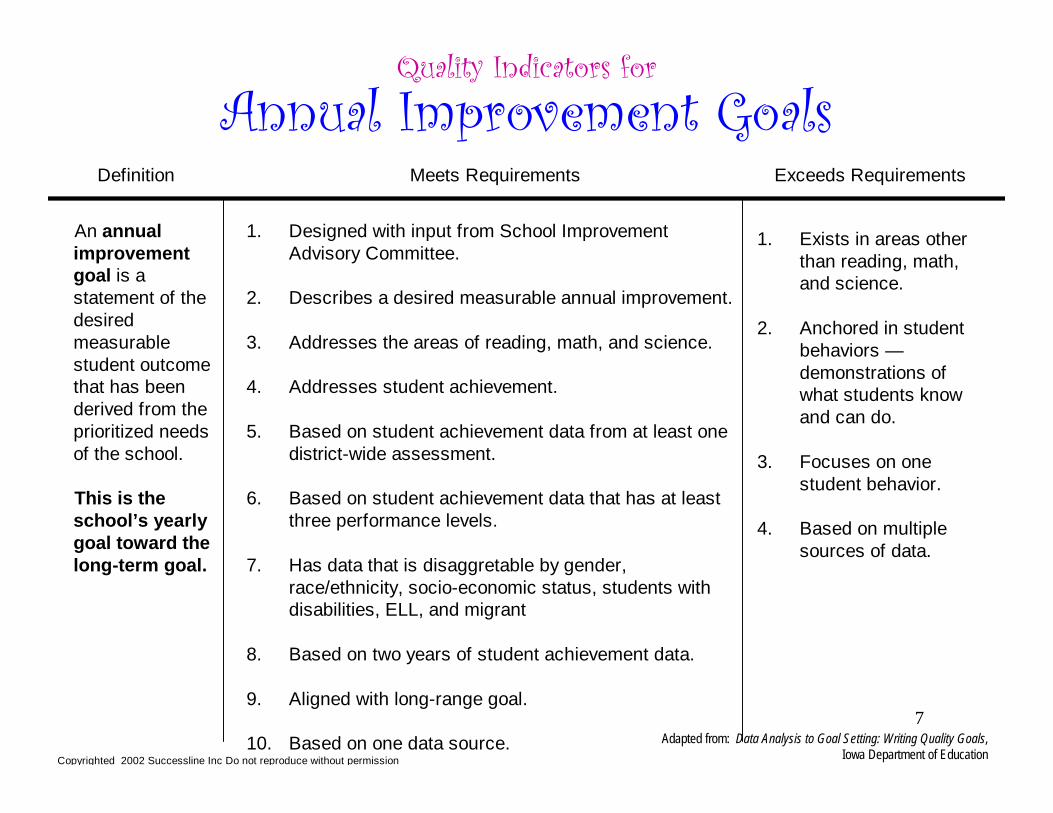
Definition
Quality Indicators for
Meets Requirements Exceeds Requirements
1. Designed with input from School Improvement Advisory Committee.
2. Describes a desired measurable annual improvement.
3. Addresses the areas of reading, math, and science.
4. Addresses student achievement.
5. Based on student achievement data from at least one district-wide assessment.
6. Based on student achievement data that has at least three performance levels.
7. Has data that is disaggretable by gender, race/ethnicity, socio-economic status, students with disabilities, ELL, and migrant
8. Based on two years of student achievement data.
9. Aligned with long-range goal.
10. Based on one data source.
1. Exists in areas other than reading, math, and science.
2. Anchored in student behaviors —demonstrations of what students know and can do.
3. Focuses on one student behavior.
4. Based on multiple sources of data.
Annual Improvement GoalsAn annual improvement goal is a statement of the desired measurable student outcome that has been derived from the prioritized needs of the school.
This is the school’s yearly goal toward the long-term goal.
Adapted from: Data Analysis to Goal Setting: Writing Quality Goals, Iowa Department of EducationCopyrighted 2002 Successline Inc Do not reproduce without permission

8
A Good Goal Has These Components
1. Time frame
2. Criteria amount for making goal
3. Target group
4. Task/behavior
5. Measurement tool
When
WhoWhatHow
How Much
Adapted from: Data Analysis to Goal Setting: Writing Quality Goals, Iowa Department of EducationCopyrighted 2002 Successline Inc Do not reproduce without permission

9
Time Frame1.1 Determine if this is an annual improvement goal or a
long-range goal.
1.2 Determine the real amount of time you have to meet your goal.
1.3 Direct instructional strategies and actions toward the long-term goal.
Adapted from: Data Analysis to Goal Setting: Writing Quality Goals, Iowa Department of EducationCopyrighted 2002 Successline Inc Do not reproduce without permission

10
Criteria Amount for Achieving Goal2.1 Determine the amount of change you want to see in your
results. This amount should be challenging yet attainable.
2.2 Determine what you will use to determine the criteria. This may include research, previous goal amounts, CSIP or other goals.
2.3 Determine if the decision will be clear cut or ambiguous.
2.4 Determine if the criteria is quantifiable.
Adapted from: Data Analysis to Goal Setting: Writing Quality Goals, Iowa Department of EducationCopyrighted 2002 Successline Inc Do not reproduce without permission

11
Types of Score SystemsRaw ScoreThe number of questions or items that a student answers correctly on a test.
Mean ScoreThe average score in a set of scores.
Percent Correct ScoreThe percentage of test items a student answers correctly.
Scaled ScoreA mathematical transformation of a raw score into a score within an achievement continuum.
Percentile ScoresA point on a score scale that divides a score distribution into two parts: the part equal to or below the score — and the part above.
Stanine ScoresGroupings of percentile ranks into a nine-unit scale. A stanine is one of the steps in this nine-point scale.
Percent in a Proficiency LevelThe percentage of students who achieved a score within a proficiency level range.
Copyrighted 2002 Successline Inc Do not reproduce without permission

12
Setting High, Yet Attainable GoalsHow is a goal like a rubberband?
Copyrighted 2002 Successline Inc Do not reproduce without permission

13
Are These Challenging Goal Amounts?Example 1A school has set a goal of having 3% more 4th grade students in the proficient range on the Iowa Tests of Basic Skills (ITBS) Reading Comprehension assessment. (There are 80 4th grade students in this school)
Example 2A school has set the goal of 90% of its 4th graders meeting or exceeding the proficiency cut score on the District’s Math assessment.
Example 3Five percent of the students in the 11th grade will move to the proficient or advanced categories of ITEDs.
Example 4After establishing a base score on the Iowa Tests of Basic Skills in the third grade, 75% of our students will achieve at least one year’s growth in mathematics each year.
Example 5Annual improvement of 1% per year over baseline data to reach the long term goal.
Copyrighted 2002 Successline Inc Do not reproduce without permission

Percent Increase vs. Percentage Points
2001-2002 2002-2003 2003-2004 2004-2005 2005-2006 2006-2007Baseline Year 1 Year 2 Year 3 Year 4 Year 5
47% 52% 57% 61% 66% 71%
47% 49% 51% 54% 57% 60%
Five-Year Long-Term Goal
During the 2002-2003 school year, Pleasantville Elementary will have 5% more 4th grade students in the proficient ranged as measured by the Reading Comprehension subtest of the Iowa Tests of Basic Skills.
5 percentage points increase
5 percent increase
Copyrighted 2002 Successline Inc Do not reproduce without permission

15
Writing the Goal AmountFrom _____ to _____
Example 1A school has set a goal of having 3% more 4th grade students in the proficient range on the Iowa Tests of Basic Skills (ITBS) Reading Comprehension assessment. (There are 80 4th grade students in this school)
Example 2A school has set the goal of 90% of its 4th graders meeting or exceeding the proficiency cut score on the District’s Math assessment.
Example 3Five percent of the students in the 11th grade will move to the proficient or advanced categories of ITEDs.
Copyrighted 2002 Successline Inc Do not reproduce without permission
16
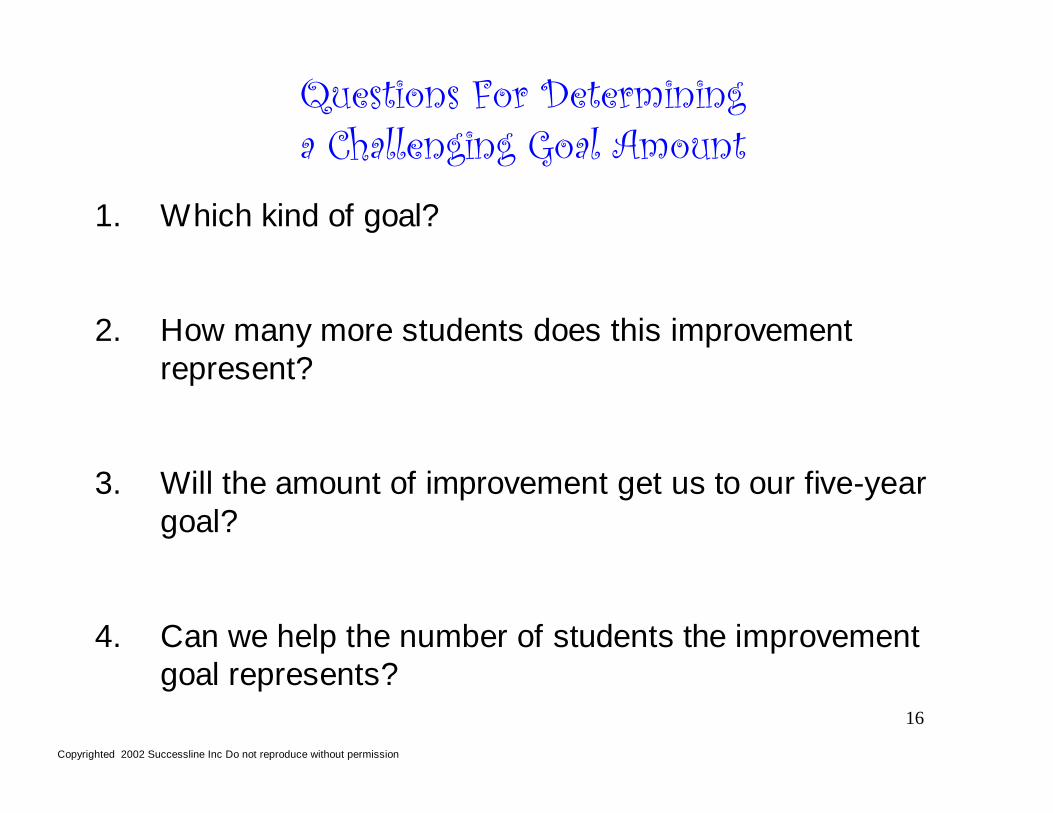
Questions For Determininga Challenging Goal Amount
1. Which kind of goal?
2. How many more students does this improvement represent?
3. Will the amount of improvement get us to our five-year goal?
4. Can we help the number of students the improvement goal represents?
Copyrighted 2002 Successline Inc Do not reproduce without permission

17
What is a Worthy Increase in Goal Amounts?
Looking for increases or decreases in the percentage of students
% of Students Achieving a
Standard
% ofStudents Change
Examples• Decrease in the percentage of
students scoring in the basic proficiency level.
• Increase in percentage of students scoring at or above the 50th percentile.
Goal Amount10-25% of the group you’re trying to move
Looking for increases in the percentage of students meeting standards
Examples• Increase in the percentage of
students passing the district writing test.
• Increase in the percentage of students achieving mastery in a science class.
Goal Amount75-80% mastery for all students
Source: Using Data to Improve Student Achievement by Deborah WahlstromCopyrighted 2002 Successline Inc Do not reproduce without permission

18
Which Goals Show Acceptable Progress?Baseline Year Information Year 2 Improvement Goal Information
# of Students
Taking Baseline
Test
% of Students Showing
Proficiency Baseline
Score
# of Students
Achieving at Baseline
Score# of Students
in Year 2
% of Students Showing
Proficiency Goal
Improvement Score Year 2
# of Students Needed to
Meet Year 2 Goal
# of Students the
Improvement Represents
Yes Not Yet 100 60% 60 101 69% 69 9
Yes Not Yet 84 60% 50 90 69% 62 12
Yes Not Yet 55 60% 33 54 69% 37 4
Yes Not Yet 42 60% 25 42 69% 29 4
Yes Not Yet 120 73% 118 76%
Yes Not Yet 120 73% 118 78%
Yes Not Yet 120 73% 118 81%
Yes Not Yet 120 73% 118 83%
Copyrighted 2002 Successline Inc Do not reproduce without permission

19
Will Our Goal Get Us To Our Target?
2001-2002 02-03 03-04 04-05 05-06 06-07 07-08 08-09 09-10 10-11 11-12 12-13 13-14Baseline AYP 1 AYP 2 AYP 3 AYP 4 AYP 5 AYP 6 AYP 7 AYP 8 AYP 9 AYP 10 AYP 11 AYP 12
47 % 52% 57% 61% 66% 71% 76% 81% 86% 91% 97% 99% 100%
Twelve-Year Goal — Working Toward No Child Left Behind Act
2001-2002 2002-2003 2003-2004 2004-2005 2005-2006 2006-2007Baseline Year 1 Year 2 Year 3 Year 4 Year 5
47% 52% 57% 61% 66% 71%
Five-Year Long-Term Goal
During the 2002-2003 school year, Pleasantville Elementary will have 3% more 4th grade students in the proficient ranged as measured by the Reading Comprehension subtest of the Iowa Tests of Basic Skills.
Copyrighted 2002 Successline Inc Do not reproduce without permission
20
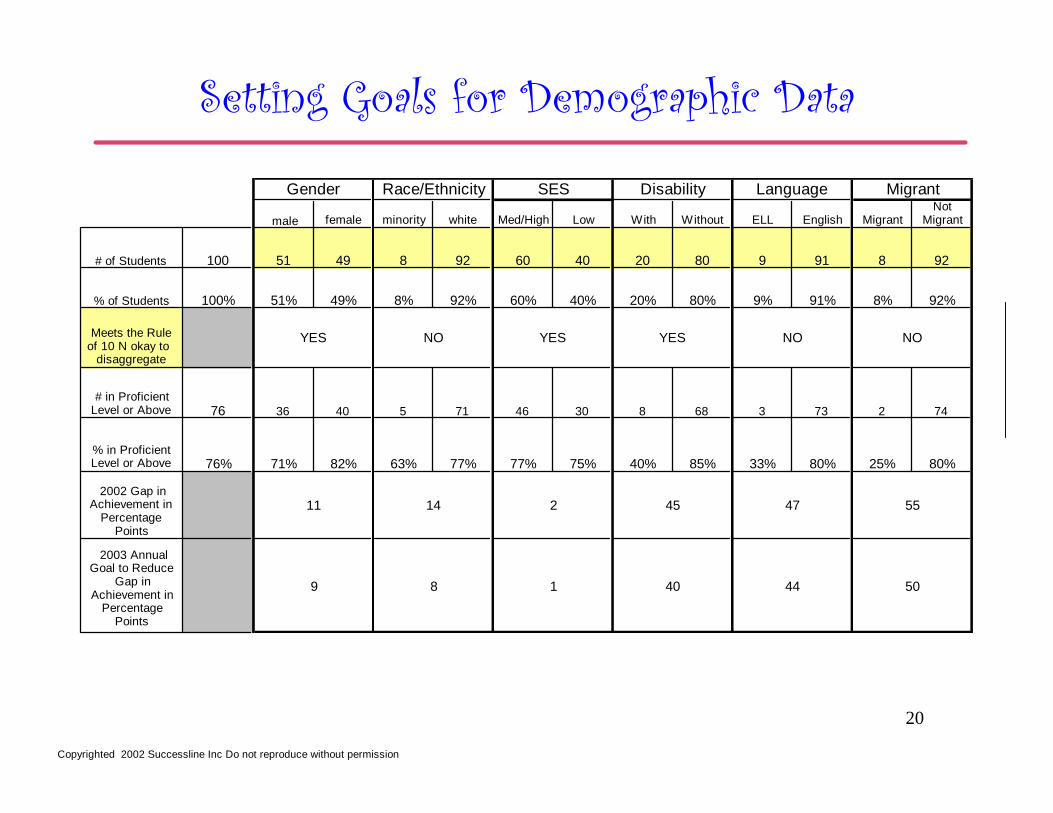
Setting Goals for Demographic DataGender Race/Ethnicity SES Disability Language Migrant
male female minority white Med/High Low With Without ELL English MigrantNot
Migrant
# of Students 100 51 49 8 92 60 40 20 80 9 91 8 92
% of Students 100% 51% 49% 8% 92% 60% 40% 20% 80% 9% 91% 8% 92%
Meets the Rule of 10 N okay to
disaggregate
YES NO YES YES NO NO
# in Proficient Level or Above 76 36 40 5 71 46 30 8 68 3 73 2 74
% in Proficient Level or Above 76% 71% 82% 63% 77% 77% 75% 40% 85% 33% 80% 25% 80%
2002 Gap in Achievement in
Percentage Points
11 14 2 45 47 55
2003 Annual Goal to Reduce
Gap in Achievement in
Percentage Points
9 8 1 40 44 50
Copyrighted 2002 Successline Inc Do not reproduce without permission
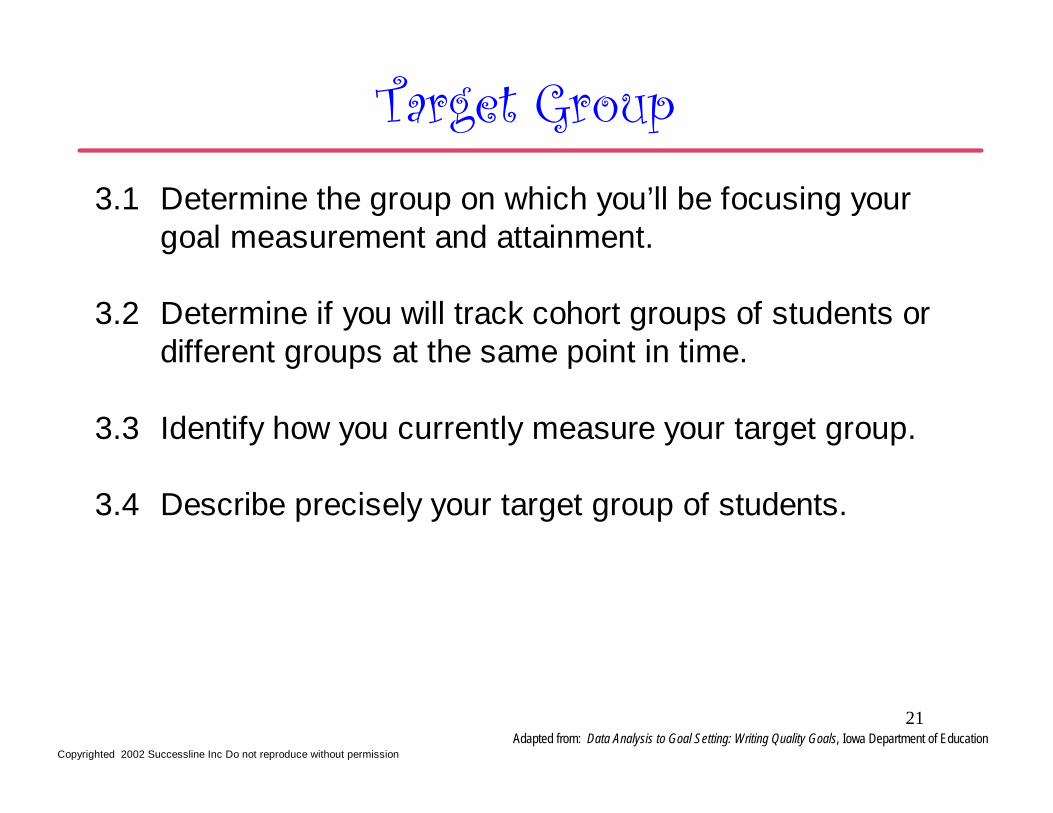
21
Target Group3.1 Determine the group on which you’ll be focusing your
goal measurement and attainment.
3.2 Determine if you will track cohort groups of students or different groups at the same point in time.
3.3 Identify how you currently measure your target group.
3.4 Describe precisely your target group of students.
Adapted from: Data Analysis to Goal Setting: Writing Quality Goals, Iowa Department of EducationCopyrighted 2002 Successline Inc Do not reproduce without permission

22
Scores and Student Groups
Definition
Cohort GroupDifferent Groups Measured
at Same Time
Examples
A group of students that do not share a particular characteristic.
Comparison of ITBS Reading for students in 3rd grade in spring 2002 to students in 3rd grade in spring 2003.
A group of students that share a particular characteristic — such as a year in a specific grade level.
Comparison of ITBS Reading for students when they were in grade 3 and again in grade 4.
Grade Level
Test Year
Grade 3
Grade 4
Grade 5
Grade 6
Grade 7
2002 ITBS ITBS ITBS ITBS ITBS
2003 ITBS ITBS ITBS ITBS
2004 ITBS ITBS ITBS
2005 ITBS ITBS
2006 ITBS
Year Tested
Grade Level 2002 2003 2004 2005 2006
Grade 3 ITBS ITBS ITBS ITBS ITBS
Grade 4 ITBS ITBS ITBS ITBS ITBS
Grade 5 ITBS ITBS ITBS ITBS ITBS
Grade 6 ITBS ITBS ITBS ITBS ITBS
Grade 7 ITBS ITBS ITBS ITBS ITBS
TrackingPattern
Copyrighted 2002 Successline Inc Do not reproduce without permission

23
Tasks and Behaviors4.1 Describe what you want your students to do or achieve.
4.2 Include a performance descriptor to help define what you want your students to achieve.
4.3 Determine if the task meets the M+M2 strategy: Meaningful, Measurable, Monitorable, Make decisionable
Adapted from: Data Analysis to Goal Setting: Writing Quality Goals, Iowa Department of EducationCopyrighted 2002 Successline Inc Do not reproduce without permission

24
What do you want students to do?Increase
Decrease
Maintain
Meet or exceed
Achieve
Perform
Attain
Earn
Accomplish
Obtain
GainCopyrighted 2002 Successline Inc Do not reproduce without permission

25
Performance Descriptors
Proficient rangeAdvanced levelCut score50th percentile or above
Achievement LevelsLow, average, highLess than proficient, proficient, advancedSkilled, accomplished, distinguishedLow, intermediate, highFail, pass proficient, pass advancedDoes not meet, meets, exceeds
Copyrighted 2002 Successline Inc Do not reproduce without permission

26
Measurement Tool5.1 Determine the technical adequacy (reliability, validity,
fairness) of the assessment(s) you use.
5.2 Identify trend data on this assessment.
5.3 Determine if the data you get from the test results can be disaggregated by subgroups of populations.
5.4 Determine if the data from the test includes at least three performance levels.
5.5 Determine whether the assessment will allow you to collect and make mid-course corrections or if it is a one time assessment.
Adapted from: Data Analysis to Goal Setting: Writing Quality Goals, Iowa Department of EducationCopyrighted 2002 Successline Inc Do not reproduce without permission

27
School ____________________________ Goal Area ______________________(Reading, Writing, Math, Science, SS)
SIAC Input: Teachers Administrators Students Parents Community Members(circle all that apply)
Desired Measurable Annual Improvement Goal
Assessment Tools For Annual Improvement Goals
3 Performance Levels Disaggregated Data Years Data is Available
Student Achievement DataScore
System Low Medium High Gen
der
Rac
e E
thni
city
SE
S
Stu
dent
s W
ith
Dis
abili
ties
ELL
Mig
rant
2001 2002 2003Mid-Course Corrections
ITBS Grade 3 (NRT) scaleLess Than Proficient Proficient Advanced yes yes yes yes yes yes yes yes yes no
ITBS Grade 4 (NRT) scaleLess Than Proficient Proficient Advanced yes yes yes yes yes yes yes yes yes no
NWEA Grade 4percent correct Low Average High yes yes no yes yes no yes yes yes yes
ITBS Grade 5 (NRT) scaleLess Than Proficient Proficient Advanced yes yes yes yes yes yes yes yes yes no
Suc c esslin eElem en tary Readin g
By the 20 0 2-20 0 3 sc hool year, 8 6 % of studen ts in grades 3-5 w ill sc ore at or above the profic ien t levels in readin g as m easured by the Readin g C om prehen sion subtest of the I ow a Tests of Basic S k ills.
Copyrighted 2002 Successline Inc Do not reproduce without permission

28
Chart: Assessment Tools for Annual Improvement GoalsPurposes1. Organize data related to the Quality Indicators for Annual Improvement Goals.2. Analyze the data in the chart to make decisions about setting goals.
Analysis Questions1. What student achievement data is available for this goal area?
2. For which grade levels is this available?
3. Which of the tests are norm-referenced tests?
4. Which of the tests are criterion-referenced tests?
5. What are the score systems for each of the tests?
6. Which tests have three performance levels?
7. Which tests DO NOT have three performance levels?
8. In which ways can the data from the tests be disaggregated?
9. Which tests can be used to show trend data?
10. How much data do we need?Copyrighted 2002 Successline Inc Do not reproduce without permission

29
Generic Format For Writing a GoalThe context includes previous assessment results, trend information, previous goal results in same area, persons involved in determining the goal, and current strategies/practices in meeting previous goals. Include graphs of the trend data related to the goal.
During timeframe, (your district name) will have criteriaof target group will task/behavior as measured by assessment.
Include a brief description of the actions, strategies, and interventions to help students meet the goals. This could include staff development, technology, and other aspects of your school improvement planning.
Context
Goal
Actions
Adapted from: Data Analysis to Goal Setting: Writing Quality Goals, Iowa Department of EducationCopyrighted 2002 Successline Inc Do not reproduce without permission

30
Key Parts to an Iowa Improvement Goal
When
During timeframe, (your district name) will have criteria of target group will task/behavior as measured by assessment.
How Much
Who
WhatHow
Copyrighted 2002 Successline Inc Do not reproduce without permission

31
Examples — Generic GoalExample 1During the 2002-2003 school year, Pleasantville Public School District will have 3% more 4th grade students in the proficient range as measured by the Iowa Tests of Basic Skills (ITBS) Reading Comprehension assessment.
Example 2During the 2002-2003 school year, 90% of the Pleasantville Public School District 4th graders will meet or exceed the proficiency cut score on the District’s Math Assessment.
Copyrighted 2002 Successline Inc Do not reproduce without permission

32
Are These Well-Written Goals?Example 1During the 2002-2003 school year, Pleasantville Public School District will have 3% more 4th grade students in the proficient range as measured by the Iowa Tests of Basic Skills (ITBS) Reading Comprehension assessment.
Example 2Increase the percentage of freshmen who take and successfully complete Algebra 1 by 5% annually.
Example 3Work toward our 5-year goal to decrease the gender bias in math.
Example 4Significantly increase the amount of independent reading by students.
Example 5High 53.3% or higher, Intermediate 46.7% or lower, Low 0%
Example 6Reduce the amount of risky behaviors through the development of character values.
Yes Not Yet
Yes Not Yet
Yes Not Yet
Yes Not Yet
Yes Not Yet
Yes Not Yet
Copyrighted 2002 Successline Inc Do not reproduce without permission

33
References for Today’s WorkshopIowa Department of Education. Data Analysis to Goal Setting: Writing Quality Goals, Technical Assistance Document. January 2002
Wahlstrom, Deborah. Using Data to Improve Students Achievement. Successline Inc. 2000.
Special ThanksSteve Fey, Iowa Department of EducationKeith Lyles, Iowa Department of EducationJane Neff, Heartland AEA II
Deborah’s Contact InformationDeborah Wahlstrom, Successline Inc137 Pitchkettle Point CircleSuffolk, VA 23434
Phone: 757-422-2802Fax: 757-422-5421Email: [email protected]
Copyrighted 2002 Successline Inc Do not reproduce without permission

34
Baseline Year Information Year 2 Improvement Goal Information
# of Students
Taking Baseline
TestBaseline
Score
# of Students
Achieving at Baseline
Score# of Students
in Year 2
Goal Improvement Score Year 2
# of Students Needed to
Meet Year 2 Goal
# of Students the
Improvement Represents
Yes Not Yet 100 60% 60 101 69% 69 9
Yes Not Yet 84 60% 50 90 69% 62 12
Yes Not Yet 55 60% 33 54 69% 37 4
Yes Not Yet 42 60% 25 42 69% 29 4
Yes Not Yet 120 73% 88 118 76% 90 2
Yes Not Yet 120 73% 88 118 78% 92 4
Yes Not Yet 120 73% 88 118 81% 95 7
Yes Not Yet 120 73% 88 118 83% 98 10
Which Goals Show Acceptable Progress?
— Answer Sheet —
Copyrighted 2002 Successline Inc Do not reproduce without permission

35
Which Type of Goal?1. Increase number of students showing one year’s growth
using ITBS/ITED and other assessments.
2. 60% will meet or exceed the standard, an increase of 21%
3. The percent of 11th grade students scoring in the proficient level on the ITED Math test will increase.
4. Eighth-grade math: 5-8 students will improve on data interpretation skills (reading and comprehending graphs, charts, etc.)
Copyrighted 2002 Successline Inc Do not reproduce without permission

36
Who is in the Target Group?1. Maintain 90% of the students in grades 3-11 at above
proficient level in math as measured by ITBS/ITED.
2. Increase math computation in grades 2-4.
3. 3% of our students in all grades 3-8, who are less than proficient will move to the proficient range as measured by the Mid-Iowa Achievement Level Test (MIALT).
4. Writing effectiveness: the percent of students scoring at standard will increase 3%. Fifteen percent will meet the standard with honors (increase of 4%).
Copyrighted 2002 Successline Inc Do not reproduce without permission