using data - · pdf file11/5/2013 2 jefferson elementary school k-6 mario marcos, principal...
TRANSCRIPT
11/5/2013
1
Using data to focus instructional improvement is not rocket science, but a systematic step by step process, that if assiduously followed will lead to continuous improved student achievement.
Riverview Elementary – 3Languges Dr. Kyriakidis, Principal
11/5/2013
2
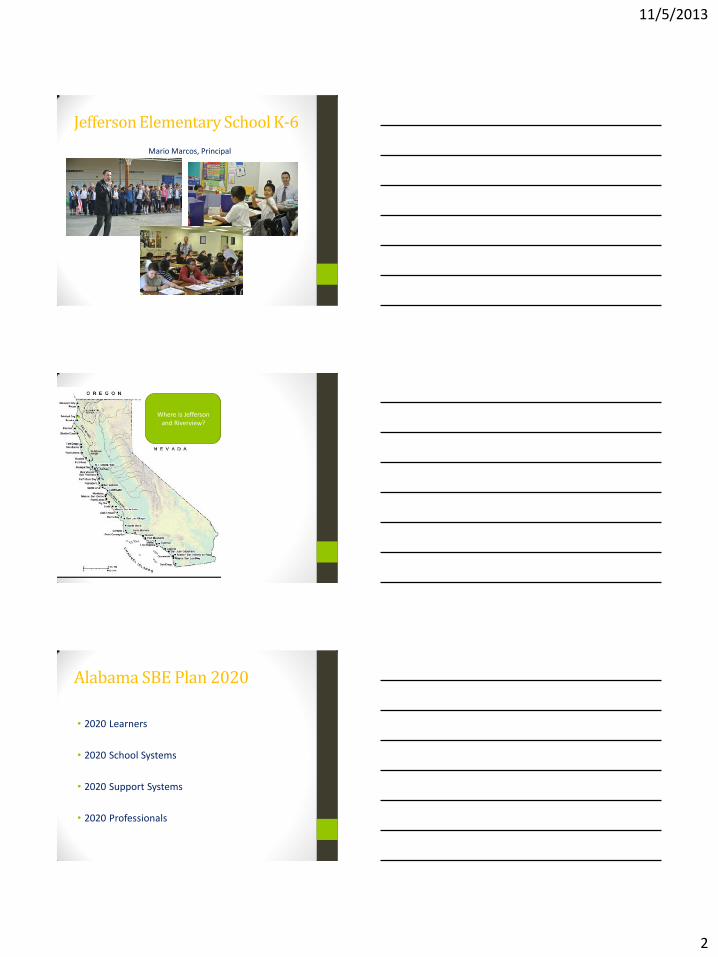
Jefferson Elementary School K-6
Mario Marcos, Principal
• Where is Jefferson
and Riverview?
Alabama SBE Plan 2020
• 2020 Learners
• 2020 School Systems
• 2020 Support Systems
• 2020 Professionals
11/5/2013
3
Our Mission
To prepare kids to thrive in a global society that we cannot yet imagine.
People’s Republic of China
• Mission
• Medium to Long Term Education Plan
• PLCs and Use of Data
• Mantra
Teacher: Why are you standing on your head?
Pupil: I’m just turning things over in my head sir.
11/5/2013
4
Taking a Pulse
Lets take a short assessment to get some baseline data.
1. What is the history of instructional improvement in your school/district?
2. What efforts/initiatives have worked well? Why?
3. What efforts/initiatives have failed? Why?
4. What lessons from past failures and successes should be carried forward as your school/district engages in continuous improvement?
Five Phases Instructional Improvement
1. Survey the information available within the school
2. Identify patterns, strengths and needs
3. Identify root causes
4. Develop goals and objectives that can drive the school improvement process forward
5. Monitor and adjust
Instructional Improvement in Action • Transparency of data
• Peeling back the layers through lot of questions
• What did
• How does
• Why did
• How can
• Pattern analysis, identifying trends, not solutions
• Identify root causes
• Goal setting and objectives
• Intervention and monitoring plan

11/5/2013
5
Two types of Data
• Hard
• Soft
Hard Data Defined
• Reported using descriptive statistics that answers questions who, what, when
• Snapshot reports
• Actionable data
• Comparative statistical analysis
Types of hard data
• Criterion and norm-referenced student assessment data
• Demographic data
• Attendance data
• Suspension rates
• Referral rates
• Detention rates
• School nurse records
• Teacher credentials
11/5/2013
6
Looking Deeper at Hard Data
Triangulation of comparative data findings
• Referral rates
• Academic Performance
• Teacher preparedness
• Across the day and/or across periods
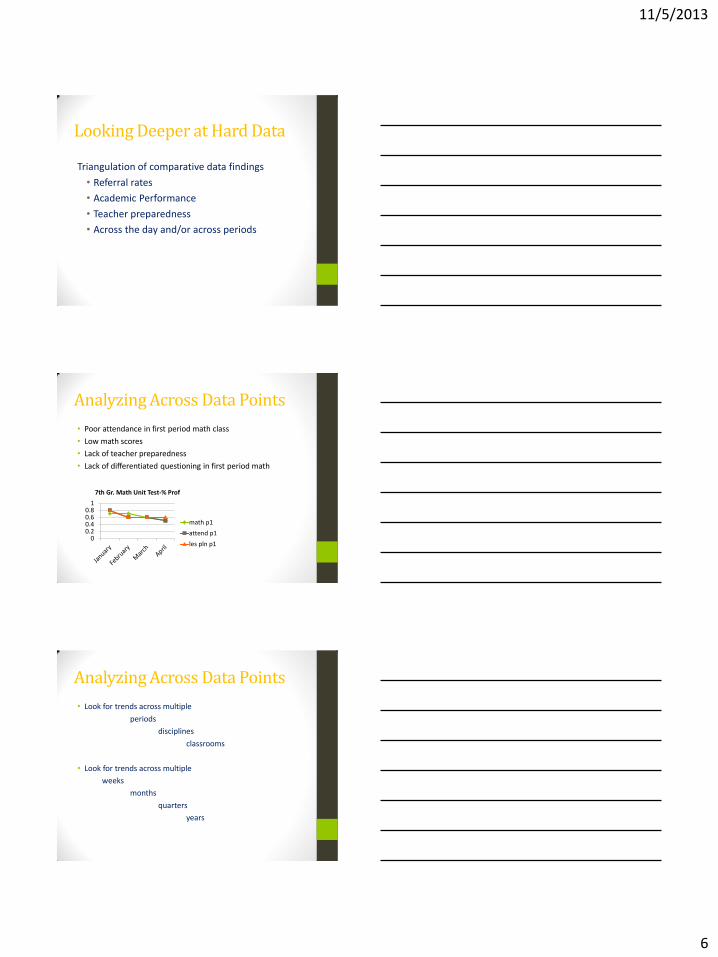
Analyzing Across Data Points
• Poor attendance in first period math class
• Low math scores
• Lack of teacher preparedness
• Lack of differentiated questioning in first period math
00.20.40.60.8
1
math p1
attend p1
les pln p1
7th Gr. Math Unit Test-% Prof
Analyzing Across Data Points
• Look for trends across multiple
periods
disciplines
classrooms
• Look for trends across multiple
weeks
months
quarters
years
11/5/2013
7
Hard Data in Review
• Useful assessment measures
• Baseline assessments
• Weekly quizzes
• Progress monitoring data
• Benchmark assessments
• End of year state assessments
• Useful Nonacademic Hard Data
• Referrals by teacher, class or period
• Attendance
• Suspensions by teacher, class, or period
Soft Data Defined
• Information about student learning and instruction acquired by observing student and adult actions and by talking to students and adults
• Uncovered in classrooms, staff lounges, the front office, playground, athletic fields, the hallways, and other corners of the school
• Described in words and pictures rather than numbers
• Qualitative
Gathering Soft Data
• Observations
• Informal Interviews
• Chit Chat
• Surveys
11/5/2013
8
Soft Data Observations
• Learning Walks
• Ghost Walks
• Capacity building learning walks
• Guided Visits
• Discussions
Soft Data and Culture and Climate The Heart of Our Work
• What we destroy
• What we refuse to see
• What we tolerate
• What we accept we need to know more about
• What we are open to
• What we celebrate and live
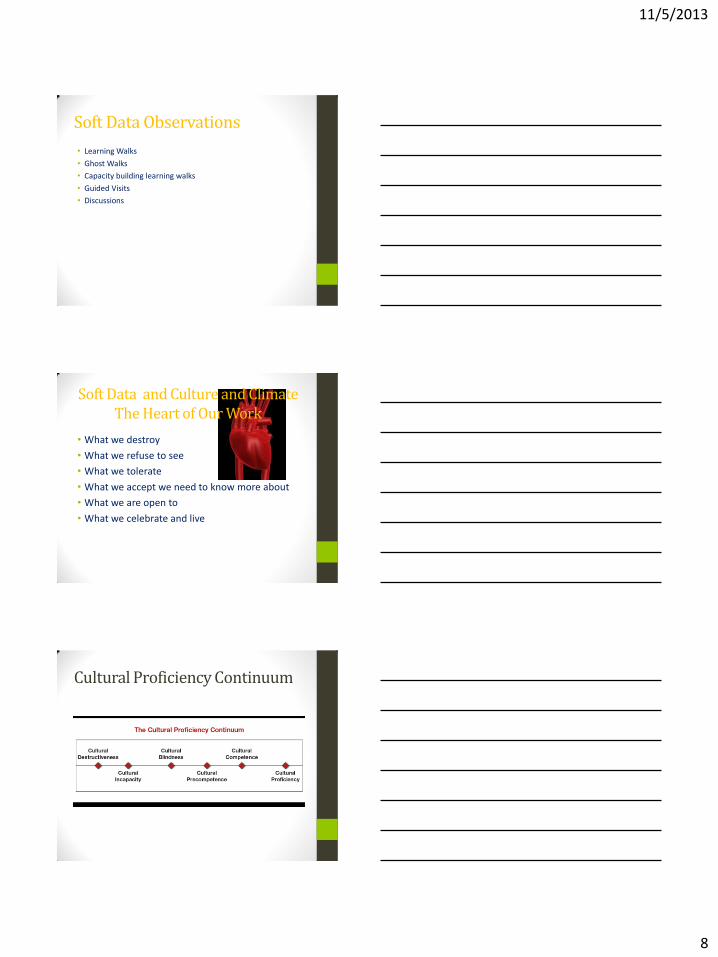
Cultural Proficiency Continuum
11/5/2013
9
Soft Data and Culture and Climate
• How we place our students in classes
• How we make courses accessible to all
• Who we place our students with
• How we find ways to create a well-rounded curriculum
• How we engage as a staff in becoming more culturally competent
• How we engage various school stakeholders
Validating Soft Data
• Through Triangulation
• Through solid use of instruments
• Through valid sample sizes
• Through nonthreatening well designed observations
• Through a focus on the goals and objectives
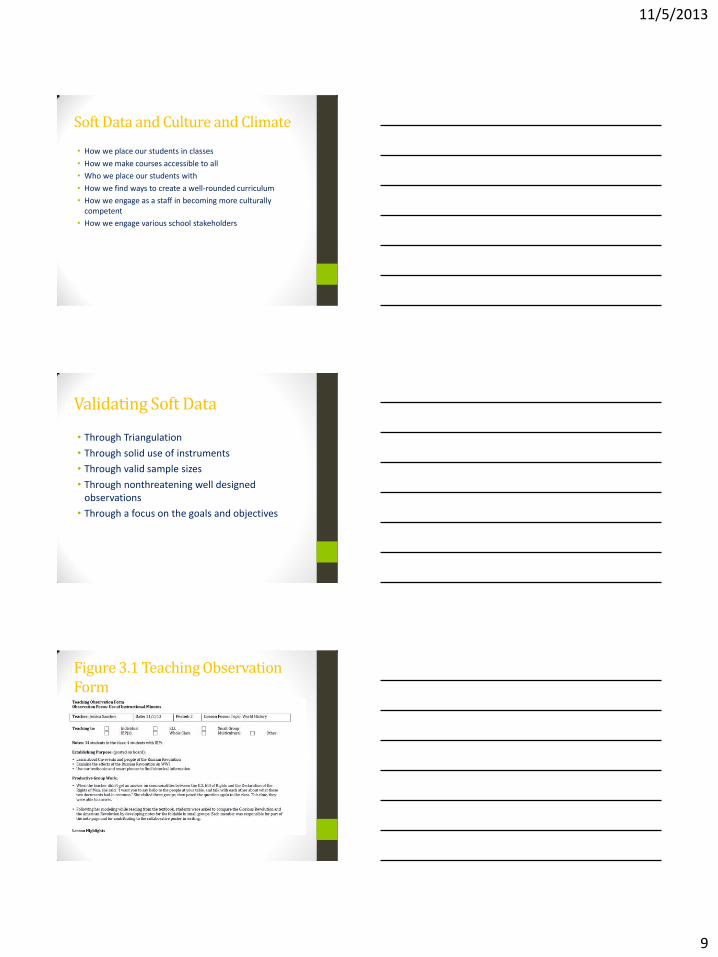
Figure 3.1 Teaching Observation Form
11/5/2013
10
Getting to the Root Cause
The daily work of school means that we administer to the academic, social, emotional, psychological, and physical health of children. Their daily success or lack thereof is compounded and magnified. Failure on one day might not mean much, but failure every day portends the educational equivalent of death; another dropout.
Root Cause – A definition
The deepest underlying cause, or causes, of positive and negative symptoms within any process that, if resolved, would result in elimination, or substantial reduction of the symptom (Preuss, 2003, p. 3)
Root Cause
A cause is likely to be a root cause when:
• You run into a dead end asking what caused the proposed root cause
• Everyone agrees on the root cause
• The cause makes sense and provides clarity to the problem
• If the cause is addressed there is realistic hope that the problem can be reduced or prevented in the future (Croteau, 2010)
11/5/2013
11
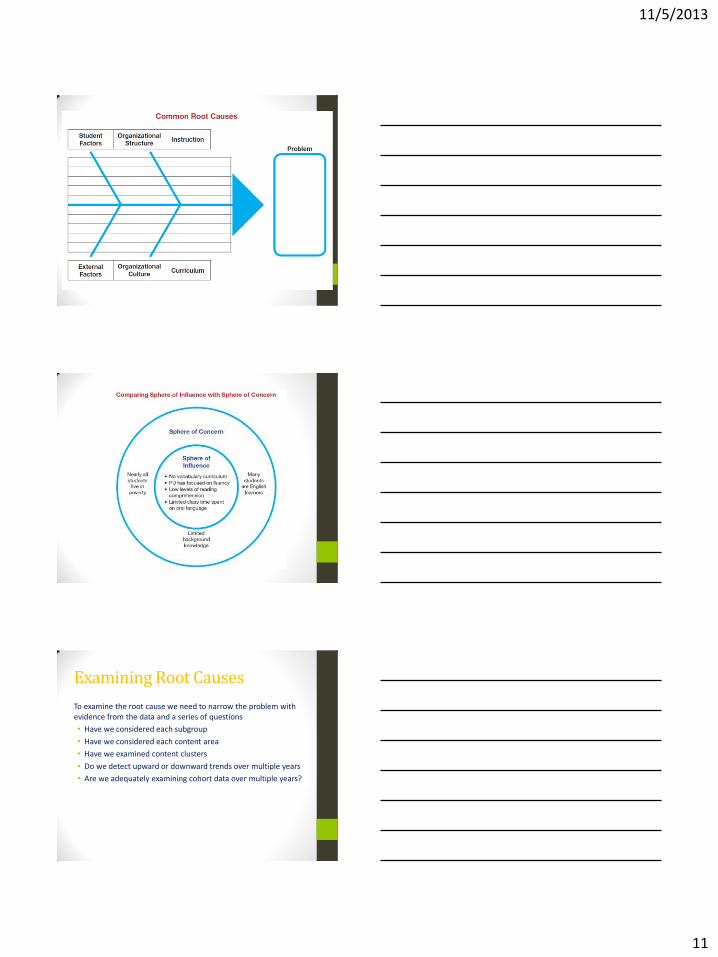
Common Root Causes Figure 4.1
Examining Root Causes
To examine the root cause we need to narrow the problem with evidence from the data and a series of questions
• Have we considered each subgroup
• Have we considered each content area
• Have we examined content clusters
• Do we detect upward or downward trends over multiple years
• Are we adequately examining cohort data over multiple years?
11/5/2013
12
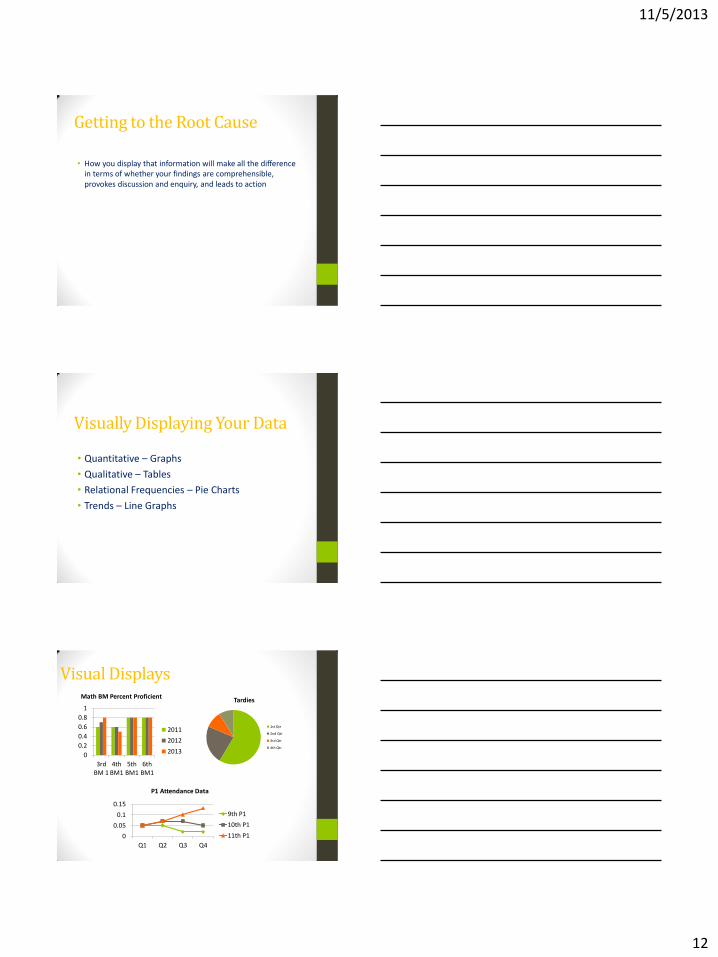
Getting to the Root Cause
• How you display that information will make all the difference in terms of whether your findings are comprehensible, provokes discussion and enquiry, and leads to action
Visually Displaying Your Data
• Quantitative – Graphs
• Qualitative – Tables
• Relational Frequencies – Pie Charts
• Trends – Line Graphs
Visual Displays
Tardies
1st Qtr
2nd Qtr
3rd Qtr
4th Qtr
0
0.2
0.4
0.6
0.8
1
3rdBM 1
4thBM1
5thBM1
6thBM1
2011
2012
2013
0
0.05
0.1
0.15
Q1 Q2 Q3 Q4
9th P1
10th P1
11th P1
P1 Attendance Data
Math BM Percent Proficient
11/5/2013
13
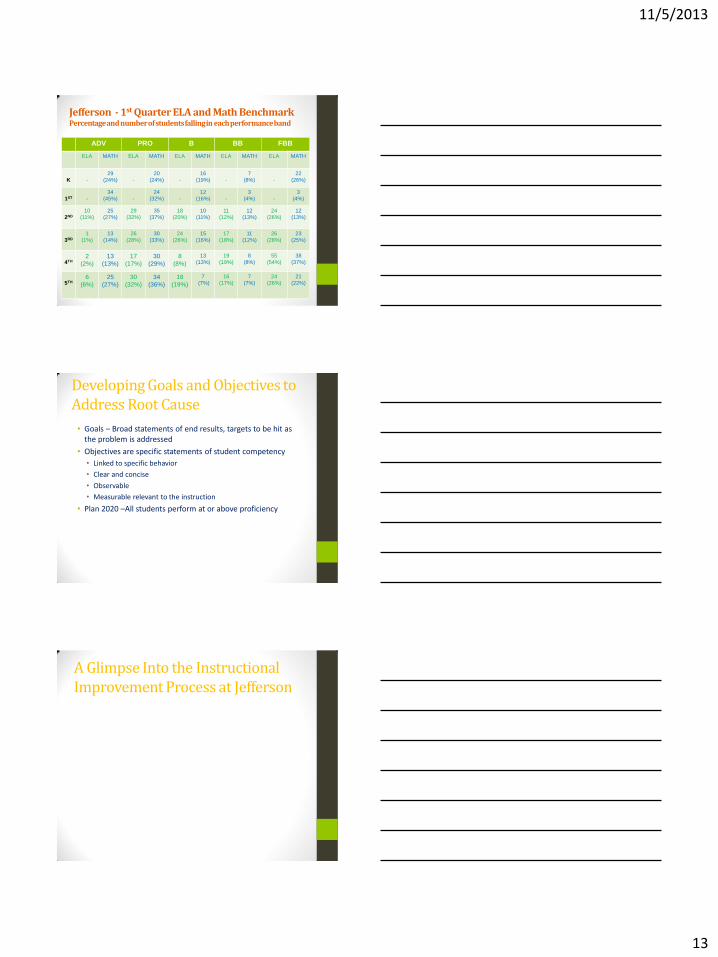
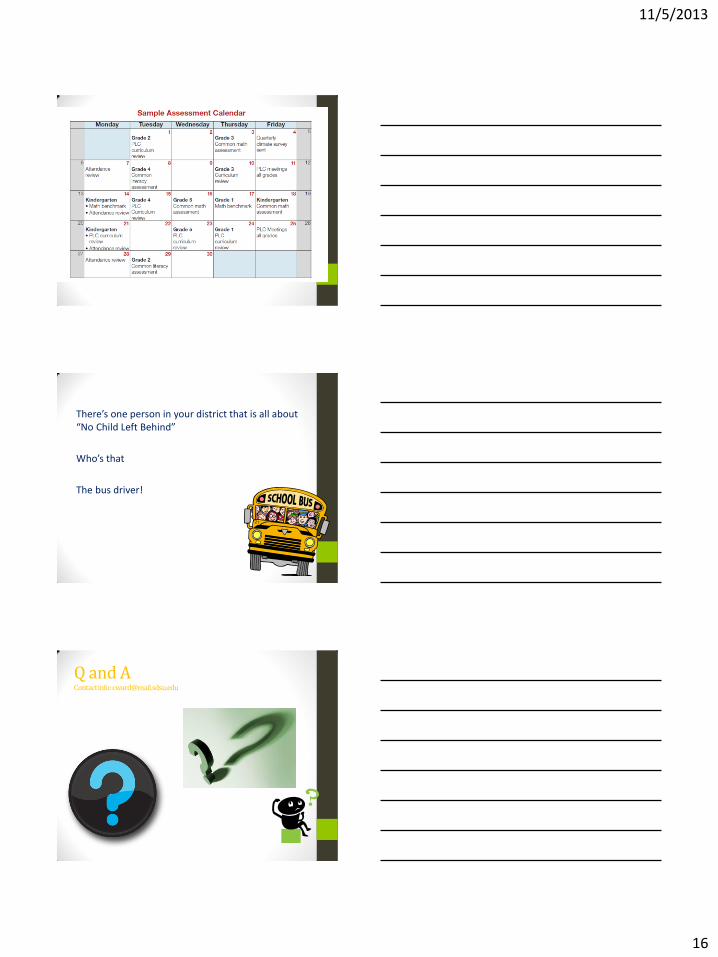
Jefferson - 1st Quarter ELA and Math Benchmark Percentage and number of students falling in each performance band
ADV PRO B BB FBB
ELA MATH ELA MATH ELA MATH ELA MATH ELA MATH
K
-
29
(24%)
-
20
(24%)
-
16
(19%)
-
7
(8%)
-
22
(26%)
1ST
-
34
(45%)
-
24
(32%)
-
12
(16%)
-
3
(4%)
-
3
(4%)
2ND
10
(11%)
25
(27%)
29
(32%)
35
(37%)
18
(20%)
10
(11%)
11
(12%)
12
(13%)
24
(26%)
12
(13%)
3RD
1
(1%)
13
(14%)
26
(28%)
30
(33%)
24
(26%)
15
(16%)
17
(18%)
11
(12%)
26
(28%)
23
(25%)
4TH 2
(2%)
13
(13%)
17
(17%)
30
(29%)
8
(8%)
13
(13%)
19
(19%)
8
(8%)
55
(54%)
38
(37%)
5TH 6
(6%)
25
(27%)
30
(32%)
34
(36%)
18
(19%)
7
(7%)
16
(17%)
7
(7%)
24
(26%)
21
(22%)
Developing Goals and Objectives to Address Root Cause
• Goals – Broad statements of end results, targets to be hit as the problem is addressed
• Objectives are specific statements of student competency
• Linked to specific behavior
• Clear and concise
• Observable
• Measurable relevant to the instruction
• Plan 2020 –All students perform at or above proficiency
A Glimpse Into the Instructional Improvement Process at Jefferson

11/5/2013
14
We have the data... And now What? ANALYSIS OF THE STANDARDS WE ASKED OURSELVES… NEXT STEPS TOWARDS MASTERY
Identify standards covered on 1st Quarter Benchmark Assessment
Determine standards that need intensive instruction both in ELA and Mathematics by grade level
Determine which are power standards
Are we providing rigorous and intensive instruction? Were the standards that were tested covered and to what degree? Does the delivery of the instruction and bi-weekly assessments align to the format of the test? If not, what needs to change? How can we guarantee that the standard is presented to students in a variety of ways so that we can meet the learning styles of ALL of our students? Are we maximizing all of the resources and programs that we have in order to master the selected standards? How can we bring up the rigor of programs? What else can we incorporate or what needs to be modified?
Teachers will meet on PLCs in order to analyze bi-weekly assessments as well as reteaching/reassessing strategies
Leadership team will meet on a bi-weekly basis in order to analyze bi-weekly data results Teachers will meet on a monthly basis in order to work on CST blueprints and curriculum mapping
Students will be grouped accordingly for reteaching in order to maximize time and results
Mobilizing Efforts to Make a Difference • Once goals and objectives are clear, then we need to identify
how best to meet them. To do so we need to identify the target for the treatment
• Students
• Teachers
• Families and Community
Sample Interventions
11/5/2013
15
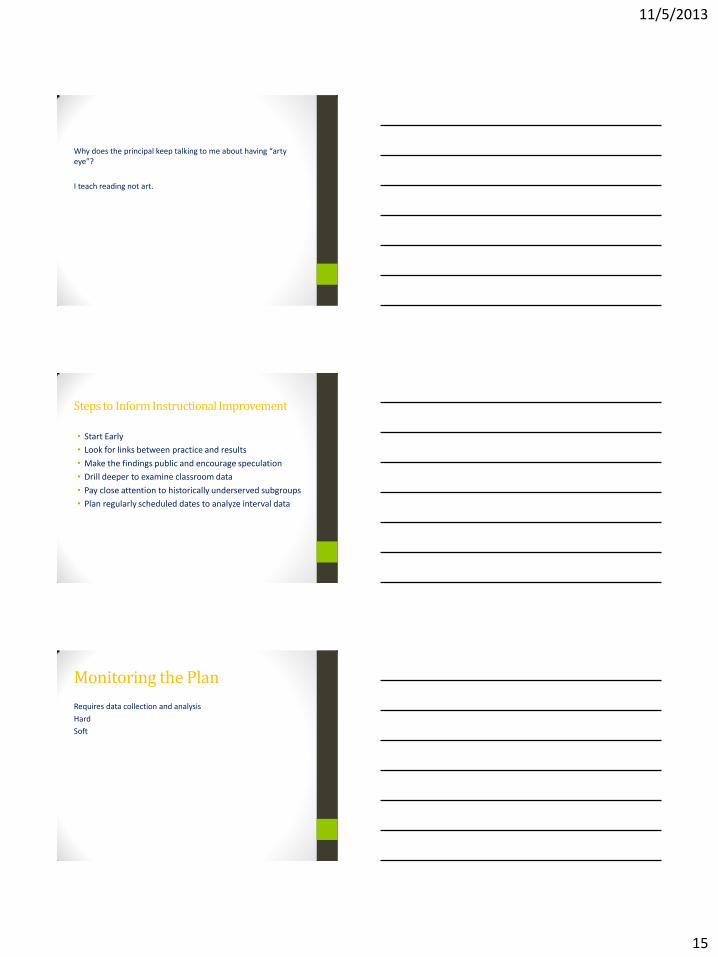
Why does the principal keep talking to me about having “arty eye”?
I teach reading not art.
Steps to Inform Instructional Improvement
• Start Early
• Look for links between practice and results
• Make the findings public and encourage speculation
• Drill deeper to examine classroom data
• Pay close attention to historically underserved subgroups
• Plan regularly scheduled dates to analyze interval data
Monitoring the Plan
Requires data collection and analysis
Hard
Soft
11/5/2013
16
There’s one person in your district that is all about “No Child Left Behind”
Who’s that
The bus driver!
Q and A Contact info: [email protected]