using dashboards to transform application data visualization
TRANSCRIPT
Using Dashboards to Transform Application Data Visualization
Kathy Brown, PSC GroupShean McManus, PSC Group
•Kathy Brown•Senior Consultant, PSC Group•IBM Champion•Nerd Girl•@IamKathyBrown•www.runningnotes.net
•Shean McManus•Senior Consultant, PSC Group•IBM Champion•@sheanpmcmanus•www.spmcmanus.net
Who Are We?
•Edward Tufte example•Tips•A picture is worth a thousand words•Charts can be useful or useless
•Work with the business process and stakeholders•Statistics can be bent to our own purpose•Know your audience
Data Visualization
Workflow Dashboards
• Traditional Methods of Accessing Data
– Scrolling through views or grids (Notes or otherwise)
– Categorized views
– Full-text Search / Find
– Custom views
– Email Links
Workflow Dashboard

• How to Make an Effective Dashboard
– Avoid Clutter
– Reduce clicks
– Implement customization
– Know what your users want need to see
Effective dashboards can transform a business process
Workflow Dashboard
• Designed for efficiency
– Access to actionable items at a glance
– Can pull from multiple sources
– Can reduce reliance on email as action triggers
– Can enhance with metrics, statistics and other information
Workflow Dashboard
• Features of My Demo
– Multiple mini-views (portlets) on one screen
– Row expansion
– Icon indicators
– Inline action buttons
– Metrics / Statistic boxes
– Customization (by role or user)
Workflow Dashboard

Demo
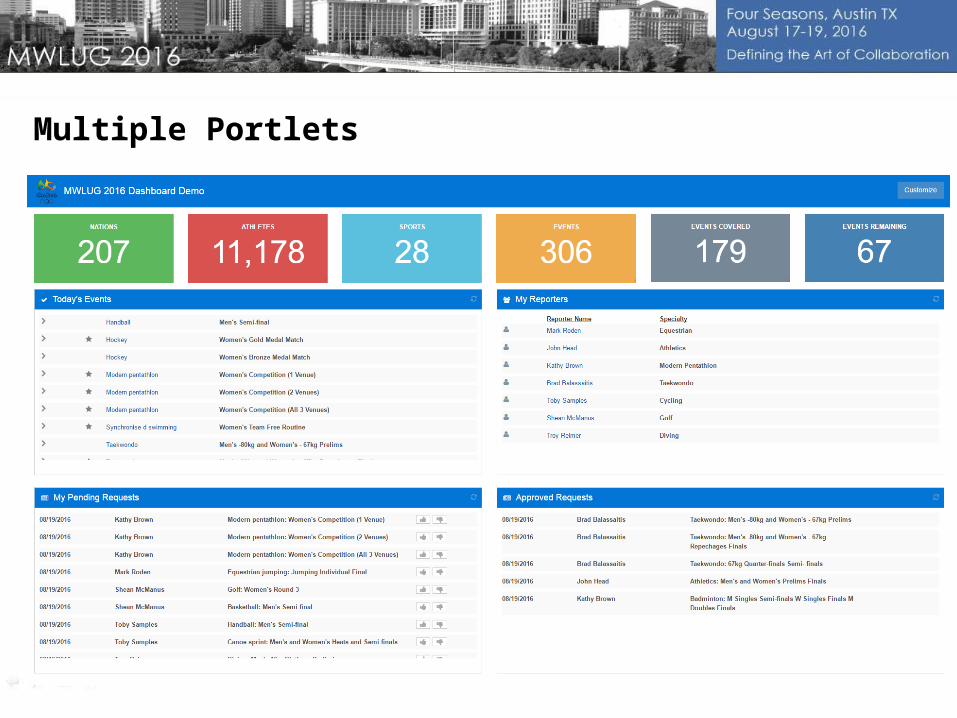
Multiple Portlets
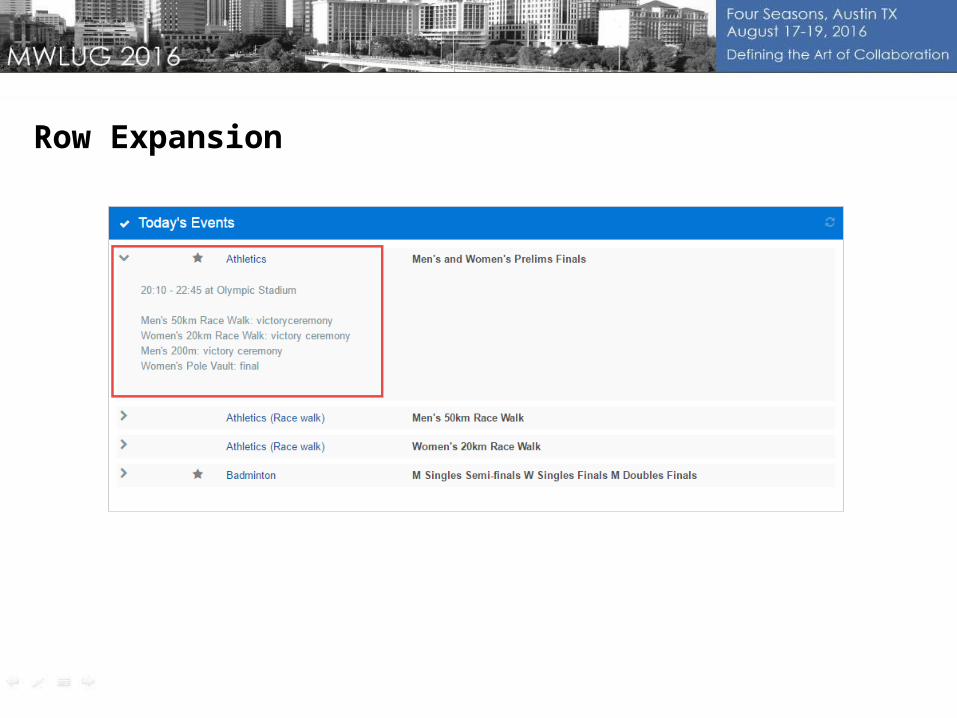
Row Expansion
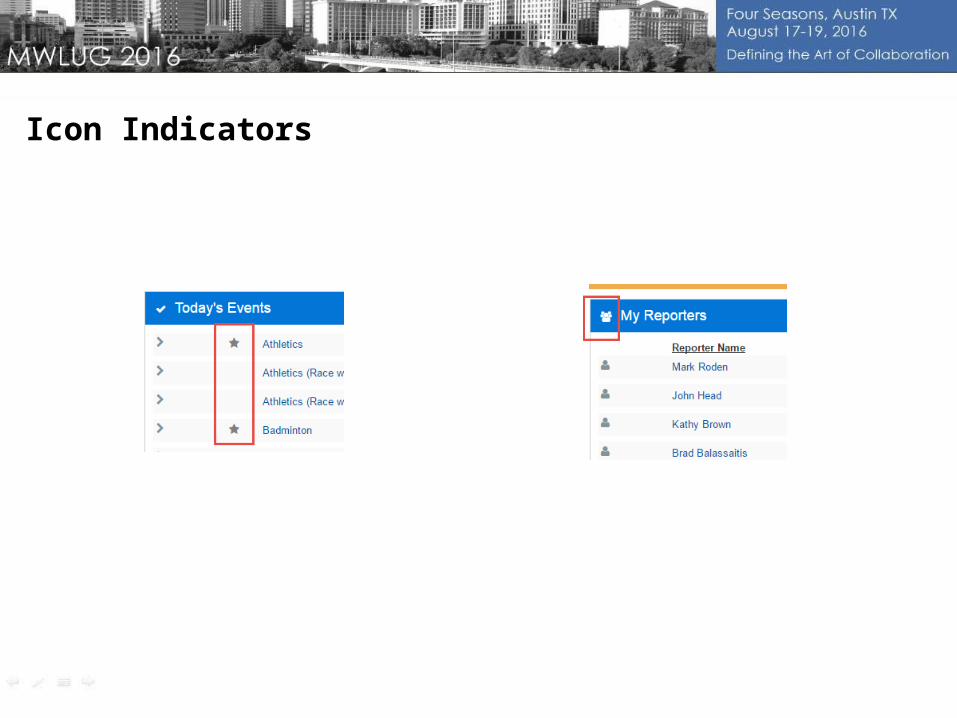
Icon Indicators
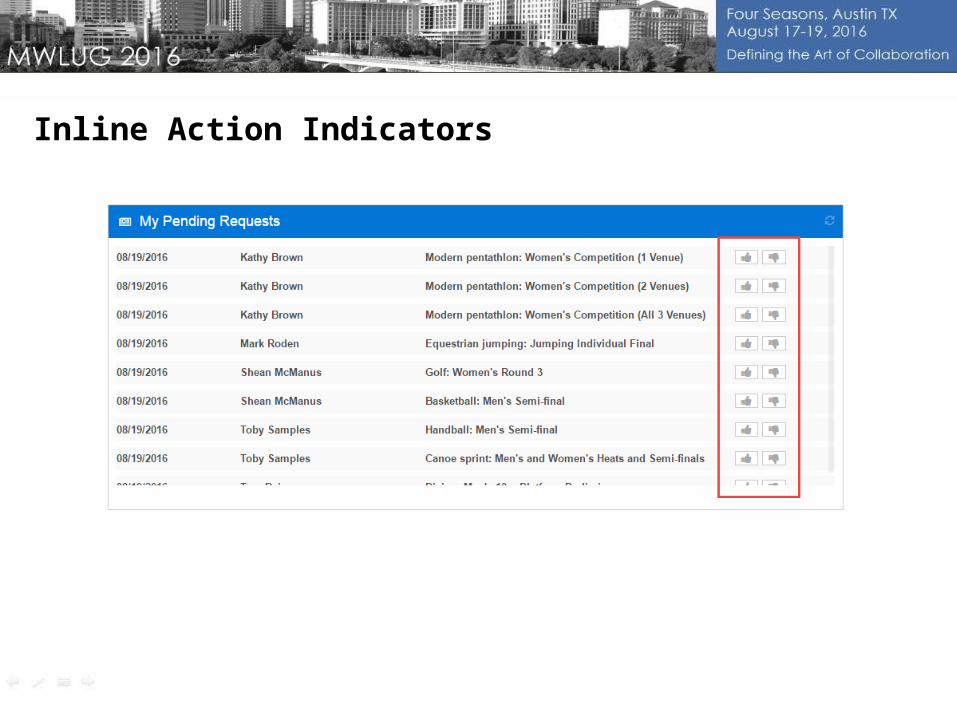
Inline Action Indicators
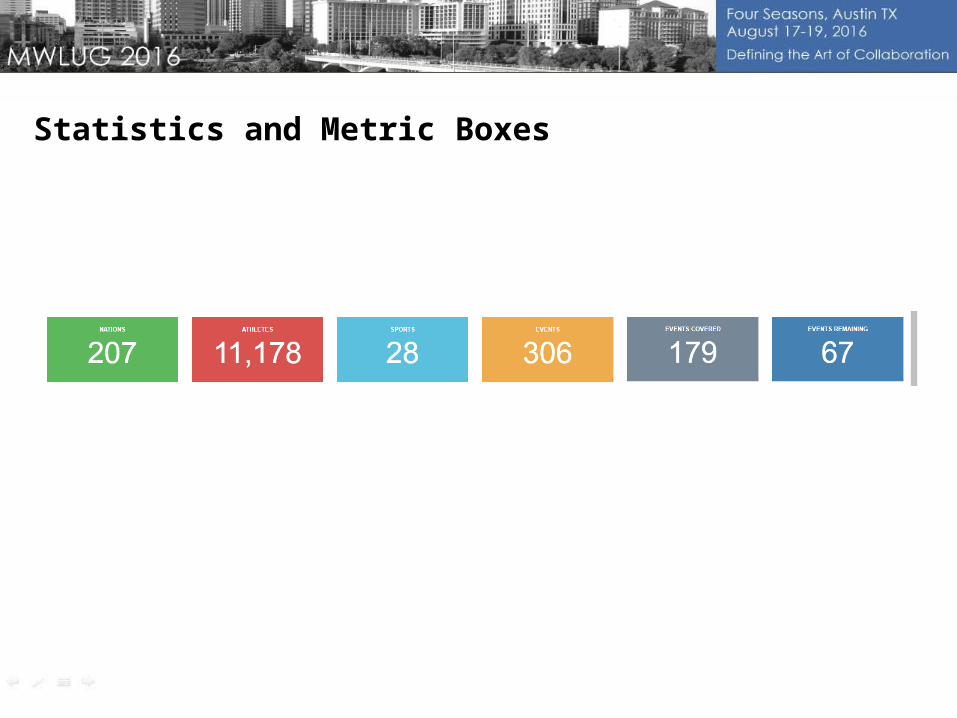
Statistics and Metric Boxes
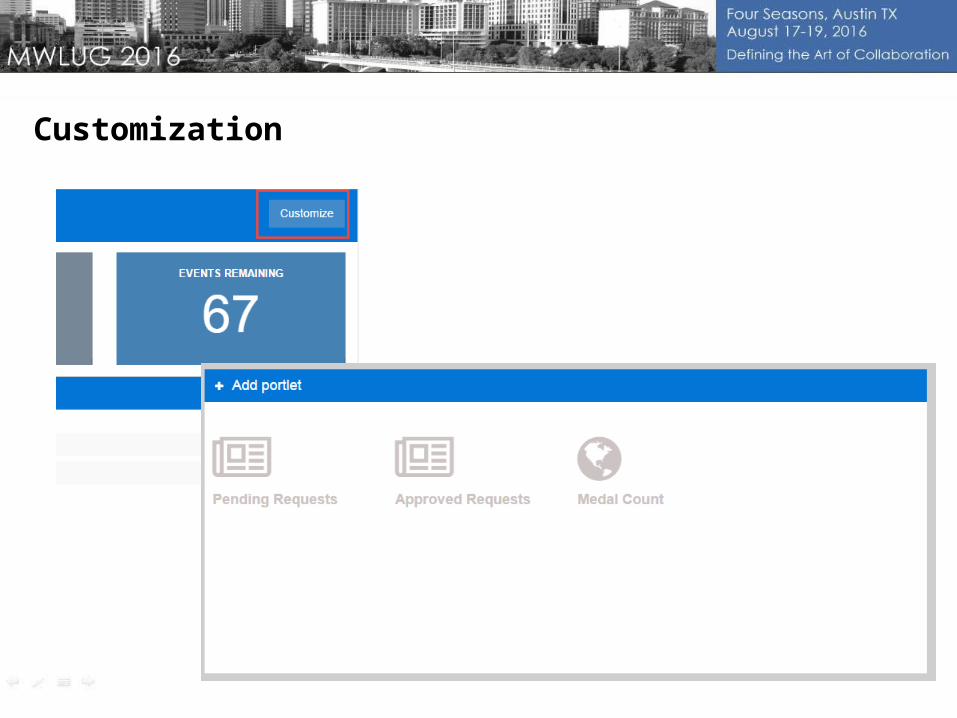
Customization
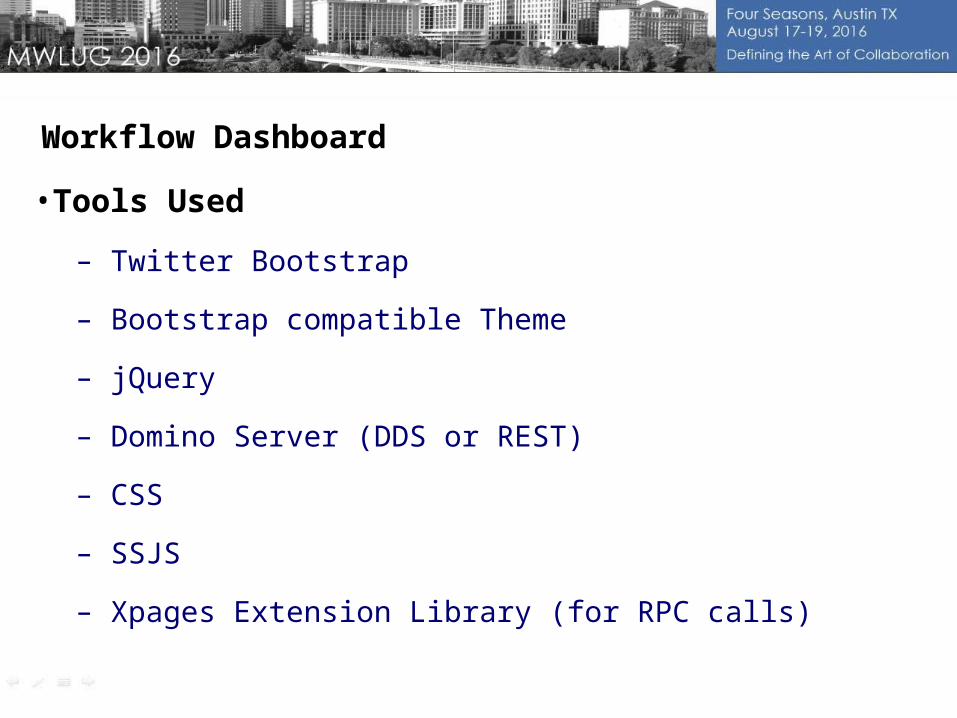
•Tools Used
– Twitter Bootstrap
– Bootstrap compatible Theme
– jQuery
– Domino Server (DDS or REST)
– CSS
– SSJS
– Xpages Extension Library (for RPC calls)
Workflow Dashboard
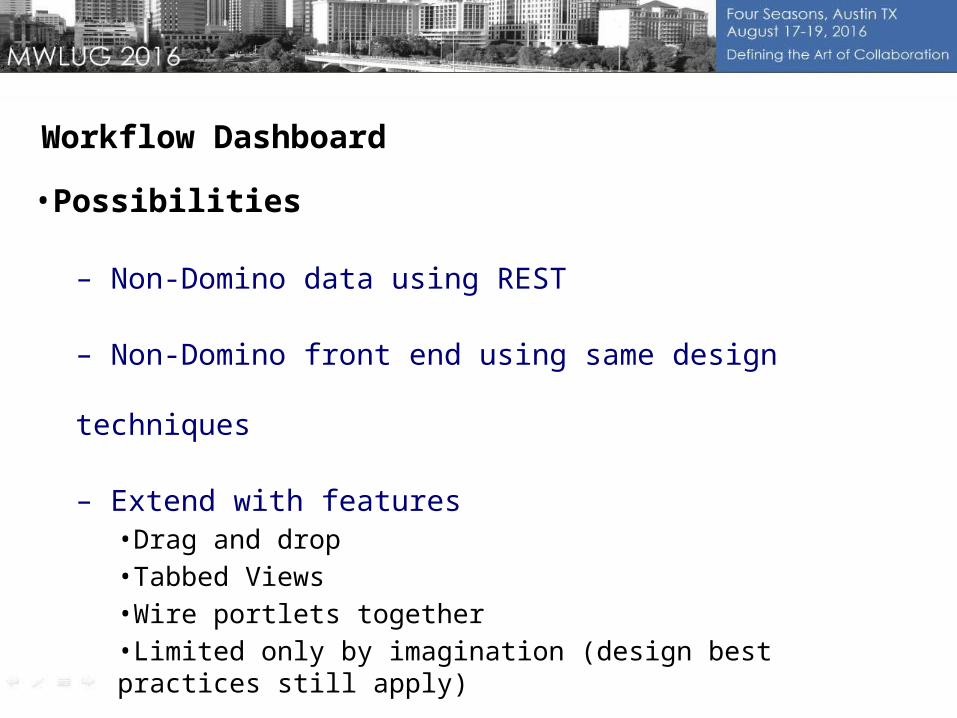
•Possibilities
– Non-Domino data using REST
– Non-Domino front end using same design techniques
– Extend with features•Drag and drop•Tabbed Views•Wire portlets together•Limited only by imagination (design best practices still apply)
Workflow Dashboard
Manager Dashboards
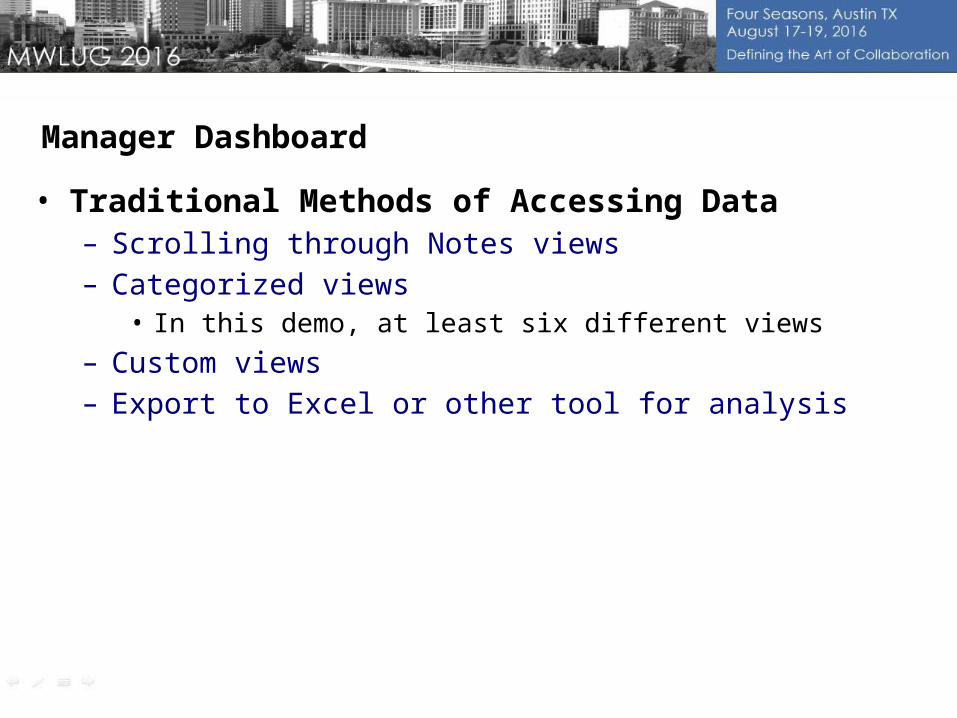
• Traditional Methods of Accessing Data– Scrolling through Notes views– Categorized views
• In this demo, at least six different views – Custom views– Export to Excel or other tool for analysis
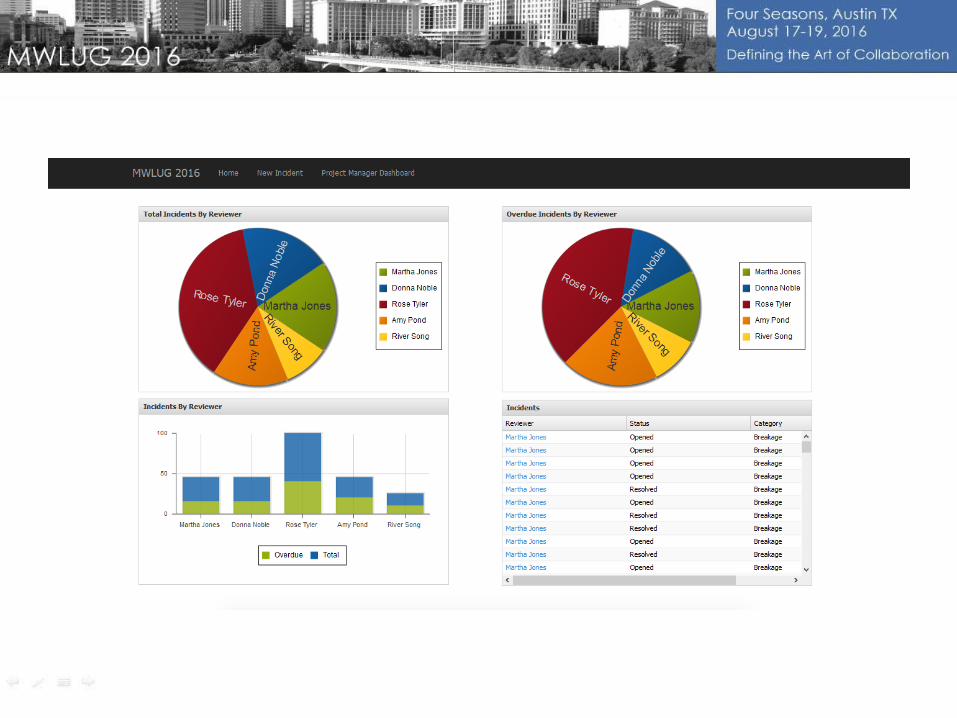
Manager Dashboard
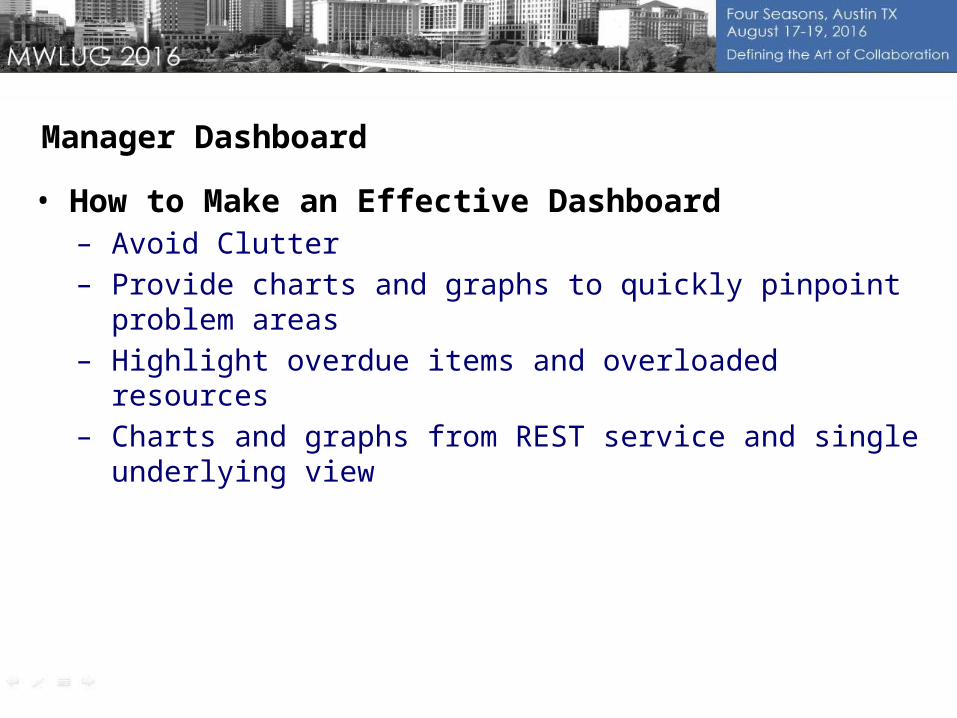
• How to Make an Effective Dashboard– Avoid Clutter– Provide charts and graphs to quickly pinpoint problem areas– Highlight overdue items and overloaded resources– Charts and graphs from REST service and single underlying view
Manager Dashboard
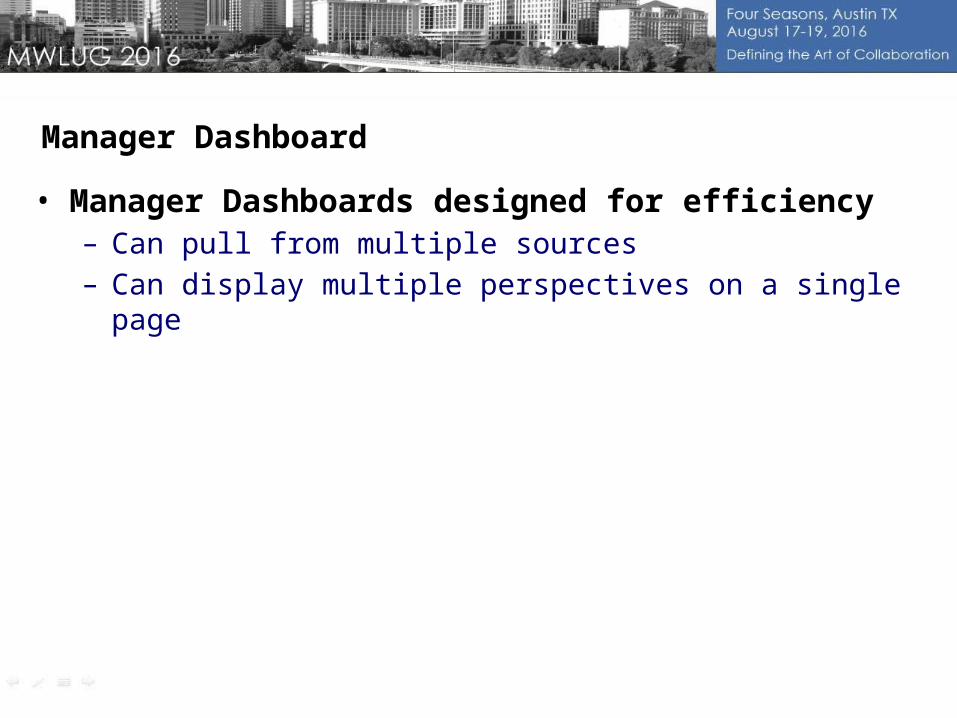
• Manager Dashboards designed for efficiency– Can pull from multiple sources– Can display multiple perspectives on a single page
Manager Dashboard

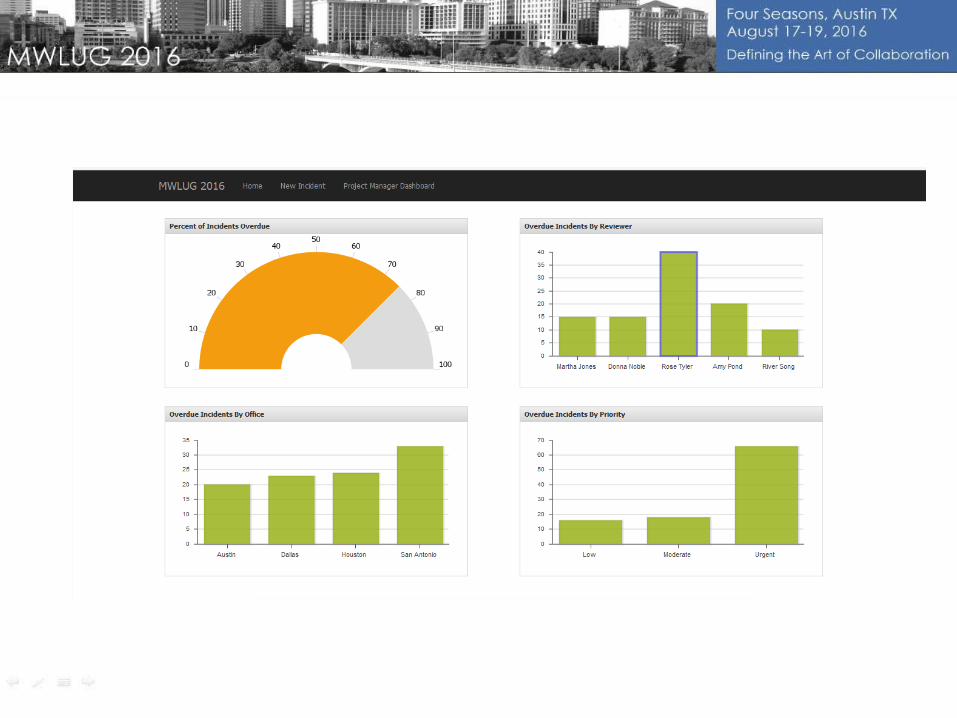
Demo
•Tools Used– Twitter Bootstrap– Bootstrap compatible Theme– jQuery–Sencha Grids and Charts– Domino Server (DDS or REST)– CSS– SSJS
Manager Dashboard
•Possibilities– Non-Domino data using REST– Non-Domino front end using same design techniques– Extend with features
•Drill down or filter within charts•Export charts
Manager Dashboard
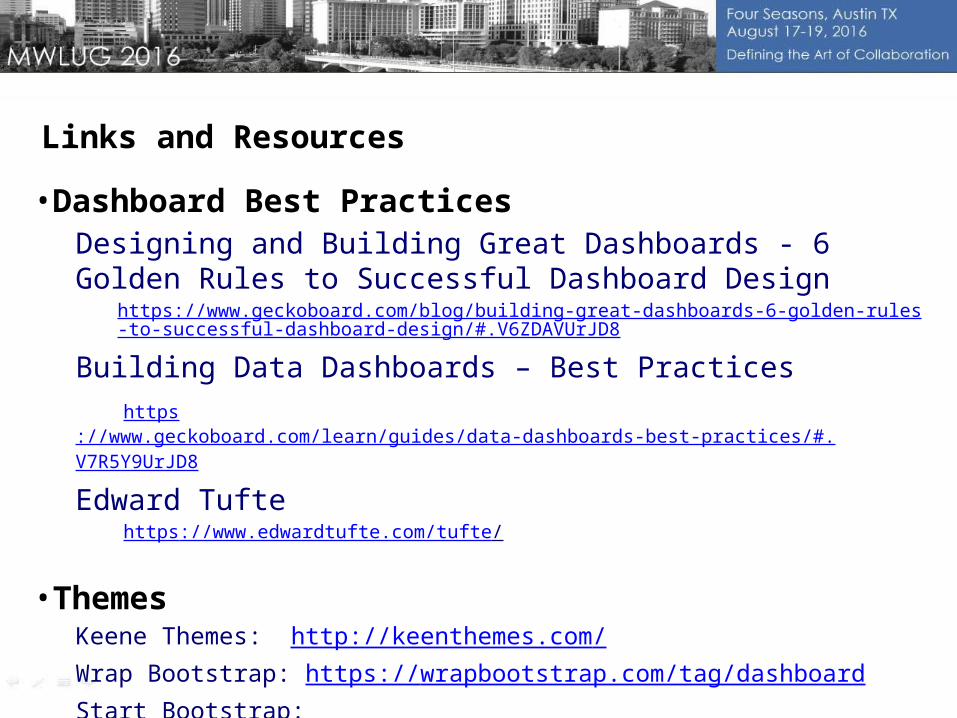
•Dashboard Best PracticesDesigning and Building Great Dashboards - 6 Golden Rules to Successful Dashboard Design
https://www.geckoboard.com/blog/building-great-dashboards-6-golden-rules-to-successful-dashboard-design/#.V6ZDAVUrJD8
Building Data Dashboards – Best Practiceshttps://www.geckoboard.com/learn/guides/data-dashboards-best-practices/#.V7R5Y9UrJD8
Edward Tuftehttps://www.edwardtufte.com/tufte/
•ThemesKeene Themes: http://keenthemes.com/Wrap Bootstrap: https://wrapbootstrap.com/tag/dashboardStart Bootstrap: https://startbootstrap.com/template-categories/admin-dashboard/Bootstrap: http://themes.getbootstrap.com/products/dashboard
Links and Resources


29