using clustering as a tool: mixed methods in qualitative data analysis
TRANSCRIPT

Using Clustering as a Tool: Mixed Methods in Qualitative Data Analysis
Laura Macia, PhDBehavioral and Community Health
SciencesGraduate School of Public Health
University of Pittsburgh

Types of data

Mixed Methods• Type of Data / Data Collection
• Data Analysis

Mixed Methods in Data Analysis

Cluster Analysis• Method for grouping data by their similarity– Appropriate data– Defining similarity– Clustering

Data Preparation• Types of data:– Nominal– Ordinal– Interval / Ratio
Qualitative Data
(an example)Latino Grievances Project

Summary Table: Nodes and Attributes (after thematic analysis using Nvivo)Select Variables Values [description]
Part 1: GenderStrata
Legal status
Income
Education
(0) Male; (1) Female(0) Blue-collar; (1) Spouse of American citizen; (2) White-collar(0) US citizen; (1) Legal permanent resident; (2) Immigrant visa; (3) Non-immigrant visa; (4) Visa overstay; (5) Undocumented(0) Under $20k; (1) $20k to $40k; (2) $40k to $60k; (1) $60k to $80k; (1) $80k to $100k; (5) Over $100k(0) Primary; (1) Some secondary; (2) High-school diploma; (3) College degree; (4) Graduate degree; (5) Other degree
Part 2: Type
Nationality
(0) Male; (1) Female; (2) Individual [when gender unknown]; (3) Institution; (4) Government; (5) Other(0) American; (1) Latino; (2) Other; (3) Unknown
Grievance (0) Debt; (1) Discrimination; (2) Domestic; (3) With the lawProcedural mode
(1) None(2) Adjudication [third party with authority to intervene, i.e. courts](3) Arbitration [third party agreed to by principals](4) Mediation [third party aiding principals reach an agreement](5) Negotiation [two principals decide on settlement](6) Coercion [imposition of outcome by unilateral threat or use of force](7) Avoidance [terminate relationship / withdraw from situation](8) Lumping it [“letting go” as of grievance](9) Assumed fault* [structure grievance as occurring due to own situation/fault](10)Talk back* [letting know of grievance without expecting further action](11)Other
* Data-driven codes, not included in predefined coding scheme

Data Preparation• Types of data:– Nominal– Ordinal– Interval / Ratio
Qualitative Data
Gender: (0) Male, (1) Female, …Type of Grievance: (0) Debt, (1) Discrimination, …Chosen Procedure: (2) Adjudication, …(6) Coercion, …
Income: (0) <$20k, (1) $20k-$40k, …Education: (0) primary , … (2) high school diploma, …

Units of analysis: CasesID Strata Part2 Part2Natlity Type ProcMode1ProcMode2ProcMode3Support1 Support2
1 WC Individual Unknown Debt Other None None None None2 WC Institution American Debt NegotiationAvoidanceNone None None3 WC Female American DiscriminationAssumed faultLumping itTalk back None None4 WC Individual American DiscriminationOther None None None None5 WC Male Latino Domestic Other NegotiationNone Other None6 WC Female Latino Domestic NegotiationOther None Family None7 WC Male Latino Domestic NegotiationNone None Family None8 WC Government American Law NegotiationAssumed faultOther Family None9 WC Male Latino Debt NegotiationLumping itOther Family Friend
10 WC Female Other Debt Talk back AvoidanceOther Family None11 WC Institution American Debt AvoidanceOther None Friend None12 WC Institution American Debt Other None None None None13 WC Male Unknown Debt Assumed faultNegotiationNone Friend None14 WC Male American DiscriminationLumping itNone None None None15 WC Institution American DiscriminationOther None None Church None16 WC Male Other DiscriminationLumping itOther None Family None17 WC Other Latino Domestic NegotiationNone None None None18 WC Female Other Domestic NegotiationNone None Other None19 WC Female Other Domestic NegotiationOther None None None20 WC Government American Law Assumed faultNone None None None
12 variables
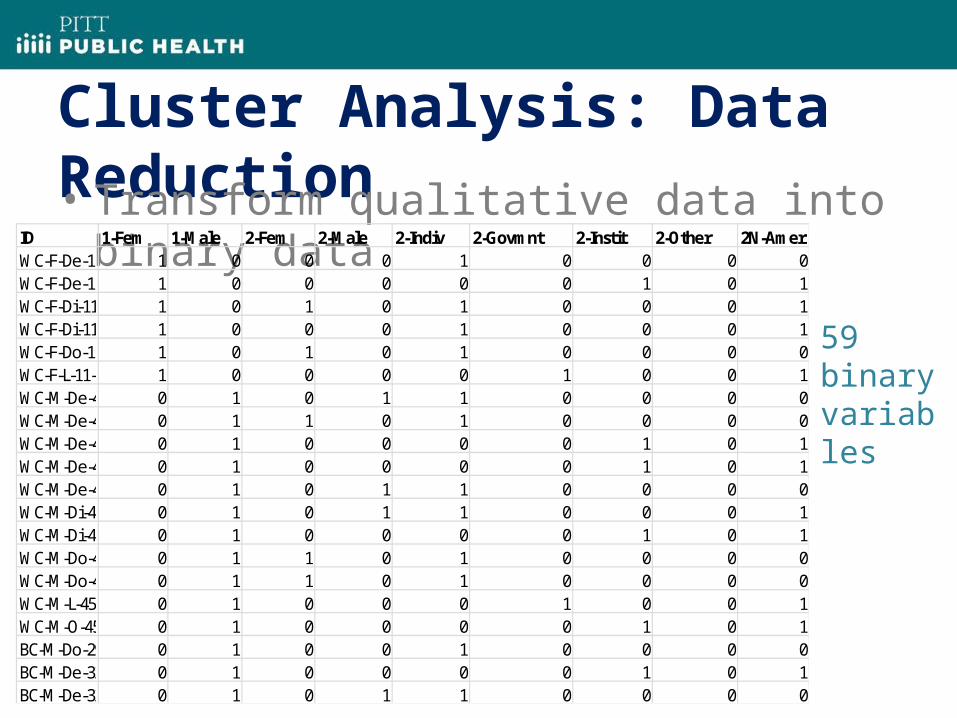
Cluster Analysis: Data Reduction• Transform qualitative data into binary data
ID 1-Fem 1-Male 2-Fem 2-Male 2-Indiv 2-Govmnt 2-Instit 2-Other 2N-AmericanWC-F-De-11-1 1 0 0 0 1 0 0 0 0WC-F-De-11-2 1 0 0 0 0 0 1 0 1WC-F-Di-11-3 1 0 1 0 1 0 0 0 1WC-F-Di-11-4 1 0 0 0 1 0 0 0 1WC-F-Do-11-6 1 0 1 0 1 0 0 0 0WC-F-L-11-8 1 0 0 0 0 1 0 0 1WC-M-De-45-9 0 1 0 1 1 0 0 0 0WC-M-De-45-10 0 1 1 0 1 0 0 0 0WC-M-De-45-11 0 1 0 0 0 0 1 0 1WC-M-De-45-12 0 1 0 0 0 0 1 0 1WC-M-De-45-13 0 1 0 1 1 0 0 0 0WC-M-Di-45-14 0 1 0 1 1 0 0 0 1WC-M-Di-45-15 0 1 0 0 0 0 1 0 1WC-M-Do-45-18 0 1 1 0 1 0 0 0 0WC-M-Do-45-19 0 1 1 0 1 0 0 0 0WC-M-L-45-20 0 1 0 0 0 1 0 0 1WC-M-O-45-21 0 1 0 0 0 0 1 0 1BC-M-Do-29-22 0 1 0 0 1 0 0 0 0BC-M-De-32-23 0 1 0 0 0 0 1 0 1BC-M-De-32-24 0 1 0 1 1 0 0 0 0
59 binary variables

Clustering decisions: variables• Variables to include– All relevant variables
what is your question?
• Variables to exclude – irrelevant variables that bias towards certain
cluster solutions

Clustering decisions: similarity• For binary data: Contingency Tables
• Pay attention to the a, b, c and ds in your data:– Which are more common?– More meaningful?

Example similarity measures
We can calculate from these values similarity coefficients between any pair of objects, specifically the Jaccard coefficientaa+b+cand the Russell and Rao coefficientaa+b+c+d=ap.
[Russel and Rao]
[Simple Matching]
[Jaccard]
[Dice]
[Sokal and Sneath 1]

Clustering decisions: linkage• Classification strategy– Hierarchical clustering • Good for “smaller” sizes (in the hundreds)• Allows choosing from many similarity measures• Randomize order, repeat, compare
agglomerative di
visiv
e

Clustering decisions: method• Linkage method:
• NOT: centroid, median, or Ward• Between-groups linkage:
d = smallest resulting avg cross-linkage distance• Within-groups:
d = smallest resulting avg within linkage distance• Nearest neighbor(single linkage):
d = smallest between two points• Furthest neighbor (complete linkage):
d = largest between two points

How This Looks in SPSS
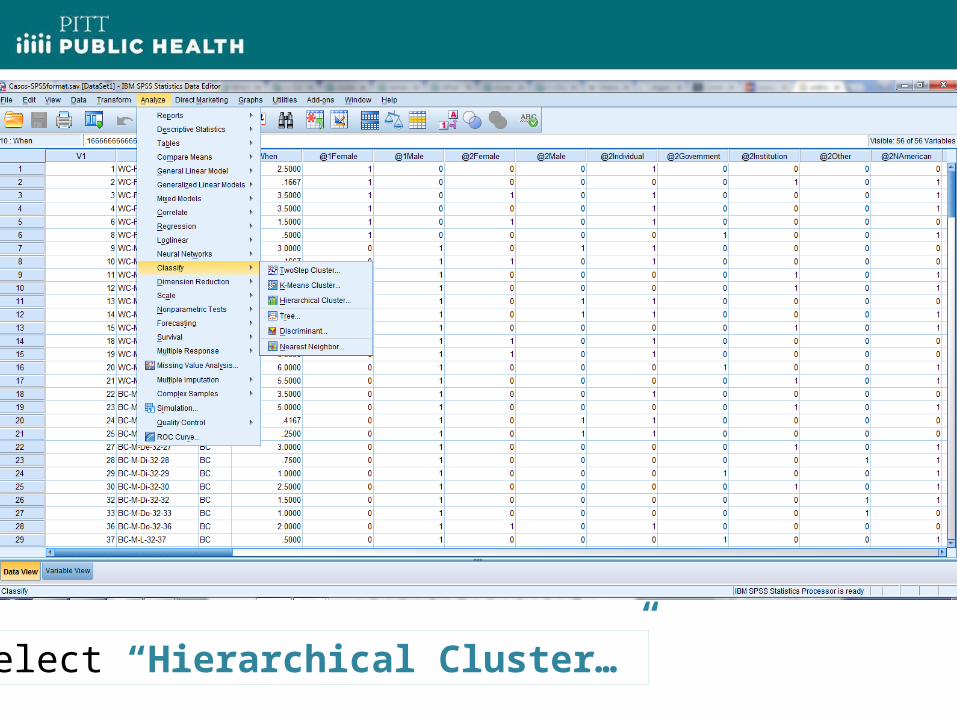
Select “Hierarchical Cluster…”
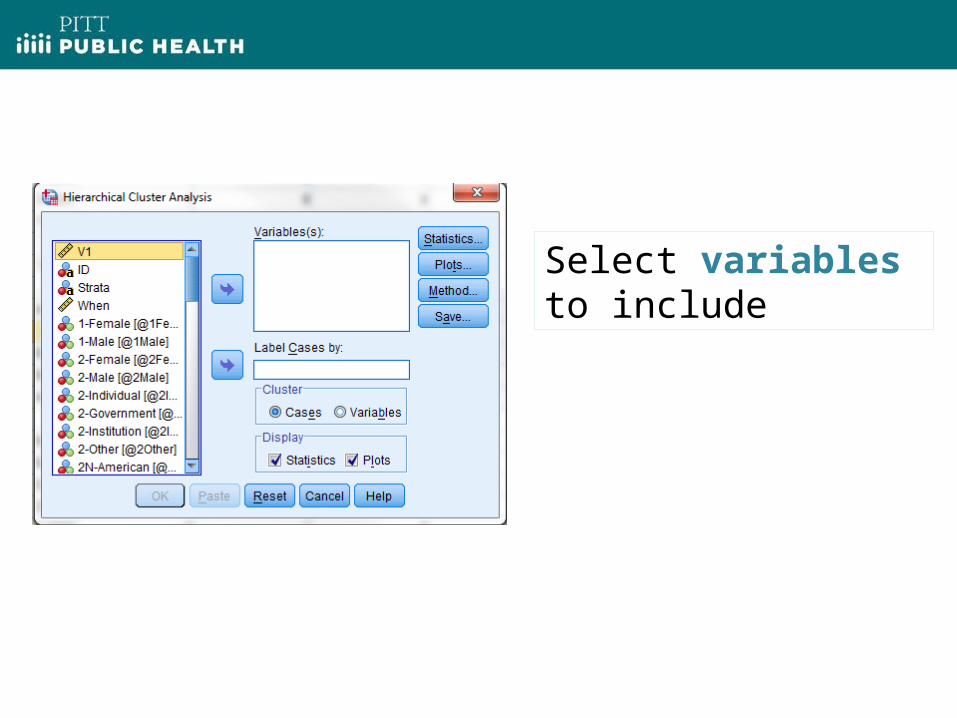
Select variables to include

Methods Menu: Measure (BINARY), Cluster Method

Statistics Menu: Cluster Membership (CHOOSE)

Plots Menu: Select Dendogram / Icicle Plots [Optional]

Results - Output: Agglomeration Schedule

Results - Output: Dendogram

Results: Cluster Membership (as new variables)
