using census bureau data and · pdf fileusing census bureau data and enigma’s smoke...
TRANSCRIPT
Using Census Bureau Data and
Enigma’s Smoke Signals to Save Lives
October 13, 2016
Join by Phone: 1-800-779-3216
Passcode: 4156946
1
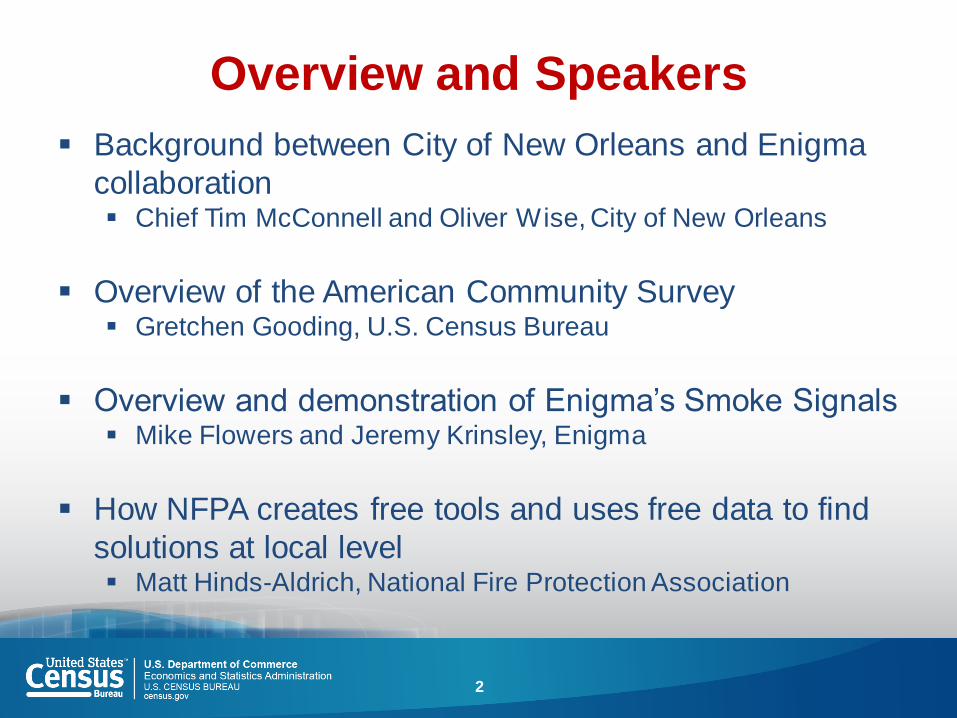
Overview and Speakers
Background between City of New Orleans and Enigma
collaboration Chief Tim McConnell and Oliver Wise, City of New Orleans
Overview of the American Community Survey Gretchen Gooding, U.S. Census Bureau
Overview and demonstration of Enigma’s Smoke Signals Mike Flowers and Jeremy Krinsley, Enigma
How NFPA creates free tools and uses free data to find
solutions at local level Matt Hinds-Aldrich, National Fire Protection Association
2

City of New Orleans
Smoke Alarm Program
Chief Tim McConnell
Superintendent, New Orleans Fire Department
Oliver Wise
Office of Performance and Accountability, City of New Orleans
3

Smoke Alarms Matter
4
Photo credit: Fox 8 New Orleans

Neighborhoods Most in Need
5
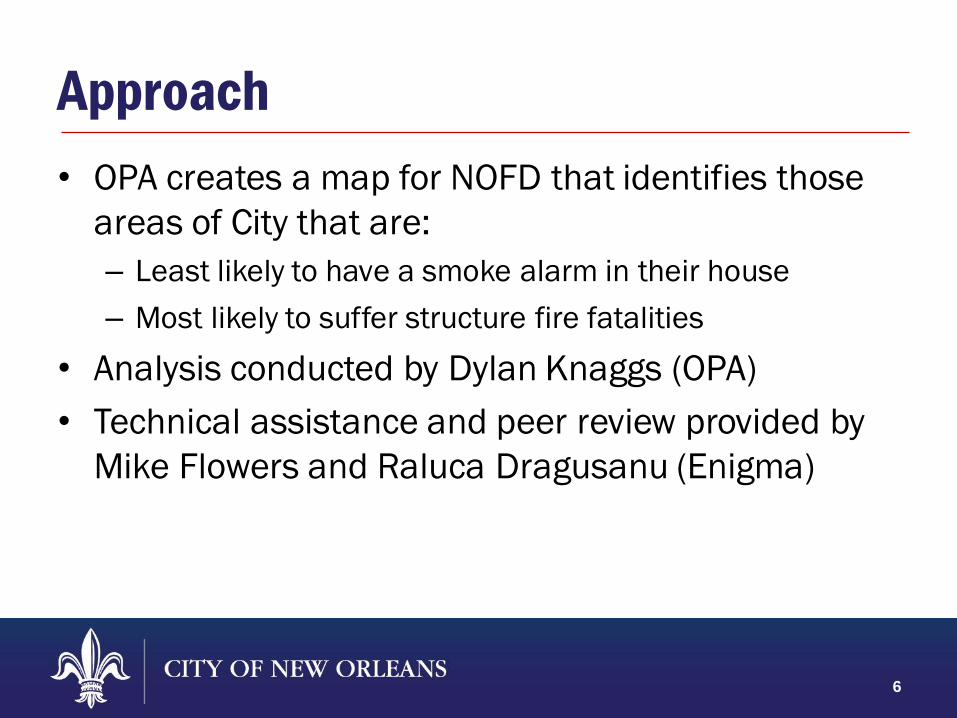
Approach
• OPA creates a map for NOFD that identifies those
areas of City that are:
– Least likely to have a smoke alarm in their house
– Most likely to suffer structure fire fatalities
• Analysis conducted by Dylan Knaggs (OPA)
• Technical assistance and peer review provided by
Mike Flowers and Raluca Dragusanu (Enigma)
6

Data Sources
• American Housing Survey, 2011 (AHS)
– Detailed survey regarding housing conditions
– Data available at county/parish level
• American Community Survey, 2013 5-year estimate
(ACS)
– Data available at census block group level
• Census, 2010
• NOFD Administrative Data
7

What homes are least likely to have
smoke alarms?
• American Housing Survey asks respondents whether or not
they have a smoke alarm installed in their home
• Other variables asked in the survey correspond to questions
in the ACS, which is available at more granular (census
block group) level
• Approach: Use logistic regression where the presence of
smoke alarm is the dependent variable and questions that
are shared in the AHS and ACS are candidate independent
variables
8

Results of Regression Analysis Variable Significance level as sole
variable in regression
Year structure was built ***
Year resident moved into house **
Household income compared to
poverty level
*
House has replacements/additions *
Age of householder *
Cost of replacements/additions ns
Occupant rents house ns
Structure Built
Before 1950
Household Income
<2x Poverty Level
Resident Moved
Before 2000
1.00 .626 .546
Weights of Variables Chosen for Final Model Weights chosen to correspond with regression coefficients
Significance codes: *** – 99% | ** – 95% | * – 90% | ns – not significant at 90%
Notes: replacements/additions excluded due to data availability and directionality concerns. Age of householder excluded due to the variable already
being accounted for by fatality risk.
9
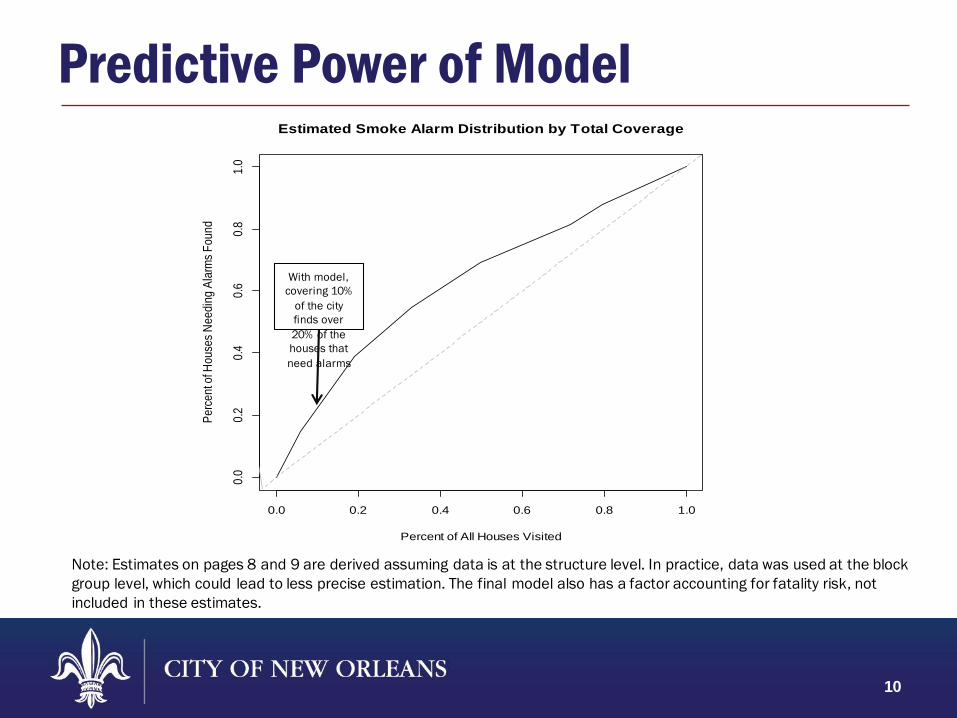
Predictive Power of Model Estimated Smoke Alarm Distribution by Total Coverage
Percent of All Houses Visited
Pe
rce
nt o
f Ho
use
s N
ee
din
g A
larm
s F
ou
nd
0.0 0.2 0.4 0.6 0.8 1.0
0.0
0.2
0.4
0.6
0.8
1.0
With model,
covering 10%
of the city
finds over
20% of the
houses that
need alarms
Note: Estimates on pages 8 and 9 are derived assuming data is at the structure level. In practice, data was used at the block
group level, which could lead to less precise estimation. The final model also has a factor accounting for fatality risk, not
included in these estimates.
10
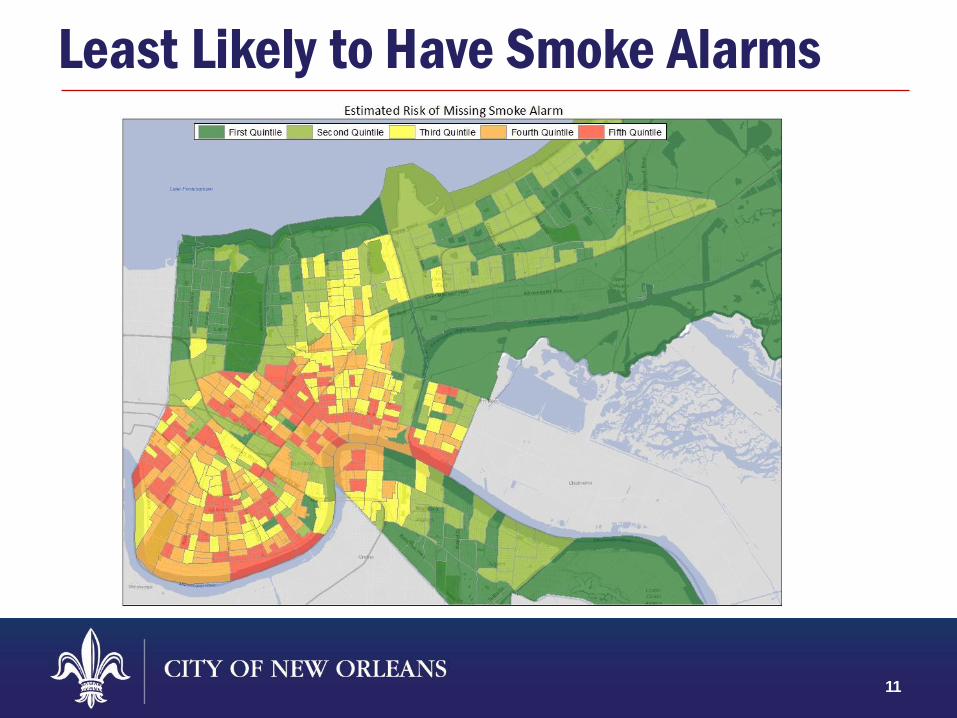
Least Likely to Have Smoke Alarms
11

What areas of the cities are most prone to
fire fatalities?
• Research shows that the very young and very old are most
susceptible to fire fatalities (National Fire Protection
Association 2010)
28
12
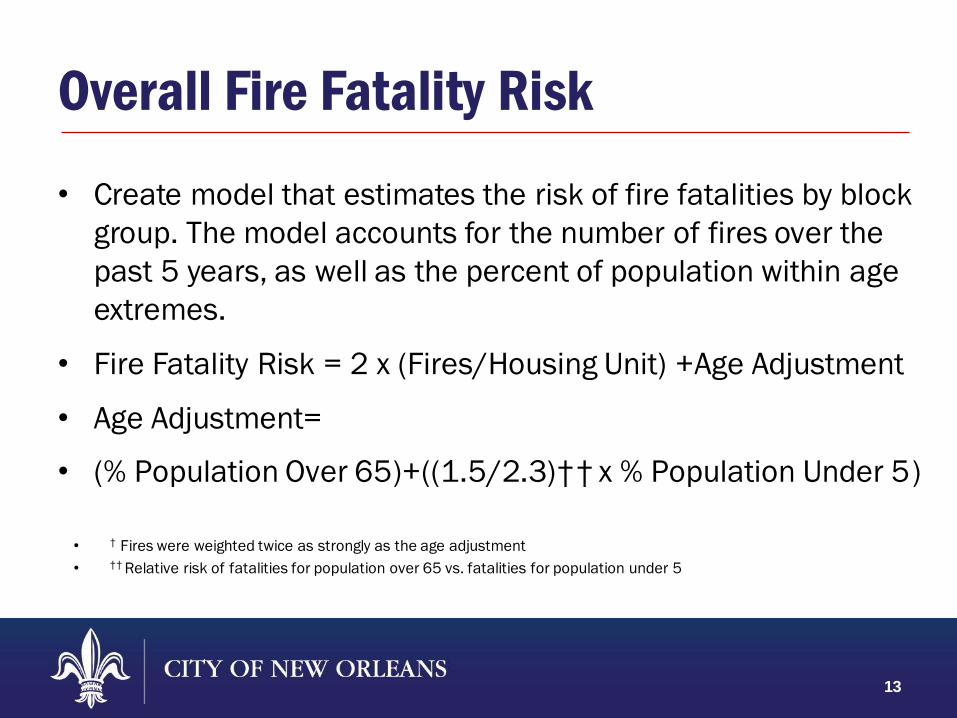
Overall Fire Fatality Risk
• Create model that estimates the risk of fire fatalities by block
group. The model accounts for the number of fires over the
past 5 years, as well as the percent of population within age
extremes.
• Fire Fatality Risk = 2 x (Fires/Housing Unit) +Age Adjustment
• Age Adjustment=
• (% Population Over 65)+((1.5/2.3)†† x % Population Under 5)
• † Fires were weighted twice as strongly as the age adjustment
• †† Relative risk of fatalities for population over 65 vs. fatalities for population under 5
13

Most at Risk of Fire Fatalities
14

NOFD saves lives by targeted smoke
alarm outreach
15
Overview of the American
Community Survey
Gretchen Gooding
American Community Survey Office,
U.S. Census Bureau
16

Stats in Action Videos
17
census.gov/programs-surveys/acs/library/videos.html

ACS Basics
• Ongoing monthly survey sent to 3.5 million
addresses per year to produce detailed
population and housing estimates each year
• Visit 20,000 Group Quarter facilities and sample
approximately 194,000 residents each year
• Designed to produce critical information on
small areas and small population groups
previously collected on the decennial long
form
• Covers 35+ topics and supports over 300
known Federal Government uses
• Data released twice annually
• 1-year estimates (12 months of data)
• 5-year estimates (60 months of data)
18

ACS Data Collection Process
19
Online Mail Telephone Personal Visit
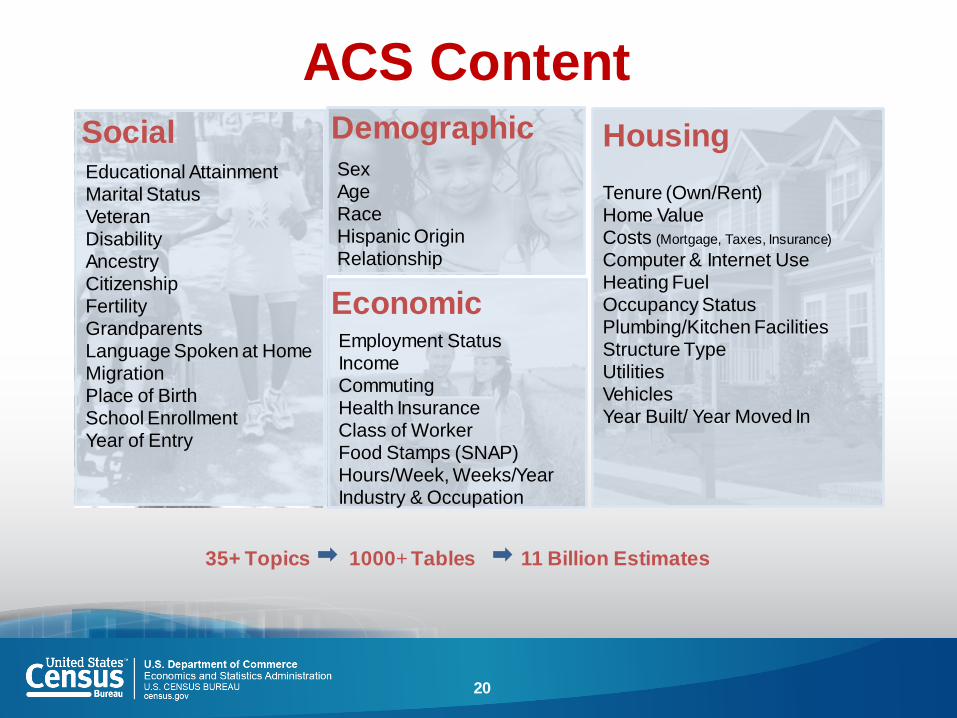
ACS Content Educational Attainment Marital Status Veteran Disability Ancestry Citizenship Fertility Grandparents Language Spoken at Home Migration Place of Birth School Enrollment Year of Entry
Social
Employment Status Income Commuting Health Insurance Class of Worker Food Stamps (SNAP) Hours/Week, Weeks/Year Industry & Occupation
Sex Age Race Hispanic Origin Relationship
35+ Topics 1000+ Tables 11 Billion Estimates
Economic
Demographic Tenure (Own/Rent) Home Value Costs (Mortgage, Taxes, Insurance)
Computer & Internet Use Heating Fuel Occupancy Status Plumbing/Kitchen Facilities Structure Type Utilities Vehicles Year Built/ Year Moved In
Housing
20

Selected Census Geographic Concepts
Nation
Regions
States
Counties
Census Tracts
Block Groups
Congressional
Districts
American Indian/
Alaska Native Areas/
Hawaiian Home Lands
Urban Areas Metropolitan and
Micropolitan Areas
Zip Code
Tabulation
Areas
Places School
Districts
Public Use
Microdata
Areas
(PUMAs)
Alaska
Native
Regional
Areas
State
Legislative
Districts
930,000
Geographic Areas 35,000+
Communities
21

Availability of ACS Data Products
Estimated
Population of
Geographic Area 1-Year
Estimates
5-Year
Estimates
65,000 or more X X
Less than 65,000 X
Release Date September 15 December 8
22
census.gov/programs-surveys/acs/news/data-releases.html

ACS Website
23
census.gov/acs

Selected Ways to Access
QuickFacts
Census Explorer
OnTheMap for Emergency Management
Census Business Builder
Narrative Profiles
American FactFinder
Application Programming Interface (API)
24
census.gov/acs/www/data/data-tables-and-tools/

QuickFacts
.
census.gov/quickfacts
25
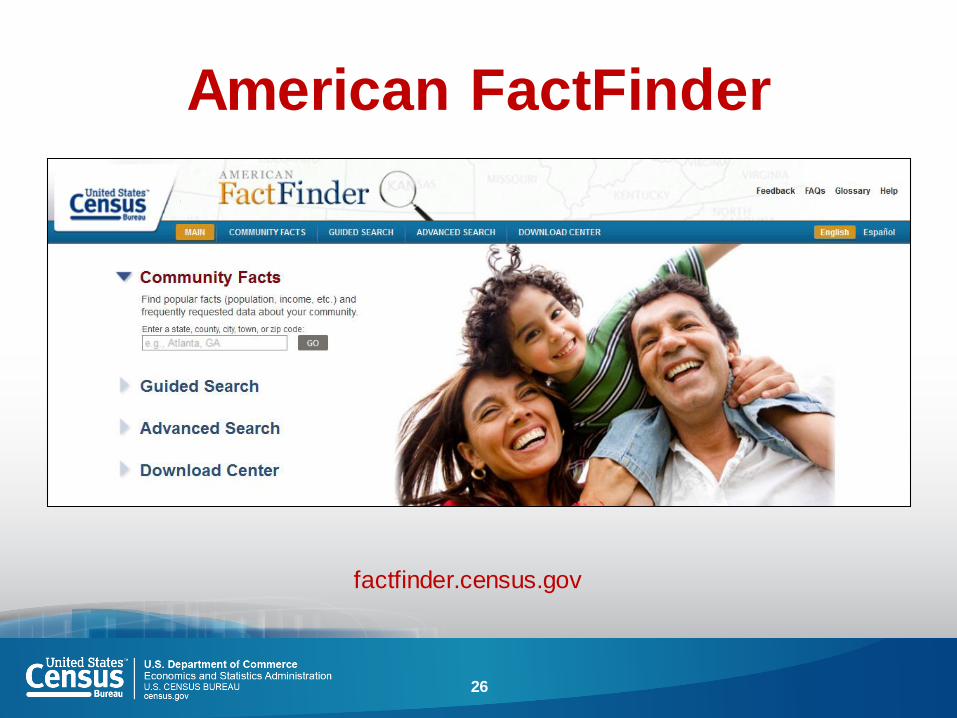
American FactFinder
26
factfinder.census.gov

Application Programming
Interface (API)
census.gov/developers
27

Sign up for and manage alerts at https://public.govdelivery.com/acco
unts/USCENSUS/subscriber/new
More information on the
American Community Survey: http://www.census.gov/acs
Continue the Conversation #ACSdata
Census 1-800-923-8282
28
facebook.com/uscensusbureau
twitter.com/uscensusbureau
youtube.com/user/uscensusbureau
instagram.com/uscensusbureau
pinterest.com/uscensusbureau
linkedin.com/company/us-census-bureau

Purpose of the ACS Data Users Group (DUG) is to improve understanding of the value and utility of ACS data and to promote information sharing among data users about key ACS data issues and applications
Membership is free and open to all interested ACS data users
Webinars and special sessions at professional meetings planned
Next data users conference planned for May 11-12, 2017
Users group website and online community
acsdatausers.org
29 29
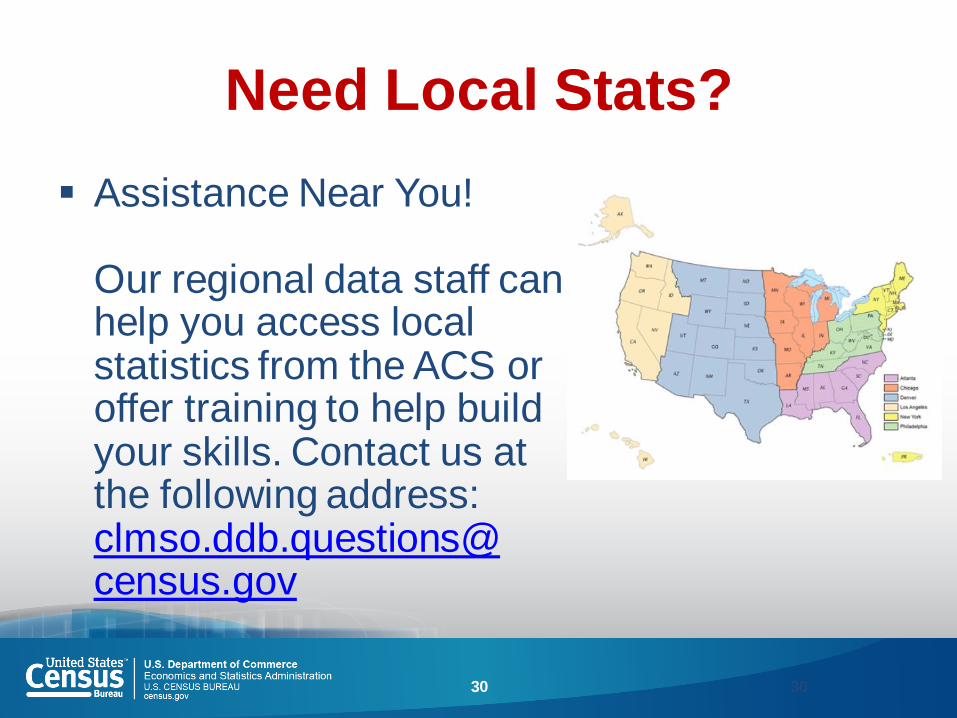
Need Local Stats?
Assistance Near You! Our regional data staff can help you access local statistics from the ACS or offer training to help build your skills. Contact us at the following address: clmso.ddb.questions@ census.gov
30 30
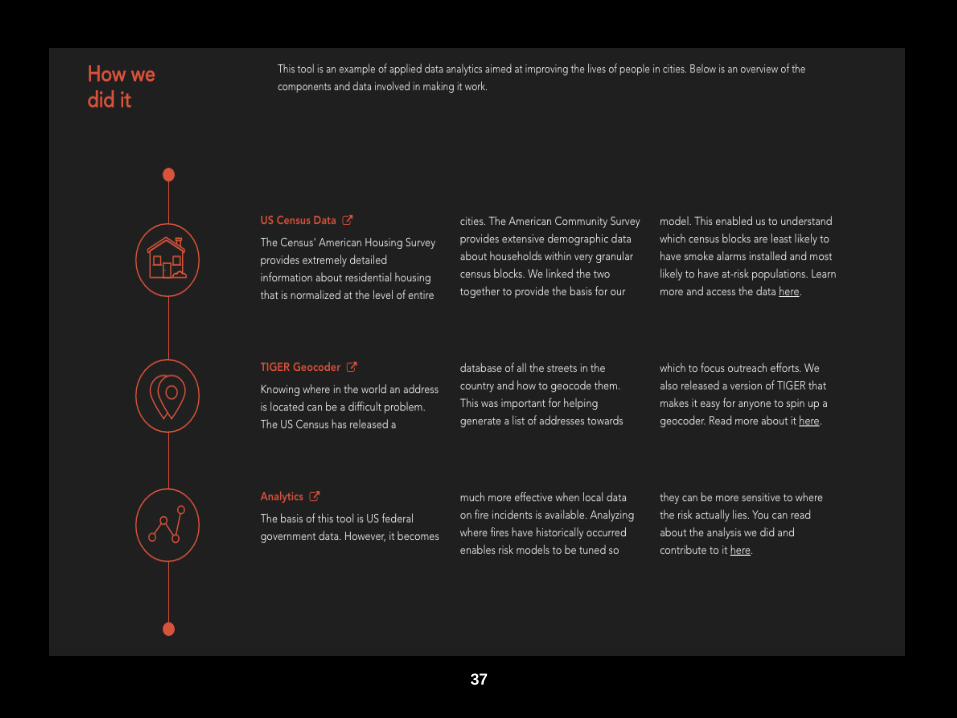
Smoke Signals Enigma’s Open Source Prediction Engine Available for 200 American Cities
31
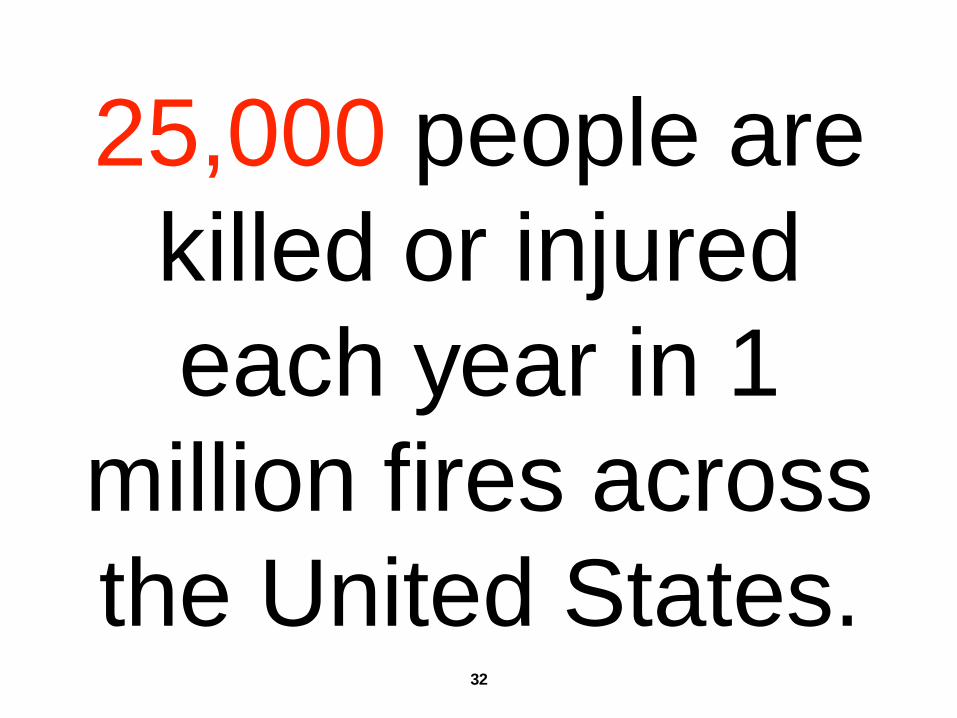
25,000 people are
killed or injured
each year in 1
million fires across
the United States. 32
How Many Had a Smoke
Alarm?
33
Data is powerful when it drives action
34
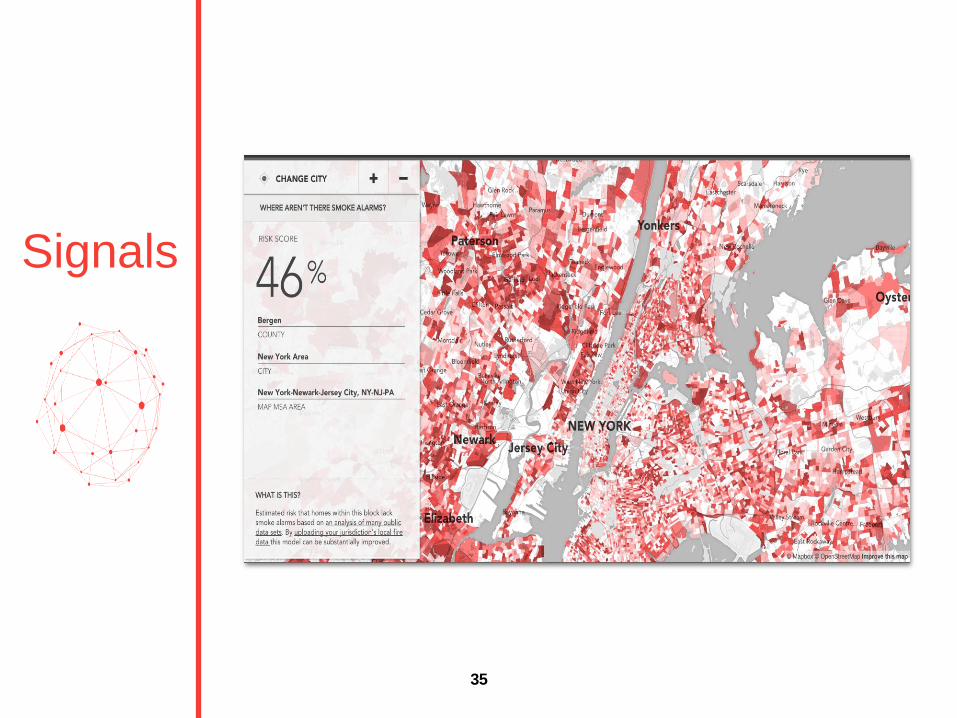
Signals
35

DEMO
36
37
© National Fire Protection Association. All rights reserved.
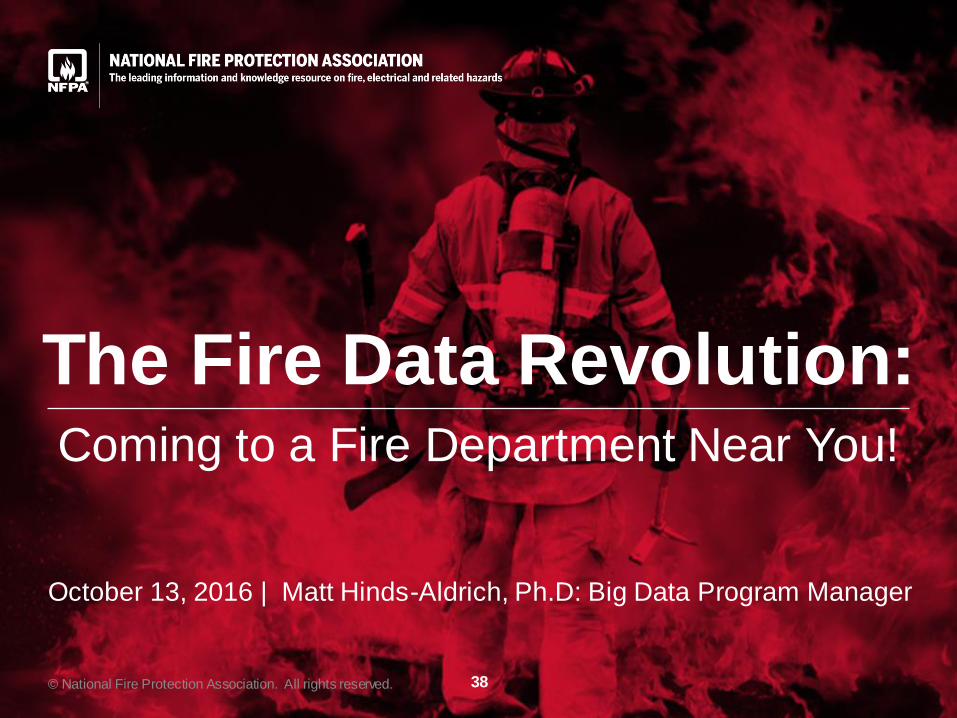
The Fire Data Revolution: Coming to a Fire Department Near You!
October 13, 2016 | Matt Hinds-Aldrich, Ph.D: Big Data Program Manager
38

nfpa.org | © National Fire Protection Association. All rights reserved. 39
nfpa.org | © National Fire Protection Association. All rights reserved.
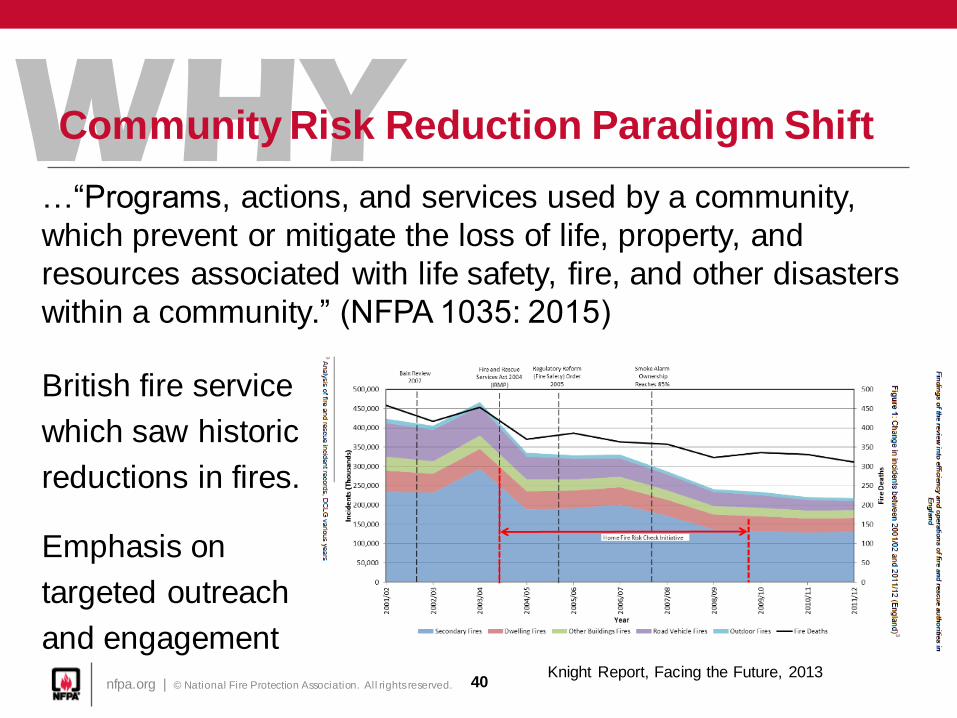
WHY Community Risk Reduction Paradigm Shift
…“Programs, actions, and services used by a community,
which prevent or mitigate the loss of life, property, and
resources associated with life safety, fire, and other disasters
within a community.” (NFPA 1035: 2015)
British fire service
which saw historic
reductions in fires.
Emphasis on
targeted outreach
and engagement Knight Report, Facing the Future, 2013
40
nfpa.org | © National Fire Protection Association. All rights reserved.
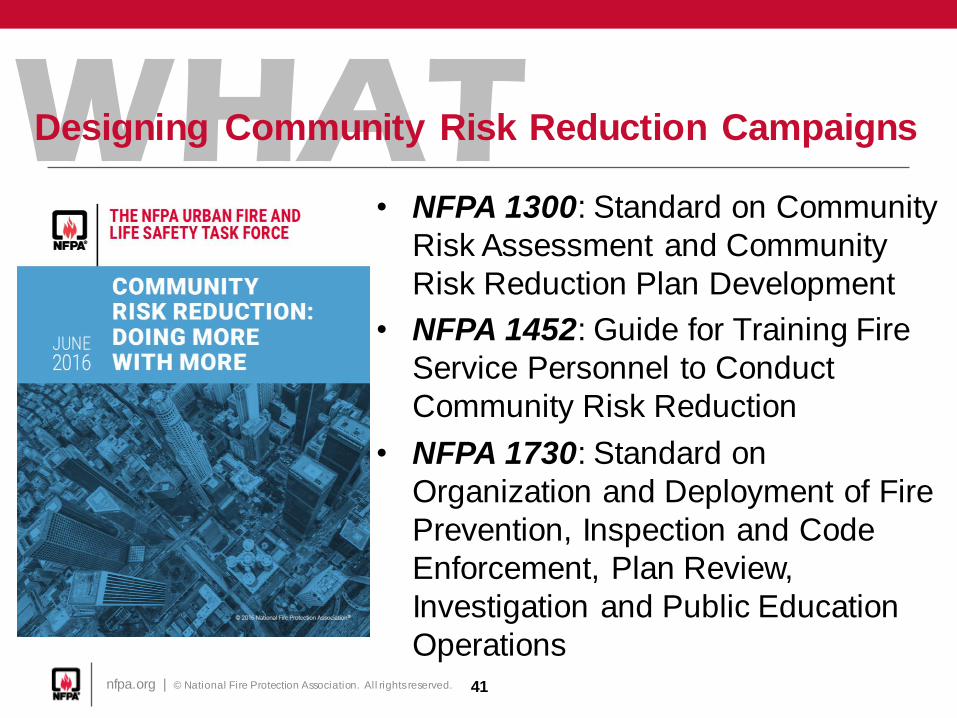
WHAT Designing Community Risk Reduction Campaigns
• NFPA 1300: Standard on Community
Risk Assessment and Community
Risk Reduction Plan Development
• NFPA 1452: Guide for Training Fire
Service Personnel to Conduct
Community Risk Reduction
• NFPA 1730: Standard on
Organization and Deployment of Fire
Prevention, Inspection and Code
Enforcement, Plan Review,
Investigation and Public Education
Operations 41

nfpa.org | © National Fire Protection Association. All rights reserved.
WHO Identifying “At Risk” People
• People are the often overlooked part of the equation
• Proportionally seniors remain one of highest risk groups
• Identifying community partners and alternative data sources
• Fire Incident data
• EMS / Public Health data
• Census data
• School data
42
nfpa.org | © National Fire Protection Association. All rights reserved.
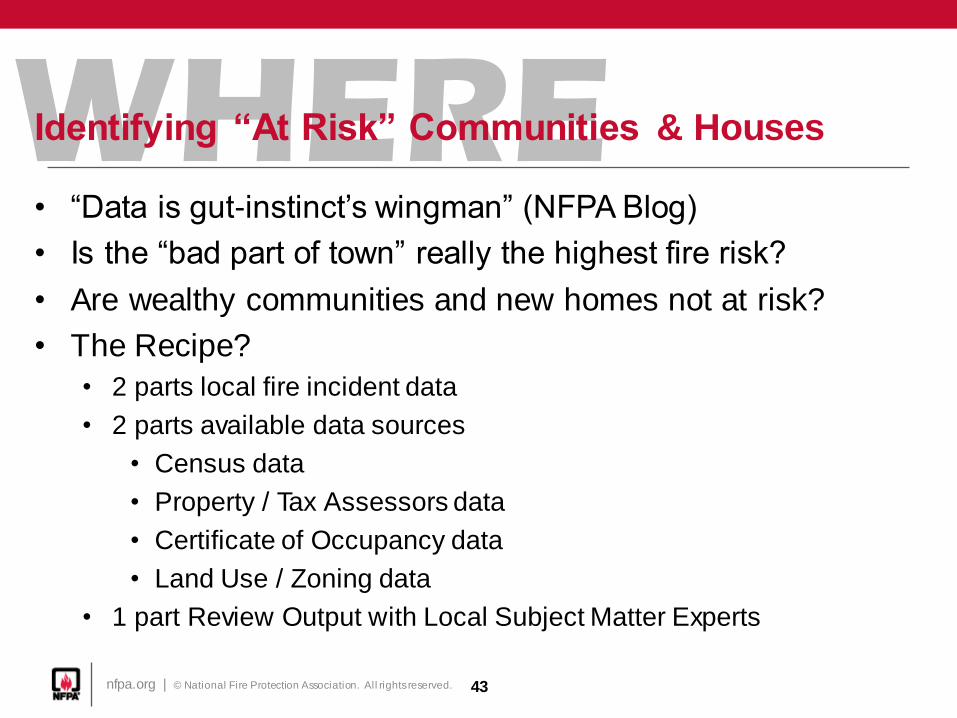
WHERE Identifying “At Risk” Communities & Houses
• “Data is gut-instinct’s wingman” (NFPA Blog)
• Is the “bad part of town” really the highest fire risk?
• Are wealthy communities and new homes not at risk?
• The Recipe?
• 2 parts local fire incident data
• 2 parts available data sources
• Census data
• Property / Tax Assessors data
• Certificate of Occupancy data
• Land Use / Zoning data
• 1 part Review Output with Local Subject Matter Experts
43

nfpa.org | © National Fire Protection Association. All rights reserved.
WHEN Taking the Initiative
NOW! 44

nfpa.org | © National Fire Protection Association. All rights reserved.
HELP? How Can NFPA Help Us?
National Fire Data System
Research Reports
Analytical Tools
NFPA Technical Questions Service (*free to members and AHJs/public sector officials)
45

nfpa.org | © National Fire Protection Association. All rights reserved. 46

nfpa.org | © National Fire Protection Association. All rights reserved.
Thank You
Matt Hinds-Aldrich, Ph.D. Big Data Program Manager
National Fire Protection Association 1 Batterymarch Park, Quincy, MA 02169 USA
(p) 617-984-7344
47

Questions?
48
Dial *1 for the Operator
48
Today’s presentation will be posted soon at
https://www.census.gov/programs-surveys/acs/guidance/training-presentations.html

Evaluation
49