using aster and geophysical mapping for mineral ... · pdf fileaster multispectral satellite...
TRANSCRIPT
Geological Survey of New South Wales
Quarterly NotesMay 2014 No 140
Using ASTER and geophysical mapping for mineral exploration in the Wagga Wagga and Cobar areas NSW
Abstract This study evaluated and validated (ground truthed) recently released ASTER satellite geoscience maps of Australia and evaluate their use in geological mapping within New South Wales The Wagga Wagga 1100 000 and the Cobar 1250 000 map sheet areas were chosen for the study Most of the study focussed on Wagga Wagga central to a new geological mapping project area of the Geological Survey of New South Wales It included processing interpretation and data integration with aeromagnetic and radioelement data digital elevation data and geological data All data were incorporated into a GIS platform to examine vegetation and regolithsoil spectral issues mdash in order to assess the potential for local geologicalalteration models and to generate spectralndashgeophysical anomalies of interest Through topographic modelling of slope information from SRTM data techniques were developed to target terrain with greatest geological exposure and exclude areas of vegetation active cultivation and transported cover This included illuminating (elevation and azimuth) the SRTM data to simulate similar conditions when the relevant ASTER imagery was acquired This was followed by field validation using a portable field spectrometer to measure spectral signatures of outcrop and soils and to examine their comparison with the ASTER data As the original ASTER satellite imagery can sometimes exhibit mis-calibration in areas of deep shadow and dark ground surfaces the fieldwork demonstrated the importance of validating spectral signatures of anomalous mineralised areas Applying ASTER maps to the investigation of semi-arid environments such as the Cobar region shows the usefulness of AlOH (eg muscovite illite) ferric oxide (eg hematite goethite) and silica (eg quartz) index products in regolith mapping When combined with radioelement K the ASTER imagery can potentially discriminate zones of weathered regolith and exposed outcrops thereby assisting exploration for mineralisation Key words Wagga Wagga Cobar ASTER mineralogy geophysics DEMs data integration
AUTHORS Robert Hewson
School of Mathematical amp Geospatial Sciences RMIT University David Robson
Geological Survey of New South Wales 516 High Street Maitland NSW 2320
copy State of New South Wales through Department of Trade and Investment Regional Infrastructure and Services 2014
Papers in Quarterly Notes are subject to external review External reviewer for this issue was Simon Oliver of Geoscience Australia His assistance is appreciated
Quarterly Notes is published to give wide circulation to results of studies in the Geological Survey of New South Wales Papers are also welcome that arise from team studies with external researchers Contact simonemeakintradenswgovau
ISSN 0155-3410
-
Contents Abstract 1
Introduction 2
ASTER Multispectral Satellite Sensor 2
Mineral detection using ASTER 3
Past ASTER case studies 3
CSIROndashGA Australian ASTER geoscience map products 4
Case study areas mdash environment and geology 5
ASTER coverage of NSW 5
Wagga Wagga 1100 000 map sheet area 6
Cobar 1250 000 map sheet area 6
Datasets and methodologies 7
ASTER 7
Airborne geophysics 7
Digital elevation models (DEMs) 7
Auscover fractional landcover 8
Data integration strategies 9
Field studies and sample spectroscopy 9
ASTER validation study 10
Results 12
Wagga Wagga 1100 000 map sheet area 12
Cobar 1100 000 and Canbelego 1100 000 map sheet areas 21
Conclusions 24
Acknowledgements 25
References 25
Technical editing Richard Facer
Production co ordination Simone Meakin and general editing and Geneve Cox
Geospatial information Kate Holdsworth and Nicole Edwards
Layout Nicole Edwards
Photographs Robert Hewson
Cover image View southwards from the summit of The Rock Nature Reserve near Wagga Wagga
Disclaimer The information (and links) contained in this publication is based on knowledge and understanding at the time of writing (February 2014) However because of advances in knowledge users are reminded of the need to ensure that the information upon which they rely is up to date and to check the currency of the information with the appropriate officer of the Department of Trade and Investment Regional Infrastructure and Services or the userrsquos independent adviser The product trade names in this publication are supplied on the understanding that no preference between equivalent products is intended and that the inclusion of a product name does not imply endorsement by the department over any equivalent product from another manufacturer
Copyright copy State of New South Wales through Department of Trade and Investment Regional Infrastructure and Services 2014 You may copy distribute and otherwise freely deal with this publication for any purpose provided that you attribute the Department of Trade and Investment Regional Infrastructure and Services as the owner
Introduction In August 2012 a series of 17 compositional Australia-wide map products was released by the Commonwealth Scientific Industrial Research Organisation (CSIRO) and Geoscience Australia (GA) from imagery obtained by the multispectral satellite sensor Advanced Spaceborne Thermal Emission Reflectance Radiometer (ASTER) (Cudahy 2012) This followed many successful years of data acquisition by ASTER following its development by Japanrsquos Ministry of Economy Trade and Industry (METI) and launch by National Aeronautics and Space Administration (NASA) (Yamaguchi et al 2001) These compositional maps offer the opportunity of new lsquoeyesrsquo for regional geological mapping within Australia to assist exploration activities This particular study aims to examine and compare the application of the Australian ASTER map products within two different environments of New South Wales (NSW) encompassing the temperate and cultivated Wagga Wagga 1100 000 (100K) and semi-arid Cobar 1250 000 (250K) map sheet areas Wagga Wagga was examined in particular in conjunction with traditional airborne magnetic radiometric and digital elevation model (DEM) datasets acquired by the Geological Survey of New South Wales (GSNSW) An overall objective was to examine the robustness of geoscience mapping capabilities of ASTER as individual map products and via data integration within different environments of NSW This study also follows the previous presentation at the 2013 Australian Society of Exploration Geophysicists conference (Hewson et al 2013) A more detailed description of this study is found in Hewson (2013)
ASTER multispectral satellite sensor ASTER acquires imagery within a 60 km x 60 km scene area from 14 different spectral bands with a pixel resolution of between 15 m and 90 m depending on whether they were generated by the VisiblendashNear Infrared (VNIR) Shortwave Infrared (SWIR) or Thermal Infrared (TIR) sensors (Yamaguchi et al 2001) ASTER tracks a similar Earth orbit and altitude to the older Landsat TM satellites with similar VNIR bands (minus band 1) but with five additional SWIR bands providing higher spectral resolution than Landsat TMrsquos band 7 (Figure 1) ASTER also measures radiance using five bands within the TIR wavelength region (8ndash12 microm) (Figure 1) providing the first access to civilian multispectral TIR data at moderate spatial resolution (90 m)
2 May 2014
3 Quarterly Notes
Figure 1 Typical reflectance and emissivity signatures and their comparison with ASTER and Landsat TM spectral bands (eg bands lsquobxrsquo) Note 1 microm equiv 1000 nm
The additional bands of ASTER compared with Landsat provide an improved capability to discriminate and potentially identify the surface vegetation and rocksoil composition An overview of and comparison between the characteristics of ASTER Landsat and other current satellite sensors were described by Michael (2012) In particular the additional ASTER SWIR bands can detect the clay mineral absorption signature (eg sandstone in Figure 1) separately from carbonate absorption signature (eg limestone in Figure 1) ASTERrsquos TIR bands can also discriminate quartz and silica-bearing rocks (eg sandstone soil in Figure 1) by their absorption features in the 8ndash10 microm range The ability of ASTERrsquos VNIR SWIR and TIR 14-band multispectral sensor to detect diagnostic absorption signatures of mineral (groups) is determined by its spectral resolution (ie bandwidth) specific wavelengths measured (Figure 1) and also its ground spatial resolution These sensor characteristics determine its sensitivity to discriminate different surface components in order to uniquely identify mineral composition within a single digital measurement (eg pixel)
Mineral detection using ASTER The use of ASTER satellite data products follows several decades of laboratory-based spectroscopy within the VNIR SWIR and TIR wavelength regions for the measurement of minerals and mineral groups (Vincent amp Thomson 1972 Hunt amp Ashley 1979) In particular the ferric oxide group (eg hematite and goethite) OH-bearing minerals (eg clays micas amphiboles) and other silicates have been shown to display diagnostic signatures within the VNIR SWIR
and TIR wavelength regions respectively (Sherman 1985 Clark et al 1990 Grove et al 1992 Salisbury amp DrsquoAria 1992) Such spectral signatures exhibit absorption features whose depth in reflectance values (or emissivity within the TIR) can be approximately related to abundance or content of that mineral Some mineral signatures (eg mica) also demonstrate shifts in the wavelength of their absorption reflectance minima (~2200 nm) associated with compositional chemistry changes Such inferred compositional changes of mica can be relevant for the interpretation of their possible metamorphic or alteration history (Duke 1994) The effect of the ASTER sensor spectral resolution on its ability to detect and discriminate different minerals within common rock units and soils can be demonstrated by re-sampling laboratory-measured mineral signatures into equivalent 14-band ASTER signatures (Hewson 2013) Overall ASTERrsquos VNIR and SWIR sensors show themselves capable of discriminating between broad mineral groups such as ferric iron oxide AlOH and MgOHcarbonate In addition ASTERrsquos five TIR bands are capable of discriminating varieties of quartz and broad silicate groups
Past ASTER case studies There have been several successful geological mapping case studies undertaken using ASTER since its launch in 1999 Studies within the semi-arid terrain of Mount Fitton in the northern Flinders Ranges of South Australia demonstrated the ability of ASTER to discriminate the minerals associated with the major
lithological units and also areas of hydrothermal alteration (Hewson et al 2001) Rowan and Mars (2003) also showed that lithological mapping was feasible in areas of good exposure Hewson et al (2005) using Broken Hill NSW data successfully applied simply devised spectral indices (eg band ratios) using ASTER radiance imagery to map mineralogy A more detailed explanation was offered in GS20131558 (Hewson 2013) This approach is the basis for many of the CSIRO and Geoscience Australian ASTER Geoscience Map Products (Cudahy 2012) Some limitations to using the ASTER SWIR bands for mineral (group) mapping have been present in past case studies due to the crosstalk issue where stray light from band 4 lsquoleaksrsquo as an additive noise signal into bands 5 and 9 (Iwasaki et al 2001) An algorithm and software were implemented to correct for this miscalibration issue (Iwasaki amp Tonooka 2005) However in areas of low ground reflectance (eg shadow thick vegetation dark surfaces) residual crosstalk effect is apparent and can lead to lsquofalse anomaliesrsquo using spectral band indices (Hewson et al 2005 Hewson amp Cudahy 2011) Early ASTER case studies also showed the usefulness of integrating processed ASTER map products with airborne geophysical data such as radiometric (Hewson et al 2003) In particular sericitemica can be discriminated within ASTER map products generated for the AlOH mineral group using potassium radiometric data at Broken Hill (Hewson et al 2003) Integrating Landsat TM (Ricchetti 2000) and ASTER imagery (Hewson et al 2006) with Digital Elevation Model (DEM) information has also improved the classification and interpretation of the geomorphology and geology In particular ASTER-interpreted quartz mineral occurrences related to transported sandy alluvial cover can be easily discriminated from silicified rock outcrops with slope and shaded DEM products (Hewson et al 2006) Since the launch of the Australian CSIROndashGA Australian ASTER Geoscience Map products Laukamp et al (2013) recently demonstrated its application for mineral exploration in the Jervois Block arid environment of central Northern Territory Further studies also showed their ability to map both lithological units and areas of hydrothermal alteration within the semi-arid Mount Fitton area of the northern Flinders Ranges (Hewson et al 2013)
CSIROndashGA Australian ASTER geoscience map products The Australian ASTER products released by CSIRO and GA provided the first continent-wide mosaic of satellite-derived mineral mapping (Cudahy 2012 Caccetta et al 2013) Prior to the generation of such Australian continental scale compositional maps isolated and independent industry and government agency projects provided useful albeit sometimes haphazard application of ASTER for limited Australian areas using variable methodologies and reference standards The mosaicing of thousands of Australian ASTER radiance scenes were calibrated using many hyperspectral satellite reflectance reference surveys in conjunction with illumination and atmosphere-based gain and offset corrections (Cudahy 2012 Caccetta et al 2013) This calibration of ASTER imagery using reflectance reference areas attempted to reduce the effects of crosstalk variable illumination and ground cover conditions (Caccetta et al 2013) Subsequent processing into band (ratio) parameters targeting composition-related spectral absorption features provided a generally reliable approach for generating map products across Australia (Caccetta et al 2013 Cudahy 2012) The values produced by these band parameter ratio products provided a unitless and relative estimate of abundance or indicator of composition depending on the nature of the described product Masking of resulting band parameter products was performed to exclude areas of cloud cover deep shadow water bodies and significant vegetation followed by the application of consistent thresholds that best qualitatively to semi-quantitatively represented mineral (group) surface content and likely mineral species composition of rocksoil exposures Table 1 summarises the 17 ASTER products and their inferred accuracies (Cudahy 2012)
NASA-developed World Wind software (http wwwgagovauaster-viewer) has been promoted as a user-friendly method of visualising these CSIROndash GA Australian ASTER geoscience map products in conjunction with topographic information and other geophysical datasets such as radiometric data These ASTER map products in GeoTIFF file format can be accessed from the AuScope Discovery Portal (http portalauscopeorgportalgmaphtml) or CSIROrsquos site C3DMM (httpc3dmmcsiroau) In this study the ASTER map products in binary sequential (BSQ) format were also used to examine the effects of different histogram stretches and threshold values applied to a variety of band ratio imagery
4 May 2014
Table 1 Summary of the 17 CSIROndashGA compositional map products (Cudahy 2012)
Product name (product spatial resolution) Surface composition Example minerals targeted Accuracy
1 False colour (30 m) Standard VNIR product green vegetation highlighted in red NA
2 Landsat TM Regolith Ratios (30 m) Green vegetation versus different geologicalregolith areas NA 3 Green vegetation content (30 m) Green vegetation Moderate 4 Ferric oxide content (30 m) Hematite goethite jarosite Moderate 5 Ferric oxide composition (30 m) Hematite versus goethite Moderate 6 Ferrous iron index (30 m) As incorporated within silicatescarbonate Moderate 7 Opaque index (30 m) Includes carbon black (eg ash) magnetite Mn oxides Moderate
8 AlOH group content (30 m) Phengite muscovite paragonite illite montmorillonite kaolinite Moderate
9 AlOH group composition (30 m) Ordered kaolinite Al-rich white mica (eg muscovite parashygonite) versus Alndashpoor (also Si- or K-rich) white mica (eg phengite)
Moderate
10 Kaolin group index (30 m) Pyrophyllite alunite well ordered kaolinite Moderate 11 FeOH group content (30 m) Chlorite epidote jarosite gibbsite gypsum Low 12 MgOH group content (30 m) Calcite dolomite magnesite chlorite amphibole talc Moderate 13 MgOH group composition (30 m) Dolomite amphibole chlorite versus calcite amphibole Moderate
14 Ferrous iron content in MgOH carbonate (30 m)
Low ferrous iron carbonate MgOH minerals (eg talc) versus High ferrous iron carbonate MgOH minerals (eg chlorite)
Moderate
15 Silica index (90 m) SiO2 content quartz content enhanced by grain texture Moderate 16 Quartz index (90 m) Quartz Low 17 Gypsum index (90 m) Gypsum Very low
Cobar
Sydney
WaggaWagga
Wagga Wagga 1100 000 map sheet
Cobar 1250 000 map sheet
Canberra
0 200 km
Figure 2 ASTER False colour map product for NSW showing the 1250K map sheet boundaries The Cobar and Wagga Wagga study areas are outlined
Case study areas mdash environment and geology ASTER coverage of NSW Mineral mapping across NSW has been extended by the CSIROndashGA ASTER map products for most of the state with its best mapping examples highlighted within the drier western half (Figure 2) The ASTER scenes were also best mosaiced seamlessly in the arid and semi-arid western half where seasonal and yearly variations in vegetation are less significant mdash as shown by the ASTER False Colour (eg green vegetation shown in red) Figure 2 also shows the two study areas for this study the Wagga Wagga 100K and the Cobar 250K map sheets
Quarterly Notes 5
WAGGA WAGGA 1100 000 map sheet area The area of the Wagga Wagga 1100 000 map sheet of southeastern NSW was examined in this study and encompasses regolith and landforms typical of the Riverine Plains adjacent to the Murrumbidgee River (Figure 3) In particular it has elevations ranging from 180 m to above 500 m experiencing a moderate rainfall between 500 mm and 650 mm per annum (Chen 1997) The majority of the map sheet area is actively farmed either as crops or under sheep or cattle grazing Landforms consist of floodplains to moderately hilly areas with some eroded plateau exposures and piedmonts (Chen amp McKane 1997) Chen (1997) described and analysed the geomorphology and landforms in part using slope percent () estimates of the various floodplains and tributaries (1ndash2) undulating plains and rises (3ndash5) and hilly areas vulnerable to erosion (10ndash30) Surface soils typically include clay-rich alluvial and gravels with a strong presence of aeolian (parna) sediments particularly blanketing areas of lower relief Extensively folded Ordovician metasediments large intrusive Silurian granite bodies and minor Devonian sandstones occupy hilly areas mostly encompassing the eastern and southeastern parts of the Wagga Wagga 1100 000 map sheet area (Raymond 1993)
Creek
Burkes
Creek
Sandy
Creek
Murrumbidgee River
OrsquoBriens
Cre
ek
Yerong Oly
mpi
c
Highway
Highway
Sturt
The Rock Hill Mt Flakney
Wagga Wagga
The Rock
Mangoplah
Livingstone Range
147deg00rsquoE 35deg00rsquoS
147deg00rsquoE 35deg30rsquoS
147deg30rsquoE 35deg30rsquoS
147deg30rsquoE 35deg00rsquoS
2014_04_0084
REFERENCE
Urban area
Lake or swamp
Highway
Major road
Watercourse
0 10 20 km
Figure 3 Location and selected watercourses within the Wagga Wagga 1100 000 map sheet area
The proximity of the Wagga study area to the Gilmore Fault and the GidginbungAdelong gold deposits provided possible models and references in the search for prospective targets (Downes et al 2004 Lewis amp Downes 2008) The Adelong gold deposit is considered an orogenic gold orebody whilst the Gidginbung goldndashcopper deposit is regarded as a high-sulphidation epithermal type (Lewis amp Downes 2008) Studies of the Lachlan orogenic gold deposits including the Adelong deposit generally show an alteration assemblage that includes sericite muscovitendashphengite andor carbonates (Downes amp Seccombe 2008) and are potentially mapped by the ASTER AlOH and MgOHcarbonate map products The alteration at the Gidginbung deposit consists of several zones that include silicaquartz kaolinite and illite (Downes et al 2004) mdash also potentially mappable by the ASTER AlOH and Silica Indexquartz products As a result one of the main aims in this Wagga study area is to check the ability of the ASTER map products to discriminate such AlOH (eg sericitewhite mica) MgOHcarbonate and silicaquartz content associated with the Silurian granites and adjacent sedimentary metasedimentary units ASTER ferric oxide content and composition map products could also possibly assist with the interpretation of regolith landscape information
COBAR 1250 000 map sheet area Cobar is in western NSW within a semi-arid environment (Figures 2 4) and has an average annual rainfall of approximately 300+ mm (Chan et al 2003) The area is characterised by predominantly erosional landforms encompassing the catchment of the Macquarie and Bogan rivers with minor topographic relief and an average of 200ndash300 m above sea level (Chan et al 2003) Contour intervals of 50 m shown in Figure 4 highlight the mostly low relief peneplain nature of the arearsquos landforms Agricultural cropping occurs in the eastern half of the Cobar 250K map sheet area and rangeland grazing is predominant within the western half The geological exposure of the various Palaeozoic metasedimentary and metavolcanic units of interest for economic gold and base metal deposits are affected by a complex history of regolith development and transported alluvialaeolian deposition (Chan et al 2003 McQueen 2008) Weathering varies considerably but typically 20 m to 80 m thick (Chan et al 2003) Palaeodrainage networks and palaeosurface landforms are also present amongst the current alluvial and colluvial landscape Geochemistry exploration sampling and interpretation within this region requires a detailed knowledge and understanding of the nature and history of the regolith being sampled (Chan et al 2003)
6 May 2014
Quarterly Notes
B a r r i e r H i g h w a y
Highway
Mitchell
Hermidale
Girilambone
Canbelego
Coolabah
Cobar
North East Larsens
CSA
The Peak
Endeavor
Tritton
200
250
200
200
200
200
200
200
200
250
250
250
250
250
250
250
200
200
300
300
300
350
350
300
Yanda
Mulga
Whit
barro
w
Creek
C r e e k
Yarra
n
C r e e k
Creek
C re
ek
Pange
e
COBAR
CANBELEGO
145deg30rsquoE
145deg30rsquoE 147deg00rsquoE
31deg00rsquoS 147deg00rsquoE
31deg00rsquoS
32deg00rsquoS 32deg00rsquoS
REFERENCE 0 25 50 km
Operating mine 2014_04_0085
Highway
Major road
Contour
Watercourse
Figure 4 Cobar 250K map sheet area highlighting major mines watercourses and 50 m elevation contour intervals Topographic base data is from Geoscience Australia
Shortwave Infrared (SWIR) spectroscopy of regolith samples has assisted an understanding of the boundary between transported and residual in situ material (Chan et al 2003) In particular information about clays (including kaolinite crystallinity) has been used to identify such boundaries (Cudahy 1997) Transported materials typically exhibit poorly crystalline or disordered kaolinite signatures while in situ outcrops show crystallinewell-ordered kaolinite signatures The identification of the ferric iron oxide mineral hematite versus goethite can also be a useful indicator of the regolith history and nature of the surface exposure (Huntington et al 1999) It is in this context that the recently released ASTER mineral map products together with geophysical radiometric information can potentially assist the interpretation of surface regolith landforms around Cobar and also aid the analysis of geochemical surveys
Datasets and methodologies ASTER GeoTIFF and BSQ binary format versions of the ASTER map products were both utilised in this study as made available by CSIRO and GA via the GSNSW The 17 ASTER products were visualised with ENVITM (httpwwwexelisviscom) ERMapperTM (http geospatialintergraphcomHomepageaspx) and Global MapperTM (httpwwwbluemarblegeocomproducts
global-mapperphp) software where map sheet boundaries drainage and other relevant topographic Geographic Information System (GIS) shapefile information were incorporated ERMapperTM and Global MapperTM proved the most user friendly when integrating with geophysical and other datasets of different dimensions and origins BSQ format versions of the ASTER map products were useful when examining variations of the imagery and generated mineral anomalies using different image histogram stretches and cutoff thresholds from those assumed in Cudahy (2012) The ASTER acquisition dates of imagery used for the generation of mineral map products in the Wagga Wagga and Cobar study areas were determined by examining the ASTER archive listed within the USGS Glovis site (httpslpdaacusgsgovdata_accessglovis) Data for the major portion of the Wagga Wagga 100K map sheet are were acquired with ASTER on 1112001 The geologically relevant western half of the Cobar 250K map sheet area with minimal cropping and cultivation (inc Cobar 100K Canbelego 100K map sheet areas) was acquired by ASTER on 1992003
Airborne geophysics Various radiometric and filtered aeromagnetic or Total Magnetic Intensity (TMI) ERMapper and GeoTIFF files processed into 50 m grids were obtained by the GSNSW for the Wagga Wagga 100K map sheet area High-frequency filtered TMI data such as tilt-angle filtered and first (1VD) second (2VD) vertical and horizontal (1HD) derivative files were also examined for near-surface magnetic anomalies relevant for comparison with the radiometric and ASTER data TMI imagery was also processed as Reduced to the Pole (RTP) TMI versions to adjust for Earthrsquos magnetic declination etc Radioelements potassium (K) thorium (Th) and uranium (U) and the ternary RGB composite imagery (eg Red K Green Th Blue U) were useful to compare with surface remote sensing compositional imagery although typically that senses deeper into the subsurface (to ~30 cm) Airborne radiometric data processed as 100 m grids were also used for the Cobar 250K map sheet study ERMapperTM and to a lesser extent ENVITM were used for examining and image processing the airborne geophysical datasets
Digital elevation models (DEMs) DEMs were available from the GSNSW airborne geophysics radar altimeter (at 50 m grid cells) the ASTER GDEM Version 2 (httpasterwebjplnasa govgdemasp) at 30 m (x y) spatial resolution and the Shuttle Radar Topography Mission (SRTM) at
7
2014_04_0086a
80 m (x y) spatial resolution (httpwww2jplnasa govsrtm) Higher resolution SRTM DEMs at 30 m (x y) were also accessible via the NSWGS for this particular government study although were found to be somewhat noisy within the Wagga Wagga and Cobar areas ENVITM was used to process DEM data into topographic models that included slope and artificial sun-shaded relief imagery The SRTM DEM information was found to generate the best slope product Figure 5a displays the SRTM 80 m slope for relief greater than 10 combined with landscapes of Chen (1997) highlighting that these steeper slopes occur within divisions IV and V
Auscover fractional landcover Australiarsquos land surface has been recently analysed for fractional cover percentages of bare ground (eg soil rock outcrop) green vegetation and dry vegetation cover as part of the Terrestrial Ecosystem Research Network (TERN httpwwwternorgau) Datasets are available as part of this project via the AusCover data facility (httpdataauscoverorgau) Several
different versions of fractional cover information based on different algorithms and satellite sensors have been generated and are currently in the process of validation across Australia In this study the satellite Landsat TM 5- and 7-based fractional cover analysis provided high 30 m spatial resolution for the Wagga Wagga and Cobar study areas This coverage information was generated by algorithms described by Scarth et al (2010) and available via AusCover as binary NetCDF data tiles (httpdataauscoverorg auxwikibinviewProduct+pagesLandsat+Fractio nal+CoverHLinktothedata) The Landsat fractional cover estimates were generated from imagery recorded within a few days of both the Wagga Wagga and Cobar ASTER image acquisition dates listed above Figure 5b displays the fractional cover product as a RGB composite for bare ground green and dry vegetation for the Wagga 100K map sheet area generated from Landsat 7 acquired on 1012001 In this study several masks based on the fractional cover layers were devised and applied on the ASTER maps However the photosynthetic vegetation fraction for values less than 45 were used to refine (ie filter) the final ASTER map examples
147deg00rsquoE 35deg00rsquoS
147deg00rsquoE 35deg30rsquoS
147deg30rsquoE 35deg30rsquoS
147deg30rsquoE 35deg00rsquoS
0 10 20 km
b) 147deg00rsquoE
35deg00rsquoS
147deg00rsquoE 35deg30rsquoS
147deg30rsquoE 35deg30rsquoS
147deg30rsquoE 35deg00rsquoS
a)
0 10 20 km
2014_04_0086b
Figure 5 a) Wagga Wagga 100K landscape divisions overlying SRTM 80 m DEM slope greater than 10 Blue 150 to Red 300m Landscape divisions (I) Murrumbidgee floodplains (II) alluvial plains of local streams (III) undulating plains rises and long footslopes (IV) hilly areas and (V) eroded plateau and piedmont plains (Chen 1997) b) Wagga 100K Landsat 7-derived fractional cover RGB image Red bare ground Green photosynthetic vegetation Blue non-photosynthetic vegetation (linear stretch 0ndash100)
8 May 2014
Quarterly Notes
Burkes
Creek
Sandy Creek
Murrumbidgee River
OrsquoBriens
Cre
ek
Yerong
Creek
Oly
mpi
c
Highway
Highway
Sturt
147deg00rsquoE 147deg30rsquoE35deg00rsquoS 35deg00rsquoS REFERENCE
WP75 Cza AlluviumWP76
Czg Gravelly siltstone colluviumWP74 WP73 WP72
WP77 Du Sandstone minor conglomerate siltstone
OR
DO
VIC
IAN
S
ILU
RIA
ND
EV
ON
IAN
CE
NO
ZOIC
Wagga Svu Quartzndashfeldspar phyric felsic volcanicsWagga
WP60 Sgb Buchargingah granite
WP21 Sgc Collingullie Granite
Sgf Mount Flakney Granite
Sgk Kyeamba Monzogranite
Sgr Burrandana granite
Sgw Wantabadgery Granite
Ou Siltstone shale phyllite minor schist quartzite
WP9
WP10 WP20 WP23 WP34 WP22WP11 WP19WP32
WP31 WP24WP62 WP36 WP17WP43 The Rock WP16
WP12WP58 WP13 WP15WP64 WP25WP66
WP63 WP14
WP26WP27WP49 WP28WP50 WP29 Waypoint
Highway WP47
WP71WP70WP57Yerong Creek
WP56 WP69WP51 WP54 WP68 Major roadWP55 WP67WP53 Watercourse
Lake or swampWP52
147deg00rsquoE 35deg30rsquoS
147deg30rsquoE 35deg30rsquoS
0 10 20 km
2014_04_0087
Figure 6 Wagga Wagga 100K geological map (Raymond 1993) and the observed field localities (WP)
Data integration strategies Past integrated studies of spectral airborne geophysics and DEM data have shown the usefulness of simple RGB composite imagery such as ASTER-derived AlOH content with radiometric K draped over high-pass filtered magnetic data (Hewson et al 2003) Comparing ASTER products with slopes modelled from DEMs was found particularly useful for discriminating mineral occurrences associated with transported alluvium versus outcrop (Hewson et al 2006) In this study slope percent imagery derived from the Wagga Wagga 100K SRTM DEM data was processed with a threshold to extract (lsquomaskrsquo) only areas greater than 10 in order to focus on potentially hilly and piedmont rock talus outcrop exposures within the combined ASTERndash geophysics products Shaded relief imagery of the DEM was also used with ERMapperTM as an lsquoIntensityrsquo base layer to RGB composite imagery of ASTER and geophysics data products Shaded relief DEM imagery for the Wagga Wagga study area was generated assuming a sun elevation of 60deg and azimuth of 072deg to simulate the illumination conditions when the relevant ASTER imagery was acquired on 1112001 at 1030am
Field studies and sample spectroscopy Field sampling and validation of identified ASTER mineral map anomalies were undertaken in the Wagga Wagga area during April 2013 in the form of observed waypoints and as sampling localities A total of 69 localities were visited (lsquoWPxxrsquo Figure 6) of which 29 were sampled for rocks and soils Full descriptions of field waypoints sample localities and associated geologicallandform information are included within the GS20131558 DVD database (Hewson 2013) All collected field samples were measured with the Analytical Spectral Device Inc (ASD) Terraspec 4 VNIRndashSWIR spectrometer (httpwwwasdi comproductsterraspecterraspec-hi-res-mineralshyspectrometer) At this stage no validation or field sampling has been undertaken within the Cobar 250K map sheet area
9
GP5
GP6
a)ASTER validation study Several localities within the Wagga Wagga 100K map sheet area were used for validation or lsquoground truthrsquo sites for the ASTER map products The Wagga Wagga Airport and RAAF base provided useful dark ground targets to test for possible crosstalk issues (Figure 7a) The ASTER False Colour (Figure 7b) map product showed these dark or low-albedo surfaces Residual crosstalk effect is a possible explanation for the corresponding AlOH group content anomalies (red and green areas Figure 7c) Multiple
b)spectral reflectance measurements were undertaken at each site with the TerraSpec 4 (lsquoASDrsquo) spectrometer using its hand-held probe These measurements were averaged and resampled to ASTER spectral resolution to ascertain any possible AlOH-like SWIR signature (Figures 8a b) Tarmac at the Wagga Wagga Airport and the RAAF base exhibited low overall reflectance and an absence of any effective average ASTER AlOH spectral absorption signature centred at band 6 (2200 nm) (Figure 8a b) Additional validation sites were also studied to examine ASTERrsquos geologicalmineral mapping invariant targets with minimal vegetation In particular gravel pits within the Wagga Wagga 100K map sheet area were identified for sampling and ASD Terraspec measurements Waypoint WP52 (Sample WG21 site) within a granite gravel pit of approximately 100 m x 150 m was located on site (Figure 9 andashc) and within the 2001 ASTER map products (Figure 10andashc) The corresponding ASTER map products for the WP52WG21 site showed reasonable spatially coherent anomalies for the ASTER AlOH Silica Index and to a lesser extent the Ferric Oxide anomalies A four ASTER pixel subset within this gravel pit gave AlOH group content and ferric iron content values of 227 and 14 respectively ASD derived equivalent ASTER AlOH group content and ferric iron content ratio products gave favourably comparable values of 242 and 147 respectively Within the same gravel pit subset area the Landsat derived fractional photosynthetic (eg green veg) cover product also showed a low cover value of 23 (Figure 10d)
a) b) 025 025
02 02
WP61
WP60
c)
WP61
WP60
250m 2014_04_0088
Figure 7 a) Google Earth image of ASTER validation sites at Wagga Wagga Airport (GP5) waypoints WP59 WP60 and RAAF parade ground (GP6) waypoint WP61 b) ASTER False colour image c) ASTER AlOH group content (purpleblue low to red high content)
Ref
lect
ance
015
Ref
lect
ance
015
Mean ASTER Equivalent 01 Mean + Std Dev ASTER 01
Mean ASTER Equivalent Mean + Std Dev ASTER Mean - Std Dev ASTER Mean - Std Dev ASTER Mean ASD Mean ASD
005 005
0 0 550 1050 1550 2050 2000 2050 2100 2150 2200 2250 2300 2350 2400
Wavelength (nm) Wavelength (nm) 2014_04_0089
Figure 8 Wagga Wagga Airport tarmac (WP59ndash60) ASD and resampled ASTER equivalent signature (mean plusmn standard deviation) for a) the VNIRndashSWIR wavelengths and b) close up for SWIR wavelengths
10 May 2014
Quarterly Notes
a) b)
c) wg21a_af00 Figure 9 a) Google Earth image of ASTER geological wg21a_af01 validation site WP52WG21 b) Granitic gravel pit at WP52 wg21r_bf00 WG21 c) ASD Terraspec spectral signatures of granitegravel wg21r_bf01 showing ferric iron and pronounced AlOH diagnostic spectral wg21r_cf00 features at 880 nm to 1000 nm and 2208 nm respectively wg21r_cf01 Equivalent ASTER resampled signatures (asterisks) show
05 detectable features particularly for the AlOH SWIR feature 04
03
02
Hematite (880 nm) 01
Goethite (1000 nm) Al-poor mica (2208 nm)
00 400 900 1400 1900 2400
Wavelength (nm)
2014_04_0090
a) b)
Ref
lect
ance
WG21 WG21
c) d)
WG21
WG21
2014_04_0091250m
Figure 10 a) ASTER False Colour image of WP52 granitic gravel pit b) ASTER AlOH group content c) ASTER Silica Index d) Landsat fractional cover ndash photosynthetic cover Images bndashd display map product values from low (purpleblue) to high (red) values Grid cell is 250 m square
11
Results
WAGGA WAGGA 1100 000 map sheet area ASTER map products The Australian ASTER GeoTIFF map products were initially examined individually for the Wagga Wagga 100K map sheet area Several of the 17 products did not show significant anomalies related to geological features and were limited to (cultivated) cropping patterns at best In particular the ASTER imagery used here was acquired in mid-summer 2001 and highlighted exposed fallow fields and soils (Figure 11) The ASTER False Colour map product (Figure 11) also highlighted the town of Wagga Wagga and several vegetated areas with topographic relief (dark red to dark grey) A slight boundary anomaly is apparent at the extreme northwestern edge of the 100K scene from a change of ASTER image scenes ASTERrsquos green vegetation content product (Figure 12a) corresponds approximately with areas of red shown in the ASTER false colour product (Figure 11) although this green vegetation content product is is more correctly generated by a band ratio (bands 3band 2) targeting the chlorophyll lsquored edgersquo Exposed soil and fallow crop fields have no or low green vegetation anomalies (blue) on the floodplains and lowlands while vegetation is highlighted
Wagga Wagga
Vegetated relief
Murrumbidgee River Flood Plain
147deg00rsquoE 35deg00rsquoS
147deg00rsquoE 35deg30rsquoS
147deg30rsquoE 35deg30rsquoS
147deg30rsquoE 35deg00rsquoS
2014_04_0092
0 10 20 km
Figure 11 ASTER false colour products within Wagga Wagga 100K map sheet area
147deg00rsquoE 35deg00rsquoS
147deg00rsquoE 35deg30rsquoS
147deg30rsquoE 35deg30rsquoS
147deg30rsquoE 35deg00rsquoS
0 10 20 km
147deg00rsquoE 35deg00rsquoS
147deg00rsquoE 35deg30rsquoS
147deg30rsquoE 35deg30rsquoS
147deg30rsquoE 35deg00rsquoS
2014_04_0093
Figure 12 a) Wagga Wagga 100K ASTER green vegetation product (blue low red high content) b) ASTER AlOH content (blue low red high content)
within areas of topographic relief (Figures 11 12a) ASTERrsquos AlOH content product (Figure 12b) shows very limited clay anomalies except for the Wagga Wagga township and an apparent association with vegetated occurrences shown in the green vegetation product (Figure 12a) A green vegetation mask based on the ASTER product was applied during the generation of the AlOH composition map product and minimal anomalies were apparent
12 May 2014
13 Quarterly Notes
147deg00rsquoE 35deg00rsquoS
147deg00rsquoE 35deg30rsquoS
147deg30rsquoE 35deg30rsquoS
147deg30rsquoE 35deg00rsquoS
0 10 20 km
147deg00rsquoE 35deg00rsquoS
147deg00rsquoE 35deg30rsquoS
147deg30rsquoE 35deg30rsquoS
147deg30rsquoE 35deg00rsquoS
2014_04_0094
Figure 13 a) Wagga Wagga 100K ASTER ferric oxide content (blue low red high) and b) composition map products Apparent trends in the ferric oxide content are shown in red dashed lines
ASTERrsquos ferric oxide content and composition products (Figures 13a b) show elevated values in contrast with the AlOH group content product (Figure 12b) There is also some variation in composition from the interpreted goethite-rich (bluendashcyan) to hematite-rich (redndashyellow) (Figure 13b) Some linear trends were
Figure 13a) show boundaries and possible lineaments related to floodplain alluvium regolith or geological units Although Cudahy (2012) described the ferric oxide content as having moderate accuracy a comment is also noted for the potential of pixel spectral mixing errors and an inverse relationship with the green vegetation product This could also be either related to the obscuring effect of vegetationcrops or spectral signature ambiguities given the proximity of VNIR spectral features The ASTER FeOH and ferrous iron products in the Wagga Wagga 100K map sheet area did not generate coherent or distinct features apart from some isolated paddock anomalies The ASTER MgOH group content and composition products showed minimal occurrences except for some anomalies in the far southwestern corner which occupied farm fields adjacent to Ordovician metasedimentary rocks Likewise the kaolinite group Index showed only minor anomalies Both the ASTER MgOH group content and composition and kaolinite index products were masked for green vegetation during processing (Cudahy 2012) The Silica Index (Figure 14) proved to have less noise and highlighted more anomalies than the ASTER quartz index although the range in values and image contrast were limited Subtle anomalies highlighted by the Silica Index generally occurred within paddocks corresponding to low green vegetation and also as broader subtle variations (Figure 14)
147deg00rsquoE 35deg00rsquoS
147deg00rsquoE 35deg30rsquoS
147deg30rsquoE 35deg30rsquoS
147deg30rsquoE 35deg00rsquoS
2014_04_0095
Figure 14 Wagga Wagga 100K map sheet area ASTER silica index
apparent although the anomalies were often biased by the cropping patterns and exposed paddock soils Nonetheless some linear trends (red dashed lines in
Burkes
Creek
Sandy Creek
Murrumbidgee River
OrsquoBriens
Cre
ek
Yerong
Creek
Oly
mpi
c
Highway
Highway
Sturt
a) b)
147deg00rsquoE 147deg30rsquoE 147deg00rsquoE 147deg30rsquoE 35deg00rsquoS 35deg00rsquoS 35deg00rsquoS 35deg00rsquoS
Bulloc Bulloc Range Burngoogee Ranges
Melebo Mountains
35deg30rsquoS 35deg30rsquoS 35deg30rsquoS 35deg30rsquoS 147deg00rsquoE 147deg30rsquoE 147deg00rsquoE 147deg30rsquoE
0 10 20 km 0 10 20 km
2014_04_0096a 2014_04_0096b
Figure 15 a) Wagga Wagga 100K SRTM 80 m slope (blue low red high) b) SRTM 80 m sun-shaded imagery draped with ASTER green vegetation product (Figure 12a) masked for slope gt10
147deg00rsquoE 147deg30rsquoE35deg00rsquoS 35deg00rsquoS REFERENCE
OR
DO
VIC
IAN
S
ILU
RIA
ND
EV
ON
IAN
CE
NO
ZOICWP75 Cza Alluvium
Czg Gravelly siltstone colluvium
Du Sandstone minor conglomerate siltstone
WP76
WP74 WP73 WP72
WP77
Wagga Svu Quartzndashfeldspar phyric felsic volcanicsWagga
WP60 Sgb Buchargingah granite
WP21 Sgc Collingullie Granite
Sgf Mount Flakney Granite
Sgk Kyeamba Monzogranite
Sgr Burrandana granite
Sgw Wantabadgery Granite
Ou Siltstone shale phyllite minor schist quartzite
WP9
WP10 WP20 WP23 WP34 WP22WP11 WP19WP32
WP31 WP24WP62 WP36 WP17WP43 The Rock WP16
WP12WP58 WP13 WP15WP64 WP25WP66
WP63 WP14
WP26WP27WP49 WP28WP50 WP29 WaypointWP47
WP71WP57 Highway WP70
WP56 WP69Yerong Creek WP51 WP54 WP68 Major roadWP55
WP67WP53 Watercourse
WP52 Lake or swamp
35deg30rsquoS 35deg30rsquoS 0 10 20 km 147deg00rsquoE 147deg30rsquoE
2014_04_0097
Figure 16 Wagga Wagga 100K geology map (Raymond 1993) combined with SRTM 80 m slope gt10 showing geological units within areas of high relief
14 May 2014
15 Quarterly Notes
The nature of the geomorphology and extensive agricultural cultivation of the Wagga Wagga 100K sheet area prompted the use of DEM data to discriminate the likely geologically exposed areas Processing the SRTM 80 m DEM for slope information highlighted the major ranges and topographic relief (Figure 15a) Sun-shaded DEM imagery also highlighted these landforms (Figure 15b) Generation of a mask based on slopes greater than 10 was useful to observe relationships with the various ASTER products For example when ASTERrsquos green vegetation product masked within areas of slope gt10 is combined with sun-shaded imagery much of the higher relief is observed to be moderately to highly vegetated (Figure 15b) Figure 16 shows simplified geological units combined with SRTM data An attempt to overcome the limited range of anomalies observed within the Wagga Wagga 100K ASTER silica index product (Figure 14) using a histogram equalisation stretch within the same data range highlighted both more noise and some coherent anomalies (Figure 17a) Masking of this product with SRTM Slope product greater than 10 (Figure 17b) helped to discriminate exposed geological units as shown in Figure 16 Elevated areas of the quartz-rich sandstone of Bulloc Bulloc Range and metasedimentary rock of Livingstone National Park were highlighted by this approach (Figure 17b)
Geophysical products A similar approach to displaying and enhancing the Wagga Wagga 100K ASTER map products was applied to the airborne radiometric data where anomalous regions were extracted within the areas of elevated slope Histogram equalisation stretching of the K Th and U radioelements highlighted a mixture of alluvial deposition and outcropping geology (Figure 18a) The potassium data coherently mapped the alluvium and floodplains of Burkes Creek and the Murrumbidgee River (Figure 18a) The Mount Flakney Granite and the Bulloc Bulloc Range Ordovician (Ou) and Devonian sandstones (Du) were highlighted as anomalous using the entire 100K map sheet dataset (with histogram equalisation) but more subtle variations in radioelement composition were apparent when slope masking was applied and a simple 2 linear histogram was applied for image stretching (Figure 18b) Compositional variations within these units appeared to be enhanced by limiting the focus to areas of higher relief Increased thicknesses of aeolian deposits alluvium or colluvium on lowlands and areas of reduced slope may mask and dilute radiometric sensing of some of these units
2014_04_0098a
147deg00rsquoE 35deg00rsquoS
147deg00rsquoE 35deg30rsquoS
147deg30rsquoE 35deg30rsquoS
147deg30rsquoE 35deg00rsquoS
147deg00rsquoE 35deg00rsquoS
147deg00rsquoE 35deg30rsquoS
147deg30rsquoE 35deg30rsquoS
147deg30rsquoE 35deg00rsquoS
2014_04_0098b
0 10 20 km
Figure 17 a) Wagga Wagga 100K ASTER Silica Index product generated with a histogram equalisation stretch b) Histogram equalised ASTER silica index masked for slope gt10 (purple blue low to red high content) Areas highlighted are Bulloc Bulloc Range (white) and Livingstone National Park (yellow)
a)
b)
2014_04_0099
16 May 2014
a)
Bullo
c Bu
lloc
Rang
e D
uO
u
Mt F
lakn
ey G
rani
te
Mur
rum
bidg
ee R
iver
Burkes Creek
K U
Te
rnar
y K
Th U
Th
b)
Slop
e m
aske
d Te
rnar
ySl
ope
mas
ked
K Sl
ope
mas
ked
ThSl
ope
mas
ked
U
Figu
re 1
8 a
) Wag
ga W
agga
100
K a
irbor
ne ra
diom
etri
c dat
a K
Th U
and
as a
Ter
nary
imag
e (RG
B K
Th U
) di
spla
yed
with
a h
istog
ram
equa
lisat
ion
stre
tch
b)
K Th
U T
erna
ry im
age m
aske
d fo
r slo
pes gt
10
disp
laye
d w
ith a
2
line
ar h
istog
ram
stre
tch
Geo
logi
cal f
eatu
res d
iscus
sed
in te
xt a
re ci
rcle
d
17 Quarterly Notes
0 10 20 km
c) d)
a) b)
Bulloc Bulloc Range DuOu
Mt Flakney Granite (Sgf)
Figure 19 Apparent trends in the ASTER ferric oxide content (from Figure 13a) are shown as red dashed lines a) TMI 1VD (greyscale) overlain with ASTER ferric oxide content b) TMI 1VD (greyscale) overlain with K Th U Ternary RGB imagery (Red K Green Th Blue U) c) RTP TMI (greyscale) over tilt-filtered RTP TMI (pseudocolour) d) Sun-shaded SRTM DEM (greyscale) overlain with tilt-filtered TMI (pseudocolour)
Bulloc Bulloc Range DuOu
Mt Flakney Granite (Sgf)
Bulloc Bulloc Range DuOu
Mt Flakney Granite (Sgf)
2014_04_0100
Filtered aeromagnetic data for the Wagga Wagga 100K map sheet area were used in an effort to extract structural information and also to highlight near-surface trends of iron-bearing unitsmagnetite and possible correlations with the ASTER map products ASTERrsquos ferric oxide content showed some trends albeit revealed within exposed paddocks (Figure 13a) that showed northwest-trending and some possible northeast-trending features that correlated approximately with First Vertical Derivative (1VD) TMI lineaments (Figure 19a) The VNIR spectral signature of magnetite is essentially aspectral and not likely to be revealed by the ASTER Ferric Oxide Content product directly However weathering of magnetite-bearing rocks may possibly be associated with increased ferric iron oxide minerals within soils exposed here Integrating radiometric ternary imagery over TMI 1VD (Figure 19b) reveals similar northwest trends as Figure 19a In addition Figure 19b reveals a
complex series of north-northwest-trending lineaments along the western boundary of the K-rich Mount Flakney Granite and northwest-trending lineaments east of the sheared Bulloc Bulloc Range Devonian and Ordovician units RTP TMI over tilt-filtered Reduced to the Pole (RTP) TMI (Figure 19c) highlighted several lineaments with some corresponding to those interpreted with ASTER ferric oxide and radiometric data (Figure 19a b) The integration of tilt-filtered TMI over sun-shaded SRTM DEM (Figure 19d) also revealed some correlation of northndashnorth-northwest and cross-cutting north-northeast lineaments with topographic relief and valleys (Figure 5a) related to either outcropping geological units or possible structural and tectonic movements The tilt-filtered TMI within this Wagga 100K area appears to reveal increased high-frequency features and anomalies useful for detailed interpretation
REFERENCE
Highway
Major road
Watercourse
Lake or swamp
Cza
Czg
Du
Svu
Sgb
Sgr
Ou
Alluvium
Gravelly siltstone colluvium
Buchargingah granite
Burrandana granite
Sandstone minor conglomerate siltstone
Quartzndashfeldspar phyric felsic volcanics
Siltstone shale phyllite minor schist quartzite
CE
NO
ZOIC
DE
VO
NIA
NS
ILU
RIA
NO
RD
OV
ICIA
N
2014_04_0101
Yerong
Burkes
Creek
Cree
k
Creek
Stony
Watt
le
Creek
Hig
hway
Oly
mpi
c
The Rock
YerongCreek
A
B
147deg00rsquoE
147deg00rsquoE 147deg14rsquoE
147deg14rsquoE
35deg12rsquoS 35deg12rsquoS
35deg24rsquoS 35deg24rsquoS
0 5 10 km
Yerong
Burkes
Creek
Cree
k
Creek
Stony
Watt
le
Creek
Hig
hway
Oly
mpi
c The Rock
Yerong Creek
A
B
147deg00rsquoE
147deg00rsquoE 147deg14rsquoE
147deg14rsquoE
35deg12rsquoS 35deg12rsquoS
35deg24rsquoS 35deg24rsquoS
0 5 10 km
REFERENCE
Cza
Czg
Alluvium
Gravelly siltstone colluvium
Du Sandstone minor conglomerate siltstone
Svu Quartzndashfeldspar phyric felsic volcanics
Buchargingah granite
Burrandana granite
Ou Siltstone shale phyllite minor schist quartzite
Highway
Major road
Watercourse
Lake or swamp
Sgb
Sgr
2014_04_0101
Figure 20 Location of The Rock Hill (A) and Flowerpot Hill (B) on part of the Wagga Wagga 100K geological map (Raymond 1993)
a) b) O
RD
OV
ICIA
N
SIL
UR
IAN
DE
VO
NIA
NC
EN
OZO
IC
c) d)
NA
NA
NA
NA
NA NAWG16
WG17 WG18
WG23
WG26
WG19
Mag Low-Demagnetisation (removal of iron via metasomatic fluid alteration)
Axis Axis
Mag Low Radiometrics ternary RGB K Th U
Radiometrics Potassium (Histogram equalised)
O 10km
2014_04_0102
Figure 21 The Rock Hill and Flowerpot Hill area of Figure 20 (approx) a) ASTER false colour b) RTP TMI over Tilt-filtered TMI c) Radiometrics Ternary (RGB K Th U) d) Radiometrics K (blue low red high) Major lineaments magnetic low and fold structure are shown NA = site not sampled in study
18 May 2014
b)REFERENCE
Waypoint site
Highway
Major road
Watercourse
Lake or swamp
Cza
Czg
Du
Svu
Sgb
Sgr
Ou
Alluvium
Gravelly siltstone colluvium
Buchargingah granite
Burrandana granite
Sandstone minor conglomerate siltstone
Quartzndashfeldspar phyric felsic volcanics
Siltstone shale phyllite minor schist quartzite
CE
NO
ZOIC
DE
VO
NIA
NS
ILU
RIA
NO
RD
OV
ICIA
N
2014_04_0103a
Yerong
Burke
s
Creek
Cree
k
Creek
Stony
Watt
le
Creek
Hig
hway
Oly
mpi
c
The Rock
YerongCreek
WP66WP63
WP37
WP56
WP57
WP50
WP35WP62
WP38
WP49
WP36
WP47
35deg23rsquoS147deg00rsquoE
147deg00rsquoE 147deg14rsquoE
35deg23rsquoS147deg14rsquoE
35deg14rsquoS35deg14rsquoS
0 5 10 km
Quarterly Notes
a) REFERENCE
Cza
Czg
Alluvium
Gravelly siltstone colluvium
CE
NO
ZOIC
Sandstone minor conglomerate siltstone
Mag Low ASTER AIOH content 35deg14rsquoS 35deg14rsquoS
35deg23rsquoS 35deg23rsquoS 147deg00rsquoE
147deg00rsquoE 147deg14rsquoE
147deg14rsquoE
2014_04_0103b
Yerong
Burke
s
Creek
Cree
k
Creek
Stony
Watt
le
Creek
Hig
hway
Oly
mpi
c
The Rock
Yerong Creek
WP66 WP63
WP37
WP56
WP57
WP50
WP35 WP62
WP38
WP49
WP36
WP47
35deg23rsquoS 147deg00rsquoE
147deg00rsquoE 147deg14rsquoE
35deg23rsquoS 147deg14rsquoE
35deg14rsquoS35deg14rsquoS
0 5 10 km
b)
c)
Du
Svu
Sgb
Sgr
Ou Siltstone shale phyllite minor schist quartzite
Waypoint site
Highway
Major road
Watercourse
Lake or swamp 2014_04_0103a
The Rock Hill and Flowerpot Hill Devonian and Ordovician metasedimentary units in the central western part of the Wagga Wagga 100K map sheet area (Figure 20) provided a useful target and potentially prospective area to closely examine ASTER and geophysical mapping issues and opportunities for data integration The ASTER false colour product highlights the elevated Bulloc Bulloc Range including The Rock and Flowerpot Hill surrounded by farm paddocks and cultivation (Figure 21a) The geophysics highlights some interesting lineaments a fold structure and a magnetic low (Figures 21bndashd) In particular the tilt-filtered TMI data shows a prominent pair of north-northwestndashsouth-southeast lineaments (Figure 21b) approximately parallel to the apparent hinge linefold axis of the DevonianOrdovician metasedimentary rocks (Figure 21c d) and also bounding a likely deep-seated magnetic low (Figure 21b) Ternary and K radiometric anomalies appear to cross-cut the
OR
DO
VIC
IAN
S
ILU
RIA
ND
EV
ON
IAN
Quartzndashfeldspar phyric felsic volcanics
Buchargingah granite
Burrandana granite
ASTER silica index 35deg14rsquoS
35deg23rsquoS 35deg23rsquoS 147deg00rsquoE
147deg00rsquoE 147deg14rsquoE
147deg14rsquoE
35deg14rsquoS
0 5 10 km
2014_04_0103c
Devonian and Ordovician stratigraphy when they are overlain on the geology map (Figure 22a) A modified version of the ASTER AlOH content map masked for both SRTM-derived slopes greater than 10 and less than 45 Landsat-derived photosynthetic (PV or lsquogreenrsquo) vegetation fraction cover appears to highlight some increase in mica content in the main hinge line axis (red areas Figure 22b) Figure 22b was also displayed using histogram equalisation using thresholds described by Cudahy (2012) The silica index product with a histogram equalisation stretch also appears to highlight some increase in silica along the axis (Figure 22c) Field observations of increased quartz and ASD spectral measurements identifying AlOH minerals phengite and kaolinite (Figure 23) appear to confirm this interpretation Hematite is also common within The Rock Hill and Flowerpot Hill area
Figure 22 The Rock Hill and Flowerpot Hill a) Wagga Wagga 100K geological map with geophysical features from Figure 21 b) ASTER AlOH masked for gt10 slope and lt45 PV Landsat fraction histogram equalised Mica anomaly is circled c) ASTER silica index histogram equalised Silica anomaly is circled Purpleblue low to red high content
19
Ref
lect
ance
050
040
030
020
010
000
wg26r_bw00000
wg23r_bw00001
Hematite signature (860 nm) Al poor mica or Phengite (eg 2209 nm absorption)
400 900 1400 1900 2400
Wavelength (nm) 2014_04_0104
Figure 23 Example ASD spectral signature of rock outcrop samples (WG23 26 ndash see Figure 21a) at Flowerpot Hill showing Al-poor micaAlOH and hematite diagnostic features
ASTER data issues and qualifications on interpretation Acquisition of ASTER satellite imagery at about 1030 am (Australian Eastern Daylight Time) can potentially produce sharp shadows on steep westerly slopes within high relief areas The ASTER satellite sensor has an additional issue of potential false anomalies from the lsquocrosstalkrsquo mis-calibration of its shortwave IR sensor (bands 5ndash9) as used for the generation of AlOH or micaclay mineral maps Dark shaded areas appear on the western slopes of The Rock and Flowerpot Hill as a result of north- and northwest-trending ridgelines as shown in the sun-shaded DEM imagery generated to simulate illumination conditions on 1112001 at 1030 am (blue ellipses Figure 24a) These areas of deep shadow appear to be coincident with some of the AlOH anomalies (red ellipse Figure 22b) and potentially the result of false anomalies associated with crosstalk
0 4km a)
WP 62 WP 35
WP 36 WP 37
WP 33
WP 38
WP 65
WP 66
WP 58
WP 45
SRTM DEM sun shaded (el 60˚ Az 72˚)
b)
(Figure 24b) However areas of full illumination on the northeast slopes also show AlOH anomalies and the crosstalk explanation does not entirely negate the AlOH presence Overall these results suggest that residual crosstalk effects are a possibility within dark areas of shadow and vegetation cover and bitumen (eg the Wagga AirfieldRAAF base) The validation of ASTER study sites can be assisted with the aid of DEMs fractional cover information field observations and ideally a VNIRndashSWIR spectrometer
ASTER AIOH mica content (hist eq) masked for 45 lt green vegetationgt 10 slope
Figure 24 a) Sun-shaded SRTM 80 m DEM of The Rock Hill and Flowerpot Hill (60deg elevation 072deg azimuth) simulating illumination conditions and shaded relief during ASTER image acquisition (1112001) b) ASTER AlOH content and corresponding areas of shaded relief (dashed ellipses)
Figure 25 The Rock Reserve WP62 a) Casuarina open woodland b) ferruginous gravel with lichen and moss ground cover c) typical canopy cover
20 May 2014
Quarterly Notes
a) b) c)
WP62
WP35
WP36 WP37
WP38WP40 WP39
WP58
WP65 WP63
WP66
WP62
WP35
WP36 WP37
WP38WP40 WP39
WP58
WP65 WP63
WP66
WP62
WP35
WP36 WP37
WP38WP40 WP39
WP58
WP65 WP63
WP66
0 20 40 60 80 100 0 20 40 60 80 100 0 20 40 60 80
non-photosynthetic Bare ground photosynthetic
4km 2014_04_01060
Figure 26 a) ndash c) Landsat fractional cover estimates for The Rock Hill mdash the same area as in Figure 24
Field observations and ASD in-situ field measurements of gravel lag vegetation ground litter etc at Waypoint WP62 (Figure 22a 24a) were undertaken near The Rock (Figure 25andashc) AusCover fractional cover estimates using Landsat acquired 1012001 one day before the ASTER gave values of 18 bare ground 41 photosynthetic and 40 non-photosynthetic vegetation cover for supplied 30m pixels encompassing WP62 Fractional cover imagery for the Bulloc Bulloc RangeThe Rock shows that the cover is dominated by photosynthetic and to a lesser extent non-photosynthetic vegetation (Figures 26andashc) ASD in-situ field measurements of gravel lag vegetation and ground litter at WP62 were processed to simulate ASTER ferric oxide content and green vegetation indices (Figure 27) This limited series of measurements suggested that the presence of dry vegetation matter (eg lichen bark leaf litter) can hinder the ASTER interpretation of ferric iron (eg hematite goethite) useful for regolith profile information andor alteration involving hematisation (Figure 27) Simulated values for ASTERrsquos AlOH content index from W62 gravel
The Rock Hill - Waypoint 62
Green tree and shrub foliage ground moss Devonian ferruginous sandstone gravel lag Lichen bark and leaf litter
1 3
0
4
2
AST
ER -
Gre
en V
eget
atio
n
ASTER - Ferric Oxide Content
Figure 27 ASD field spectral signatures of vegetation and gravel samples from The Rock Hill (WP 62) resampled and processed into equivalent ASTER map indices for green vegetation and ferric oxide content
lag ASD measurements produced values between 19 and 215 within the threshold range used to generate ASTER AlOH content imagery (Cudahy 2012) This compares favourably with the ASTER AlOH content index value of 20 as an average for 2 x 30 m pixels at WP62 extracted from the map product
Cobar 1100 000 and Canbelego 1100 000 map sheet areas The ASTER map products over the Cobar 1250 000 map sheet area are less affected by agricultural cultivation than the Wagga Wagga area as highlighted by ASTERrsquos false colour showing only approximately 25 under cultivationcropping to the east (Figure 28a) Isolated cloud cover is also apparent in the eastern third of the Cobar 1250 000 map sheet area where the map product is generated from a separate ASTER scene (Figure 28a) ASTERrsquos regolith product is useful for highlighting the extensive ephemeral drainage patterns (Figure 28b) As described by Cudahy (2012) the Regolith product based on the Landsat TM Regolith ratios helps to separate regolith and geological units while vegetated areas are highlighted by whitebright areas and clouds in blue (Figure 28b) ASTERrsquos green vegetation product also shows the limited nature of the green vegetation cover restricted to watercourses outside of the cultivated areas (Figure 28c) The land cover is more explicitly highlighted in the Landsat-derived fractional cover image which shows that close to the time of ASTER acquisition (September 2003) the most exposed bare ground was within the Cobar 100K map sheet area and to a lesser extent Canbelego 100K (reddish areas Figure 28d) Non photosynthetic vegetation (lsquodry vegetationrsquo) still appears pervasive in the non-cultivated areas (blue areas Figure 28d) which may be an issue for some ASTER map products
21
100
c) d)
a) b)
145ordm30E 147ordm00E 145ordm30E 147ordm00E 31ordm00S 31ordm00S
32ordm00S 32ordm00S
145ordm30E 147ordm00E 145ordm30E 147ordm00E
31ordm00S 31ordm00S
32ordm00S 32ordm00S
Figure 28 Cobar 1250K map sheet area a) ASTER false colour Note clouds and shadows in lower right b) ASTER regolith colour coded as for standard CSIRO Landsat Regolith product (Cudahy 2012) c) ASTER green vegetation (blue low red high) d) Landsat fractional cover RGB Red bare ground Green photosynthetic vegetation Blue non-photosynthetic vegetation (linear stretch 0ndash100)
a) b) 145ordm30E 147ordm00E 145ordm30E 147ordm00E
31ordm00S 31ordm00S
32ordm00S32ordm00S
Figure 29 Cobar 1250K map sheet area a) ASTER ferric oxide content (blue low red high) b) ASTER ferric oxide composition (histogram equalised) (blue goethitic red hematitic) c) ASTER AlOH group content (histogram equalised) (blue low red high) Note that cloud cover in eastern 100K maps introduces false anomalies (see Figure 28a)
32ordm00S
31ordm00S
c) 145ordm30E 147ordm00E
31ordm00S
32ordm00S
2014_04_0109
22 May 2014
23 Quarterly Notes
a) b) 145ordm30E 147ordm00E 145ordm30E 147ordm00E
31ordm00S 31ordm00S
32ordm00S 32ordm00S
147ordm00E
31ordm00S 145ordm30E 147ordm00E 145ordm30E
31ordm00S
32ordm00S32ordm00S
Figure 30 a) ASTER AlOH group composition (histogram equalised) (blue Al-rich micawell ordered kaolinite red Al-poor mica) b) ASTER silica index (histogram equalised) (blue low red high) c) Radiometric K (blue low red high) d) Radiometric Th (blue low red high)
c) d)
2014_04_0110
The ASTER Ferric Oxide Content product highlights coherent and continuous spatial distribution across the Cobar 1250 000 sheet area with increased abundance within the Cobar 100K area (Figure 29a) An improved insight into the ferric iron oxide was provided by the ASTERrsquos ferric oxide composition using histogram equalisation (Figure 29b) rather than a Gaussian stretch within the same threshold stretch limits advised by Cudahy (2012) Using the histogram equalised version of the ASTER ferric oxide composition product highlights more clearly an apparent increase in hematitic composition within the western Cobar 250K including the Cobar 100K map sheet area (Figure 29b) The presence of hematite versus goethite may be important for regolith interpretation and understanding of the arearsquos possible lateritic weathering (Huntington et al 1999) However care should also be taken when interpreting ferric oxide content and composition in the presence of dry vegetation matter mdash as observed at The Rock Hill (Figure 27) and also noted by Cudahy (2012) The areas highlighted by ASTER with increased hematite also coincide with increased abundance of AlOH minerals as shown by the histogram equalised version of the ASTER AlOH group content (greenndashyellow areas Figure 29c) The ASTER AlOH group composition product (histogram equalised Figure 30a) highlights extensive
areas of low values (blue) in the western Cobar 250K sheet area including within the Cobar 100K Cudahy (2012) interpreted such low ASTER AlOH composition product values as mapping well-ordered kaolinite or Al-rich white mica These areas also appear to coincide with the interpreted hematite-rich areas shown in Figure 29b (red areas) If a lateritic profile mineral model (Huntington et al 1999) is assumed then questions arise whether these areas lie within the highly weathered hematite-bearing duricrust or less-weathered ordered kaolinite-bearing saprolite The ASTER kaolin group index product for Cobar 250K sheet area does not indicate significant anomalies using linear or histogram equalised versions Cobar regolith landform mapping indicates much of the Cobar 100K area is highly weathered in situ bedrock (Gibson 1999) However validation field work involving sampling and ASD measurements should clarify these issues The ASTER silica index product does appear to indicate high silica content along the western boundary of the Cobar 100K sheet area that coincides with elevated areas mapped by Gibson (1999) containing cappings of silicified sedimentary units (histogram equalised Figure 30b) Geophysical radiometric products K and Th also highlight distinctive units with the Cobar 100K and Canbelego 100K map sheet areas (Figures 30c d) The K and Th images mostly appear to map in an approximate complementary way areas of alluvial
a)
147ordm00E 31ordm00S
145ordm30E
32ordm00S
b) 145ordm30E 147ordm00E
31ordm00S
32ordm00S
Figure 31 a) RGB composite ASTERrsquos AlOH content (histogram equalised) ferric oxide content silica index (histogram equalised) b) RGB composite K ASTERrsquos ferric oxide content AlOH content over shaded DEM
(eg K) and in situ regolith units (eg Th) (Figures 30c d) In particular the drainage areas appear rich in apparently K-bearing clays (Figure 30c) whilst the Th occurs where there are non-drainage in situ relict areas (Figure 30c) possibly related to ferricrete Further ground truthing would help this interpretation An RGB composite image of ASTERrsquos AlOH group content ferric oxide content and silica index products appeared to discriminate generally elevated combined clay- and quartz-rich units (eg red+blue areas shown as purple) from ferric iron oxide minerals (green) within some drainage areas (Figure 31a) A RGB composite image of the radioelement K ASTER ferric oxide content and ASTER AlOH group content products also generated significant and complex spatially coherent patterns particularly within the Cobar and Canbelego 100K sheet areas that appear worthy of further examination for regolith information (Figure 31b)
2014_04_0111
Conclusions This project demonstrated within the NSW study areas of Wagga Wagga and Cobar the usefulness of the recently released Australia ASTER map products supplied by CSIROGA for identifying or discriminating variations in surface composition The map products included mineral identitiesgroups within geological units possible overprinted alteration andor weathered regolith These map products can potentially aid mineral exploration in NSW within semi-arid areas such as Cobar and to a lesser extent within open woodland and cultivated environments such as Wagga Wagga Although several ASTER map products provided useful information as individual entities their application generally benefits exploration when integrated with geophysical topographical and fractional land cover information In particular DEM-derived slope information and vegetation fractional data were used to mask and refine ASTER map products in the Wagga area within the temperate and vegetated Riverine Plains Anomalous AlOH- and silica-rich areas were discriminated and associated with radiometric and high frequency filtered TMI-inferred structures in the vicinity of the Bulloc Bulloc Range especially at The Rock Hill ASTER Ferric Iron Content product within the Wagga Wagga area also appeared to show northwest lineament trends similar to those highlighted by filtered TMI products Map generation for the Murrumbidgee floodplains using radiometric data also appeared to benefit from topographic slope masking to exclude areas of alluvial and aeolian transported cover More spatially coherent anomalous areas particularly related to the regolith were identified by the ASTER map products in the semi-arid and rangeland terrain of Cobar The application of different histogram stretches such as histogram equalisation was found to further enhance the display of anomalous features mdash although care should be applied regarding data thresholds The application of the ASTER map products individually as RGB composites or integrated with radiometric data appears useful for regolith mapping and identifying weathering profile-related mineralogy at Cobar Effects of residual ASTER crosstalk mis-calibration within areas of shadowdark surfacesdense vegetation and possible interpretation ambiguities between VNIR-derived ferric oxide and dry vegetation highlight the importance of validation fieldwork to check anomalous areas and their spectral signatures The validation of ASTER study sites may be assisted by DEM and fractional cover information Further investigations into the benefits of integrating artificially illuminated shaded topographic relief and AusCover fractional land cover information relevant for ASTER acquisition dates are recommended
24 May 2014
25 Quarterly Notes
Acknowledgements This study has been supported and funded by the Geological Survey of New South Wales in part for the purpose of contributing to the knowledge of the Wagga Wagga 1100 000 map sheet geology for mineral exploration Geophysical and associated data for the Wagga Wagga and Cobar study areas were received from the Geological Survey of New South Wales ASTER GeoTIFFs and BSQ ASTER map products were also gratefully obtained from Geoscience Australia and CSIROndashEarth Science amp Resource Engineering whilst the original ASTER imagery was made available by NASA and METI GIS shapefiles for the Wagga Wagga and Cobar 1250 000 map sheet areas were also gratefully obtained from Geoscience Australia Assistance is also gratefully acknowledged from Thomas Cuday and Carsten Laukamp of CSIRO and Matilda Thomas of Geoscience Australia Support from Professor Simon Jones and Laurie Buxton of RMIT University was also helpful during this study
References Caccetta M Collings S amp Cudahy C 2013 A calibration methodology for continental scale mapping using ASTER imagery Remote Sensing of Environment 139 306ndash317
Chan RA Greene RSB de Souza Kovacs N Maly BER McQueen KG amp Scott KM 2003 Regolith geomorphology geochemistry and mineralisation of the SussexndashCoolabah area in the CobarndashGirilambone region North-Western Lachlan Foldbelt NSW CRC LEME openfile report 148 NSW DMR Report GS2001319
Chen XY 1997 Quaternary sedimentation parna landforms and soil landscapes of the Wagga Wagga 1100 000 map sheet south-eastern Australia Australian Journal of Soil Research 35(3) 643ndash668
Chen XY amp McKane DJ 1997 Soil Landscapes of the Wagga Wagga 100K Sheet map and report Department of Land and Water Conservation Sydney
Clark RN King TVV Klejwa M Swayze GA amp Vergo N 1990 High spectral resolution reflectance spectroscopy of minerals Journal of Geophysical Research 95(B8) 12653ndash12680
Cudahy TJ 1997 PIMA-II spectral characteristics of natural kaolins CSIRO Exploration and Mining Report 420R 57 pp
Cudahy TJ 2012 Satellite ASTER Geoscience Product Notes for Australia Version 1 7th August 2012 CSIRO ePublish No EP-30-07-12-44
Downes PM McEvilly R amp Raphael NM 2004 Mineral deposits and models Cootamundra 1250 000 map sheet area Quarterly Notes of the Geological Survey of New South Wales 116 1ndash38
Downes PM amp Seccombe PK 2008 Sulfur isotope signatures for orogenic gold deposits Lachlan Orogen New South Wales In Proceedings of PACRIM Congress 24ndash26 November 2008 AusIMM Gold Coast Queensland Australia
Duke EF 1994 Near infrared spectra of muscovite Tschermak substitution and metamorphic reaction process implications for remote sensing Geology 22 621ndash624
Gibson DL 1999 Explanatory notes for the 1500 000 Cobar regolith landform map CRC LEME Geological Survey of NSW Open File Report 76
Grove CI Hook SJ amp Paylor ED III 1992 Laboratory reflectance spectra of 160 minerals 04 to 25 micrometers NASA Jet Propulsion Laboratory report JPL Publication 92-2
Hewson R 2013 Using ASTER and geophysical mapping to assist exploration over Wagga Wagga 1100 000 sheet area Geological Survey of New South Wales File GS20131558
Hewson RD amp Cudahy TJ 2011 Issues Affecting Geological Mapping with ASTER Data A Case Study of the Mt Fitton Area South Australia In Ramachandran B Justice CO amp Abrahams MJ (eds) Land Remote Sensing and Global Environmental Change NASArsquos Earth Observing System and the Science of ASTER and MODIS Applications in ASTER pp 273ndash300 Springer-Verlag New York
Hewson RD Cudahy TJ Drake-Brockman J Meyers J amp Hashemi A 2006 Mapping geology associated with manganese mineralization using spectral sensing techniques at Woodie Woodie East Pilbara Exploration Geophysics 37 389ndash400
Hewson RD Cudahy TJ amp Huntington JF 2001 Geologic and alteration mapping at Mt Fitton South Australia using ASTER satellite-borne data In Geoscience and Remote Sensing Symposium 2001 IGARSS lsquo01 IEEE 2001 International vol2 724ndash726
Hewson RD Cudahy TJ Mizuhiko S Ueda K amp Mauger AJ 2005 Seamless geological map generation using ASTER in the Broken HillndashCurnamona Province of Australia Remote Sensing of Environment 99(1ndash2) 159ndash172
Hewson RD Mah A Dunne M amp Cudahy TJ 2003 Mapping mineralogical and structural relationships with satellite-borne ASTER and airborne geophysics at Broken Hill ASEG 16th Geophysical Conference and Exhibition Adelaide February 2003 Australian Society Exploration Geophysicists
Hewson R Robson D Mauger A Cudahy T Thomas M amp Jones S 2013 Extracting mineralogical and geomorphological information using new ASTER mineral maps with airborne geophysics Proceedings of the ASEGndashPESA 2013 23rd International Geophysical Conference and Exhibition 11ndash14 August 2013 Melbourne Australia
Hunt GR amp Ashley RP 1979 Spectra of altered rocks in the visible and near infrared Economic Geology 74 1613ndash1629
Huntington JF Cudahy TJ Yang K Scott KM Mason P Gray DJ Berman M Bischof L Reston M S Mauger AJ Keeling JL amp Phillips RN 1999 Mineral mapping with field spectroscopy for exploration ndash final report CSIROAMIRA Project P435 CSIRO Exploration and Mining Report 419R
Iwasaki A Fujisada H Akao H Shindou O amp Akagi S 2001 Enhancement of spectral separation performance for ASTERSWIR Proceedings of SPIE (International Society for Optical Engineering) 4486 42ndash50
Iwasaki A amp Tonooka H 2005 Validation of a crosstalk correction algorithm for ASTERSWIR IEEE Transactions on Geoscience and Remote Sensing 43(12) 2747ndash2751
Laukamp C Cudahy C Caccetta M Thomas M Close D amp Lennartz R 2013 Successful mineral exploration using multispectral remote sensing data ndash ASTER Geoscience Map of Australia In Proceedings 12th Biennial Meeting of the Society of Geology Applied to Mineral Deposits (SGA) Uppsala Sweden 12ndash15 August 2013
Lewis P amp Downes PM 2008 Mineral systems and processes in New South Wales a project to enhance understanding and assist exploration Quarterly Notes of the Geological Survey of New South Wales 128
McQueen KG 2008 A guide for mineral exploration through the regolith in the Cobar Region Lachlan Orogen New South Wales Cooperative Research Centre for Landscape Environments and Mineral Exploration
Michael S 2012 Satellite imagery the range and value CSIRO Publishing for Australian Society for Exploration Geophysicists Preview 2012(160) 20ndash25
Raymond O 1993 Wagga WaggandashKyeamba region geological map 1100 000 Australian Geological Survey Organisation Canberra
Ricchetti E 2000 Multispectral satellite image and ancillary data integration for geological classification Photogrammetric Engineering amp Remote Sensing 66(4) 429ndash435
Rowan LC amp Mars JC 2003 Lithologic mapping in the Mountain Pass California area using Advanced Spaceborne Thermal Emission and Reflection Radiometer (ASTER) data Remote Sensing of Environment 84 350ndash366
Salisbury JW amp DrsquoAria DM 1992 Emissivity of terrestrial materials in the 8ndash14 μm atmospheric window Remote Sensing of Environment 42 83ndash106
Scarth P Roumlder A amp Schmidt M 2010 Tracking grazing pressure and climate interaction ndash the role of Landsat fractional cover in time series analysis In Proceedings of the 15th Australasian Remote Sensing and Photogrammetry Conference (ARSPC) 13ndash17 September Alice Springs Australia
Sherman DM 1985 The electronic structures of Fe3+ coordination sites in iron oxides application to spectra bonding and magnetism Physics and Chemistry of Minerals 12 161ndash175
Vincent RK amp Thomson F 1972 Spectral compositional imaging of silicate rocks Journal of Geophysical Research 77(14) 2465ndash2472
Yamaguchi Y Fujisada H Kahle A Tsu H Kato M Watanabe H Sato I amp Kudoh M 2001 ASTER instrument performance operation status and application to earth sciences In Geoscience and Remote Sensing Symposium 2001 IGARSS lsquo01 IEEE 2001 International vol3 1215ndash1216
26 May 2014
ShippingCONTACT Please note that we cannot ship to PO boxes
Product Order Form All prices are in Australian dollars and include Goods and Services Tax at 10 unless otherwise noted Only Australian orders are subject to the GST and all international orders will be processed exclusive of GST All totals will be billed in Australian Dollars International customers will be charged the equivalent of this rate in their respective currencies at the time the bank processes the transaction
Credit card surcharge MasterCard 04 Visa 04 AMEX 15 Diners Club 24 Other payment (NA)
Subtotal (excl GST for internationals)
TOTAL
Be sure to select international postage above if you are an overseas customer
Item Quantity Line Total Price (incl GST)
International $45 (excl GST) Postage Domestic $8 (1-2 items) $10 (3-5 items) $12 (5+ items) Express $13
o f f i c e
U S E
o n l y
FULL NAME JOB TITLE
ORGANISATION STREET ADDRESS
CITY STATE POSTCODE COUNTRY
PHONE EMAIL
CARD NUMBER NAME ON CARD
CARDHOLDER SIGNATURE DATE EXPIRY SECURITY CODE
We accept payment by credit card cheque or money order (made payable to NSW Department of Trade amp Investment) Payment
Return
Did you know Selected products can be purchased from the NSW Government Online Shop wwwshopnswgovau
Information and Customer Service Centre NSW Department of Trade amp Investment PO Box 344 Hunter Region Mail Centre NSW 2310
mineralpublicationordersindustrynswgovau
+61 2 4931 6700 Enquiries +61 2 4931 6666
wwwresourcesnswgovau
NSW Trade amp Investment Division of Resources amp Energy 516 High Street Maitland NSW 2320 PO Box 344 Hunter Region Mail Centre NSW 2310 T1300 736 122 T (02) 49316666
wwwresourcesnswgovau
Second edition Bathurst metallogenic 1250 000 map
Replacing the popular 1972 edition the updated map shows 311 metallic industrial construction material and fuel deposits classified by size commodity and deposit type A deposit classification scheme is included along with a timendashspace plot showing major mineralising events
On the back of the map is a comprehensive poster summarising the mining history and geological history of the area It features many colourful and historic images a locality map and a mining timeline
Cost $1980
- _GoBack
- 141726f49c7572d0__MailEndCompose
-
-
Contents Abstract 1
Introduction 2
ASTER Multispectral Satellite Sensor 2
Mineral detection using ASTER 3
Past ASTER case studies 3
CSIROndashGA Australian ASTER geoscience map products 4
Case study areas mdash environment and geology 5
ASTER coverage of NSW 5
Wagga Wagga 1100 000 map sheet area 6
Cobar 1250 000 map sheet area 6
Datasets and methodologies 7
ASTER 7
Airborne geophysics 7
Digital elevation models (DEMs) 7
Auscover fractional landcover 8
Data integration strategies 9
Field studies and sample spectroscopy 9
ASTER validation study 10
Results 12
Wagga Wagga 1100 000 map sheet area 12
Cobar 1100 000 and Canbelego 1100 000 map sheet areas 21
Conclusions 24
Acknowledgements 25
References 25
Technical editing Richard Facer
Production co ordination Simone Meakin and general editing and Geneve Cox
Geospatial information Kate Holdsworth and Nicole Edwards
Layout Nicole Edwards
Photographs Robert Hewson
Cover image View southwards from the summit of The Rock Nature Reserve near Wagga Wagga
Disclaimer The information (and links) contained in this publication is based on knowledge and understanding at the time of writing (February 2014) However because of advances in knowledge users are reminded of the need to ensure that the information upon which they rely is up to date and to check the currency of the information with the appropriate officer of the Department of Trade and Investment Regional Infrastructure and Services or the userrsquos independent adviser The product trade names in this publication are supplied on the understanding that no preference between equivalent products is intended and that the inclusion of a product name does not imply endorsement by the department over any equivalent product from another manufacturer
Copyright copy State of New South Wales through Department of Trade and Investment Regional Infrastructure and Services 2014 You may copy distribute and otherwise freely deal with this publication for any purpose provided that you attribute the Department of Trade and Investment Regional Infrastructure and Services as the owner
Introduction In August 2012 a series of 17 compositional Australia-wide map products was released by the Commonwealth Scientific Industrial Research Organisation (CSIRO) and Geoscience Australia (GA) from imagery obtained by the multispectral satellite sensor Advanced Spaceborne Thermal Emission Reflectance Radiometer (ASTER) (Cudahy 2012) This followed many successful years of data acquisition by ASTER following its development by Japanrsquos Ministry of Economy Trade and Industry (METI) and launch by National Aeronautics and Space Administration (NASA) (Yamaguchi et al 2001) These compositional maps offer the opportunity of new lsquoeyesrsquo for regional geological mapping within Australia to assist exploration activities This particular study aims to examine and compare the application of the Australian ASTER map products within two different environments of New South Wales (NSW) encompassing the temperate and cultivated Wagga Wagga 1100 000 (100K) and semi-arid Cobar 1250 000 (250K) map sheet areas Wagga Wagga was examined in particular in conjunction with traditional airborne magnetic radiometric and digital elevation model (DEM) datasets acquired by the Geological Survey of New South Wales (GSNSW) An overall objective was to examine the robustness of geoscience mapping capabilities of ASTER as individual map products and via data integration within different environments of NSW This study also follows the previous presentation at the 2013 Australian Society of Exploration Geophysicists conference (Hewson et al 2013) A more detailed description of this study is found in Hewson (2013)
ASTER multispectral satellite sensor ASTER acquires imagery within a 60 km x 60 km scene area from 14 different spectral bands with a pixel resolution of between 15 m and 90 m depending on whether they were generated by the VisiblendashNear Infrared (VNIR) Shortwave Infrared (SWIR) or Thermal Infrared (TIR) sensors (Yamaguchi et al 2001) ASTER tracks a similar Earth orbit and altitude to the older Landsat TM satellites with similar VNIR bands (minus band 1) but with five additional SWIR bands providing higher spectral resolution than Landsat TMrsquos band 7 (Figure 1) ASTER also measures radiance using five bands within the TIR wavelength region (8ndash12 microm) (Figure 1) providing the first access to civilian multispectral TIR data at moderate spatial resolution (90 m)
2 May 2014
3 Quarterly Notes
Figure 1 Typical reflectance and emissivity signatures and their comparison with ASTER and Landsat TM spectral bands (eg bands lsquobxrsquo) Note 1 microm equiv 1000 nm
The additional bands of ASTER compared with Landsat provide an improved capability to discriminate and potentially identify the surface vegetation and rocksoil composition An overview of and comparison between the characteristics of ASTER Landsat and other current satellite sensors were described by Michael (2012) In particular the additional ASTER SWIR bands can detect the clay mineral absorption signature (eg sandstone in Figure 1) separately from carbonate absorption signature (eg limestone in Figure 1) ASTERrsquos TIR bands can also discriminate quartz and silica-bearing rocks (eg sandstone soil in Figure 1) by their absorption features in the 8ndash10 microm range The ability of ASTERrsquos VNIR SWIR and TIR 14-band multispectral sensor to detect diagnostic absorption signatures of mineral (groups) is determined by its spectral resolution (ie bandwidth) specific wavelengths measured (Figure 1) and also its ground spatial resolution These sensor characteristics determine its sensitivity to discriminate different surface components in order to uniquely identify mineral composition within a single digital measurement (eg pixel)
Mineral detection using ASTER The use of ASTER satellite data products follows several decades of laboratory-based spectroscopy within the VNIR SWIR and TIR wavelength regions for the measurement of minerals and mineral groups (Vincent amp Thomson 1972 Hunt amp Ashley 1979) In particular the ferric oxide group (eg hematite and goethite) OH-bearing minerals (eg clays micas amphiboles) and other silicates have been shown to display diagnostic signatures within the VNIR SWIR
and TIR wavelength regions respectively (Sherman 1985 Clark et al 1990 Grove et al 1992 Salisbury amp DrsquoAria 1992) Such spectral signatures exhibit absorption features whose depth in reflectance values (or emissivity within the TIR) can be approximately related to abundance or content of that mineral Some mineral signatures (eg mica) also demonstrate shifts in the wavelength of their absorption reflectance minima (~2200 nm) associated with compositional chemistry changes Such inferred compositional changes of mica can be relevant for the interpretation of their possible metamorphic or alteration history (Duke 1994) The effect of the ASTER sensor spectral resolution on its ability to detect and discriminate different minerals within common rock units and soils can be demonstrated by re-sampling laboratory-measured mineral signatures into equivalent 14-band ASTER signatures (Hewson 2013) Overall ASTERrsquos VNIR and SWIR sensors show themselves capable of discriminating between broad mineral groups such as ferric iron oxide AlOH and MgOHcarbonate In addition ASTERrsquos five TIR bands are capable of discriminating varieties of quartz and broad silicate groups
Past ASTER case studies There have been several successful geological mapping case studies undertaken using ASTER since its launch in 1999 Studies within the semi-arid terrain of Mount Fitton in the northern Flinders Ranges of South Australia demonstrated the ability of ASTER to discriminate the minerals associated with the major
lithological units and also areas of hydrothermal alteration (Hewson et al 2001) Rowan and Mars (2003) also showed that lithological mapping was feasible in areas of good exposure Hewson et al (2005) using Broken Hill NSW data successfully applied simply devised spectral indices (eg band ratios) using ASTER radiance imagery to map mineralogy A more detailed explanation was offered in GS20131558 (Hewson 2013) This approach is the basis for many of the CSIRO and Geoscience Australian ASTER Geoscience Map Products (Cudahy 2012) Some limitations to using the ASTER SWIR bands for mineral (group) mapping have been present in past case studies due to the crosstalk issue where stray light from band 4 lsquoleaksrsquo as an additive noise signal into bands 5 and 9 (Iwasaki et al 2001) An algorithm and software were implemented to correct for this miscalibration issue (Iwasaki amp Tonooka 2005) However in areas of low ground reflectance (eg shadow thick vegetation dark surfaces) residual crosstalk effect is apparent and can lead to lsquofalse anomaliesrsquo using spectral band indices (Hewson et al 2005 Hewson amp Cudahy 2011) Early ASTER case studies also showed the usefulness of integrating processed ASTER map products with airborne geophysical data such as radiometric (Hewson et al 2003) In particular sericitemica can be discriminated within ASTER map products generated for the AlOH mineral group using potassium radiometric data at Broken Hill (Hewson et al 2003) Integrating Landsat TM (Ricchetti 2000) and ASTER imagery (Hewson et al 2006) with Digital Elevation Model (DEM) information has also improved the classification and interpretation of the geomorphology and geology In particular ASTER-interpreted quartz mineral occurrences related to transported sandy alluvial cover can be easily discriminated from silicified rock outcrops with slope and shaded DEM products (Hewson et al 2006) Since the launch of the Australian CSIROndashGA Australian ASTER Geoscience Map products Laukamp et al (2013) recently demonstrated its application for mineral exploration in the Jervois Block arid environment of central Northern Territory Further studies also showed their ability to map both lithological units and areas of hydrothermal alteration within the semi-arid Mount Fitton area of the northern Flinders Ranges (Hewson et al 2013)
CSIROndashGA Australian ASTER geoscience map products The Australian ASTER products released by CSIRO and GA provided the first continent-wide mosaic of satellite-derived mineral mapping (Cudahy 2012 Caccetta et al 2013) Prior to the generation of such Australian continental scale compositional maps isolated and independent industry and government agency projects provided useful albeit sometimes haphazard application of ASTER for limited Australian areas using variable methodologies and reference standards The mosaicing of thousands of Australian ASTER radiance scenes were calibrated using many hyperspectral satellite reflectance reference surveys in conjunction with illumination and atmosphere-based gain and offset corrections (Cudahy 2012 Caccetta et al 2013) This calibration of ASTER imagery using reflectance reference areas attempted to reduce the effects of crosstalk variable illumination and ground cover conditions (Caccetta et al 2013) Subsequent processing into band (ratio) parameters targeting composition-related spectral absorption features provided a generally reliable approach for generating map products across Australia (Caccetta et al 2013 Cudahy 2012) The values produced by these band parameter ratio products provided a unitless and relative estimate of abundance or indicator of composition depending on the nature of the described product Masking of resulting band parameter products was performed to exclude areas of cloud cover deep shadow water bodies and significant vegetation followed by the application of consistent thresholds that best qualitatively to semi-quantitatively represented mineral (group) surface content and likely mineral species composition of rocksoil exposures Table 1 summarises the 17 ASTER products and their inferred accuracies (Cudahy 2012)
NASA-developed World Wind software (http wwwgagovauaster-viewer) has been promoted as a user-friendly method of visualising these CSIROndash GA Australian ASTER geoscience map products in conjunction with topographic information and other geophysical datasets such as radiometric data These ASTER map products in GeoTIFF file format can be accessed from the AuScope Discovery Portal (http portalauscopeorgportalgmaphtml) or CSIROrsquos site C3DMM (httpc3dmmcsiroau) In this study the ASTER map products in binary sequential (BSQ) format were also used to examine the effects of different histogram stretches and threshold values applied to a variety of band ratio imagery
4 May 2014
Table 1 Summary of the 17 CSIROndashGA compositional map products (Cudahy 2012)
Product name (product spatial resolution) Surface composition Example minerals targeted Accuracy
1 False colour (30 m) Standard VNIR product green vegetation highlighted in red NA
2 Landsat TM Regolith Ratios (30 m) Green vegetation versus different geologicalregolith areas NA 3 Green vegetation content (30 m) Green vegetation Moderate 4 Ferric oxide content (30 m) Hematite goethite jarosite Moderate 5 Ferric oxide composition (30 m) Hematite versus goethite Moderate 6 Ferrous iron index (30 m) As incorporated within silicatescarbonate Moderate 7 Opaque index (30 m) Includes carbon black (eg ash) magnetite Mn oxides Moderate
8 AlOH group content (30 m) Phengite muscovite paragonite illite montmorillonite kaolinite Moderate
9 AlOH group composition (30 m) Ordered kaolinite Al-rich white mica (eg muscovite parashygonite) versus Alndashpoor (also Si- or K-rich) white mica (eg phengite)
Moderate
10 Kaolin group index (30 m) Pyrophyllite alunite well ordered kaolinite Moderate 11 FeOH group content (30 m) Chlorite epidote jarosite gibbsite gypsum Low 12 MgOH group content (30 m) Calcite dolomite magnesite chlorite amphibole talc Moderate 13 MgOH group composition (30 m) Dolomite amphibole chlorite versus calcite amphibole Moderate
14 Ferrous iron content in MgOH carbonate (30 m)
Low ferrous iron carbonate MgOH minerals (eg talc) versus High ferrous iron carbonate MgOH minerals (eg chlorite)
Moderate
15 Silica index (90 m) SiO2 content quartz content enhanced by grain texture Moderate 16 Quartz index (90 m) Quartz Low 17 Gypsum index (90 m) Gypsum Very low
Cobar
Sydney
WaggaWagga
Wagga Wagga 1100 000 map sheet
Cobar 1250 000 map sheet
Canberra
0 200 km
Figure 2 ASTER False colour map product for NSW showing the 1250K map sheet boundaries The Cobar and Wagga Wagga study areas are outlined
Case study areas mdash environment and geology ASTER coverage of NSW Mineral mapping across NSW has been extended by the CSIROndashGA ASTER map products for most of the state with its best mapping examples highlighted within the drier western half (Figure 2) The ASTER scenes were also best mosaiced seamlessly in the arid and semi-arid western half where seasonal and yearly variations in vegetation are less significant mdash as shown by the ASTER False Colour (eg green vegetation shown in red) Figure 2 also shows the two study areas for this study the Wagga Wagga 100K and the Cobar 250K map sheets
Quarterly Notes 5
WAGGA WAGGA 1100 000 map sheet area The area of the Wagga Wagga 1100 000 map sheet of southeastern NSW was examined in this study and encompasses regolith and landforms typical of the Riverine Plains adjacent to the Murrumbidgee River (Figure 3) In particular it has elevations ranging from 180 m to above 500 m experiencing a moderate rainfall between 500 mm and 650 mm per annum (Chen 1997) The majority of the map sheet area is actively farmed either as crops or under sheep or cattle grazing Landforms consist of floodplains to moderately hilly areas with some eroded plateau exposures and piedmonts (Chen amp McKane 1997) Chen (1997) described and analysed the geomorphology and landforms in part using slope percent () estimates of the various floodplains and tributaries (1ndash2) undulating plains and rises (3ndash5) and hilly areas vulnerable to erosion (10ndash30) Surface soils typically include clay-rich alluvial and gravels with a strong presence of aeolian (parna) sediments particularly blanketing areas of lower relief Extensively folded Ordovician metasediments large intrusive Silurian granite bodies and minor Devonian sandstones occupy hilly areas mostly encompassing the eastern and southeastern parts of the Wagga Wagga 1100 000 map sheet area (Raymond 1993)
Creek
Burkes
Creek
Sandy
Creek
Murrumbidgee River
OrsquoBriens
Cre
ek
Yerong Oly
mpi
c
Highway
Highway
Sturt
The Rock Hill Mt Flakney
Wagga Wagga
The Rock
Mangoplah
Livingstone Range
147deg00rsquoE 35deg00rsquoS
147deg00rsquoE 35deg30rsquoS
147deg30rsquoE 35deg30rsquoS
147deg30rsquoE 35deg00rsquoS
2014_04_0084
REFERENCE
Urban area
Lake or swamp
Highway
Major road
Watercourse
0 10 20 km
Figure 3 Location and selected watercourses within the Wagga Wagga 1100 000 map sheet area
The proximity of the Wagga study area to the Gilmore Fault and the GidginbungAdelong gold deposits provided possible models and references in the search for prospective targets (Downes et al 2004 Lewis amp Downes 2008) The Adelong gold deposit is considered an orogenic gold orebody whilst the Gidginbung goldndashcopper deposit is regarded as a high-sulphidation epithermal type (Lewis amp Downes 2008) Studies of the Lachlan orogenic gold deposits including the Adelong deposit generally show an alteration assemblage that includes sericite muscovitendashphengite andor carbonates (Downes amp Seccombe 2008) and are potentially mapped by the ASTER AlOH and MgOHcarbonate map products The alteration at the Gidginbung deposit consists of several zones that include silicaquartz kaolinite and illite (Downes et al 2004) mdash also potentially mappable by the ASTER AlOH and Silica Indexquartz products As a result one of the main aims in this Wagga study area is to check the ability of the ASTER map products to discriminate such AlOH (eg sericitewhite mica) MgOHcarbonate and silicaquartz content associated with the Silurian granites and adjacent sedimentary metasedimentary units ASTER ferric oxide content and composition map products could also possibly assist with the interpretation of regolith landscape information
COBAR 1250 000 map sheet area Cobar is in western NSW within a semi-arid environment (Figures 2 4) and has an average annual rainfall of approximately 300+ mm (Chan et al 2003) The area is characterised by predominantly erosional landforms encompassing the catchment of the Macquarie and Bogan rivers with minor topographic relief and an average of 200ndash300 m above sea level (Chan et al 2003) Contour intervals of 50 m shown in Figure 4 highlight the mostly low relief peneplain nature of the arearsquos landforms Agricultural cropping occurs in the eastern half of the Cobar 250K map sheet area and rangeland grazing is predominant within the western half The geological exposure of the various Palaeozoic metasedimentary and metavolcanic units of interest for economic gold and base metal deposits are affected by a complex history of regolith development and transported alluvialaeolian deposition (Chan et al 2003 McQueen 2008) Weathering varies considerably but typically 20 m to 80 m thick (Chan et al 2003) Palaeodrainage networks and palaeosurface landforms are also present amongst the current alluvial and colluvial landscape Geochemistry exploration sampling and interpretation within this region requires a detailed knowledge and understanding of the nature and history of the regolith being sampled (Chan et al 2003)
6 May 2014
Quarterly Notes
B a r r i e r H i g h w a y
Highway
Mitchell
Hermidale
Girilambone
Canbelego
Coolabah
Cobar
North East Larsens
CSA
The Peak
Endeavor
Tritton
200
250
200
200
200
200
200
200
200
250
250
250
250
250
250
250
200
200
300
300
300
350
350
300
Yanda
Mulga
Whit
barro
w
Creek
C r e e k
Yarra
n
C r e e k
Creek
C re
ek
Pange
e
COBAR
CANBELEGO
145deg30rsquoE
145deg30rsquoE 147deg00rsquoE
31deg00rsquoS 147deg00rsquoE
31deg00rsquoS
32deg00rsquoS 32deg00rsquoS
REFERENCE 0 25 50 km
Operating mine 2014_04_0085
Highway
Major road
Contour
Watercourse
Figure 4 Cobar 250K map sheet area highlighting major mines watercourses and 50 m elevation contour intervals Topographic base data is from Geoscience Australia
Shortwave Infrared (SWIR) spectroscopy of regolith samples has assisted an understanding of the boundary between transported and residual in situ material (Chan et al 2003) In particular information about clays (including kaolinite crystallinity) has been used to identify such boundaries (Cudahy 1997) Transported materials typically exhibit poorly crystalline or disordered kaolinite signatures while in situ outcrops show crystallinewell-ordered kaolinite signatures The identification of the ferric iron oxide mineral hematite versus goethite can also be a useful indicator of the regolith history and nature of the surface exposure (Huntington et al 1999) It is in this context that the recently released ASTER mineral map products together with geophysical radiometric information can potentially assist the interpretation of surface regolith landforms around Cobar and also aid the analysis of geochemical surveys
Datasets and methodologies ASTER GeoTIFF and BSQ binary format versions of the ASTER map products were both utilised in this study as made available by CSIRO and GA via the GSNSW The 17 ASTER products were visualised with ENVITM (httpwwwexelisviscom) ERMapperTM (http geospatialintergraphcomHomepageaspx) and Global MapperTM (httpwwwbluemarblegeocomproducts
global-mapperphp) software where map sheet boundaries drainage and other relevant topographic Geographic Information System (GIS) shapefile information were incorporated ERMapperTM and Global MapperTM proved the most user friendly when integrating with geophysical and other datasets of different dimensions and origins BSQ format versions of the ASTER map products were useful when examining variations of the imagery and generated mineral anomalies using different image histogram stretches and cutoff thresholds from those assumed in Cudahy (2012) The ASTER acquisition dates of imagery used for the generation of mineral map products in the Wagga Wagga and Cobar study areas were determined by examining the ASTER archive listed within the USGS Glovis site (httpslpdaacusgsgovdata_accessglovis) Data for the major portion of the Wagga Wagga 100K map sheet are were acquired with ASTER on 1112001 The geologically relevant western half of the Cobar 250K map sheet area with minimal cropping and cultivation (inc Cobar 100K Canbelego 100K map sheet areas) was acquired by ASTER on 1992003
Airborne geophysics Various radiometric and filtered aeromagnetic or Total Magnetic Intensity (TMI) ERMapper and GeoTIFF files processed into 50 m grids were obtained by the GSNSW for the Wagga Wagga 100K map sheet area High-frequency filtered TMI data such as tilt-angle filtered and first (1VD) second (2VD) vertical and horizontal (1HD) derivative files were also examined for near-surface magnetic anomalies relevant for comparison with the radiometric and ASTER data TMI imagery was also processed as Reduced to the Pole (RTP) TMI versions to adjust for Earthrsquos magnetic declination etc Radioelements potassium (K) thorium (Th) and uranium (U) and the ternary RGB composite imagery (eg Red K Green Th Blue U) were useful to compare with surface remote sensing compositional imagery although typically that senses deeper into the subsurface (to ~30 cm) Airborne radiometric data processed as 100 m grids were also used for the Cobar 250K map sheet study ERMapperTM and to a lesser extent ENVITM were used for examining and image processing the airborne geophysical datasets
Digital elevation models (DEMs) DEMs were available from the GSNSW airborne geophysics radar altimeter (at 50 m grid cells) the ASTER GDEM Version 2 (httpasterwebjplnasa govgdemasp) at 30 m (x y) spatial resolution and the Shuttle Radar Topography Mission (SRTM) at
7
2014_04_0086a
80 m (x y) spatial resolution (httpwww2jplnasa govsrtm) Higher resolution SRTM DEMs at 30 m (x y) were also accessible via the NSWGS for this particular government study although were found to be somewhat noisy within the Wagga Wagga and Cobar areas ENVITM was used to process DEM data into topographic models that included slope and artificial sun-shaded relief imagery The SRTM DEM information was found to generate the best slope product Figure 5a displays the SRTM 80 m slope for relief greater than 10 combined with landscapes of Chen (1997) highlighting that these steeper slopes occur within divisions IV and V
Auscover fractional landcover Australiarsquos land surface has been recently analysed for fractional cover percentages of bare ground (eg soil rock outcrop) green vegetation and dry vegetation cover as part of the Terrestrial Ecosystem Research Network (TERN httpwwwternorgau) Datasets are available as part of this project via the AusCover data facility (httpdataauscoverorgau) Several
different versions of fractional cover information based on different algorithms and satellite sensors have been generated and are currently in the process of validation across Australia In this study the satellite Landsat TM 5- and 7-based fractional cover analysis provided high 30 m spatial resolution for the Wagga Wagga and Cobar study areas This coverage information was generated by algorithms described by Scarth et al (2010) and available via AusCover as binary NetCDF data tiles (httpdataauscoverorg auxwikibinviewProduct+pagesLandsat+Fractio nal+CoverHLinktothedata) The Landsat fractional cover estimates were generated from imagery recorded within a few days of both the Wagga Wagga and Cobar ASTER image acquisition dates listed above Figure 5b displays the fractional cover product as a RGB composite for bare ground green and dry vegetation for the Wagga 100K map sheet area generated from Landsat 7 acquired on 1012001 In this study several masks based on the fractional cover layers were devised and applied on the ASTER maps However the photosynthetic vegetation fraction for values less than 45 were used to refine (ie filter) the final ASTER map examples
147deg00rsquoE 35deg00rsquoS
147deg00rsquoE 35deg30rsquoS
147deg30rsquoE 35deg30rsquoS
147deg30rsquoE 35deg00rsquoS
0 10 20 km
b) 147deg00rsquoE
35deg00rsquoS
147deg00rsquoE 35deg30rsquoS
147deg30rsquoE 35deg30rsquoS
147deg30rsquoE 35deg00rsquoS
a)
0 10 20 km
2014_04_0086b
Figure 5 a) Wagga Wagga 100K landscape divisions overlying SRTM 80 m DEM slope greater than 10 Blue 150 to Red 300m Landscape divisions (I) Murrumbidgee floodplains (II) alluvial plains of local streams (III) undulating plains rises and long footslopes (IV) hilly areas and (V) eroded plateau and piedmont plains (Chen 1997) b) Wagga 100K Landsat 7-derived fractional cover RGB image Red bare ground Green photosynthetic vegetation Blue non-photosynthetic vegetation (linear stretch 0ndash100)
8 May 2014
Quarterly Notes
Burkes
Creek
Sandy Creek
Murrumbidgee River
OrsquoBriens
Cre
ek
Yerong
Creek
Oly
mpi
c
Highway
Highway
Sturt
147deg00rsquoE 147deg30rsquoE35deg00rsquoS 35deg00rsquoS REFERENCE
WP75 Cza AlluviumWP76
Czg Gravelly siltstone colluviumWP74 WP73 WP72
WP77 Du Sandstone minor conglomerate siltstone
OR
DO
VIC
IAN
S
ILU
RIA
ND
EV
ON
IAN
CE
NO
ZOIC
Wagga Svu Quartzndashfeldspar phyric felsic volcanicsWagga
WP60 Sgb Buchargingah granite
WP21 Sgc Collingullie Granite
Sgf Mount Flakney Granite
Sgk Kyeamba Monzogranite
Sgr Burrandana granite
Sgw Wantabadgery Granite
Ou Siltstone shale phyllite minor schist quartzite
WP9
WP10 WP20 WP23 WP34 WP22WP11 WP19WP32
WP31 WP24WP62 WP36 WP17WP43 The Rock WP16
WP12WP58 WP13 WP15WP64 WP25WP66
WP63 WP14
WP26WP27WP49 WP28WP50 WP29 Waypoint
Highway WP47
WP71WP70WP57Yerong Creek
WP56 WP69WP51 WP54 WP68 Major roadWP55 WP67WP53 Watercourse
Lake or swampWP52
147deg00rsquoE 35deg30rsquoS
147deg30rsquoE 35deg30rsquoS
0 10 20 km
2014_04_0087
Figure 6 Wagga Wagga 100K geological map (Raymond 1993) and the observed field localities (WP)
Data integration strategies Past integrated studies of spectral airborne geophysics and DEM data have shown the usefulness of simple RGB composite imagery such as ASTER-derived AlOH content with radiometric K draped over high-pass filtered magnetic data (Hewson et al 2003) Comparing ASTER products with slopes modelled from DEMs was found particularly useful for discriminating mineral occurrences associated with transported alluvium versus outcrop (Hewson et al 2006) In this study slope percent imagery derived from the Wagga Wagga 100K SRTM DEM data was processed with a threshold to extract (lsquomaskrsquo) only areas greater than 10 in order to focus on potentially hilly and piedmont rock talus outcrop exposures within the combined ASTERndash geophysics products Shaded relief imagery of the DEM was also used with ERMapperTM as an lsquoIntensityrsquo base layer to RGB composite imagery of ASTER and geophysics data products Shaded relief DEM imagery for the Wagga Wagga study area was generated assuming a sun elevation of 60deg and azimuth of 072deg to simulate the illumination conditions when the relevant ASTER imagery was acquired on 1112001 at 1030am
Field studies and sample spectroscopy Field sampling and validation of identified ASTER mineral map anomalies were undertaken in the Wagga Wagga area during April 2013 in the form of observed waypoints and as sampling localities A total of 69 localities were visited (lsquoWPxxrsquo Figure 6) of which 29 were sampled for rocks and soils Full descriptions of field waypoints sample localities and associated geologicallandform information are included within the GS20131558 DVD database (Hewson 2013) All collected field samples were measured with the Analytical Spectral Device Inc (ASD) Terraspec 4 VNIRndashSWIR spectrometer (httpwwwasdi comproductsterraspecterraspec-hi-res-mineralshyspectrometer) At this stage no validation or field sampling has been undertaken within the Cobar 250K map sheet area
9
GP5
GP6
a)ASTER validation study Several localities within the Wagga Wagga 100K map sheet area were used for validation or lsquoground truthrsquo sites for the ASTER map products The Wagga Wagga Airport and RAAF base provided useful dark ground targets to test for possible crosstalk issues (Figure 7a) The ASTER False Colour (Figure 7b) map product showed these dark or low-albedo surfaces Residual crosstalk effect is a possible explanation for the corresponding AlOH group content anomalies (red and green areas Figure 7c) Multiple
b)spectral reflectance measurements were undertaken at each site with the TerraSpec 4 (lsquoASDrsquo) spectrometer using its hand-held probe These measurements were averaged and resampled to ASTER spectral resolution to ascertain any possible AlOH-like SWIR signature (Figures 8a b) Tarmac at the Wagga Wagga Airport and the RAAF base exhibited low overall reflectance and an absence of any effective average ASTER AlOH spectral absorption signature centred at band 6 (2200 nm) (Figure 8a b) Additional validation sites were also studied to examine ASTERrsquos geologicalmineral mapping invariant targets with minimal vegetation In particular gravel pits within the Wagga Wagga 100K map sheet area were identified for sampling and ASD Terraspec measurements Waypoint WP52 (Sample WG21 site) within a granite gravel pit of approximately 100 m x 150 m was located on site (Figure 9 andashc) and within the 2001 ASTER map products (Figure 10andashc) The corresponding ASTER map products for the WP52WG21 site showed reasonable spatially coherent anomalies for the ASTER AlOH Silica Index and to a lesser extent the Ferric Oxide anomalies A four ASTER pixel subset within this gravel pit gave AlOH group content and ferric iron content values of 227 and 14 respectively ASD derived equivalent ASTER AlOH group content and ferric iron content ratio products gave favourably comparable values of 242 and 147 respectively Within the same gravel pit subset area the Landsat derived fractional photosynthetic (eg green veg) cover product also showed a low cover value of 23 (Figure 10d)
a) b) 025 025
02 02
WP61
WP60
c)
WP61
WP60
250m 2014_04_0088
Figure 7 a) Google Earth image of ASTER validation sites at Wagga Wagga Airport (GP5) waypoints WP59 WP60 and RAAF parade ground (GP6) waypoint WP61 b) ASTER False colour image c) ASTER AlOH group content (purpleblue low to red high content)
Ref
lect
ance
015
Ref
lect
ance
015
Mean ASTER Equivalent 01 Mean + Std Dev ASTER 01
Mean ASTER Equivalent Mean + Std Dev ASTER Mean - Std Dev ASTER Mean - Std Dev ASTER Mean ASD Mean ASD
005 005
0 0 550 1050 1550 2050 2000 2050 2100 2150 2200 2250 2300 2350 2400
Wavelength (nm) Wavelength (nm) 2014_04_0089
Figure 8 Wagga Wagga Airport tarmac (WP59ndash60) ASD and resampled ASTER equivalent signature (mean plusmn standard deviation) for a) the VNIRndashSWIR wavelengths and b) close up for SWIR wavelengths
10 May 2014
Quarterly Notes
a) b)
c) wg21a_af00 Figure 9 a) Google Earth image of ASTER geological wg21a_af01 validation site WP52WG21 b) Granitic gravel pit at WP52 wg21r_bf00 WG21 c) ASD Terraspec spectral signatures of granitegravel wg21r_bf01 showing ferric iron and pronounced AlOH diagnostic spectral wg21r_cf00 features at 880 nm to 1000 nm and 2208 nm respectively wg21r_cf01 Equivalent ASTER resampled signatures (asterisks) show
05 detectable features particularly for the AlOH SWIR feature 04
03
02
Hematite (880 nm) 01
Goethite (1000 nm) Al-poor mica (2208 nm)
00 400 900 1400 1900 2400
Wavelength (nm)
2014_04_0090
a) b)
Ref
lect
ance
WG21 WG21
c) d)
WG21
WG21
2014_04_0091250m
Figure 10 a) ASTER False Colour image of WP52 granitic gravel pit b) ASTER AlOH group content c) ASTER Silica Index d) Landsat fractional cover ndash photosynthetic cover Images bndashd display map product values from low (purpleblue) to high (red) values Grid cell is 250 m square
11
Results
WAGGA WAGGA 1100 000 map sheet area ASTER map products The Australian ASTER GeoTIFF map products were initially examined individually for the Wagga Wagga 100K map sheet area Several of the 17 products did not show significant anomalies related to geological features and were limited to (cultivated) cropping patterns at best In particular the ASTER imagery used here was acquired in mid-summer 2001 and highlighted exposed fallow fields and soils (Figure 11) The ASTER False Colour map product (Figure 11) also highlighted the town of Wagga Wagga and several vegetated areas with topographic relief (dark red to dark grey) A slight boundary anomaly is apparent at the extreme northwestern edge of the 100K scene from a change of ASTER image scenes ASTERrsquos green vegetation content product (Figure 12a) corresponds approximately with areas of red shown in the ASTER false colour product (Figure 11) although this green vegetation content product is is more correctly generated by a band ratio (bands 3band 2) targeting the chlorophyll lsquored edgersquo Exposed soil and fallow crop fields have no or low green vegetation anomalies (blue) on the floodplains and lowlands while vegetation is highlighted
Wagga Wagga
Vegetated relief
Murrumbidgee River Flood Plain
147deg00rsquoE 35deg00rsquoS
147deg00rsquoE 35deg30rsquoS
147deg30rsquoE 35deg30rsquoS
147deg30rsquoE 35deg00rsquoS
2014_04_0092
0 10 20 km
Figure 11 ASTER false colour products within Wagga Wagga 100K map sheet area
147deg00rsquoE 35deg00rsquoS
147deg00rsquoE 35deg30rsquoS
147deg30rsquoE 35deg30rsquoS
147deg30rsquoE 35deg00rsquoS
0 10 20 km
147deg00rsquoE 35deg00rsquoS
147deg00rsquoE 35deg30rsquoS
147deg30rsquoE 35deg30rsquoS
147deg30rsquoE 35deg00rsquoS
2014_04_0093
Figure 12 a) Wagga Wagga 100K ASTER green vegetation product (blue low red high content) b) ASTER AlOH content (blue low red high content)
within areas of topographic relief (Figures 11 12a) ASTERrsquos AlOH content product (Figure 12b) shows very limited clay anomalies except for the Wagga Wagga township and an apparent association with vegetated occurrences shown in the green vegetation product (Figure 12a) A green vegetation mask based on the ASTER product was applied during the generation of the AlOH composition map product and minimal anomalies were apparent
12 May 2014
13 Quarterly Notes
147deg00rsquoE 35deg00rsquoS
147deg00rsquoE 35deg30rsquoS
147deg30rsquoE 35deg30rsquoS
147deg30rsquoE 35deg00rsquoS
0 10 20 km
147deg00rsquoE 35deg00rsquoS
147deg00rsquoE 35deg30rsquoS
147deg30rsquoE 35deg30rsquoS
147deg30rsquoE 35deg00rsquoS
2014_04_0094
Figure 13 a) Wagga Wagga 100K ASTER ferric oxide content (blue low red high) and b) composition map products Apparent trends in the ferric oxide content are shown in red dashed lines
ASTERrsquos ferric oxide content and composition products (Figures 13a b) show elevated values in contrast with the AlOH group content product (Figure 12b) There is also some variation in composition from the interpreted goethite-rich (bluendashcyan) to hematite-rich (redndashyellow) (Figure 13b) Some linear trends were
Figure 13a) show boundaries and possible lineaments related to floodplain alluvium regolith or geological units Although Cudahy (2012) described the ferric oxide content as having moderate accuracy a comment is also noted for the potential of pixel spectral mixing errors and an inverse relationship with the green vegetation product This could also be either related to the obscuring effect of vegetationcrops or spectral signature ambiguities given the proximity of VNIR spectral features The ASTER FeOH and ferrous iron products in the Wagga Wagga 100K map sheet area did not generate coherent or distinct features apart from some isolated paddock anomalies The ASTER MgOH group content and composition products showed minimal occurrences except for some anomalies in the far southwestern corner which occupied farm fields adjacent to Ordovician metasedimentary rocks Likewise the kaolinite group Index showed only minor anomalies Both the ASTER MgOH group content and composition and kaolinite index products were masked for green vegetation during processing (Cudahy 2012) The Silica Index (Figure 14) proved to have less noise and highlighted more anomalies than the ASTER quartz index although the range in values and image contrast were limited Subtle anomalies highlighted by the Silica Index generally occurred within paddocks corresponding to low green vegetation and also as broader subtle variations (Figure 14)
147deg00rsquoE 35deg00rsquoS
147deg00rsquoE 35deg30rsquoS
147deg30rsquoE 35deg30rsquoS
147deg30rsquoE 35deg00rsquoS
2014_04_0095
Figure 14 Wagga Wagga 100K map sheet area ASTER silica index
apparent although the anomalies were often biased by the cropping patterns and exposed paddock soils Nonetheless some linear trends (red dashed lines in
Burkes
Creek
Sandy Creek
Murrumbidgee River
OrsquoBriens
Cre
ek
Yerong
Creek
Oly
mpi
c
Highway
Highway
Sturt
a) b)
147deg00rsquoE 147deg30rsquoE 147deg00rsquoE 147deg30rsquoE 35deg00rsquoS 35deg00rsquoS 35deg00rsquoS 35deg00rsquoS
Bulloc Bulloc Range Burngoogee Ranges
Melebo Mountains
35deg30rsquoS 35deg30rsquoS 35deg30rsquoS 35deg30rsquoS 147deg00rsquoE 147deg30rsquoE 147deg00rsquoE 147deg30rsquoE
0 10 20 km 0 10 20 km
2014_04_0096a 2014_04_0096b
Figure 15 a) Wagga Wagga 100K SRTM 80 m slope (blue low red high) b) SRTM 80 m sun-shaded imagery draped with ASTER green vegetation product (Figure 12a) masked for slope gt10
147deg00rsquoE 147deg30rsquoE35deg00rsquoS 35deg00rsquoS REFERENCE
OR
DO
VIC
IAN
S
ILU
RIA
ND
EV
ON
IAN
CE
NO
ZOICWP75 Cza Alluvium
Czg Gravelly siltstone colluvium
Du Sandstone minor conglomerate siltstone
WP76
WP74 WP73 WP72
WP77
Wagga Svu Quartzndashfeldspar phyric felsic volcanicsWagga
WP60 Sgb Buchargingah granite
WP21 Sgc Collingullie Granite
Sgf Mount Flakney Granite
Sgk Kyeamba Monzogranite
Sgr Burrandana granite
Sgw Wantabadgery Granite
Ou Siltstone shale phyllite minor schist quartzite
WP9
WP10 WP20 WP23 WP34 WP22WP11 WP19WP32
WP31 WP24WP62 WP36 WP17WP43 The Rock WP16
WP12WP58 WP13 WP15WP64 WP25WP66
WP63 WP14
WP26WP27WP49 WP28WP50 WP29 WaypointWP47
WP71WP57 Highway WP70
WP56 WP69Yerong Creek WP51 WP54 WP68 Major roadWP55
WP67WP53 Watercourse
WP52 Lake or swamp
35deg30rsquoS 35deg30rsquoS 0 10 20 km 147deg00rsquoE 147deg30rsquoE
2014_04_0097
Figure 16 Wagga Wagga 100K geology map (Raymond 1993) combined with SRTM 80 m slope gt10 showing geological units within areas of high relief
14 May 2014
15 Quarterly Notes
The nature of the geomorphology and extensive agricultural cultivation of the Wagga Wagga 100K sheet area prompted the use of DEM data to discriminate the likely geologically exposed areas Processing the SRTM 80 m DEM for slope information highlighted the major ranges and topographic relief (Figure 15a) Sun-shaded DEM imagery also highlighted these landforms (Figure 15b) Generation of a mask based on slopes greater than 10 was useful to observe relationships with the various ASTER products For example when ASTERrsquos green vegetation product masked within areas of slope gt10 is combined with sun-shaded imagery much of the higher relief is observed to be moderately to highly vegetated (Figure 15b) Figure 16 shows simplified geological units combined with SRTM data An attempt to overcome the limited range of anomalies observed within the Wagga Wagga 100K ASTER silica index product (Figure 14) using a histogram equalisation stretch within the same data range highlighted both more noise and some coherent anomalies (Figure 17a) Masking of this product with SRTM Slope product greater than 10 (Figure 17b) helped to discriminate exposed geological units as shown in Figure 16 Elevated areas of the quartz-rich sandstone of Bulloc Bulloc Range and metasedimentary rock of Livingstone National Park were highlighted by this approach (Figure 17b)
Geophysical products A similar approach to displaying and enhancing the Wagga Wagga 100K ASTER map products was applied to the airborne radiometric data where anomalous regions were extracted within the areas of elevated slope Histogram equalisation stretching of the K Th and U radioelements highlighted a mixture of alluvial deposition and outcropping geology (Figure 18a) The potassium data coherently mapped the alluvium and floodplains of Burkes Creek and the Murrumbidgee River (Figure 18a) The Mount Flakney Granite and the Bulloc Bulloc Range Ordovician (Ou) and Devonian sandstones (Du) were highlighted as anomalous using the entire 100K map sheet dataset (with histogram equalisation) but more subtle variations in radioelement composition were apparent when slope masking was applied and a simple 2 linear histogram was applied for image stretching (Figure 18b) Compositional variations within these units appeared to be enhanced by limiting the focus to areas of higher relief Increased thicknesses of aeolian deposits alluvium or colluvium on lowlands and areas of reduced slope may mask and dilute radiometric sensing of some of these units
2014_04_0098a
147deg00rsquoE 35deg00rsquoS
147deg00rsquoE 35deg30rsquoS
147deg30rsquoE 35deg30rsquoS
147deg30rsquoE 35deg00rsquoS
147deg00rsquoE 35deg00rsquoS
147deg00rsquoE 35deg30rsquoS
147deg30rsquoE 35deg30rsquoS
147deg30rsquoE 35deg00rsquoS
2014_04_0098b
0 10 20 km
Figure 17 a) Wagga Wagga 100K ASTER Silica Index product generated with a histogram equalisation stretch b) Histogram equalised ASTER silica index masked for slope gt10 (purple blue low to red high content) Areas highlighted are Bulloc Bulloc Range (white) and Livingstone National Park (yellow)
a)
b)
2014_04_0099
16 May 2014
a)
Bullo
c Bu
lloc
Rang
e D
uO
u
Mt F
lakn
ey G
rani
te
Mur
rum
bidg
ee R
iver
Burkes Creek
K U
Te
rnar
y K
Th U
Th
b)
Slop
e m
aske
d Te
rnar
ySl
ope
mas
ked
K Sl
ope
mas
ked
ThSl
ope
mas
ked
U
Figu
re 1
8 a
) Wag
ga W
agga
100
K a
irbor
ne ra
diom
etri
c dat
a K
Th U
and
as a
Ter
nary
imag
e (RG
B K
Th U
) di
spla
yed
with
a h
istog
ram
equa
lisat
ion
stre
tch
b)
K Th
U T
erna
ry im
age m
aske
d fo
r slo
pes gt
10
disp
laye
d w
ith a
2
line
ar h
istog
ram
stre
tch
Geo
logi
cal f
eatu
res d
iscus
sed
in te
xt a
re ci
rcle
d
17 Quarterly Notes
0 10 20 km
c) d)
a) b)
Bulloc Bulloc Range DuOu
Mt Flakney Granite (Sgf)
Figure 19 Apparent trends in the ASTER ferric oxide content (from Figure 13a) are shown as red dashed lines a) TMI 1VD (greyscale) overlain with ASTER ferric oxide content b) TMI 1VD (greyscale) overlain with K Th U Ternary RGB imagery (Red K Green Th Blue U) c) RTP TMI (greyscale) over tilt-filtered RTP TMI (pseudocolour) d) Sun-shaded SRTM DEM (greyscale) overlain with tilt-filtered TMI (pseudocolour)
Bulloc Bulloc Range DuOu
Mt Flakney Granite (Sgf)
Bulloc Bulloc Range DuOu
Mt Flakney Granite (Sgf)
2014_04_0100
Filtered aeromagnetic data for the Wagga Wagga 100K map sheet area were used in an effort to extract structural information and also to highlight near-surface trends of iron-bearing unitsmagnetite and possible correlations with the ASTER map products ASTERrsquos ferric oxide content showed some trends albeit revealed within exposed paddocks (Figure 13a) that showed northwest-trending and some possible northeast-trending features that correlated approximately with First Vertical Derivative (1VD) TMI lineaments (Figure 19a) The VNIR spectral signature of magnetite is essentially aspectral and not likely to be revealed by the ASTER Ferric Oxide Content product directly However weathering of magnetite-bearing rocks may possibly be associated with increased ferric iron oxide minerals within soils exposed here Integrating radiometric ternary imagery over TMI 1VD (Figure 19b) reveals similar northwest trends as Figure 19a In addition Figure 19b reveals a
complex series of north-northwest-trending lineaments along the western boundary of the K-rich Mount Flakney Granite and northwest-trending lineaments east of the sheared Bulloc Bulloc Range Devonian and Ordovician units RTP TMI over tilt-filtered Reduced to the Pole (RTP) TMI (Figure 19c) highlighted several lineaments with some corresponding to those interpreted with ASTER ferric oxide and radiometric data (Figure 19a b) The integration of tilt-filtered TMI over sun-shaded SRTM DEM (Figure 19d) also revealed some correlation of northndashnorth-northwest and cross-cutting north-northeast lineaments with topographic relief and valleys (Figure 5a) related to either outcropping geological units or possible structural and tectonic movements The tilt-filtered TMI within this Wagga 100K area appears to reveal increased high-frequency features and anomalies useful for detailed interpretation
REFERENCE
Highway
Major road
Watercourse
Lake or swamp
Cza
Czg
Du
Svu
Sgb
Sgr
Ou
Alluvium
Gravelly siltstone colluvium
Buchargingah granite
Burrandana granite
Sandstone minor conglomerate siltstone
Quartzndashfeldspar phyric felsic volcanics
Siltstone shale phyllite minor schist quartzite
CE
NO
ZOIC
DE
VO
NIA
NS
ILU
RIA
NO
RD
OV
ICIA
N
2014_04_0101
Yerong
Burkes
Creek
Cree
k
Creek
Stony
Watt
le
Creek
Hig
hway
Oly
mpi
c
The Rock
YerongCreek
A
B
147deg00rsquoE
147deg00rsquoE 147deg14rsquoE
147deg14rsquoE
35deg12rsquoS 35deg12rsquoS
35deg24rsquoS 35deg24rsquoS
0 5 10 km
Yerong
Burkes
Creek
Cree
k
Creek
Stony
Watt
le
Creek
Hig
hway
Oly
mpi
c The Rock
Yerong Creek
A
B
147deg00rsquoE
147deg00rsquoE 147deg14rsquoE
147deg14rsquoE
35deg12rsquoS 35deg12rsquoS
35deg24rsquoS 35deg24rsquoS
0 5 10 km
REFERENCE
Cza
Czg
Alluvium
Gravelly siltstone colluvium
Du Sandstone minor conglomerate siltstone
Svu Quartzndashfeldspar phyric felsic volcanics
Buchargingah granite
Burrandana granite
Ou Siltstone shale phyllite minor schist quartzite
Highway
Major road
Watercourse
Lake or swamp
Sgb
Sgr
2014_04_0101
Figure 20 Location of The Rock Hill (A) and Flowerpot Hill (B) on part of the Wagga Wagga 100K geological map (Raymond 1993)
a) b) O
RD
OV
ICIA
N
SIL
UR
IAN
DE
VO
NIA
NC
EN
OZO
IC
c) d)
NA
NA
NA
NA
NA NAWG16
WG17 WG18
WG23
WG26
WG19
Mag Low-Demagnetisation (removal of iron via metasomatic fluid alteration)
Axis Axis
Mag Low Radiometrics ternary RGB K Th U
Radiometrics Potassium (Histogram equalised)
O 10km
2014_04_0102
Figure 21 The Rock Hill and Flowerpot Hill area of Figure 20 (approx) a) ASTER false colour b) RTP TMI over Tilt-filtered TMI c) Radiometrics Ternary (RGB K Th U) d) Radiometrics K (blue low red high) Major lineaments magnetic low and fold structure are shown NA = site not sampled in study
18 May 2014
b)REFERENCE
Waypoint site
Highway
Major road
Watercourse
Lake or swamp
Cza
Czg
Du
Svu
Sgb
Sgr
Ou
Alluvium
Gravelly siltstone colluvium
Buchargingah granite
Burrandana granite
Sandstone minor conglomerate siltstone
Quartzndashfeldspar phyric felsic volcanics
Siltstone shale phyllite minor schist quartzite
CE
NO
ZOIC
DE
VO
NIA
NS
ILU
RIA
NO
RD
OV
ICIA
N
2014_04_0103a
Yerong
Burke
s
Creek
Cree
k
Creek
Stony
Watt
le
Creek
Hig
hway
Oly
mpi
c
The Rock
YerongCreek
WP66WP63
WP37
WP56
WP57
WP50
WP35WP62
WP38
WP49
WP36
WP47
35deg23rsquoS147deg00rsquoE
147deg00rsquoE 147deg14rsquoE
35deg23rsquoS147deg14rsquoE
35deg14rsquoS35deg14rsquoS
0 5 10 km
Quarterly Notes
a) REFERENCE
Cza
Czg
Alluvium
Gravelly siltstone colluvium
CE
NO
ZOIC
Sandstone minor conglomerate siltstone
Mag Low ASTER AIOH content 35deg14rsquoS 35deg14rsquoS
35deg23rsquoS 35deg23rsquoS 147deg00rsquoE
147deg00rsquoE 147deg14rsquoE
147deg14rsquoE
2014_04_0103b
Yerong
Burke
s
Creek
Cree
k
Creek
Stony
Watt
le
Creek
Hig
hway
Oly
mpi
c
The Rock
Yerong Creek
WP66 WP63
WP37
WP56
WP57
WP50
WP35 WP62
WP38
WP49
WP36
WP47
35deg23rsquoS 147deg00rsquoE
147deg00rsquoE 147deg14rsquoE
35deg23rsquoS 147deg14rsquoE
35deg14rsquoS35deg14rsquoS
0 5 10 km
b)
c)
Du
Svu
Sgb
Sgr
Ou Siltstone shale phyllite minor schist quartzite
Waypoint site
Highway
Major road
Watercourse
Lake or swamp 2014_04_0103a
The Rock Hill and Flowerpot Hill Devonian and Ordovician metasedimentary units in the central western part of the Wagga Wagga 100K map sheet area (Figure 20) provided a useful target and potentially prospective area to closely examine ASTER and geophysical mapping issues and opportunities for data integration The ASTER false colour product highlights the elevated Bulloc Bulloc Range including The Rock and Flowerpot Hill surrounded by farm paddocks and cultivation (Figure 21a) The geophysics highlights some interesting lineaments a fold structure and a magnetic low (Figures 21bndashd) In particular the tilt-filtered TMI data shows a prominent pair of north-northwestndashsouth-southeast lineaments (Figure 21b) approximately parallel to the apparent hinge linefold axis of the DevonianOrdovician metasedimentary rocks (Figure 21c d) and also bounding a likely deep-seated magnetic low (Figure 21b) Ternary and K radiometric anomalies appear to cross-cut the
OR
DO
VIC
IAN
S
ILU
RIA
ND
EV
ON
IAN
Quartzndashfeldspar phyric felsic volcanics
Buchargingah granite
Burrandana granite
ASTER silica index 35deg14rsquoS
35deg23rsquoS 35deg23rsquoS 147deg00rsquoE
147deg00rsquoE 147deg14rsquoE
147deg14rsquoE
35deg14rsquoS
0 5 10 km
2014_04_0103c
Devonian and Ordovician stratigraphy when they are overlain on the geology map (Figure 22a) A modified version of the ASTER AlOH content map masked for both SRTM-derived slopes greater than 10 and less than 45 Landsat-derived photosynthetic (PV or lsquogreenrsquo) vegetation fraction cover appears to highlight some increase in mica content in the main hinge line axis (red areas Figure 22b) Figure 22b was also displayed using histogram equalisation using thresholds described by Cudahy (2012) The silica index product with a histogram equalisation stretch also appears to highlight some increase in silica along the axis (Figure 22c) Field observations of increased quartz and ASD spectral measurements identifying AlOH minerals phengite and kaolinite (Figure 23) appear to confirm this interpretation Hematite is also common within The Rock Hill and Flowerpot Hill area
Figure 22 The Rock Hill and Flowerpot Hill a) Wagga Wagga 100K geological map with geophysical features from Figure 21 b) ASTER AlOH masked for gt10 slope and lt45 PV Landsat fraction histogram equalised Mica anomaly is circled c) ASTER silica index histogram equalised Silica anomaly is circled Purpleblue low to red high content
19
Ref
lect
ance
050
040
030
020
010
000
wg26r_bw00000
wg23r_bw00001
Hematite signature (860 nm) Al poor mica or Phengite (eg 2209 nm absorption)
400 900 1400 1900 2400
Wavelength (nm) 2014_04_0104
Figure 23 Example ASD spectral signature of rock outcrop samples (WG23 26 ndash see Figure 21a) at Flowerpot Hill showing Al-poor micaAlOH and hematite diagnostic features
ASTER data issues and qualifications on interpretation Acquisition of ASTER satellite imagery at about 1030 am (Australian Eastern Daylight Time) can potentially produce sharp shadows on steep westerly slopes within high relief areas The ASTER satellite sensor has an additional issue of potential false anomalies from the lsquocrosstalkrsquo mis-calibration of its shortwave IR sensor (bands 5ndash9) as used for the generation of AlOH or micaclay mineral maps Dark shaded areas appear on the western slopes of The Rock and Flowerpot Hill as a result of north- and northwest-trending ridgelines as shown in the sun-shaded DEM imagery generated to simulate illumination conditions on 1112001 at 1030 am (blue ellipses Figure 24a) These areas of deep shadow appear to be coincident with some of the AlOH anomalies (red ellipse Figure 22b) and potentially the result of false anomalies associated with crosstalk
0 4km a)
WP 62 WP 35
WP 36 WP 37
WP 33
WP 38
WP 65
WP 66
WP 58
WP 45
SRTM DEM sun shaded (el 60˚ Az 72˚)
b)
(Figure 24b) However areas of full illumination on the northeast slopes also show AlOH anomalies and the crosstalk explanation does not entirely negate the AlOH presence Overall these results suggest that residual crosstalk effects are a possibility within dark areas of shadow and vegetation cover and bitumen (eg the Wagga AirfieldRAAF base) The validation of ASTER study sites can be assisted with the aid of DEMs fractional cover information field observations and ideally a VNIRndashSWIR spectrometer
ASTER AIOH mica content (hist eq) masked for 45 lt green vegetationgt 10 slope
Figure 24 a) Sun-shaded SRTM 80 m DEM of The Rock Hill and Flowerpot Hill (60deg elevation 072deg azimuth) simulating illumination conditions and shaded relief during ASTER image acquisition (1112001) b) ASTER AlOH content and corresponding areas of shaded relief (dashed ellipses)
Figure 25 The Rock Reserve WP62 a) Casuarina open woodland b) ferruginous gravel with lichen and moss ground cover c) typical canopy cover
20 May 2014
Quarterly Notes
a) b) c)
WP62
WP35
WP36 WP37
WP38WP40 WP39
WP58
WP65 WP63
WP66
WP62
WP35
WP36 WP37
WP38WP40 WP39
WP58
WP65 WP63
WP66
WP62
WP35
WP36 WP37
WP38WP40 WP39
WP58
WP65 WP63
WP66
0 20 40 60 80 100 0 20 40 60 80 100 0 20 40 60 80
non-photosynthetic Bare ground photosynthetic
4km 2014_04_01060
Figure 26 a) ndash c) Landsat fractional cover estimates for The Rock Hill mdash the same area as in Figure 24
Field observations and ASD in-situ field measurements of gravel lag vegetation ground litter etc at Waypoint WP62 (Figure 22a 24a) were undertaken near The Rock (Figure 25andashc) AusCover fractional cover estimates using Landsat acquired 1012001 one day before the ASTER gave values of 18 bare ground 41 photosynthetic and 40 non-photosynthetic vegetation cover for supplied 30m pixels encompassing WP62 Fractional cover imagery for the Bulloc Bulloc RangeThe Rock shows that the cover is dominated by photosynthetic and to a lesser extent non-photosynthetic vegetation (Figures 26andashc) ASD in-situ field measurements of gravel lag vegetation and ground litter at WP62 were processed to simulate ASTER ferric oxide content and green vegetation indices (Figure 27) This limited series of measurements suggested that the presence of dry vegetation matter (eg lichen bark leaf litter) can hinder the ASTER interpretation of ferric iron (eg hematite goethite) useful for regolith profile information andor alteration involving hematisation (Figure 27) Simulated values for ASTERrsquos AlOH content index from W62 gravel
The Rock Hill - Waypoint 62
Green tree and shrub foliage ground moss Devonian ferruginous sandstone gravel lag Lichen bark and leaf litter
1 3
0
4
2
AST
ER -
Gre
en V
eget
atio
n
ASTER - Ferric Oxide Content
Figure 27 ASD field spectral signatures of vegetation and gravel samples from The Rock Hill (WP 62) resampled and processed into equivalent ASTER map indices for green vegetation and ferric oxide content
lag ASD measurements produced values between 19 and 215 within the threshold range used to generate ASTER AlOH content imagery (Cudahy 2012) This compares favourably with the ASTER AlOH content index value of 20 as an average for 2 x 30 m pixels at WP62 extracted from the map product
Cobar 1100 000 and Canbelego 1100 000 map sheet areas The ASTER map products over the Cobar 1250 000 map sheet area are less affected by agricultural cultivation than the Wagga Wagga area as highlighted by ASTERrsquos false colour showing only approximately 25 under cultivationcropping to the east (Figure 28a) Isolated cloud cover is also apparent in the eastern third of the Cobar 1250 000 map sheet area where the map product is generated from a separate ASTER scene (Figure 28a) ASTERrsquos regolith product is useful for highlighting the extensive ephemeral drainage patterns (Figure 28b) As described by Cudahy (2012) the Regolith product based on the Landsat TM Regolith ratios helps to separate regolith and geological units while vegetated areas are highlighted by whitebright areas and clouds in blue (Figure 28b) ASTERrsquos green vegetation product also shows the limited nature of the green vegetation cover restricted to watercourses outside of the cultivated areas (Figure 28c) The land cover is more explicitly highlighted in the Landsat-derived fractional cover image which shows that close to the time of ASTER acquisition (September 2003) the most exposed bare ground was within the Cobar 100K map sheet area and to a lesser extent Canbelego 100K (reddish areas Figure 28d) Non photosynthetic vegetation (lsquodry vegetationrsquo) still appears pervasive in the non-cultivated areas (blue areas Figure 28d) which may be an issue for some ASTER map products
21
100
c) d)
a) b)
145ordm30E 147ordm00E 145ordm30E 147ordm00E 31ordm00S 31ordm00S
32ordm00S 32ordm00S
145ordm30E 147ordm00E 145ordm30E 147ordm00E
31ordm00S 31ordm00S
32ordm00S 32ordm00S
Figure 28 Cobar 1250K map sheet area a) ASTER false colour Note clouds and shadows in lower right b) ASTER regolith colour coded as for standard CSIRO Landsat Regolith product (Cudahy 2012) c) ASTER green vegetation (blue low red high) d) Landsat fractional cover RGB Red bare ground Green photosynthetic vegetation Blue non-photosynthetic vegetation (linear stretch 0ndash100)
a) b) 145ordm30E 147ordm00E 145ordm30E 147ordm00E
31ordm00S 31ordm00S
32ordm00S32ordm00S
Figure 29 Cobar 1250K map sheet area a) ASTER ferric oxide content (blue low red high) b) ASTER ferric oxide composition (histogram equalised) (blue goethitic red hematitic) c) ASTER AlOH group content (histogram equalised) (blue low red high) Note that cloud cover in eastern 100K maps introduces false anomalies (see Figure 28a)
32ordm00S
31ordm00S
c) 145ordm30E 147ordm00E
31ordm00S
32ordm00S
2014_04_0109
22 May 2014
23 Quarterly Notes
a) b) 145ordm30E 147ordm00E 145ordm30E 147ordm00E
31ordm00S 31ordm00S
32ordm00S 32ordm00S
147ordm00E
31ordm00S 145ordm30E 147ordm00E 145ordm30E
31ordm00S
32ordm00S32ordm00S
Figure 30 a) ASTER AlOH group composition (histogram equalised) (blue Al-rich micawell ordered kaolinite red Al-poor mica) b) ASTER silica index (histogram equalised) (blue low red high) c) Radiometric K (blue low red high) d) Radiometric Th (blue low red high)
c) d)
2014_04_0110
The ASTER Ferric Oxide Content product highlights coherent and continuous spatial distribution across the Cobar 1250 000 sheet area with increased abundance within the Cobar 100K area (Figure 29a) An improved insight into the ferric iron oxide was provided by the ASTERrsquos ferric oxide composition using histogram equalisation (Figure 29b) rather than a Gaussian stretch within the same threshold stretch limits advised by Cudahy (2012) Using the histogram equalised version of the ASTER ferric oxide composition product highlights more clearly an apparent increase in hematitic composition within the western Cobar 250K including the Cobar 100K map sheet area (Figure 29b) The presence of hematite versus goethite may be important for regolith interpretation and understanding of the arearsquos possible lateritic weathering (Huntington et al 1999) However care should also be taken when interpreting ferric oxide content and composition in the presence of dry vegetation matter mdash as observed at The Rock Hill (Figure 27) and also noted by Cudahy (2012) The areas highlighted by ASTER with increased hematite also coincide with increased abundance of AlOH minerals as shown by the histogram equalised version of the ASTER AlOH group content (greenndashyellow areas Figure 29c) The ASTER AlOH group composition product (histogram equalised Figure 30a) highlights extensive
areas of low values (blue) in the western Cobar 250K sheet area including within the Cobar 100K Cudahy (2012) interpreted such low ASTER AlOH composition product values as mapping well-ordered kaolinite or Al-rich white mica These areas also appear to coincide with the interpreted hematite-rich areas shown in Figure 29b (red areas) If a lateritic profile mineral model (Huntington et al 1999) is assumed then questions arise whether these areas lie within the highly weathered hematite-bearing duricrust or less-weathered ordered kaolinite-bearing saprolite The ASTER kaolin group index product for Cobar 250K sheet area does not indicate significant anomalies using linear or histogram equalised versions Cobar regolith landform mapping indicates much of the Cobar 100K area is highly weathered in situ bedrock (Gibson 1999) However validation field work involving sampling and ASD measurements should clarify these issues The ASTER silica index product does appear to indicate high silica content along the western boundary of the Cobar 100K sheet area that coincides with elevated areas mapped by Gibson (1999) containing cappings of silicified sedimentary units (histogram equalised Figure 30b) Geophysical radiometric products K and Th also highlight distinctive units with the Cobar 100K and Canbelego 100K map sheet areas (Figures 30c d) The K and Th images mostly appear to map in an approximate complementary way areas of alluvial
a)
147ordm00E 31ordm00S
145ordm30E
32ordm00S
b) 145ordm30E 147ordm00E
31ordm00S
32ordm00S
Figure 31 a) RGB composite ASTERrsquos AlOH content (histogram equalised) ferric oxide content silica index (histogram equalised) b) RGB composite K ASTERrsquos ferric oxide content AlOH content over shaded DEM
(eg K) and in situ regolith units (eg Th) (Figures 30c d) In particular the drainage areas appear rich in apparently K-bearing clays (Figure 30c) whilst the Th occurs where there are non-drainage in situ relict areas (Figure 30c) possibly related to ferricrete Further ground truthing would help this interpretation An RGB composite image of ASTERrsquos AlOH group content ferric oxide content and silica index products appeared to discriminate generally elevated combined clay- and quartz-rich units (eg red+blue areas shown as purple) from ferric iron oxide minerals (green) within some drainage areas (Figure 31a) A RGB composite image of the radioelement K ASTER ferric oxide content and ASTER AlOH group content products also generated significant and complex spatially coherent patterns particularly within the Cobar and Canbelego 100K sheet areas that appear worthy of further examination for regolith information (Figure 31b)
2014_04_0111
Conclusions This project demonstrated within the NSW study areas of Wagga Wagga and Cobar the usefulness of the recently released Australia ASTER map products supplied by CSIROGA for identifying or discriminating variations in surface composition The map products included mineral identitiesgroups within geological units possible overprinted alteration andor weathered regolith These map products can potentially aid mineral exploration in NSW within semi-arid areas such as Cobar and to a lesser extent within open woodland and cultivated environments such as Wagga Wagga Although several ASTER map products provided useful information as individual entities their application generally benefits exploration when integrated with geophysical topographical and fractional land cover information In particular DEM-derived slope information and vegetation fractional data were used to mask and refine ASTER map products in the Wagga area within the temperate and vegetated Riverine Plains Anomalous AlOH- and silica-rich areas were discriminated and associated with radiometric and high frequency filtered TMI-inferred structures in the vicinity of the Bulloc Bulloc Range especially at The Rock Hill ASTER Ferric Iron Content product within the Wagga Wagga area also appeared to show northwest lineament trends similar to those highlighted by filtered TMI products Map generation for the Murrumbidgee floodplains using radiometric data also appeared to benefit from topographic slope masking to exclude areas of alluvial and aeolian transported cover More spatially coherent anomalous areas particularly related to the regolith were identified by the ASTER map products in the semi-arid and rangeland terrain of Cobar The application of different histogram stretches such as histogram equalisation was found to further enhance the display of anomalous features mdash although care should be applied regarding data thresholds The application of the ASTER map products individually as RGB composites or integrated with radiometric data appears useful for regolith mapping and identifying weathering profile-related mineralogy at Cobar Effects of residual ASTER crosstalk mis-calibration within areas of shadowdark surfacesdense vegetation and possible interpretation ambiguities between VNIR-derived ferric oxide and dry vegetation highlight the importance of validation fieldwork to check anomalous areas and their spectral signatures The validation of ASTER study sites may be assisted by DEM and fractional cover information Further investigations into the benefits of integrating artificially illuminated shaded topographic relief and AusCover fractional land cover information relevant for ASTER acquisition dates are recommended
24 May 2014
25 Quarterly Notes
Acknowledgements This study has been supported and funded by the Geological Survey of New South Wales in part for the purpose of contributing to the knowledge of the Wagga Wagga 1100 000 map sheet geology for mineral exploration Geophysical and associated data for the Wagga Wagga and Cobar study areas were received from the Geological Survey of New South Wales ASTER GeoTIFFs and BSQ ASTER map products were also gratefully obtained from Geoscience Australia and CSIROndashEarth Science amp Resource Engineering whilst the original ASTER imagery was made available by NASA and METI GIS shapefiles for the Wagga Wagga and Cobar 1250 000 map sheet areas were also gratefully obtained from Geoscience Australia Assistance is also gratefully acknowledged from Thomas Cuday and Carsten Laukamp of CSIRO and Matilda Thomas of Geoscience Australia Support from Professor Simon Jones and Laurie Buxton of RMIT University was also helpful during this study
References Caccetta M Collings S amp Cudahy C 2013 A calibration methodology for continental scale mapping using ASTER imagery Remote Sensing of Environment 139 306ndash317
Chan RA Greene RSB de Souza Kovacs N Maly BER McQueen KG amp Scott KM 2003 Regolith geomorphology geochemistry and mineralisation of the SussexndashCoolabah area in the CobarndashGirilambone region North-Western Lachlan Foldbelt NSW CRC LEME openfile report 148 NSW DMR Report GS2001319
Chen XY 1997 Quaternary sedimentation parna landforms and soil landscapes of the Wagga Wagga 1100 000 map sheet south-eastern Australia Australian Journal of Soil Research 35(3) 643ndash668
Chen XY amp McKane DJ 1997 Soil Landscapes of the Wagga Wagga 100K Sheet map and report Department of Land and Water Conservation Sydney
Clark RN King TVV Klejwa M Swayze GA amp Vergo N 1990 High spectral resolution reflectance spectroscopy of minerals Journal of Geophysical Research 95(B8) 12653ndash12680
Cudahy TJ 1997 PIMA-II spectral characteristics of natural kaolins CSIRO Exploration and Mining Report 420R 57 pp
Cudahy TJ 2012 Satellite ASTER Geoscience Product Notes for Australia Version 1 7th August 2012 CSIRO ePublish No EP-30-07-12-44
Downes PM McEvilly R amp Raphael NM 2004 Mineral deposits and models Cootamundra 1250 000 map sheet area Quarterly Notes of the Geological Survey of New South Wales 116 1ndash38
Downes PM amp Seccombe PK 2008 Sulfur isotope signatures for orogenic gold deposits Lachlan Orogen New South Wales In Proceedings of PACRIM Congress 24ndash26 November 2008 AusIMM Gold Coast Queensland Australia
Duke EF 1994 Near infrared spectra of muscovite Tschermak substitution and metamorphic reaction process implications for remote sensing Geology 22 621ndash624
Gibson DL 1999 Explanatory notes for the 1500 000 Cobar regolith landform map CRC LEME Geological Survey of NSW Open File Report 76
Grove CI Hook SJ amp Paylor ED III 1992 Laboratory reflectance spectra of 160 minerals 04 to 25 micrometers NASA Jet Propulsion Laboratory report JPL Publication 92-2
Hewson R 2013 Using ASTER and geophysical mapping to assist exploration over Wagga Wagga 1100 000 sheet area Geological Survey of New South Wales File GS20131558
Hewson RD amp Cudahy TJ 2011 Issues Affecting Geological Mapping with ASTER Data A Case Study of the Mt Fitton Area South Australia In Ramachandran B Justice CO amp Abrahams MJ (eds) Land Remote Sensing and Global Environmental Change NASArsquos Earth Observing System and the Science of ASTER and MODIS Applications in ASTER pp 273ndash300 Springer-Verlag New York
Hewson RD Cudahy TJ Drake-Brockman J Meyers J amp Hashemi A 2006 Mapping geology associated with manganese mineralization using spectral sensing techniques at Woodie Woodie East Pilbara Exploration Geophysics 37 389ndash400
Hewson RD Cudahy TJ amp Huntington JF 2001 Geologic and alteration mapping at Mt Fitton South Australia using ASTER satellite-borne data In Geoscience and Remote Sensing Symposium 2001 IGARSS lsquo01 IEEE 2001 International vol2 724ndash726
Hewson RD Cudahy TJ Mizuhiko S Ueda K amp Mauger AJ 2005 Seamless geological map generation using ASTER in the Broken HillndashCurnamona Province of Australia Remote Sensing of Environment 99(1ndash2) 159ndash172
Hewson RD Mah A Dunne M amp Cudahy TJ 2003 Mapping mineralogical and structural relationships with satellite-borne ASTER and airborne geophysics at Broken Hill ASEG 16th Geophysical Conference and Exhibition Adelaide February 2003 Australian Society Exploration Geophysicists
Hewson R Robson D Mauger A Cudahy T Thomas M amp Jones S 2013 Extracting mineralogical and geomorphological information using new ASTER mineral maps with airborne geophysics Proceedings of the ASEGndashPESA 2013 23rd International Geophysical Conference and Exhibition 11ndash14 August 2013 Melbourne Australia
Hunt GR amp Ashley RP 1979 Spectra of altered rocks in the visible and near infrared Economic Geology 74 1613ndash1629
Huntington JF Cudahy TJ Yang K Scott KM Mason P Gray DJ Berman M Bischof L Reston M S Mauger AJ Keeling JL amp Phillips RN 1999 Mineral mapping with field spectroscopy for exploration ndash final report CSIROAMIRA Project P435 CSIRO Exploration and Mining Report 419R
Iwasaki A Fujisada H Akao H Shindou O amp Akagi S 2001 Enhancement of spectral separation performance for ASTERSWIR Proceedings of SPIE (International Society for Optical Engineering) 4486 42ndash50
Iwasaki A amp Tonooka H 2005 Validation of a crosstalk correction algorithm for ASTERSWIR IEEE Transactions on Geoscience and Remote Sensing 43(12) 2747ndash2751
Laukamp C Cudahy C Caccetta M Thomas M Close D amp Lennartz R 2013 Successful mineral exploration using multispectral remote sensing data ndash ASTER Geoscience Map of Australia In Proceedings 12th Biennial Meeting of the Society of Geology Applied to Mineral Deposits (SGA) Uppsala Sweden 12ndash15 August 2013
Lewis P amp Downes PM 2008 Mineral systems and processes in New South Wales a project to enhance understanding and assist exploration Quarterly Notes of the Geological Survey of New South Wales 128
McQueen KG 2008 A guide for mineral exploration through the regolith in the Cobar Region Lachlan Orogen New South Wales Cooperative Research Centre for Landscape Environments and Mineral Exploration
Michael S 2012 Satellite imagery the range and value CSIRO Publishing for Australian Society for Exploration Geophysicists Preview 2012(160) 20ndash25
Raymond O 1993 Wagga WaggandashKyeamba region geological map 1100 000 Australian Geological Survey Organisation Canberra
Ricchetti E 2000 Multispectral satellite image and ancillary data integration for geological classification Photogrammetric Engineering amp Remote Sensing 66(4) 429ndash435
Rowan LC amp Mars JC 2003 Lithologic mapping in the Mountain Pass California area using Advanced Spaceborne Thermal Emission and Reflection Radiometer (ASTER) data Remote Sensing of Environment 84 350ndash366
Salisbury JW amp DrsquoAria DM 1992 Emissivity of terrestrial materials in the 8ndash14 μm atmospheric window Remote Sensing of Environment 42 83ndash106
Scarth P Roumlder A amp Schmidt M 2010 Tracking grazing pressure and climate interaction ndash the role of Landsat fractional cover in time series analysis In Proceedings of the 15th Australasian Remote Sensing and Photogrammetry Conference (ARSPC) 13ndash17 September Alice Springs Australia
Sherman DM 1985 The electronic structures of Fe3+ coordination sites in iron oxides application to spectra bonding and magnetism Physics and Chemistry of Minerals 12 161ndash175
Vincent RK amp Thomson F 1972 Spectral compositional imaging of silicate rocks Journal of Geophysical Research 77(14) 2465ndash2472
Yamaguchi Y Fujisada H Kahle A Tsu H Kato M Watanabe H Sato I amp Kudoh M 2001 ASTER instrument performance operation status and application to earth sciences In Geoscience and Remote Sensing Symposium 2001 IGARSS lsquo01 IEEE 2001 International vol3 1215ndash1216
26 May 2014
ShippingCONTACT Please note that we cannot ship to PO boxes
Product Order Form All prices are in Australian dollars and include Goods and Services Tax at 10 unless otherwise noted Only Australian orders are subject to the GST and all international orders will be processed exclusive of GST All totals will be billed in Australian Dollars International customers will be charged the equivalent of this rate in their respective currencies at the time the bank processes the transaction
Credit card surcharge MasterCard 04 Visa 04 AMEX 15 Diners Club 24 Other payment (NA)
Subtotal (excl GST for internationals)
TOTAL
Be sure to select international postage above if you are an overseas customer
Item Quantity Line Total Price (incl GST)
International $45 (excl GST) Postage Domestic $8 (1-2 items) $10 (3-5 items) $12 (5+ items) Express $13
o f f i c e
U S E
o n l y
FULL NAME JOB TITLE
ORGANISATION STREET ADDRESS
CITY STATE POSTCODE COUNTRY
PHONE EMAIL
CARD NUMBER NAME ON CARD
CARDHOLDER SIGNATURE DATE EXPIRY SECURITY CODE
We accept payment by credit card cheque or money order (made payable to NSW Department of Trade amp Investment) Payment
Return
Did you know Selected products can be purchased from the NSW Government Online Shop wwwshopnswgovau
Information and Customer Service Centre NSW Department of Trade amp Investment PO Box 344 Hunter Region Mail Centre NSW 2310
mineralpublicationordersindustrynswgovau
+61 2 4931 6700 Enquiries +61 2 4931 6666
wwwresourcesnswgovau
NSW Trade amp Investment Division of Resources amp Energy 516 High Street Maitland NSW 2320 PO Box 344 Hunter Region Mail Centre NSW 2310 T1300 736 122 T (02) 49316666
wwwresourcesnswgovau
Second edition Bathurst metallogenic 1250 000 map
Replacing the popular 1972 edition the updated map shows 311 metallic industrial construction material and fuel deposits classified by size commodity and deposit type A deposit classification scheme is included along with a timendashspace plot showing major mineralising events
On the back of the map is a comprehensive poster summarising the mining history and geological history of the area It features many colourful and historic images a locality map and a mining timeline
Cost $1980
- _GoBack
- 141726f49c7572d0__MailEndCompose
-
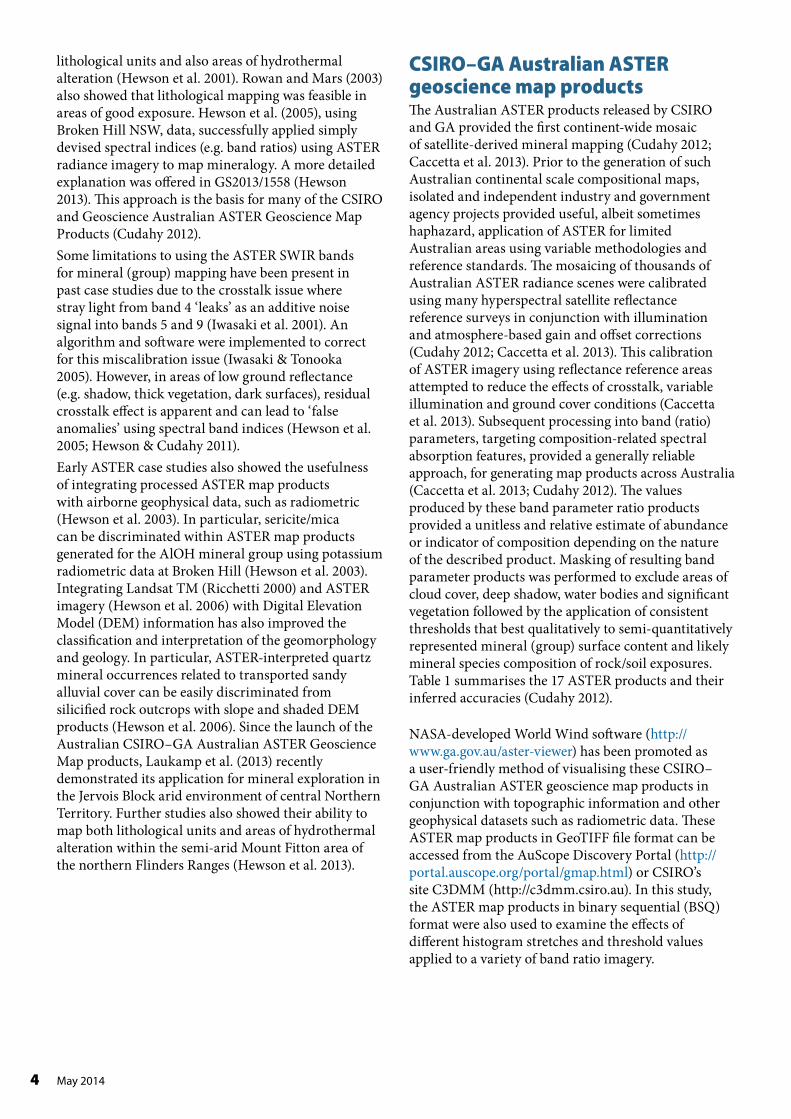
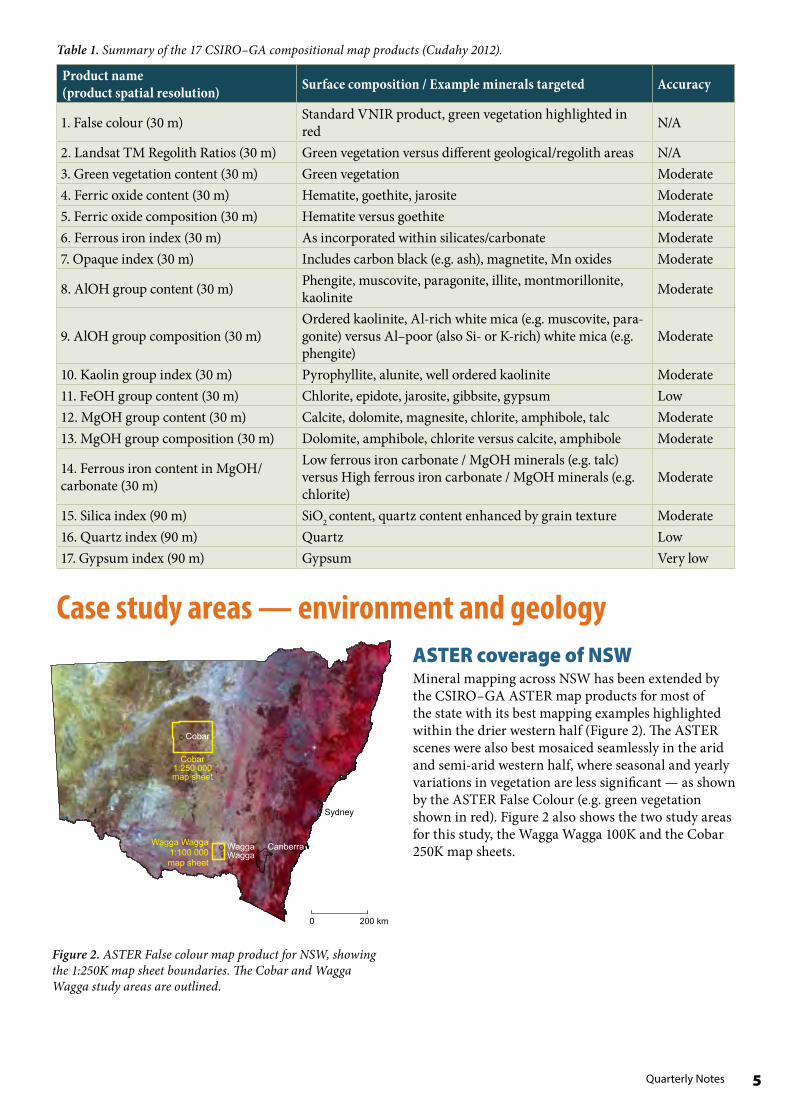
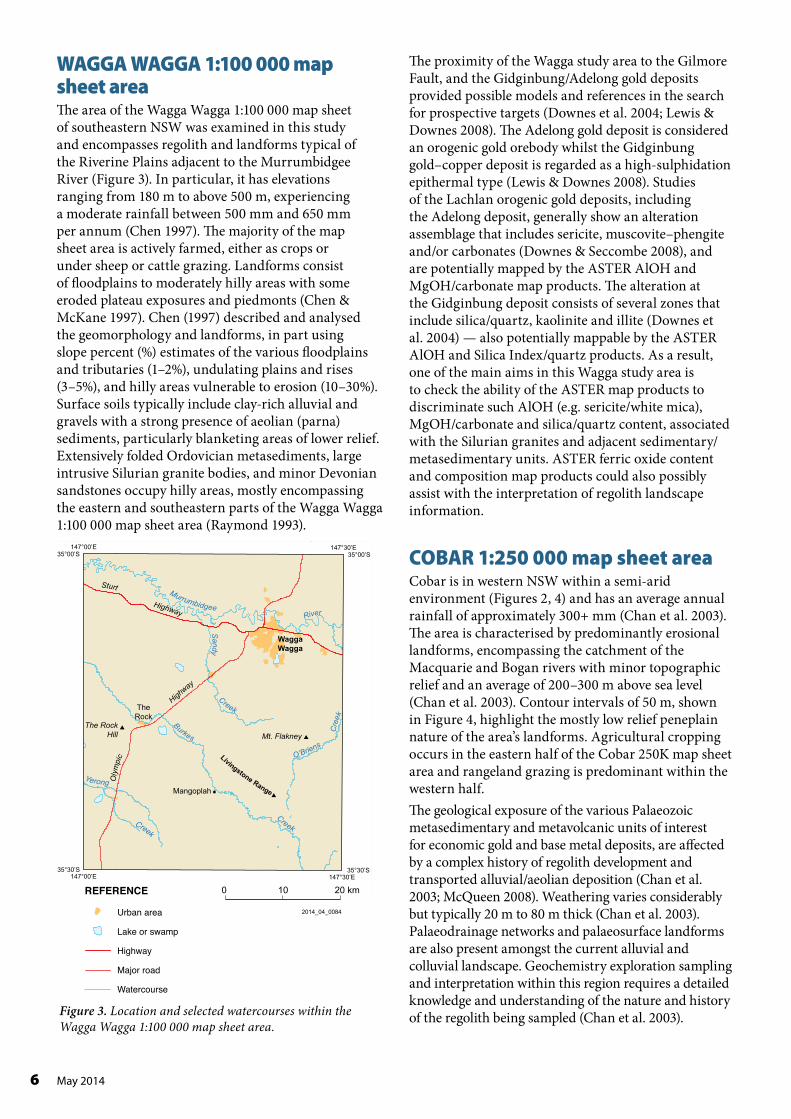
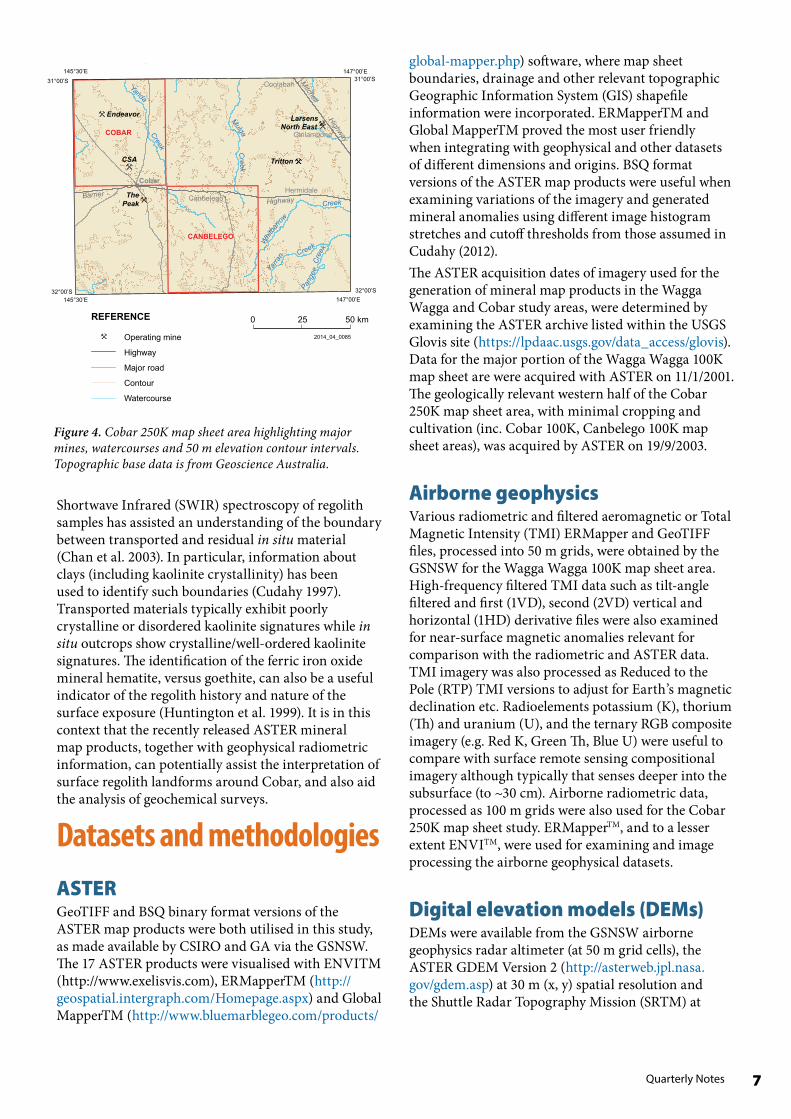
Quarterly Notes
B a r r i e r H i g h w a y
Highway
Mitchell
Hermidale
Girilambone
Canbelego
Coolabah
Cobar
North East Larsens
CSA
The Peak
Endeavor
Tritton
200
250
200
200
200
200
200
200
200
250
250
250
250
250
250
250
200
200
300
300
300
350
350
300
Yanda
Mulga
Whit
barro
w
Creek
C r e e k
Yarra
n
C r e e k
Creek
C re
ek
Pange
e
COBAR
CANBELEGO
145deg30rsquoE
145deg30rsquoE 147deg00rsquoE
31deg00rsquoS 147deg00rsquoE
31deg00rsquoS
32deg00rsquoS 32deg00rsquoS
REFERENCE 0 25 50 km
Operating mine 2014_04_0085
Highway
Major road
Contour
Watercourse
Figure 4 Cobar 250K map sheet area highlighting major mines watercourses and 50 m elevation contour intervals Topographic base data is from Geoscience Australia
Shortwave Infrared (SWIR) spectroscopy of regolith samples has assisted an understanding of the boundary between transported and residual in situ material (Chan et al 2003) In particular information about clays (including kaolinite crystallinity) has been used to identify such boundaries (Cudahy 1997) Transported materials typically exhibit poorly crystalline or disordered kaolinite signatures while in situ outcrops show crystallinewell-ordered kaolinite signatures The identification of the ferric iron oxide mineral hematite versus goethite can also be a useful indicator of the regolith history and nature of the surface exposure (Huntington et al 1999) It is in this context that the recently released ASTER mineral map products together with geophysical radiometric information can potentially assist the interpretation of surface regolith landforms around Cobar and also aid the analysis of geochemical surveys
Datasets and methodologies ASTER GeoTIFF and BSQ binary format versions of the ASTER map products were both utilised in this study as made available by CSIRO and GA via the GSNSW The 17 ASTER products were visualised with ENVITM (httpwwwexelisviscom) ERMapperTM (http geospatialintergraphcomHomepageaspx) and Global MapperTM (httpwwwbluemarblegeocomproducts
global-mapperphp) software where map sheet boundaries drainage and other relevant topographic Geographic Information System (GIS) shapefile information were incorporated ERMapperTM and Global MapperTM proved the most user friendly when integrating with geophysical and other datasets of different dimensions and origins BSQ format versions of the ASTER map products were useful when examining variations of the imagery and generated mineral anomalies using different image histogram stretches and cutoff thresholds from those assumed in Cudahy (2012) The ASTER acquisition dates of imagery used for the generation of mineral map products in the Wagga Wagga and Cobar study areas were determined by examining the ASTER archive listed within the USGS Glovis site (httpslpdaacusgsgovdata_accessglovis) Data for the major portion of the Wagga Wagga 100K map sheet are were acquired with ASTER on 1112001 The geologically relevant western half of the Cobar 250K map sheet area with minimal cropping and cultivation (inc Cobar 100K Canbelego 100K map sheet areas) was acquired by ASTER on 1992003
Airborne geophysics Various radiometric and filtered aeromagnetic or Total Magnetic Intensity (TMI) ERMapper and GeoTIFF files processed into 50 m grids were obtained by the GSNSW for the Wagga Wagga 100K map sheet area High-frequency filtered TMI data such as tilt-angle filtered and first (1VD) second (2VD) vertical and horizontal (1HD) derivative files were also examined for near-surface magnetic anomalies relevant for comparison with the radiometric and ASTER data TMI imagery was also processed as Reduced to the Pole (RTP) TMI versions to adjust for Earthrsquos magnetic declination etc Radioelements potassium (K) thorium (Th) and uranium (U) and the ternary RGB composite imagery (eg Red K Green Th Blue U) were useful to compare with surface remote sensing compositional imagery although typically that senses deeper into the subsurface (to ~30 cm) Airborne radiometric data processed as 100 m grids were also used for the Cobar 250K map sheet study ERMapperTM and to a lesser extent ENVITM were used for examining and image processing the airborne geophysical datasets
Digital elevation models (DEMs) DEMs were available from the GSNSW airborne geophysics radar altimeter (at 50 m grid cells) the ASTER GDEM Version 2 (httpasterwebjplnasa govgdemasp) at 30 m (x y) spatial resolution and the Shuttle Radar Topography Mission (SRTM) at
7
2014_04_0086a
80 m (x y) spatial resolution (httpwww2jplnasa govsrtm) Higher resolution SRTM DEMs at 30 m (x y) were also accessible via the NSWGS for this particular government study although were found to be somewhat noisy within the Wagga Wagga and Cobar areas ENVITM was used to process DEM data into topographic models that included slope and artificial sun-shaded relief imagery The SRTM DEM information was found to generate the best slope product Figure 5a displays the SRTM 80 m slope for relief greater than 10 combined with landscapes of Chen (1997) highlighting that these steeper slopes occur within divisions IV and V
Auscover fractional landcover Australiarsquos land surface has been recently analysed for fractional cover percentages of bare ground (eg soil rock outcrop) green vegetation and dry vegetation cover as part of the Terrestrial Ecosystem Research Network (TERN httpwwwternorgau) Datasets are available as part of this project via the AusCover data facility (httpdataauscoverorgau) Several
different versions of fractional cover information based on different algorithms and satellite sensors have been generated and are currently in the process of validation across Australia In this study the satellite Landsat TM 5- and 7-based fractional cover analysis provided high 30 m spatial resolution for the Wagga Wagga and Cobar study areas This coverage information was generated by algorithms described by Scarth et al (2010) and available via AusCover as binary NetCDF data tiles (httpdataauscoverorg auxwikibinviewProduct+pagesLandsat+Fractio nal+CoverHLinktothedata) The Landsat fractional cover estimates were generated from imagery recorded within a few days of both the Wagga Wagga and Cobar ASTER image acquisition dates listed above Figure 5b displays the fractional cover product as a RGB composite for bare ground green and dry vegetation for the Wagga 100K map sheet area generated from Landsat 7 acquired on 1012001 In this study several masks based on the fractional cover layers were devised and applied on the ASTER maps However the photosynthetic vegetation fraction for values less than 45 were used to refine (ie filter) the final ASTER map examples
147deg00rsquoE 35deg00rsquoS
147deg00rsquoE 35deg30rsquoS
147deg30rsquoE 35deg30rsquoS
147deg30rsquoE 35deg00rsquoS
0 10 20 km
b) 147deg00rsquoE
35deg00rsquoS
147deg00rsquoE 35deg30rsquoS
147deg30rsquoE 35deg30rsquoS
147deg30rsquoE 35deg00rsquoS
a)
0 10 20 km
2014_04_0086b
Figure 5 a) Wagga Wagga 100K landscape divisions overlying SRTM 80 m DEM slope greater than 10 Blue 150 to Red 300m Landscape divisions (I) Murrumbidgee floodplains (II) alluvial plains of local streams (III) undulating plains rises and long footslopes (IV) hilly areas and (V) eroded plateau and piedmont plains (Chen 1997) b) Wagga 100K Landsat 7-derived fractional cover RGB image Red bare ground Green photosynthetic vegetation Blue non-photosynthetic vegetation (linear stretch 0ndash100)
8 May 2014
Quarterly Notes
Burkes
Creek
Sandy Creek
Murrumbidgee River
OrsquoBriens
Cre
ek
Yerong
Creek
Oly
mpi
c
Highway
Highway
Sturt
147deg00rsquoE 147deg30rsquoE35deg00rsquoS 35deg00rsquoS REFERENCE
WP75 Cza AlluviumWP76
Czg Gravelly siltstone colluviumWP74 WP73 WP72
WP77 Du Sandstone minor conglomerate siltstone
OR
DO
VIC
IAN
S
ILU
RIA
ND
EV
ON
IAN
CE
NO
ZOIC
Wagga Svu Quartzndashfeldspar phyric felsic volcanicsWagga
WP60 Sgb Buchargingah granite
WP21 Sgc Collingullie Granite
Sgf Mount Flakney Granite
Sgk Kyeamba Monzogranite
Sgr Burrandana granite
Sgw Wantabadgery Granite
Ou Siltstone shale phyllite minor schist quartzite
WP9
WP10 WP20 WP23 WP34 WP22WP11 WP19WP32
WP31 WP24WP62 WP36 WP17WP43 The Rock WP16
WP12WP58 WP13 WP15WP64 WP25WP66
WP63 WP14
WP26WP27WP49 WP28WP50 WP29 Waypoint
Highway WP47
WP71WP70WP57Yerong Creek
WP56 WP69WP51 WP54 WP68 Major roadWP55 WP67WP53 Watercourse
Lake or swampWP52
147deg00rsquoE 35deg30rsquoS
147deg30rsquoE 35deg30rsquoS
0 10 20 km
2014_04_0087
Figure 6 Wagga Wagga 100K geological map (Raymond 1993) and the observed field localities (WP)
Data integration strategies Past integrated studies of spectral airborne geophysics and DEM data have shown the usefulness of simple RGB composite imagery such as ASTER-derived AlOH content with radiometric K draped over high-pass filtered magnetic data (Hewson et al 2003) Comparing ASTER products with slopes modelled from DEMs was found particularly useful for discriminating mineral occurrences associated with transported alluvium versus outcrop (Hewson et al 2006) In this study slope percent imagery derived from the Wagga Wagga 100K SRTM DEM data was processed with a threshold to extract (lsquomaskrsquo) only areas greater than 10 in order to focus on potentially hilly and piedmont rock talus outcrop exposures within the combined ASTERndash geophysics products Shaded relief imagery of the DEM was also used with ERMapperTM as an lsquoIntensityrsquo base layer to RGB composite imagery of ASTER and geophysics data products Shaded relief DEM imagery for the Wagga Wagga study area was generated assuming a sun elevation of 60deg and azimuth of 072deg to simulate the illumination conditions when the relevant ASTER imagery was acquired on 1112001 at 1030am
Field studies and sample spectroscopy Field sampling and validation of identified ASTER mineral map anomalies were undertaken in the Wagga Wagga area during April 2013 in the form of observed waypoints and as sampling localities A total of 69 localities were visited (lsquoWPxxrsquo Figure 6) of which 29 were sampled for rocks and soils Full descriptions of field waypoints sample localities and associated geologicallandform information are included within the GS20131558 DVD database (Hewson 2013) All collected field samples were measured with the Analytical Spectral Device Inc (ASD) Terraspec 4 VNIRndashSWIR spectrometer (httpwwwasdi comproductsterraspecterraspec-hi-res-mineralshyspectrometer) At this stage no validation or field sampling has been undertaken within the Cobar 250K map sheet area
9
GP5
GP6
a)ASTER validation study Several localities within the Wagga Wagga 100K map sheet area were used for validation or lsquoground truthrsquo sites for the ASTER map products The Wagga Wagga Airport and RAAF base provided useful dark ground targets to test for possible crosstalk issues (Figure 7a) The ASTER False Colour (Figure 7b) map product showed these dark or low-albedo surfaces Residual crosstalk effect is a possible explanation for the corresponding AlOH group content anomalies (red and green areas Figure 7c) Multiple
b)spectral reflectance measurements were undertaken at each site with the TerraSpec 4 (lsquoASDrsquo) spectrometer using its hand-held probe These measurements were averaged and resampled to ASTER spectral resolution to ascertain any possible AlOH-like SWIR signature (Figures 8a b) Tarmac at the Wagga Wagga Airport and the RAAF base exhibited low overall reflectance and an absence of any effective average ASTER AlOH spectral absorption signature centred at band 6 (2200 nm) (Figure 8a b) Additional validation sites were also studied to examine ASTERrsquos geologicalmineral mapping invariant targets with minimal vegetation In particular gravel pits within the Wagga Wagga 100K map sheet area were identified for sampling and ASD Terraspec measurements Waypoint WP52 (Sample WG21 site) within a granite gravel pit of approximately 100 m x 150 m was located on site (Figure 9 andashc) and within the 2001 ASTER map products (Figure 10andashc) The corresponding ASTER map products for the WP52WG21 site showed reasonable spatially coherent anomalies for the ASTER AlOH Silica Index and to a lesser extent the Ferric Oxide anomalies A four ASTER pixel subset within this gravel pit gave AlOH group content and ferric iron content values of 227 and 14 respectively ASD derived equivalent ASTER AlOH group content and ferric iron content ratio products gave favourably comparable values of 242 and 147 respectively Within the same gravel pit subset area the Landsat derived fractional photosynthetic (eg green veg) cover product also showed a low cover value of 23 (Figure 10d)
a) b) 025 025
02 02
WP61
WP60
c)
WP61
WP60
250m 2014_04_0088
Figure 7 a) Google Earth image of ASTER validation sites at Wagga Wagga Airport (GP5) waypoints WP59 WP60 and RAAF parade ground (GP6) waypoint WP61 b) ASTER False colour image c) ASTER AlOH group content (purpleblue low to red high content)
Ref
lect
ance
015
Ref
lect
ance
015
Mean ASTER Equivalent 01 Mean + Std Dev ASTER 01
Mean ASTER Equivalent Mean + Std Dev ASTER Mean - Std Dev ASTER Mean - Std Dev ASTER Mean ASD Mean ASD
005 005
0 0 550 1050 1550 2050 2000 2050 2100 2150 2200 2250 2300 2350 2400
Wavelength (nm) Wavelength (nm) 2014_04_0089
Figure 8 Wagga Wagga Airport tarmac (WP59ndash60) ASD and resampled ASTER equivalent signature (mean plusmn standard deviation) for a) the VNIRndashSWIR wavelengths and b) close up for SWIR wavelengths
10 May 2014
Quarterly Notes
a) b)
c) wg21a_af00 Figure 9 a) Google Earth image of ASTER geological wg21a_af01 validation site WP52WG21 b) Granitic gravel pit at WP52 wg21r_bf00 WG21 c) ASD Terraspec spectral signatures of granitegravel wg21r_bf01 showing ferric iron and pronounced AlOH diagnostic spectral wg21r_cf00 features at 880 nm to 1000 nm and 2208 nm respectively wg21r_cf01 Equivalent ASTER resampled signatures (asterisks) show
05 detectable features particularly for the AlOH SWIR feature 04
03
02
Hematite (880 nm) 01
Goethite (1000 nm) Al-poor mica (2208 nm)
00 400 900 1400 1900 2400
Wavelength (nm)
2014_04_0090
a) b)
Ref
lect
ance
WG21 WG21
c) d)
WG21
WG21
2014_04_0091250m
Figure 10 a) ASTER False Colour image of WP52 granitic gravel pit b) ASTER AlOH group content c) ASTER Silica Index d) Landsat fractional cover ndash photosynthetic cover Images bndashd display map product values from low (purpleblue) to high (red) values Grid cell is 250 m square
11
Results
WAGGA WAGGA 1100 000 map sheet area ASTER map products The Australian ASTER GeoTIFF map products were initially examined individually for the Wagga Wagga 100K map sheet area Several of the 17 products did not show significant anomalies related to geological features and were limited to (cultivated) cropping patterns at best In particular the ASTER imagery used here was acquired in mid-summer 2001 and highlighted exposed fallow fields and soils (Figure 11) The ASTER False Colour map product (Figure 11) also highlighted the town of Wagga Wagga and several vegetated areas with topographic relief (dark red to dark grey) A slight boundary anomaly is apparent at the extreme northwestern edge of the 100K scene from a change of ASTER image scenes ASTERrsquos green vegetation content product (Figure 12a) corresponds approximately with areas of red shown in the ASTER false colour product (Figure 11) although this green vegetation content product is is more correctly generated by a band ratio (bands 3band 2) targeting the chlorophyll lsquored edgersquo Exposed soil and fallow crop fields have no or low green vegetation anomalies (blue) on the floodplains and lowlands while vegetation is highlighted
Wagga Wagga
Vegetated relief
Murrumbidgee River Flood Plain
147deg00rsquoE 35deg00rsquoS
147deg00rsquoE 35deg30rsquoS
147deg30rsquoE 35deg30rsquoS
147deg30rsquoE 35deg00rsquoS
2014_04_0092
0 10 20 km
Figure 11 ASTER false colour products within Wagga Wagga 100K map sheet area
147deg00rsquoE 35deg00rsquoS
147deg00rsquoE 35deg30rsquoS
147deg30rsquoE 35deg30rsquoS
147deg30rsquoE 35deg00rsquoS
0 10 20 km
147deg00rsquoE 35deg00rsquoS
147deg00rsquoE 35deg30rsquoS
147deg30rsquoE 35deg30rsquoS
147deg30rsquoE 35deg00rsquoS
2014_04_0093
Figure 12 a) Wagga Wagga 100K ASTER green vegetation product (blue low red high content) b) ASTER AlOH content (blue low red high content)
within areas of topographic relief (Figures 11 12a) ASTERrsquos AlOH content product (Figure 12b) shows very limited clay anomalies except for the Wagga Wagga township and an apparent association with vegetated occurrences shown in the green vegetation product (Figure 12a) A green vegetation mask based on the ASTER product was applied during the generation of the AlOH composition map product and minimal anomalies were apparent
12 May 2014
13 Quarterly Notes
147deg00rsquoE 35deg00rsquoS
147deg00rsquoE 35deg30rsquoS
147deg30rsquoE 35deg30rsquoS
147deg30rsquoE 35deg00rsquoS
0 10 20 km
147deg00rsquoE 35deg00rsquoS
147deg00rsquoE 35deg30rsquoS
147deg30rsquoE 35deg30rsquoS
147deg30rsquoE 35deg00rsquoS
2014_04_0094
Figure 13 a) Wagga Wagga 100K ASTER ferric oxide content (blue low red high) and b) composition map products Apparent trends in the ferric oxide content are shown in red dashed lines
ASTERrsquos ferric oxide content and composition products (Figures 13a b) show elevated values in contrast with the AlOH group content product (Figure 12b) There is also some variation in composition from the interpreted goethite-rich (bluendashcyan) to hematite-rich (redndashyellow) (Figure 13b) Some linear trends were
Figure 13a) show boundaries and possible lineaments related to floodplain alluvium regolith or geological units Although Cudahy (2012) described the ferric oxide content as having moderate accuracy a comment is also noted for the potential of pixel spectral mixing errors and an inverse relationship with the green vegetation product This could also be either related to the obscuring effect of vegetationcrops or spectral signature ambiguities given the proximity of VNIR spectral features The ASTER FeOH and ferrous iron products in the Wagga Wagga 100K map sheet area did not generate coherent or distinct features apart from some isolated paddock anomalies The ASTER MgOH group content and composition products showed minimal occurrences except for some anomalies in the far southwestern corner which occupied farm fields adjacent to Ordovician metasedimentary rocks Likewise the kaolinite group Index showed only minor anomalies Both the ASTER MgOH group content and composition and kaolinite index products were masked for green vegetation during processing (Cudahy 2012) The Silica Index (Figure 14) proved to have less noise and highlighted more anomalies than the ASTER quartz index although the range in values and image contrast were limited Subtle anomalies highlighted by the Silica Index generally occurred within paddocks corresponding to low green vegetation and also as broader subtle variations (Figure 14)
147deg00rsquoE 35deg00rsquoS
147deg00rsquoE 35deg30rsquoS
147deg30rsquoE 35deg30rsquoS
147deg30rsquoE 35deg00rsquoS
2014_04_0095
Figure 14 Wagga Wagga 100K map sheet area ASTER silica index
apparent although the anomalies were often biased by the cropping patterns and exposed paddock soils Nonetheless some linear trends (red dashed lines in
Burkes
Creek
Sandy Creek
Murrumbidgee River
OrsquoBriens
Cre
ek
Yerong
Creek
Oly
mpi
c
Highway
Highway
Sturt
a) b)
147deg00rsquoE 147deg30rsquoE 147deg00rsquoE 147deg30rsquoE 35deg00rsquoS 35deg00rsquoS 35deg00rsquoS 35deg00rsquoS
Bulloc Bulloc Range Burngoogee Ranges
Melebo Mountains
35deg30rsquoS 35deg30rsquoS 35deg30rsquoS 35deg30rsquoS 147deg00rsquoE 147deg30rsquoE 147deg00rsquoE 147deg30rsquoE
0 10 20 km 0 10 20 km
2014_04_0096a 2014_04_0096b
Figure 15 a) Wagga Wagga 100K SRTM 80 m slope (blue low red high) b) SRTM 80 m sun-shaded imagery draped with ASTER green vegetation product (Figure 12a) masked for slope gt10
147deg00rsquoE 147deg30rsquoE35deg00rsquoS 35deg00rsquoS REFERENCE
OR
DO
VIC
IAN
S
ILU
RIA
ND
EV
ON
IAN
CE
NO
ZOICWP75 Cza Alluvium
Czg Gravelly siltstone colluvium
Du Sandstone minor conglomerate siltstone
WP76
WP74 WP73 WP72
WP77
Wagga Svu Quartzndashfeldspar phyric felsic volcanicsWagga
WP60 Sgb Buchargingah granite
WP21 Sgc Collingullie Granite
Sgf Mount Flakney Granite
Sgk Kyeamba Monzogranite
Sgr Burrandana granite
Sgw Wantabadgery Granite
Ou Siltstone shale phyllite minor schist quartzite
WP9
WP10 WP20 WP23 WP34 WP22WP11 WP19WP32
WP31 WP24WP62 WP36 WP17WP43 The Rock WP16
WP12WP58 WP13 WP15WP64 WP25WP66
WP63 WP14
WP26WP27WP49 WP28WP50 WP29 WaypointWP47
WP71WP57 Highway WP70
WP56 WP69Yerong Creek WP51 WP54 WP68 Major roadWP55
WP67WP53 Watercourse
WP52 Lake or swamp
35deg30rsquoS 35deg30rsquoS 0 10 20 km 147deg00rsquoE 147deg30rsquoE
2014_04_0097
Figure 16 Wagga Wagga 100K geology map (Raymond 1993) combined with SRTM 80 m slope gt10 showing geological units within areas of high relief
14 May 2014
15 Quarterly Notes
The nature of the geomorphology and extensive agricultural cultivation of the Wagga Wagga 100K sheet area prompted the use of DEM data to discriminate the likely geologically exposed areas Processing the SRTM 80 m DEM for slope information highlighted the major ranges and topographic relief (Figure 15a) Sun-shaded DEM imagery also highlighted these landforms (Figure 15b) Generation of a mask based on slopes greater than 10 was useful to observe relationships with the various ASTER products For example when ASTERrsquos green vegetation product masked within areas of slope gt10 is combined with sun-shaded imagery much of the higher relief is observed to be moderately to highly vegetated (Figure 15b) Figure 16 shows simplified geological units combined with SRTM data An attempt to overcome the limited range of anomalies observed within the Wagga Wagga 100K ASTER silica index product (Figure 14) using a histogram equalisation stretch within the same data range highlighted both more noise and some coherent anomalies (Figure 17a) Masking of this product with SRTM Slope product greater than 10 (Figure 17b) helped to discriminate exposed geological units as shown in Figure 16 Elevated areas of the quartz-rich sandstone of Bulloc Bulloc Range and metasedimentary rock of Livingstone National Park were highlighted by this approach (Figure 17b)
Geophysical products A similar approach to displaying and enhancing the Wagga Wagga 100K ASTER map products was applied to the airborne radiometric data where anomalous regions were extracted within the areas of elevated slope Histogram equalisation stretching of the K Th and U radioelements highlighted a mixture of alluvial deposition and outcropping geology (Figure 18a) The potassium data coherently mapped the alluvium and floodplains of Burkes Creek and the Murrumbidgee River (Figure 18a) The Mount Flakney Granite and the Bulloc Bulloc Range Ordovician (Ou) and Devonian sandstones (Du) were highlighted as anomalous using the entire 100K map sheet dataset (with histogram equalisation) but more subtle variations in radioelement composition were apparent when slope masking was applied and a simple 2 linear histogram was applied for image stretching (Figure 18b) Compositional variations within these units appeared to be enhanced by limiting the focus to areas of higher relief Increased thicknesses of aeolian deposits alluvium or colluvium on lowlands and areas of reduced slope may mask and dilute radiometric sensing of some of these units
2014_04_0098a
147deg00rsquoE 35deg00rsquoS
147deg00rsquoE 35deg30rsquoS
147deg30rsquoE 35deg30rsquoS
147deg30rsquoE 35deg00rsquoS
147deg00rsquoE 35deg00rsquoS
147deg00rsquoE 35deg30rsquoS
147deg30rsquoE 35deg30rsquoS
147deg30rsquoE 35deg00rsquoS
2014_04_0098b
0 10 20 km
Figure 17 a) Wagga Wagga 100K ASTER Silica Index product generated with a histogram equalisation stretch b) Histogram equalised ASTER silica index masked for slope gt10 (purple blue low to red high content) Areas highlighted are Bulloc Bulloc Range (white) and Livingstone National Park (yellow)
a)
b)
2014_04_0099
16 May 2014
a)
Bullo
c Bu
lloc
Rang
e D
uO
u
Mt F
lakn
ey G
rani
te
Mur
rum
bidg
ee R
iver
Burkes Creek
K U
Te
rnar
y K
Th U
Th
b)
Slop
e m
aske
d Te
rnar
ySl
ope
mas
ked
K Sl
ope
mas
ked
ThSl
ope
mas
ked
U
Figu
re 1
8 a
) Wag
ga W
agga
100
K a
irbor
ne ra
diom
etri
c dat
a K
Th U
and
as a
Ter
nary
imag
e (RG
B K
Th U
) di
spla
yed
with
a h
istog
ram
equa
lisat
ion
stre
tch
b)
K Th
U T
erna
ry im
age m
aske
d fo
r slo
pes gt
10
disp
laye
d w
ith a
2
line
ar h
istog
ram
stre
tch
Geo
logi
cal f
eatu
res d
iscus
sed
in te
xt a
re ci
rcle
d
17 Quarterly Notes
0 10 20 km
c) d)
a) b)
Bulloc Bulloc Range DuOu
Mt Flakney Granite (Sgf)
Figure 19 Apparent trends in the ASTER ferric oxide content (from Figure 13a) are shown as red dashed lines a) TMI 1VD (greyscale) overlain with ASTER ferric oxide content b) TMI 1VD (greyscale) overlain with K Th U Ternary RGB imagery (Red K Green Th Blue U) c) RTP TMI (greyscale) over tilt-filtered RTP TMI (pseudocolour) d) Sun-shaded SRTM DEM (greyscale) overlain with tilt-filtered TMI (pseudocolour)
Bulloc Bulloc Range DuOu
Mt Flakney Granite (Sgf)
Bulloc Bulloc Range DuOu
Mt Flakney Granite (Sgf)
2014_04_0100
Filtered aeromagnetic data for the Wagga Wagga 100K map sheet area were used in an effort to extract structural information and also to highlight near-surface trends of iron-bearing unitsmagnetite and possible correlations with the ASTER map products ASTERrsquos ferric oxide content showed some trends albeit revealed within exposed paddocks (Figure 13a) that showed northwest-trending and some possible northeast-trending features that correlated approximately with First Vertical Derivative (1VD) TMI lineaments (Figure 19a) The VNIR spectral signature of magnetite is essentially aspectral and not likely to be revealed by the ASTER Ferric Oxide Content product directly However weathering of magnetite-bearing rocks may possibly be associated with increased ferric iron oxide minerals within soils exposed here Integrating radiometric ternary imagery over TMI 1VD (Figure 19b) reveals similar northwest trends as Figure 19a In addition Figure 19b reveals a
complex series of north-northwest-trending lineaments along the western boundary of the K-rich Mount Flakney Granite and northwest-trending lineaments east of the sheared Bulloc Bulloc Range Devonian and Ordovician units RTP TMI over tilt-filtered Reduced to the Pole (RTP) TMI (Figure 19c) highlighted several lineaments with some corresponding to those interpreted with ASTER ferric oxide and radiometric data (Figure 19a b) The integration of tilt-filtered TMI over sun-shaded SRTM DEM (Figure 19d) also revealed some correlation of northndashnorth-northwest and cross-cutting north-northeast lineaments with topographic relief and valleys (Figure 5a) related to either outcropping geological units or possible structural and tectonic movements The tilt-filtered TMI within this Wagga 100K area appears to reveal increased high-frequency features and anomalies useful for detailed interpretation
REFERENCE
Highway
Major road
Watercourse
Lake or swamp
Cza
Czg
Du
Svu
Sgb
Sgr
Ou
Alluvium
Gravelly siltstone colluvium
Buchargingah granite
Burrandana granite
Sandstone minor conglomerate siltstone
Quartzndashfeldspar phyric felsic volcanics
Siltstone shale phyllite minor schist quartzite
CE
NO
ZOIC
DE
VO
NIA
NS
ILU
RIA
NO
RD
OV
ICIA
N
2014_04_0101
Yerong
Burkes
Creek
Cree
k
Creek
Stony
Watt
le
Creek
Hig
hway
Oly
mpi
c
The Rock
YerongCreek
A
B
147deg00rsquoE
147deg00rsquoE 147deg14rsquoE
147deg14rsquoE
35deg12rsquoS 35deg12rsquoS
35deg24rsquoS 35deg24rsquoS
0 5 10 km
Yerong
Burkes
Creek
Cree
k
Creek
Stony
Watt
le
Creek
Hig
hway
Oly
mpi
c The Rock
Yerong Creek
A
B
147deg00rsquoE
147deg00rsquoE 147deg14rsquoE
147deg14rsquoE
35deg12rsquoS 35deg12rsquoS
35deg24rsquoS 35deg24rsquoS
0 5 10 km
REFERENCE
Cza
Czg
Alluvium
Gravelly siltstone colluvium
Du Sandstone minor conglomerate siltstone
Svu Quartzndashfeldspar phyric felsic volcanics
Buchargingah granite
Burrandana granite
Ou Siltstone shale phyllite minor schist quartzite
Highway
Major road
Watercourse
Lake or swamp
Sgb
Sgr
2014_04_0101
Figure 20 Location of The Rock Hill (A) and Flowerpot Hill (B) on part of the Wagga Wagga 100K geological map (Raymond 1993)
a) b) O
RD
OV
ICIA
N
SIL
UR
IAN
DE
VO
NIA
NC
EN
OZO
IC
c) d)
NA
NA
NA
NA
NA NAWG16
WG17 WG18
WG23
WG26
WG19
Mag Low-Demagnetisation (removal of iron via metasomatic fluid alteration)
Axis Axis
Mag Low Radiometrics ternary RGB K Th U
Radiometrics Potassium (Histogram equalised)
O 10km
2014_04_0102
Figure 21 The Rock Hill and Flowerpot Hill area of Figure 20 (approx) a) ASTER false colour b) RTP TMI over Tilt-filtered TMI c) Radiometrics Ternary (RGB K Th U) d) Radiometrics K (blue low red high) Major lineaments magnetic low and fold structure are shown NA = site not sampled in study
18 May 2014
b)REFERENCE
Waypoint site
Highway
Major road
Watercourse
Lake or swamp
Cza
Czg
Du
Svu
Sgb
Sgr
Ou
Alluvium
Gravelly siltstone colluvium
Buchargingah granite
Burrandana granite
Sandstone minor conglomerate siltstone
Quartzndashfeldspar phyric felsic volcanics
Siltstone shale phyllite minor schist quartzite
CE
NO
ZOIC
DE
VO
NIA
NS
ILU
RIA
NO
RD
OV
ICIA
N
2014_04_0103a
Yerong
Burke
s
Creek
Cree
k
Creek
Stony
Watt
le
Creek
Hig
hway
Oly
mpi
c
The Rock
YerongCreek
WP66WP63
WP37
WP56
WP57
WP50
WP35WP62
WP38
WP49
WP36
WP47
35deg23rsquoS147deg00rsquoE
147deg00rsquoE 147deg14rsquoE
35deg23rsquoS147deg14rsquoE
35deg14rsquoS35deg14rsquoS
0 5 10 km
Quarterly Notes
a) REFERENCE
Cza
Czg
Alluvium
Gravelly siltstone colluvium
CE
NO
ZOIC
Sandstone minor conglomerate siltstone
Mag Low ASTER AIOH content 35deg14rsquoS 35deg14rsquoS
35deg23rsquoS 35deg23rsquoS 147deg00rsquoE
147deg00rsquoE 147deg14rsquoE
147deg14rsquoE
2014_04_0103b
Yerong
Burke
s
Creek
Cree
k
Creek
Stony
Watt
le
Creek
Hig
hway
Oly
mpi
c
The Rock
Yerong Creek
WP66 WP63
WP37
WP56
WP57
WP50
WP35 WP62
WP38
WP49
WP36
WP47
35deg23rsquoS 147deg00rsquoE
147deg00rsquoE 147deg14rsquoE
35deg23rsquoS 147deg14rsquoE
35deg14rsquoS35deg14rsquoS
0 5 10 km
b)
c)
Du
Svu
Sgb
Sgr
Ou Siltstone shale phyllite minor schist quartzite
Waypoint site
Highway
Major road
Watercourse
Lake or swamp 2014_04_0103a
The Rock Hill and Flowerpot Hill Devonian and Ordovician metasedimentary units in the central western part of the Wagga Wagga 100K map sheet area (Figure 20) provided a useful target and potentially prospective area to closely examine ASTER and geophysical mapping issues and opportunities for data integration The ASTER false colour product highlights the elevated Bulloc Bulloc Range including The Rock and Flowerpot Hill surrounded by farm paddocks and cultivation (Figure 21a) The geophysics highlights some interesting lineaments a fold structure and a magnetic low (Figures 21bndashd) In particular the tilt-filtered TMI data shows a prominent pair of north-northwestndashsouth-southeast lineaments (Figure 21b) approximately parallel to the apparent hinge linefold axis of the DevonianOrdovician metasedimentary rocks (Figure 21c d) and also bounding a likely deep-seated magnetic low (Figure 21b) Ternary and K radiometric anomalies appear to cross-cut the
OR
DO
VIC
IAN
S
ILU
RIA
ND
EV
ON
IAN
Quartzndashfeldspar phyric felsic volcanics
Buchargingah granite
Burrandana granite
ASTER silica index 35deg14rsquoS
35deg23rsquoS 35deg23rsquoS 147deg00rsquoE
147deg00rsquoE 147deg14rsquoE
147deg14rsquoE
35deg14rsquoS
0 5 10 km
2014_04_0103c
Devonian and Ordovician stratigraphy when they are overlain on the geology map (Figure 22a) A modified version of the ASTER AlOH content map masked for both SRTM-derived slopes greater than 10 and less than 45 Landsat-derived photosynthetic (PV or lsquogreenrsquo) vegetation fraction cover appears to highlight some increase in mica content in the main hinge line axis (red areas Figure 22b) Figure 22b was also displayed using histogram equalisation using thresholds described by Cudahy (2012) The silica index product with a histogram equalisation stretch also appears to highlight some increase in silica along the axis (Figure 22c) Field observations of increased quartz and ASD spectral measurements identifying AlOH minerals phengite and kaolinite (Figure 23) appear to confirm this interpretation Hematite is also common within The Rock Hill and Flowerpot Hill area
Figure 22 The Rock Hill and Flowerpot Hill a) Wagga Wagga 100K geological map with geophysical features from Figure 21 b) ASTER AlOH masked for gt10 slope and lt45 PV Landsat fraction histogram equalised Mica anomaly is circled c) ASTER silica index histogram equalised Silica anomaly is circled Purpleblue low to red high content
19
Ref
lect
ance
050
040
030
020
010
000
wg26r_bw00000
wg23r_bw00001
Hematite signature (860 nm) Al poor mica or Phengite (eg 2209 nm absorption)
400 900 1400 1900 2400
Wavelength (nm) 2014_04_0104
Figure 23 Example ASD spectral signature of rock outcrop samples (WG23 26 ndash see Figure 21a) at Flowerpot Hill showing Al-poor micaAlOH and hematite diagnostic features
ASTER data issues and qualifications on interpretation Acquisition of ASTER satellite imagery at about 1030 am (Australian Eastern Daylight Time) can potentially produce sharp shadows on steep westerly slopes within high relief areas The ASTER satellite sensor has an additional issue of potential false anomalies from the lsquocrosstalkrsquo mis-calibration of its shortwave IR sensor (bands 5ndash9) as used for the generation of AlOH or micaclay mineral maps Dark shaded areas appear on the western slopes of The Rock and Flowerpot Hill as a result of north- and northwest-trending ridgelines as shown in the sun-shaded DEM imagery generated to simulate illumination conditions on 1112001 at 1030 am (blue ellipses Figure 24a) These areas of deep shadow appear to be coincident with some of the AlOH anomalies (red ellipse Figure 22b) and potentially the result of false anomalies associated with crosstalk
0 4km a)
WP 62 WP 35
WP 36 WP 37
WP 33
WP 38
WP 65
WP 66
WP 58
WP 45
SRTM DEM sun shaded (el 60˚ Az 72˚)
b)
(Figure 24b) However areas of full illumination on the northeast slopes also show AlOH anomalies and the crosstalk explanation does not entirely negate the AlOH presence Overall these results suggest that residual crosstalk effects are a possibility within dark areas of shadow and vegetation cover and bitumen (eg the Wagga AirfieldRAAF base) The validation of ASTER study sites can be assisted with the aid of DEMs fractional cover information field observations and ideally a VNIRndashSWIR spectrometer
ASTER AIOH mica content (hist eq) masked for 45 lt green vegetationgt 10 slope
Figure 24 a) Sun-shaded SRTM 80 m DEM of The Rock Hill and Flowerpot Hill (60deg elevation 072deg azimuth) simulating illumination conditions and shaded relief during ASTER image acquisition (1112001) b) ASTER AlOH content and corresponding areas of shaded relief (dashed ellipses)
Figure 25 The Rock Reserve WP62 a) Casuarina open woodland b) ferruginous gravel with lichen and moss ground cover c) typical canopy cover
20 May 2014
Quarterly Notes
a) b) c)
WP62
WP35
WP36 WP37
WP38WP40 WP39
WP58
WP65 WP63
WP66
WP62
WP35
WP36 WP37
WP38WP40 WP39
WP58
WP65 WP63
WP66
WP62
WP35
WP36 WP37
WP38WP40 WP39
WP58
WP65 WP63
WP66
0 20 40 60 80 100 0 20 40 60 80 100 0 20 40 60 80
non-photosynthetic Bare ground photosynthetic
4km 2014_04_01060
Figure 26 a) ndash c) Landsat fractional cover estimates for The Rock Hill mdash the same area as in Figure 24
Field observations and ASD in-situ field measurements of gravel lag vegetation ground litter etc at Waypoint WP62 (Figure 22a 24a) were undertaken near The Rock (Figure 25andashc) AusCover fractional cover estimates using Landsat acquired 1012001 one day before the ASTER gave values of 18 bare ground 41 photosynthetic and 40 non-photosynthetic vegetation cover for supplied 30m pixels encompassing WP62 Fractional cover imagery for the Bulloc Bulloc RangeThe Rock shows that the cover is dominated by photosynthetic and to a lesser extent non-photosynthetic vegetation (Figures 26andashc) ASD in-situ field measurements of gravel lag vegetation and ground litter at WP62 were processed to simulate ASTER ferric oxide content and green vegetation indices (Figure 27) This limited series of measurements suggested that the presence of dry vegetation matter (eg lichen bark leaf litter) can hinder the ASTER interpretation of ferric iron (eg hematite goethite) useful for regolith profile information andor alteration involving hematisation (Figure 27) Simulated values for ASTERrsquos AlOH content index from W62 gravel
The Rock Hill - Waypoint 62
Green tree and shrub foliage ground moss Devonian ferruginous sandstone gravel lag Lichen bark and leaf litter
1 3
0
4
2
AST
ER -
Gre
en V
eget
atio
n
ASTER - Ferric Oxide Content
Figure 27 ASD field spectral signatures of vegetation and gravel samples from The Rock Hill (WP 62) resampled and processed into equivalent ASTER map indices for green vegetation and ferric oxide content
lag ASD measurements produced values between 19 and 215 within the threshold range used to generate ASTER AlOH content imagery (Cudahy 2012) This compares favourably with the ASTER AlOH content index value of 20 as an average for 2 x 30 m pixels at WP62 extracted from the map product
Cobar 1100 000 and Canbelego 1100 000 map sheet areas The ASTER map products over the Cobar 1250 000 map sheet area are less affected by agricultural cultivation than the Wagga Wagga area as highlighted by ASTERrsquos false colour showing only approximately 25 under cultivationcropping to the east (Figure 28a) Isolated cloud cover is also apparent in the eastern third of the Cobar 1250 000 map sheet area where the map product is generated from a separate ASTER scene (Figure 28a) ASTERrsquos regolith product is useful for highlighting the extensive ephemeral drainage patterns (Figure 28b) As described by Cudahy (2012) the Regolith product based on the Landsat TM Regolith ratios helps to separate regolith and geological units while vegetated areas are highlighted by whitebright areas and clouds in blue (Figure 28b) ASTERrsquos green vegetation product also shows the limited nature of the green vegetation cover restricted to watercourses outside of the cultivated areas (Figure 28c) The land cover is more explicitly highlighted in the Landsat-derived fractional cover image which shows that close to the time of ASTER acquisition (September 2003) the most exposed bare ground was within the Cobar 100K map sheet area and to a lesser extent Canbelego 100K (reddish areas Figure 28d) Non photosynthetic vegetation (lsquodry vegetationrsquo) still appears pervasive in the non-cultivated areas (blue areas Figure 28d) which may be an issue for some ASTER map products
21
100
c) d)
a) b)
145ordm30E 147ordm00E 145ordm30E 147ordm00E 31ordm00S 31ordm00S
32ordm00S 32ordm00S
145ordm30E 147ordm00E 145ordm30E 147ordm00E
31ordm00S 31ordm00S
32ordm00S 32ordm00S
Figure 28 Cobar 1250K map sheet area a) ASTER false colour Note clouds and shadows in lower right b) ASTER regolith colour coded as for standard CSIRO Landsat Regolith product (Cudahy 2012) c) ASTER green vegetation (blue low red high) d) Landsat fractional cover RGB Red bare ground Green photosynthetic vegetation Blue non-photosynthetic vegetation (linear stretch 0ndash100)
a) b) 145ordm30E 147ordm00E 145ordm30E 147ordm00E
31ordm00S 31ordm00S
32ordm00S32ordm00S
Figure 29 Cobar 1250K map sheet area a) ASTER ferric oxide content (blue low red high) b) ASTER ferric oxide composition (histogram equalised) (blue goethitic red hematitic) c) ASTER AlOH group content (histogram equalised) (blue low red high) Note that cloud cover in eastern 100K maps introduces false anomalies (see Figure 28a)
32ordm00S
31ordm00S
c) 145ordm30E 147ordm00E
31ordm00S
32ordm00S
2014_04_0109
22 May 2014
23 Quarterly Notes
a) b) 145ordm30E 147ordm00E 145ordm30E 147ordm00E
31ordm00S 31ordm00S
32ordm00S 32ordm00S
147ordm00E
31ordm00S 145ordm30E 147ordm00E 145ordm30E
31ordm00S
32ordm00S32ordm00S
Figure 30 a) ASTER AlOH group composition (histogram equalised) (blue Al-rich micawell ordered kaolinite red Al-poor mica) b) ASTER silica index (histogram equalised) (blue low red high) c) Radiometric K (blue low red high) d) Radiometric Th (blue low red high)
c) d)
2014_04_0110
The ASTER Ferric Oxide Content product highlights coherent and continuous spatial distribution across the Cobar 1250 000 sheet area with increased abundance within the Cobar 100K area (Figure 29a) An improved insight into the ferric iron oxide was provided by the ASTERrsquos ferric oxide composition using histogram equalisation (Figure 29b) rather than a Gaussian stretch within the same threshold stretch limits advised by Cudahy (2012) Using the histogram equalised version of the ASTER ferric oxide composition product highlights more clearly an apparent increase in hematitic composition within the western Cobar 250K including the Cobar 100K map sheet area (Figure 29b) The presence of hematite versus goethite may be important for regolith interpretation and understanding of the arearsquos possible lateritic weathering (Huntington et al 1999) However care should also be taken when interpreting ferric oxide content and composition in the presence of dry vegetation matter mdash as observed at The Rock Hill (Figure 27) and also noted by Cudahy (2012) The areas highlighted by ASTER with increased hematite also coincide with increased abundance of AlOH minerals as shown by the histogram equalised version of the ASTER AlOH group content (greenndashyellow areas Figure 29c) The ASTER AlOH group composition product (histogram equalised Figure 30a) highlights extensive
areas of low values (blue) in the western Cobar 250K sheet area including within the Cobar 100K Cudahy (2012) interpreted such low ASTER AlOH composition product values as mapping well-ordered kaolinite or Al-rich white mica These areas also appear to coincide with the interpreted hematite-rich areas shown in Figure 29b (red areas) If a lateritic profile mineral model (Huntington et al 1999) is assumed then questions arise whether these areas lie within the highly weathered hematite-bearing duricrust or less-weathered ordered kaolinite-bearing saprolite The ASTER kaolin group index product for Cobar 250K sheet area does not indicate significant anomalies using linear or histogram equalised versions Cobar regolith landform mapping indicates much of the Cobar 100K area is highly weathered in situ bedrock (Gibson 1999) However validation field work involving sampling and ASD measurements should clarify these issues The ASTER silica index product does appear to indicate high silica content along the western boundary of the Cobar 100K sheet area that coincides with elevated areas mapped by Gibson (1999) containing cappings of silicified sedimentary units (histogram equalised Figure 30b) Geophysical radiometric products K and Th also highlight distinctive units with the Cobar 100K and Canbelego 100K map sheet areas (Figures 30c d) The K and Th images mostly appear to map in an approximate complementary way areas of alluvial
a)
147ordm00E 31ordm00S
145ordm30E
32ordm00S
b) 145ordm30E 147ordm00E
31ordm00S
32ordm00S
Figure 31 a) RGB composite ASTERrsquos AlOH content (histogram equalised) ferric oxide content silica index (histogram equalised) b) RGB composite K ASTERrsquos ferric oxide content AlOH content over shaded DEM
(eg K) and in situ regolith units (eg Th) (Figures 30c d) In particular the drainage areas appear rich in apparently K-bearing clays (Figure 30c) whilst the Th occurs where there are non-drainage in situ relict areas (Figure 30c) possibly related to ferricrete Further ground truthing would help this interpretation An RGB composite image of ASTERrsquos AlOH group content ferric oxide content and silica index products appeared to discriminate generally elevated combined clay- and quartz-rich units (eg red+blue areas shown as purple) from ferric iron oxide minerals (green) within some drainage areas (Figure 31a) A RGB composite image of the radioelement K ASTER ferric oxide content and ASTER AlOH group content products also generated significant and complex spatially coherent patterns particularly within the Cobar and Canbelego 100K sheet areas that appear worthy of further examination for regolith information (Figure 31b)
2014_04_0111
Conclusions This project demonstrated within the NSW study areas of Wagga Wagga and Cobar the usefulness of the recently released Australia ASTER map products supplied by CSIROGA for identifying or discriminating variations in surface composition The map products included mineral identitiesgroups within geological units possible overprinted alteration andor weathered regolith These map products can potentially aid mineral exploration in NSW within semi-arid areas such as Cobar and to a lesser extent within open woodland and cultivated environments such as Wagga Wagga Although several ASTER map products provided useful information as individual entities their application generally benefits exploration when integrated with geophysical topographical and fractional land cover information In particular DEM-derived slope information and vegetation fractional data were used to mask and refine ASTER map products in the Wagga area within the temperate and vegetated Riverine Plains Anomalous AlOH- and silica-rich areas were discriminated and associated with radiometric and high frequency filtered TMI-inferred structures in the vicinity of the Bulloc Bulloc Range especially at The Rock Hill ASTER Ferric Iron Content product within the Wagga Wagga area also appeared to show northwest lineament trends similar to those highlighted by filtered TMI products Map generation for the Murrumbidgee floodplains using radiometric data also appeared to benefit from topographic slope masking to exclude areas of alluvial and aeolian transported cover More spatially coherent anomalous areas particularly related to the regolith were identified by the ASTER map products in the semi-arid and rangeland terrain of Cobar The application of different histogram stretches such as histogram equalisation was found to further enhance the display of anomalous features mdash although care should be applied regarding data thresholds The application of the ASTER map products individually as RGB composites or integrated with radiometric data appears useful for regolith mapping and identifying weathering profile-related mineralogy at Cobar Effects of residual ASTER crosstalk mis-calibration within areas of shadowdark surfacesdense vegetation and possible interpretation ambiguities between VNIR-derived ferric oxide and dry vegetation highlight the importance of validation fieldwork to check anomalous areas and their spectral signatures The validation of ASTER study sites may be assisted by DEM and fractional cover information Further investigations into the benefits of integrating artificially illuminated shaded topographic relief and AusCover fractional land cover information relevant for ASTER acquisition dates are recommended
24 May 2014
25 Quarterly Notes
Acknowledgements This study has been supported and funded by the Geological Survey of New South Wales in part for the purpose of contributing to the knowledge of the Wagga Wagga 1100 000 map sheet geology for mineral exploration Geophysical and associated data for the Wagga Wagga and Cobar study areas were received from the Geological Survey of New South Wales ASTER GeoTIFFs and BSQ ASTER map products were also gratefully obtained from Geoscience Australia and CSIROndashEarth Science amp Resource Engineering whilst the original ASTER imagery was made available by NASA and METI GIS shapefiles for the Wagga Wagga and Cobar 1250 000 map sheet areas were also gratefully obtained from Geoscience Australia Assistance is also gratefully acknowledged from Thomas Cuday and Carsten Laukamp of CSIRO and Matilda Thomas of Geoscience Australia Support from Professor Simon Jones and Laurie Buxton of RMIT University was also helpful during this study
References Caccetta M Collings S amp Cudahy C 2013 A calibration methodology for continental scale mapping using ASTER imagery Remote Sensing of Environment 139 306ndash317
Chan RA Greene RSB de Souza Kovacs N Maly BER McQueen KG amp Scott KM 2003 Regolith geomorphology geochemistry and mineralisation of the SussexndashCoolabah area in the CobarndashGirilambone region North-Western Lachlan Foldbelt NSW CRC LEME openfile report 148 NSW DMR Report GS2001319
Chen XY 1997 Quaternary sedimentation parna landforms and soil landscapes of the Wagga Wagga 1100 000 map sheet south-eastern Australia Australian Journal of Soil Research 35(3) 643ndash668
Chen XY amp McKane DJ 1997 Soil Landscapes of the Wagga Wagga 100K Sheet map and report Department of Land and Water Conservation Sydney
Clark RN King TVV Klejwa M Swayze GA amp Vergo N 1990 High spectral resolution reflectance spectroscopy of minerals Journal of Geophysical Research 95(B8) 12653ndash12680
Cudahy TJ 1997 PIMA-II spectral characteristics of natural kaolins CSIRO Exploration and Mining Report 420R 57 pp
Cudahy TJ 2012 Satellite ASTER Geoscience Product Notes for Australia Version 1 7th August 2012 CSIRO ePublish No EP-30-07-12-44
Downes PM McEvilly R amp Raphael NM 2004 Mineral deposits and models Cootamundra 1250 000 map sheet area Quarterly Notes of the Geological Survey of New South Wales 116 1ndash38
Downes PM amp Seccombe PK 2008 Sulfur isotope signatures for orogenic gold deposits Lachlan Orogen New South Wales In Proceedings of PACRIM Congress 24ndash26 November 2008 AusIMM Gold Coast Queensland Australia
Duke EF 1994 Near infrared spectra of muscovite Tschermak substitution and metamorphic reaction process implications for remote sensing Geology 22 621ndash624
Gibson DL 1999 Explanatory notes for the 1500 000 Cobar regolith landform map CRC LEME Geological Survey of NSW Open File Report 76
Grove CI Hook SJ amp Paylor ED III 1992 Laboratory reflectance spectra of 160 minerals 04 to 25 micrometers NASA Jet Propulsion Laboratory report JPL Publication 92-2
Hewson R 2013 Using ASTER and geophysical mapping to assist exploration over Wagga Wagga 1100 000 sheet area Geological Survey of New South Wales File GS20131558
Hewson RD amp Cudahy TJ 2011 Issues Affecting Geological Mapping with ASTER Data A Case Study of the Mt Fitton Area South Australia In Ramachandran B Justice CO amp Abrahams MJ (eds) Land Remote Sensing and Global Environmental Change NASArsquos Earth Observing System and the Science of ASTER and MODIS Applications in ASTER pp 273ndash300 Springer-Verlag New York
Hewson RD Cudahy TJ Drake-Brockman J Meyers J amp Hashemi A 2006 Mapping geology associated with manganese mineralization using spectral sensing techniques at Woodie Woodie East Pilbara Exploration Geophysics 37 389ndash400
Hewson RD Cudahy TJ amp Huntington JF 2001 Geologic and alteration mapping at Mt Fitton South Australia using ASTER satellite-borne data In Geoscience and Remote Sensing Symposium 2001 IGARSS lsquo01 IEEE 2001 International vol2 724ndash726
Hewson RD Cudahy TJ Mizuhiko S Ueda K amp Mauger AJ 2005 Seamless geological map generation using ASTER in the Broken HillndashCurnamona Province of Australia Remote Sensing of Environment 99(1ndash2) 159ndash172
Hewson RD Mah A Dunne M amp Cudahy TJ 2003 Mapping mineralogical and structural relationships with satellite-borne ASTER and airborne geophysics at Broken Hill ASEG 16th Geophysical Conference and Exhibition Adelaide February 2003 Australian Society Exploration Geophysicists
Hewson R Robson D Mauger A Cudahy T Thomas M amp Jones S 2013 Extracting mineralogical and geomorphological information using new ASTER mineral maps with airborne geophysics Proceedings of the ASEGndashPESA 2013 23rd International Geophysical Conference and Exhibition 11ndash14 August 2013 Melbourne Australia
Hunt GR amp Ashley RP 1979 Spectra of altered rocks in the visible and near infrared Economic Geology 74 1613ndash1629
Huntington JF Cudahy TJ Yang K Scott KM Mason P Gray DJ Berman M Bischof L Reston M S Mauger AJ Keeling JL amp Phillips RN 1999 Mineral mapping with field spectroscopy for exploration ndash final report CSIROAMIRA Project P435 CSIRO Exploration and Mining Report 419R
Iwasaki A Fujisada H Akao H Shindou O amp Akagi S 2001 Enhancement of spectral separation performance for ASTERSWIR Proceedings of SPIE (International Society for Optical Engineering) 4486 42ndash50
Iwasaki A amp Tonooka H 2005 Validation of a crosstalk correction algorithm for ASTERSWIR IEEE Transactions on Geoscience and Remote Sensing 43(12) 2747ndash2751
Laukamp C Cudahy C Caccetta M Thomas M Close D amp Lennartz R 2013 Successful mineral exploration using multispectral remote sensing data ndash ASTER Geoscience Map of Australia In Proceedings 12th Biennial Meeting of the Society of Geology Applied to Mineral Deposits (SGA) Uppsala Sweden 12ndash15 August 2013
Lewis P amp Downes PM 2008 Mineral systems and processes in New South Wales a project to enhance understanding and assist exploration Quarterly Notes of the Geological Survey of New South Wales 128
McQueen KG 2008 A guide for mineral exploration through the regolith in the Cobar Region Lachlan Orogen New South Wales Cooperative Research Centre for Landscape Environments and Mineral Exploration
Michael S 2012 Satellite imagery the range and value CSIRO Publishing for Australian Society for Exploration Geophysicists Preview 2012(160) 20ndash25
Raymond O 1993 Wagga WaggandashKyeamba region geological map 1100 000 Australian Geological Survey Organisation Canberra
Ricchetti E 2000 Multispectral satellite image and ancillary data integration for geological classification Photogrammetric Engineering amp Remote Sensing 66(4) 429ndash435
Rowan LC amp Mars JC 2003 Lithologic mapping in the Mountain Pass California area using Advanced Spaceborne Thermal Emission and Reflection Radiometer (ASTER) data Remote Sensing of Environment 84 350ndash366
Salisbury JW amp DrsquoAria DM 1992 Emissivity of terrestrial materials in the 8ndash14 μm atmospheric window Remote Sensing of Environment 42 83ndash106
Scarth P Roumlder A amp Schmidt M 2010 Tracking grazing pressure and climate interaction ndash the role of Landsat fractional cover in time series analysis In Proceedings of the 15th Australasian Remote Sensing and Photogrammetry Conference (ARSPC) 13ndash17 September Alice Springs Australia
Sherman DM 1985 The electronic structures of Fe3+ coordination sites in iron oxides application to spectra bonding and magnetism Physics and Chemistry of Minerals 12 161ndash175
Vincent RK amp Thomson F 1972 Spectral compositional imaging of silicate rocks Journal of Geophysical Research 77(14) 2465ndash2472
Yamaguchi Y Fujisada H Kahle A Tsu H Kato M Watanabe H Sato I amp Kudoh M 2001 ASTER instrument performance operation status and application to earth sciences In Geoscience and Remote Sensing Symposium 2001 IGARSS lsquo01 IEEE 2001 International vol3 1215ndash1216
26 May 2014
ShippingCONTACT Please note that we cannot ship to PO boxes
Product Order Form All prices are in Australian dollars and include Goods and Services Tax at 10 unless otherwise noted Only Australian orders are subject to the GST and all international orders will be processed exclusive of GST All totals will be billed in Australian Dollars International customers will be charged the equivalent of this rate in their respective currencies at the time the bank processes the transaction
Credit card surcharge MasterCard 04 Visa 04 AMEX 15 Diners Club 24 Other payment (NA)
Subtotal (excl GST for internationals)
TOTAL
Be sure to select international postage above if you are an overseas customer
Item Quantity Line Total Price (incl GST)
International $45 (excl GST) Postage Domestic $8 (1-2 items) $10 (3-5 items) $12 (5+ items) Express $13
o f f i c e
U S E
o n l y
FULL NAME JOB TITLE
ORGANISATION STREET ADDRESS
CITY STATE POSTCODE COUNTRY
PHONE EMAIL
CARD NUMBER NAME ON CARD
CARDHOLDER SIGNATURE DATE EXPIRY SECURITY CODE
We accept payment by credit card cheque or money order (made payable to NSW Department of Trade amp Investment) Payment
Return
Did you know Selected products can be purchased from the NSW Government Online Shop wwwshopnswgovau
Information and Customer Service Centre NSW Department of Trade amp Investment PO Box 344 Hunter Region Mail Centre NSW 2310
mineralpublicationordersindustrynswgovau
+61 2 4931 6700 Enquiries +61 2 4931 6666
wwwresourcesnswgovau
NSW Trade amp Investment Division of Resources amp Energy 516 High Street Maitland NSW 2320 PO Box 344 Hunter Region Mail Centre NSW 2310 T1300 736 122 T (02) 49316666
wwwresourcesnswgovau
Second edition Bathurst metallogenic 1250 000 map
Replacing the popular 1972 edition the updated map shows 311 metallic industrial construction material and fuel deposits classified by size commodity and deposit type A deposit classification scheme is included along with a timendashspace plot showing major mineralising events
On the back of the map is a comprehensive poster summarising the mining history and geological history of the area It features many colourful and historic images a locality map and a mining timeline
Cost $1980
- _GoBack
- 141726f49c7572d0__MailEndCompose
-
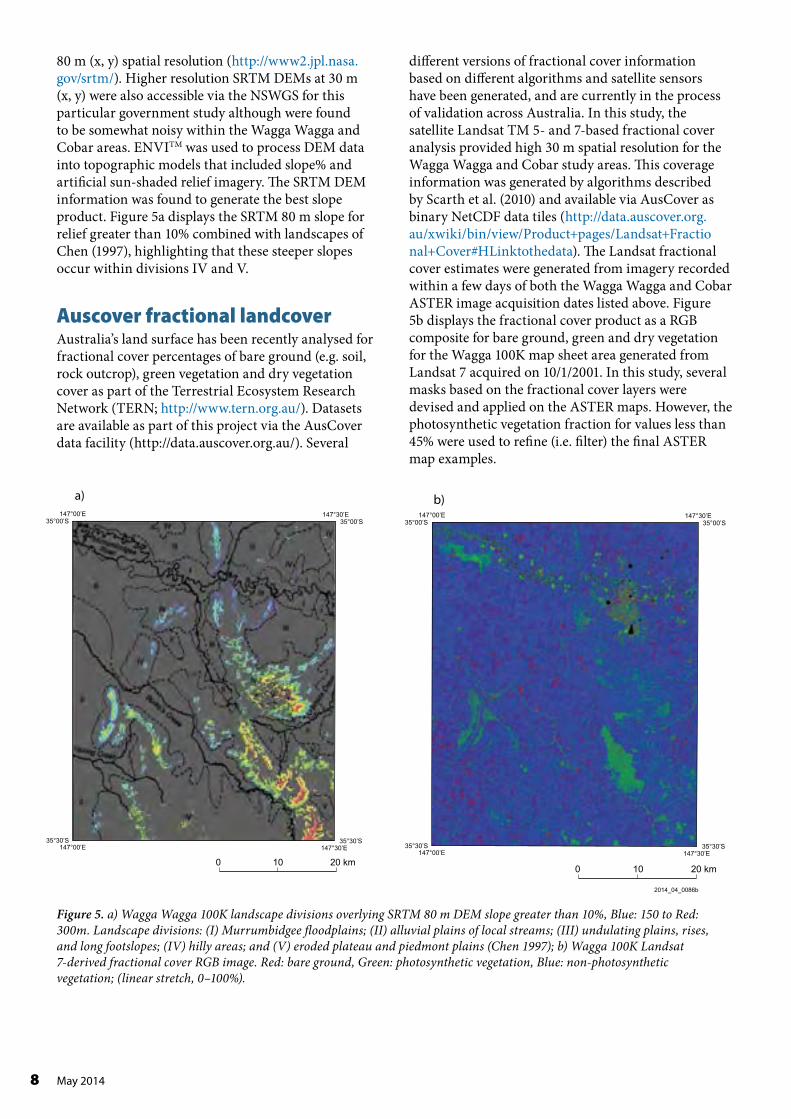
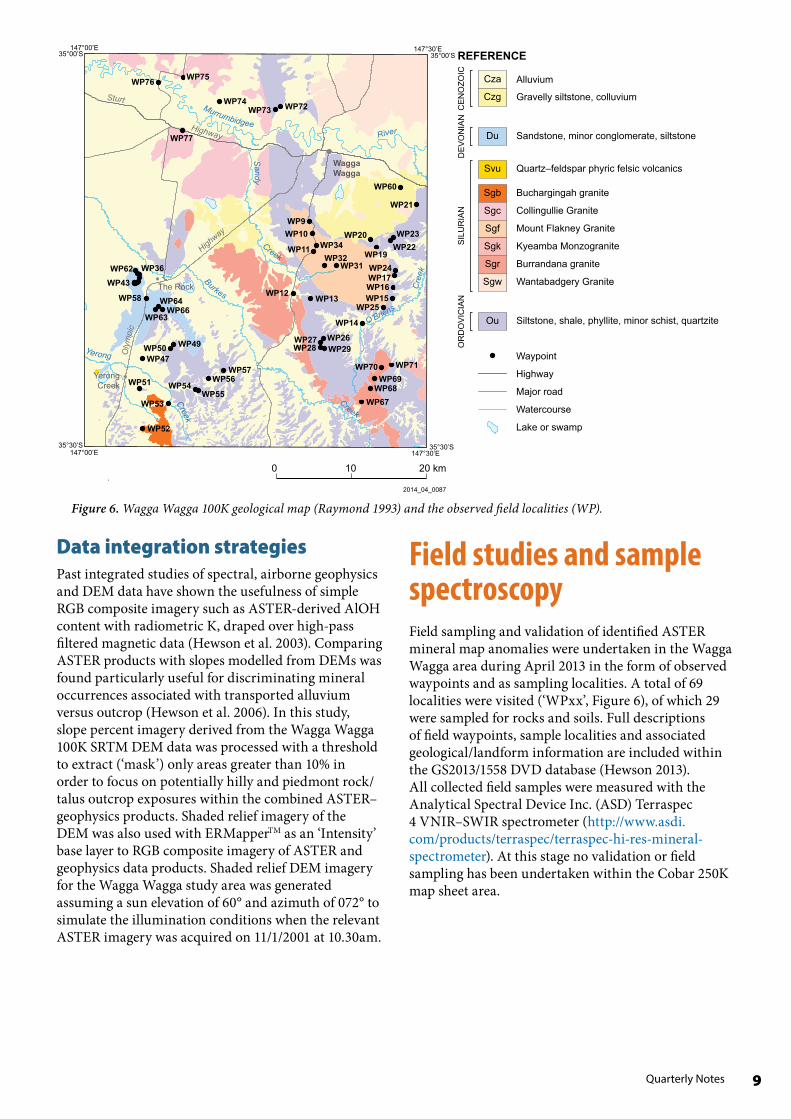
Quarterly Notes
Burkes
Creek
Sandy Creek
Murrumbidgee River
OrsquoBriens
Cre
ek
Yerong
Creek
Oly
mpi
c
Highway
Highway
Sturt
147deg00rsquoE 147deg30rsquoE35deg00rsquoS 35deg00rsquoS REFERENCE
WP75 Cza AlluviumWP76
Czg Gravelly siltstone colluviumWP74 WP73 WP72
WP77 Du Sandstone minor conglomerate siltstone
OR
DO
VIC
IAN
S
ILU
RIA
ND
EV
ON
IAN
CE
NO
ZOIC
Wagga Svu Quartzndashfeldspar phyric felsic volcanicsWagga
WP60 Sgb Buchargingah granite
WP21 Sgc Collingullie Granite
Sgf Mount Flakney Granite
Sgk Kyeamba Monzogranite
Sgr Burrandana granite
Sgw Wantabadgery Granite
Ou Siltstone shale phyllite minor schist quartzite
WP9
WP10 WP20 WP23 WP34 WP22WP11 WP19WP32
WP31 WP24WP62 WP36 WP17WP43 The Rock WP16
WP12WP58 WP13 WP15WP64 WP25WP66
WP63 WP14
WP26WP27WP49 WP28WP50 WP29 Waypoint
Highway WP47
WP71WP70WP57Yerong Creek
WP56 WP69WP51 WP54 WP68 Major roadWP55 WP67WP53 Watercourse
Lake or swampWP52
147deg00rsquoE 35deg30rsquoS
147deg30rsquoE 35deg30rsquoS
0 10 20 km
2014_04_0087
Figure 6 Wagga Wagga 100K geological map (Raymond 1993) and the observed field localities (WP)
Data integration strategies Past integrated studies of spectral airborne geophysics and DEM data have shown the usefulness of simple RGB composite imagery such as ASTER-derived AlOH content with radiometric K draped over high-pass filtered magnetic data (Hewson et al 2003) Comparing ASTER products with slopes modelled from DEMs was found particularly useful for discriminating mineral occurrences associated with transported alluvium versus outcrop (Hewson et al 2006) In this study slope percent imagery derived from the Wagga Wagga 100K SRTM DEM data was processed with a threshold to extract (lsquomaskrsquo) only areas greater than 10 in order to focus on potentially hilly and piedmont rock talus outcrop exposures within the combined ASTERndash geophysics products Shaded relief imagery of the DEM was also used with ERMapperTM as an lsquoIntensityrsquo base layer to RGB composite imagery of ASTER and geophysics data products Shaded relief DEM imagery for the Wagga Wagga study area was generated assuming a sun elevation of 60deg and azimuth of 072deg to simulate the illumination conditions when the relevant ASTER imagery was acquired on 1112001 at 1030am
Field studies and sample spectroscopy Field sampling and validation of identified ASTER mineral map anomalies were undertaken in the Wagga Wagga area during April 2013 in the form of observed waypoints and as sampling localities A total of 69 localities were visited (lsquoWPxxrsquo Figure 6) of which 29 were sampled for rocks and soils Full descriptions of field waypoints sample localities and associated geologicallandform information are included within the GS20131558 DVD database (Hewson 2013) All collected field samples were measured with the Analytical Spectral Device Inc (ASD) Terraspec 4 VNIRndashSWIR spectrometer (httpwwwasdi comproductsterraspecterraspec-hi-res-mineralshyspectrometer) At this stage no validation or field sampling has been undertaken within the Cobar 250K map sheet area
9
GP5
GP6
a)ASTER validation study Several localities within the Wagga Wagga 100K map sheet area were used for validation or lsquoground truthrsquo sites for the ASTER map products The Wagga Wagga Airport and RAAF base provided useful dark ground targets to test for possible crosstalk issues (Figure 7a) The ASTER False Colour (Figure 7b) map product showed these dark or low-albedo surfaces Residual crosstalk effect is a possible explanation for the corresponding AlOH group content anomalies (red and green areas Figure 7c) Multiple
b)spectral reflectance measurements were undertaken at each site with the TerraSpec 4 (lsquoASDrsquo) spectrometer using its hand-held probe These measurements were averaged and resampled to ASTER spectral resolution to ascertain any possible AlOH-like SWIR signature (Figures 8a b) Tarmac at the Wagga Wagga Airport and the RAAF base exhibited low overall reflectance and an absence of any effective average ASTER AlOH spectral absorption signature centred at band 6 (2200 nm) (Figure 8a b) Additional validation sites were also studied to examine ASTERrsquos geologicalmineral mapping invariant targets with minimal vegetation In particular gravel pits within the Wagga Wagga 100K map sheet area were identified for sampling and ASD Terraspec measurements Waypoint WP52 (Sample WG21 site) within a granite gravel pit of approximately 100 m x 150 m was located on site (Figure 9 andashc) and within the 2001 ASTER map products (Figure 10andashc) The corresponding ASTER map products for the WP52WG21 site showed reasonable spatially coherent anomalies for the ASTER AlOH Silica Index and to a lesser extent the Ferric Oxide anomalies A four ASTER pixel subset within this gravel pit gave AlOH group content and ferric iron content values of 227 and 14 respectively ASD derived equivalent ASTER AlOH group content and ferric iron content ratio products gave favourably comparable values of 242 and 147 respectively Within the same gravel pit subset area the Landsat derived fractional photosynthetic (eg green veg) cover product also showed a low cover value of 23 (Figure 10d)
a) b) 025 025
02 02
WP61
WP60
c)
WP61
WP60
250m 2014_04_0088
Figure 7 a) Google Earth image of ASTER validation sites at Wagga Wagga Airport (GP5) waypoints WP59 WP60 and RAAF parade ground (GP6) waypoint WP61 b) ASTER False colour image c) ASTER AlOH group content (purpleblue low to red high content)
Ref
lect
ance
015
Ref
lect
ance
015
Mean ASTER Equivalent 01 Mean + Std Dev ASTER 01
Mean ASTER Equivalent Mean + Std Dev ASTER Mean - Std Dev ASTER Mean - Std Dev ASTER Mean ASD Mean ASD
005 005
0 0 550 1050 1550 2050 2000 2050 2100 2150 2200 2250 2300 2350 2400
Wavelength (nm) Wavelength (nm) 2014_04_0089
Figure 8 Wagga Wagga Airport tarmac (WP59ndash60) ASD and resampled ASTER equivalent signature (mean plusmn standard deviation) for a) the VNIRndashSWIR wavelengths and b) close up for SWIR wavelengths
10 May 2014
Quarterly Notes
a) b)
c) wg21a_af00 Figure 9 a) Google Earth image of ASTER geological wg21a_af01 validation site WP52WG21 b) Granitic gravel pit at WP52 wg21r_bf00 WG21 c) ASD Terraspec spectral signatures of granitegravel wg21r_bf01 showing ferric iron and pronounced AlOH diagnostic spectral wg21r_cf00 features at 880 nm to 1000 nm and 2208 nm respectively wg21r_cf01 Equivalent ASTER resampled signatures (asterisks) show
05 detectable features particularly for the AlOH SWIR feature 04
03
02
Hematite (880 nm) 01
Goethite (1000 nm) Al-poor mica (2208 nm)
00 400 900 1400 1900 2400
Wavelength (nm)
2014_04_0090
a) b)
Ref
lect
ance
WG21 WG21
c) d)
WG21
WG21
2014_04_0091250m
Figure 10 a) ASTER False Colour image of WP52 granitic gravel pit b) ASTER AlOH group content c) ASTER Silica Index d) Landsat fractional cover ndash photosynthetic cover Images bndashd display map product values from low (purpleblue) to high (red) values Grid cell is 250 m square
11
Results
WAGGA WAGGA 1100 000 map sheet area ASTER map products The Australian ASTER GeoTIFF map products were initially examined individually for the Wagga Wagga 100K map sheet area Several of the 17 products did not show significant anomalies related to geological features and were limited to (cultivated) cropping patterns at best In particular the ASTER imagery used here was acquired in mid-summer 2001 and highlighted exposed fallow fields and soils (Figure 11) The ASTER False Colour map product (Figure 11) also highlighted the town of Wagga Wagga and several vegetated areas with topographic relief (dark red to dark grey) A slight boundary anomaly is apparent at the extreme northwestern edge of the 100K scene from a change of ASTER image scenes ASTERrsquos green vegetation content product (Figure 12a) corresponds approximately with areas of red shown in the ASTER false colour product (Figure 11) although this green vegetation content product is is more correctly generated by a band ratio (bands 3band 2) targeting the chlorophyll lsquored edgersquo Exposed soil and fallow crop fields have no or low green vegetation anomalies (blue) on the floodplains and lowlands while vegetation is highlighted
Wagga Wagga
Vegetated relief
Murrumbidgee River Flood Plain
147deg00rsquoE 35deg00rsquoS
147deg00rsquoE 35deg30rsquoS
147deg30rsquoE 35deg30rsquoS
147deg30rsquoE 35deg00rsquoS
2014_04_0092
0 10 20 km
Figure 11 ASTER false colour products within Wagga Wagga 100K map sheet area
147deg00rsquoE 35deg00rsquoS
147deg00rsquoE 35deg30rsquoS
147deg30rsquoE 35deg30rsquoS
147deg30rsquoE 35deg00rsquoS
0 10 20 km
147deg00rsquoE 35deg00rsquoS
147deg00rsquoE 35deg30rsquoS
147deg30rsquoE 35deg30rsquoS
147deg30rsquoE 35deg00rsquoS
2014_04_0093
Figure 12 a) Wagga Wagga 100K ASTER green vegetation product (blue low red high content) b) ASTER AlOH content (blue low red high content)
within areas of topographic relief (Figures 11 12a) ASTERrsquos AlOH content product (Figure 12b) shows very limited clay anomalies except for the Wagga Wagga township and an apparent association with vegetated occurrences shown in the green vegetation product (Figure 12a) A green vegetation mask based on the ASTER product was applied during the generation of the AlOH composition map product and minimal anomalies were apparent
12 May 2014
13 Quarterly Notes
147deg00rsquoE 35deg00rsquoS
147deg00rsquoE 35deg30rsquoS
147deg30rsquoE 35deg30rsquoS
147deg30rsquoE 35deg00rsquoS
0 10 20 km
147deg00rsquoE 35deg00rsquoS
147deg00rsquoE 35deg30rsquoS
147deg30rsquoE 35deg30rsquoS
147deg30rsquoE 35deg00rsquoS
2014_04_0094
Figure 13 a) Wagga Wagga 100K ASTER ferric oxide content (blue low red high) and b) composition map products Apparent trends in the ferric oxide content are shown in red dashed lines
ASTERrsquos ferric oxide content and composition products (Figures 13a b) show elevated values in contrast with the AlOH group content product (Figure 12b) There is also some variation in composition from the interpreted goethite-rich (bluendashcyan) to hematite-rich (redndashyellow) (Figure 13b) Some linear trends were
Figure 13a) show boundaries and possible lineaments related to floodplain alluvium regolith or geological units Although Cudahy (2012) described the ferric oxide content as having moderate accuracy a comment is also noted for the potential of pixel spectral mixing errors and an inverse relationship with the green vegetation product This could also be either related to the obscuring effect of vegetationcrops or spectral signature ambiguities given the proximity of VNIR spectral features The ASTER FeOH and ferrous iron products in the Wagga Wagga 100K map sheet area did not generate coherent or distinct features apart from some isolated paddock anomalies The ASTER MgOH group content and composition products showed minimal occurrences except for some anomalies in the far southwestern corner which occupied farm fields adjacent to Ordovician metasedimentary rocks Likewise the kaolinite group Index showed only minor anomalies Both the ASTER MgOH group content and composition and kaolinite index products were masked for green vegetation during processing (Cudahy 2012) The Silica Index (Figure 14) proved to have less noise and highlighted more anomalies than the ASTER quartz index although the range in values and image contrast were limited Subtle anomalies highlighted by the Silica Index generally occurred within paddocks corresponding to low green vegetation and also as broader subtle variations (Figure 14)
147deg00rsquoE 35deg00rsquoS
147deg00rsquoE 35deg30rsquoS
147deg30rsquoE 35deg30rsquoS
147deg30rsquoE 35deg00rsquoS
2014_04_0095
Figure 14 Wagga Wagga 100K map sheet area ASTER silica index
apparent although the anomalies were often biased by the cropping patterns and exposed paddock soils Nonetheless some linear trends (red dashed lines in
Burkes
Creek
Sandy Creek
Murrumbidgee River
OrsquoBriens
Cre
ek
Yerong
Creek
Oly
mpi
c
Highway
Highway
Sturt
a) b)
147deg00rsquoE 147deg30rsquoE 147deg00rsquoE 147deg30rsquoE 35deg00rsquoS 35deg00rsquoS 35deg00rsquoS 35deg00rsquoS
Bulloc Bulloc Range Burngoogee Ranges
Melebo Mountains
35deg30rsquoS 35deg30rsquoS 35deg30rsquoS 35deg30rsquoS 147deg00rsquoE 147deg30rsquoE 147deg00rsquoE 147deg30rsquoE
0 10 20 km 0 10 20 km
2014_04_0096a 2014_04_0096b
Figure 15 a) Wagga Wagga 100K SRTM 80 m slope (blue low red high) b) SRTM 80 m sun-shaded imagery draped with ASTER green vegetation product (Figure 12a) masked for slope gt10
147deg00rsquoE 147deg30rsquoE35deg00rsquoS 35deg00rsquoS REFERENCE
OR
DO
VIC
IAN
S
ILU
RIA
ND
EV
ON
IAN
CE
NO
ZOICWP75 Cza Alluvium
Czg Gravelly siltstone colluvium
Du Sandstone minor conglomerate siltstone
WP76
WP74 WP73 WP72
WP77
Wagga Svu Quartzndashfeldspar phyric felsic volcanicsWagga
WP60 Sgb Buchargingah granite
WP21 Sgc Collingullie Granite
Sgf Mount Flakney Granite
Sgk Kyeamba Monzogranite
Sgr Burrandana granite
Sgw Wantabadgery Granite
Ou Siltstone shale phyllite minor schist quartzite
WP9
WP10 WP20 WP23 WP34 WP22WP11 WP19WP32
WP31 WP24WP62 WP36 WP17WP43 The Rock WP16
WP12WP58 WP13 WP15WP64 WP25WP66
WP63 WP14
WP26WP27WP49 WP28WP50 WP29 WaypointWP47
WP71WP57 Highway WP70
WP56 WP69Yerong Creek WP51 WP54 WP68 Major roadWP55
WP67WP53 Watercourse
WP52 Lake or swamp
35deg30rsquoS 35deg30rsquoS 0 10 20 km 147deg00rsquoE 147deg30rsquoE
2014_04_0097
Figure 16 Wagga Wagga 100K geology map (Raymond 1993) combined with SRTM 80 m slope gt10 showing geological units within areas of high relief
14 May 2014
15 Quarterly Notes
The nature of the geomorphology and extensive agricultural cultivation of the Wagga Wagga 100K sheet area prompted the use of DEM data to discriminate the likely geologically exposed areas Processing the SRTM 80 m DEM for slope information highlighted the major ranges and topographic relief (Figure 15a) Sun-shaded DEM imagery also highlighted these landforms (Figure 15b) Generation of a mask based on slopes greater than 10 was useful to observe relationships with the various ASTER products For example when ASTERrsquos green vegetation product masked within areas of slope gt10 is combined with sun-shaded imagery much of the higher relief is observed to be moderately to highly vegetated (Figure 15b) Figure 16 shows simplified geological units combined with SRTM data An attempt to overcome the limited range of anomalies observed within the Wagga Wagga 100K ASTER silica index product (Figure 14) using a histogram equalisation stretch within the same data range highlighted both more noise and some coherent anomalies (Figure 17a) Masking of this product with SRTM Slope product greater than 10 (Figure 17b) helped to discriminate exposed geological units as shown in Figure 16 Elevated areas of the quartz-rich sandstone of Bulloc Bulloc Range and metasedimentary rock of Livingstone National Park were highlighted by this approach (Figure 17b)
Geophysical products A similar approach to displaying and enhancing the Wagga Wagga 100K ASTER map products was applied to the airborne radiometric data where anomalous regions were extracted within the areas of elevated slope Histogram equalisation stretching of the K Th and U radioelements highlighted a mixture of alluvial deposition and outcropping geology (Figure 18a) The potassium data coherently mapped the alluvium and floodplains of Burkes Creek and the Murrumbidgee River (Figure 18a) The Mount Flakney Granite and the Bulloc Bulloc Range Ordovician (Ou) and Devonian sandstones (Du) were highlighted as anomalous using the entire 100K map sheet dataset (with histogram equalisation) but more subtle variations in radioelement composition were apparent when slope masking was applied and a simple 2 linear histogram was applied for image stretching (Figure 18b) Compositional variations within these units appeared to be enhanced by limiting the focus to areas of higher relief Increased thicknesses of aeolian deposits alluvium or colluvium on lowlands and areas of reduced slope may mask and dilute radiometric sensing of some of these units
2014_04_0098a
147deg00rsquoE 35deg00rsquoS
147deg00rsquoE 35deg30rsquoS
147deg30rsquoE 35deg30rsquoS
147deg30rsquoE 35deg00rsquoS
147deg00rsquoE 35deg00rsquoS
147deg00rsquoE 35deg30rsquoS
147deg30rsquoE 35deg30rsquoS
147deg30rsquoE 35deg00rsquoS
2014_04_0098b
0 10 20 km
Figure 17 a) Wagga Wagga 100K ASTER Silica Index product generated with a histogram equalisation stretch b) Histogram equalised ASTER silica index masked for slope gt10 (purple blue low to red high content) Areas highlighted are Bulloc Bulloc Range (white) and Livingstone National Park (yellow)
a)
b)
2014_04_0099
16 May 2014
a)
Bullo
c Bu
lloc
Rang
e D
uO
u
Mt F
lakn
ey G
rani
te
Mur
rum
bidg
ee R
iver
Burkes Creek
K U
Te
rnar
y K
Th U
Th
b)
Slop
e m
aske
d Te
rnar
ySl
ope
mas
ked
K Sl
ope
mas
ked
ThSl
ope
mas
ked
U
Figu
re 1
8 a
) Wag
ga W
agga
100
K a
irbor
ne ra
diom
etri
c dat
a K
Th U
and
as a
Ter
nary
imag
e (RG
B K
Th U
) di
spla
yed
with
a h
istog
ram
equa
lisat
ion
stre
tch
b)
K Th
U T
erna
ry im
age m
aske
d fo
r slo
pes gt
10
disp
laye
d w
ith a
2
line
ar h
istog
ram
stre
tch
Geo
logi
cal f
eatu
res d
iscus
sed
in te
xt a
re ci
rcle
d
17 Quarterly Notes
0 10 20 km
c) d)
a) b)
Bulloc Bulloc Range DuOu
Mt Flakney Granite (Sgf)
Figure 19 Apparent trends in the ASTER ferric oxide content (from Figure 13a) are shown as red dashed lines a) TMI 1VD (greyscale) overlain with ASTER ferric oxide content b) TMI 1VD (greyscale) overlain with K Th U Ternary RGB imagery (Red K Green Th Blue U) c) RTP TMI (greyscale) over tilt-filtered RTP TMI (pseudocolour) d) Sun-shaded SRTM DEM (greyscale) overlain with tilt-filtered TMI (pseudocolour)
Bulloc Bulloc Range DuOu
Mt Flakney Granite (Sgf)
Bulloc Bulloc Range DuOu
Mt Flakney Granite (Sgf)
2014_04_0100
Filtered aeromagnetic data for the Wagga Wagga 100K map sheet area were used in an effort to extract structural information and also to highlight near-surface trends of iron-bearing unitsmagnetite and possible correlations with the ASTER map products ASTERrsquos ferric oxide content showed some trends albeit revealed within exposed paddocks (Figure 13a) that showed northwest-trending and some possible northeast-trending features that correlated approximately with First Vertical Derivative (1VD) TMI lineaments (Figure 19a) The VNIR spectral signature of magnetite is essentially aspectral and not likely to be revealed by the ASTER Ferric Oxide Content product directly However weathering of magnetite-bearing rocks may possibly be associated with increased ferric iron oxide minerals within soils exposed here Integrating radiometric ternary imagery over TMI 1VD (Figure 19b) reveals similar northwest trends as Figure 19a In addition Figure 19b reveals a
complex series of north-northwest-trending lineaments along the western boundary of the K-rich Mount Flakney Granite and northwest-trending lineaments east of the sheared Bulloc Bulloc Range Devonian and Ordovician units RTP TMI over tilt-filtered Reduced to the Pole (RTP) TMI (Figure 19c) highlighted several lineaments with some corresponding to those interpreted with ASTER ferric oxide and radiometric data (Figure 19a b) The integration of tilt-filtered TMI over sun-shaded SRTM DEM (Figure 19d) also revealed some correlation of northndashnorth-northwest and cross-cutting north-northeast lineaments with topographic relief and valleys (Figure 5a) related to either outcropping geological units or possible structural and tectonic movements The tilt-filtered TMI within this Wagga 100K area appears to reveal increased high-frequency features and anomalies useful for detailed interpretation
REFERENCE
Highway
Major road
Watercourse
Lake or swamp
Cza
Czg
Du
Svu
Sgb
Sgr
Ou
Alluvium
Gravelly siltstone colluvium
Buchargingah granite
Burrandana granite
Sandstone minor conglomerate siltstone
Quartzndashfeldspar phyric felsic volcanics
Siltstone shale phyllite minor schist quartzite
CE
NO
ZOIC
DE
VO
NIA
NS
ILU
RIA
NO
RD
OV
ICIA
N
2014_04_0101
Yerong
Burkes
Creek
Cree
k
Creek
Stony
Watt
le
Creek
Hig
hway
Oly
mpi
c
The Rock
YerongCreek
A
B
147deg00rsquoE
147deg00rsquoE 147deg14rsquoE
147deg14rsquoE
35deg12rsquoS 35deg12rsquoS
35deg24rsquoS 35deg24rsquoS
0 5 10 km
Yerong
Burkes
Creek
Cree
k
Creek
Stony
Watt
le
Creek
Hig
hway
Oly
mpi
c The Rock
Yerong Creek
A
B
147deg00rsquoE
147deg00rsquoE 147deg14rsquoE
147deg14rsquoE
35deg12rsquoS 35deg12rsquoS
35deg24rsquoS 35deg24rsquoS
0 5 10 km
REFERENCE
Cza
Czg
Alluvium
Gravelly siltstone colluvium
Du Sandstone minor conglomerate siltstone
Svu Quartzndashfeldspar phyric felsic volcanics
Buchargingah granite
Burrandana granite
Ou Siltstone shale phyllite minor schist quartzite
Highway
Major road
Watercourse
Lake or swamp
Sgb
Sgr
2014_04_0101
Figure 20 Location of The Rock Hill (A) and Flowerpot Hill (B) on part of the Wagga Wagga 100K geological map (Raymond 1993)
a) b) O
RD
OV
ICIA
N
SIL
UR
IAN
DE
VO
NIA
NC
EN
OZO
IC
c) d)
NA
NA
NA
NA
NA NAWG16
WG17 WG18
WG23
WG26
WG19
Mag Low-Demagnetisation (removal of iron via metasomatic fluid alteration)
Axis Axis
Mag Low Radiometrics ternary RGB K Th U
Radiometrics Potassium (Histogram equalised)
O 10km
2014_04_0102
Figure 21 The Rock Hill and Flowerpot Hill area of Figure 20 (approx) a) ASTER false colour b) RTP TMI over Tilt-filtered TMI c) Radiometrics Ternary (RGB K Th U) d) Radiometrics K (blue low red high) Major lineaments magnetic low and fold structure are shown NA = site not sampled in study
18 May 2014
b)REFERENCE
Waypoint site
Highway
Major road
Watercourse
Lake or swamp
Cza
Czg
Du
Svu
Sgb
Sgr
Ou
Alluvium
Gravelly siltstone colluvium
Buchargingah granite
Burrandana granite
Sandstone minor conglomerate siltstone
Quartzndashfeldspar phyric felsic volcanics
Siltstone shale phyllite minor schist quartzite
CE
NO
ZOIC
DE
VO
NIA
NS
ILU
RIA
NO
RD
OV
ICIA
N
2014_04_0103a
Yerong
Burke
s
Creek
Cree
k
Creek
Stony
Watt
le
Creek
Hig
hway
Oly
mpi
c
The Rock
YerongCreek
WP66WP63
WP37
WP56
WP57
WP50
WP35WP62
WP38
WP49
WP36
WP47
35deg23rsquoS147deg00rsquoE
147deg00rsquoE 147deg14rsquoE
35deg23rsquoS147deg14rsquoE
35deg14rsquoS35deg14rsquoS
0 5 10 km
Quarterly Notes
a) REFERENCE
Cza
Czg
Alluvium
Gravelly siltstone colluvium
CE
NO
ZOIC
Sandstone minor conglomerate siltstone
Mag Low ASTER AIOH content 35deg14rsquoS 35deg14rsquoS
35deg23rsquoS 35deg23rsquoS 147deg00rsquoE
147deg00rsquoE 147deg14rsquoE
147deg14rsquoE
2014_04_0103b
Yerong
Burke
s
Creek
Cree
k
Creek
Stony
Watt
le
Creek
Hig
hway
Oly
mpi
c
The Rock
Yerong Creek
WP66 WP63
WP37
WP56
WP57
WP50
WP35 WP62
WP38
WP49
WP36
WP47
35deg23rsquoS 147deg00rsquoE
147deg00rsquoE 147deg14rsquoE
35deg23rsquoS 147deg14rsquoE
35deg14rsquoS35deg14rsquoS
0 5 10 km
b)
c)
Du
Svu
Sgb
Sgr
Ou Siltstone shale phyllite minor schist quartzite
Waypoint site
Highway
Major road
Watercourse
Lake or swamp 2014_04_0103a
The Rock Hill and Flowerpot Hill Devonian and Ordovician metasedimentary units in the central western part of the Wagga Wagga 100K map sheet area (Figure 20) provided a useful target and potentially prospective area to closely examine ASTER and geophysical mapping issues and opportunities for data integration The ASTER false colour product highlights the elevated Bulloc Bulloc Range including The Rock and Flowerpot Hill surrounded by farm paddocks and cultivation (Figure 21a) The geophysics highlights some interesting lineaments a fold structure and a magnetic low (Figures 21bndashd) In particular the tilt-filtered TMI data shows a prominent pair of north-northwestndashsouth-southeast lineaments (Figure 21b) approximately parallel to the apparent hinge linefold axis of the DevonianOrdovician metasedimentary rocks (Figure 21c d) and also bounding a likely deep-seated magnetic low (Figure 21b) Ternary and K radiometric anomalies appear to cross-cut the
OR
DO
VIC
IAN
S
ILU
RIA
ND
EV
ON
IAN
Quartzndashfeldspar phyric felsic volcanics
Buchargingah granite
Burrandana granite
ASTER silica index 35deg14rsquoS
35deg23rsquoS 35deg23rsquoS 147deg00rsquoE
147deg00rsquoE 147deg14rsquoE
147deg14rsquoE
35deg14rsquoS
0 5 10 km
2014_04_0103c
Devonian and Ordovician stratigraphy when they are overlain on the geology map (Figure 22a) A modified version of the ASTER AlOH content map masked for both SRTM-derived slopes greater than 10 and less than 45 Landsat-derived photosynthetic (PV or lsquogreenrsquo) vegetation fraction cover appears to highlight some increase in mica content in the main hinge line axis (red areas Figure 22b) Figure 22b was also displayed using histogram equalisation using thresholds described by Cudahy (2012) The silica index product with a histogram equalisation stretch also appears to highlight some increase in silica along the axis (Figure 22c) Field observations of increased quartz and ASD spectral measurements identifying AlOH minerals phengite and kaolinite (Figure 23) appear to confirm this interpretation Hematite is also common within The Rock Hill and Flowerpot Hill area
Figure 22 The Rock Hill and Flowerpot Hill a) Wagga Wagga 100K geological map with geophysical features from Figure 21 b) ASTER AlOH masked for gt10 slope and lt45 PV Landsat fraction histogram equalised Mica anomaly is circled c) ASTER silica index histogram equalised Silica anomaly is circled Purpleblue low to red high content
19
Ref
lect
ance
050
040
030
020
010
000
wg26r_bw00000
wg23r_bw00001
Hematite signature (860 nm) Al poor mica or Phengite (eg 2209 nm absorption)
400 900 1400 1900 2400
Wavelength (nm) 2014_04_0104
Figure 23 Example ASD spectral signature of rock outcrop samples (WG23 26 ndash see Figure 21a) at Flowerpot Hill showing Al-poor micaAlOH and hematite diagnostic features
ASTER data issues and qualifications on interpretation Acquisition of ASTER satellite imagery at about 1030 am (Australian Eastern Daylight Time) can potentially produce sharp shadows on steep westerly slopes within high relief areas The ASTER satellite sensor has an additional issue of potential false anomalies from the lsquocrosstalkrsquo mis-calibration of its shortwave IR sensor (bands 5ndash9) as used for the generation of AlOH or micaclay mineral maps Dark shaded areas appear on the western slopes of The Rock and Flowerpot Hill as a result of north- and northwest-trending ridgelines as shown in the sun-shaded DEM imagery generated to simulate illumination conditions on 1112001 at 1030 am (blue ellipses Figure 24a) These areas of deep shadow appear to be coincident with some of the AlOH anomalies (red ellipse Figure 22b) and potentially the result of false anomalies associated with crosstalk
0 4km a)
WP 62 WP 35
WP 36 WP 37
WP 33
WP 38
WP 65
WP 66
WP 58
WP 45
SRTM DEM sun shaded (el 60˚ Az 72˚)
b)
(Figure 24b) However areas of full illumination on the northeast slopes also show AlOH anomalies and the crosstalk explanation does not entirely negate the AlOH presence Overall these results suggest that residual crosstalk effects are a possibility within dark areas of shadow and vegetation cover and bitumen (eg the Wagga AirfieldRAAF base) The validation of ASTER study sites can be assisted with the aid of DEMs fractional cover information field observations and ideally a VNIRndashSWIR spectrometer
ASTER AIOH mica content (hist eq) masked for 45 lt green vegetationgt 10 slope
Figure 24 a) Sun-shaded SRTM 80 m DEM of The Rock Hill and Flowerpot Hill (60deg elevation 072deg azimuth) simulating illumination conditions and shaded relief during ASTER image acquisition (1112001) b) ASTER AlOH content and corresponding areas of shaded relief (dashed ellipses)
Figure 25 The Rock Reserve WP62 a) Casuarina open woodland b) ferruginous gravel with lichen and moss ground cover c) typical canopy cover
20 May 2014
Quarterly Notes
a) b) c)
WP62
WP35
WP36 WP37
WP38WP40 WP39
WP58
WP65 WP63
WP66
WP62
WP35
WP36 WP37
WP38WP40 WP39
WP58
WP65 WP63
WP66
WP62
WP35
WP36 WP37
WP38WP40 WP39
WP58
WP65 WP63
WP66
0 20 40 60 80 100 0 20 40 60 80 100 0 20 40 60 80
non-photosynthetic Bare ground photosynthetic
4km 2014_04_01060
Figure 26 a) ndash c) Landsat fractional cover estimates for The Rock Hill mdash the same area as in Figure 24
Field observations and ASD in-situ field measurements of gravel lag vegetation ground litter etc at Waypoint WP62 (Figure 22a 24a) were undertaken near The Rock (Figure 25andashc) AusCover fractional cover estimates using Landsat acquired 1012001 one day before the ASTER gave values of 18 bare ground 41 photosynthetic and 40 non-photosynthetic vegetation cover for supplied 30m pixels encompassing WP62 Fractional cover imagery for the Bulloc Bulloc RangeThe Rock shows that the cover is dominated by photosynthetic and to a lesser extent non-photosynthetic vegetation (Figures 26andashc) ASD in-situ field measurements of gravel lag vegetation and ground litter at WP62 were processed to simulate ASTER ferric oxide content and green vegetation indices (Figure 27) This limited series of measurements suggested that the presence of dry vegetation matter (eg lichen bark leaf litter) can hinder the ASTER interpretation of ferric iron (eg hematite goethite) useful for regolith profile information andor alteration involving hematisation (Figure 27) Simulated values for ASTERrsquos AlOH content index from W62 gravel
The Rock Hill - Waypoint 62
Green tree and shrub foliage ground moss Devonian ferruginous sandstone gravel lag Lichen bark and leaf litter
1 3
0
4
2
AST
ER -
Gre
en V
eget
atio
n
ASTER - Ferric Oxide Content
Figure 27 ASD field spectral signatures of vegetation and gravel samples from The Rock Hill (WP 62) resampled and processed into equivalent ASTER map indices for green vegetation and ferric oxide content
lag ASD measurements produced values between 19 and 215 within the threshold range used to generate ASTER AlOH content imagery (Cudahy 2012) This compares favourably with the ASTER AlOH content index value of 20 as an average for 2 x 30 m pixels at WP62 extracted from the map product
Cobar 1100 000 and Canbelego 1100 000 map sheet areas The ASTER map products over the Cobar 1250 000 map sheet area are less affected by agricultural cultivation than the Wagga Wagga area as highlighted by ASTERrsquos false colour showing only approximately 25 under cultivationcropping to the east (Figure 28a) Isolated cloud cover is also apparent in the eastern third of the Cobar 1250 000 map sheet area where the map product is generated from a separate ASTER scene (Figure 28a) ASTERrsquos regolith product is useful for highlighting the extensive ephemeral drainage patterns (Figure 28b) As described by Cudahy (2012) the Regolith product based on the Landsat TM Regolith ratios helps to separate regolith and geological units while vegetated areas are highlighted by whitebright areas and clouds in blue (Figure 28b) ASTERrsquos green vegetation product also shows the limited nature of the green vegetation cover restricted to watercourses outside of the cultivated areas (Figure 28c) The land cover is more explicitly highlighted in the Landsat-derived fractional cover image which shows that close to the time of ASTER acquisition (September 2003) the most exposed bare ground was within the Cobar 100K map sheet area and to a lesser extent Canbelego 100K (reddish areas Figure 28d) Non photosynthetic vegetation (lsquodry vegetationrsquo) still appears pervasive in the non-cultivated areas (blue areas Figure 28d) which may be an issue for some ASTER map products
21
100
c) d)
a) b)
145ordm30E 147ordm00E 145ordm30E 147ordm00E 31ordm00S 31ordm00S
32ordm00S 32ordm00S
145ordm30E 147ordm00E 145ordm30E 147ordm00E
31ordm00S 31ordm00S
32ordm00S 32ordm00S
Figure 28 Cobar 1250K map sheet area a) ASTER false colour Note clouds and shadows in lower right b) ASTER regolith colour coded as for standard CSIRO Landsat Regolith product (Cudahy 2012) c) ASTER green vegetation (blue low red high) d) Landsat fractional cover RGB Red bare ground Green photosynthetic vegetation Blue non-photosynthetic vegetation (linear stretch 0ndash100)
a) b) 145ordm30E 147ordm00E 145ordm30E 147ordm00E
31ordm00S 31ordm00S
32ordm00S32ordm00S
Figure 29 Cobar 1250K map sheet area a) ASTER ferric oxide content (blue low red high) b) ASTER ferric oxide composition (histogram equalised) (blue goethitic red hematitic) c) ASTER AlOH group content (histogram equalised) (blue low red high) Note that cloud cover in eastern 100K maps introduces false anomalies (see Figure 28a)
32ordm00S
31ordm00S
c) 145ordm30E 147ordm00E
31ordm00S
32ordm00S
2014_04_0109
22 May 2014
23 Quarterly Notes
a) b) 145ordm30E 147ordm00E 145ordm30E 147ordm00E
31ordm00S 31ordm00S
32ordm00S 32ordm00S
147ordm00E
31ordm00S 145ordm30E 147ordm00E 145ordm30E
31ordm00S
32ordm00S32ordm00S
Figure 30 a) ASTER AlOH group composition (histogram equalised) (blue Al-rich micawell ordered kaolinite red Al-poor mica) b) ASTER silica index (histogram equalised) (blue low red high) c) Radiometric K (blue low red high) d) Radiometric Th (blue low red high)
c) d)
2014_04_0110
The ASTER Ferric Oxide Content product highlights coherent and continuous spatial distribution across the Cobar 1250 000 sheet area with increased abundance within the Cobar 100K area (Figure 29a) An improved insight into the ferric iron oxide was provided by the ASTERrsquos ferric oxide composition using histogram equalisation (Figure 29b) rather than a Gaussian stretch within the same threshold stretch limits advised by Cudahy (2012) Using the histogram equalised version of the ASTER ferric oxide composition product highlights more clearly an apparent increase in hematitic composition within the western Cobar 250K including the Cobar 100K map sheet area (Figure 29b) The presence of hematite versus goethite may be important for regolith interpretation and understanding of the arearsquos possible lateritic weathering (Huntington et al 1999) However care should also be taken when interpreting ferric oxide content and composition in the presence of dry vegetation matter mdash as observed at The Rock Hill (Figure 27) and also noted by Cudahy (2012) The areas highlighted by ASTER with increased hematite also coincide with increased abundance of AlOH minerals as shown by the histogram equalised version of the ASTER AlOH group content (greenndashyellow areas Figure 29c) The ASTER AlOH group composition product (histogram equalised Figure 30a) highlights extensive
areas of low values (blue) in the western Cobar 250K sheet area including within the Cobar 100K Cudahy (2012) interpreted such low ASTER AlOH composition product values as mapping well-ordered kaolinite or Al-rich white mica These areas also appear to coincide with the interpreted hematite-rich areas shown in Figure 29b (red areas) If a lateritic profile mineral model (Huntington et al 1999) is assumed then questions arise whether these areas lie within the highly weathered hematite-bearing duricrust or less-weathered ordered kaolinite-bearing saprolite The ASTER kaolin group index product for Cobar 250K sheet area does not indicate significant anomalies using linear or histogram equalised versions Cobar regolith landform mapping indicates much of the Cobar 100K area is highly weathered in situ bedrock (Gibson 1999) However validation field work involving sampling and ASD measurements should clarify these issues The ASTER silica index product does appear to indicate high silica content along the western boundary of the Cobar 100K sheet area that coincides with elevated areas mapped by Gibson (1999) containing cappings of silicified sedimentary units (histogram equalised Figure 30b) Geophysical radiometric products K and Th also highlight distinctive units with the Cobar 100K and Canbelego 100K map sheet areas (Figures 30c d) The K and Th images mostly appear to map in an approximate complementary way areas of alluvial
a)
147ordm00E 31ordm00S
145ordm30E
32ordm00S
b) 145ordm30E 147ordm00E
31ordm00S
32ordm00S
Figure 31 a) RGB composite ASTERrsquos AlOH content (histogram equalised) ferric oxide content silica index (histogram equalised) b) RGB composite K ASTERrsquos ferric oxide content AlOH content over shaded DEM
(eg K) and in situ regolith units (eg Th) (Figures 30c d) In particular the drainage areas appear rich in apparently K-bearing clays (Figure 30c) whilst the Th occurs where there are non-drainage in situ relict areas (Figure 30c) possibly related to ferricrete Further ground truthing would help this interpretation An RGB composite image of ASTERrsquos AlOH group content ferric oxide content and silica index products appeared to discriminate generally elevated combined clay- and quartz-rich units (eg red+blue areas shown as purple) from ferric iron oxide minerals (green) within some drainage areas (Figure 31a) A RGB composite image of the radioelement K ASTER ferric oxide content and ASTER AlOH group content products also generated significant and complex spatially coherent patterns particularly within the Cobar and Canbelego 100K sheet areas that appear worthy of further examination for regolith information (Figure 31b)
2014_04_0111
Conclusions This project demonstrated within the NSW study areas of Wagga Wagga and Cobar the usefulness of the recently released Australia ASTER map products supplied by CSIROGA for identifying or discriminating variations in surface composition The map products included mineral identitiesgroups within geological units possible overprinted alteration andor weathered regolith These map products can potentially aid mineral exploration in NSW within semi-arid areas such as Cobar and to a lesser extent within open woodland and cultivated environments such as Wagga Wagga Although several ASTER map products provided useful information as individual entities their application generally benefits exploration when integrated with geophysical topographical and fractional land cover information In particular DEM-derived slope information and vegetation fractional data were used to mask and refine ASTER map products in the Wagga area within the temperate and vegetated Riverine Plains Anomalous AlOH- and silica-rich areas were discriminated and associated with radiometric and high frequency filtered TMI-inferred structures in the vicinity of the Bulloc Bulloc Range especially at The Rock Hill ASTER Ferric Iron Content product within the Wagga Wagga area also appeared to show northwest lineament trends similar to those highlighted by filtered TMI products Map generation for the Murrumbidgee floodplains using radiometric data also appeared to benefit from topographic slope masking to exclude areas of alluvial and aeolian transported cover More spatially coherent anomalous areas particularly related to the regolith were identified by the ASTER map products in the semi-arid and rangeland terrain of Cobar The application of different histogram stretches such as histogram equalisation was found to further enhance the display of anomalous features mdash although care should be applied regarding data thresholds The application of the ASTER map products individually as RGB composites or integrated with radiometric data appears useful for regolith mapping and identifying weathering profile-related mineralogy at Cobar Effects of residual ASTER crosstalk mis-calibration within areas of shadowdark surfacesdense vegetation and possible interpretation ambiguities between VNIR-derived ferric oxide and dry vegetation highlight the importance of validation fieldwork to check anomalous areas and their spectral signatures The validation of ASTER study sites may be assisted by DEM and fractional cover information Further investigations into the benefits of integrating artificially illuminated shaded topographic relief and AusCover fractional land cover information relevant for ASTER acquisition dates are recommended
24 May 2014
25 Quarterly Notes
Acknowledgements This study has been supported and funded by the Geological Survey of New South Wales in part for the purpose of contributing to the knowledge of the Wagga Wagga 1100 000 map sheet geology for mineral exploration Geophysical and associated data for the Wagga Wagga and Cobar study areas were received from the Geological Survey of New South Wales ASTER GeoTIFFs and BSQ ASTER map products were also gratefully obtained from Geoscience Australia and CSIROndashEarth Science amp Resource Engineering whilst the original ASTER imagery was made available by NASA and METI GIS shapefiles for the Wagga Wagga and Cobar 1250 000 map sheet areas were also gratefully obtained from Geoscience Australia Assistance is also gratefully acknowledged from Thomas Cuday and Carsten Laukamp of CSIRO and Matilda Thomas of Geoscience Australia Support from Professor Simon Jones and Laurie Buxton of RMIT University was also helpful during this study
References Caccetta M Collings S amp Cudahy C 2013 A calibration methodology for continental scale mapping using ASTER imagery Remote Sensing of Environment 139 306ndash317
Chan RA Greene RSB de Souza Kovacs N Maly BER McQueen KG amp Scott KM 2003 Regolith geomorphology geochemistry and mineralisation of the SussexndashCoolabah area in the CobarndashGirilambone region North-Western Lachlan Foldbelt NSW CRC LEME openfile report 148 NSW DMR Report GS2001319
Chen XY 1997 Quaternary sedimentation parna landforms and soil landscapes of the Wagga Wagga 1100 000 map sheet south-eastern Australia Australian Journal of Soil Research 35(3) 643ndash668
Chen XY amp McKane DJ 1997 Soil Landscapes of the Wagga Wagga 100K Sheet map and report Department of Land and Water Conservation Sydney
Clark RN King TVV Klejwa M Swayze GA amp Vergo N 1990 High spectral resolution reflectance spectroscopy of minerals Journal of Geophysical Research 95(B8) 12653ndash12680
Cudahy TJ 1997 PIMA-II spectral characteristics of natural kaolins CSIRO Exploration and Mining Report 420R 57 pp
Cudahy TJ 2012 Satellite ASTER Geoscience Product Notes for Australia Version 1 7th August 2012 CSIRO ePublish No EP-30-07-12-44
Downes PM McEvilly R amp Raphael NM 2004 Mineral deposits and models Cootamundra 1250 000 map sheet area Quarterly Notes of the Geological Survey of New South Wales 116 1ndash38
Downes PM amp Seccombe PK 2008 Sulfur isotope signatures for orogenic gold deposits Lachlan Orogen New South Wales In Proceedings of PACRIM Congress 24ndash26 November 2008 AusIMM Gold Coast Queensland Australia
Duke EF 1994 Near infrared spectra of muscovite Tschermak substitution and metamorphic reaction process implications for remote sensing Geology 22 621ndash624
Gibson DL 1999 Explanatory notes for the 1500 000 Cobar regolith landform map CRC LEME Geological Survey of NSW Open File Report 76
Grove CI Hook SJ amp Paylor ED III 1992 Laboratory reflectance spectra of 160 minerals 04 to 25 micrometers NASA Jet Propulsion Laboratory report JPL Publication 92-2
Hewson R 2013 Using ASTER and geophysical mapping to assist exploration over Wagga Wagga 1100 000 sheet area Geological Survey of New South Wales File GS20131558
Hewson RD amp Cudahy TJ 2011 Issues Affecting Geological Mapping with ASTER Data A Case Study of the Mt Fitton Area South Australia In Ramachandran B Justice CO amp Abrahams MJ (eds) Land Remote Sensing and Global Environmental Change NASArsquos Earth Observing System and the Science of ASTER and MODIS Applications in ASTER pp 273ndash300 Springer-Verlag New York
Hewson RD Cudahy TJ Drake-Brockman J Meyers J amp Hashemi A 2006 Mapping geology associated with manganese mineralization using spectral sensing techniques at Woodie Woodie East Pilbara Exploration Geophysics 37 389ndash400
Hewson RD Cudahy TJ amp Huntington JF 2001 Geologic and alteration mapping at Mt Fitton South Australia using ASTER satellite-borne data In Geoscience and Remote Sensing Symposium 2001 IGARSS lsquo01 IEEE 2001 International vol2 724ndash726
Hewson RD Cudahy TJ Mizuhiko S Ueda K amp Mauger AJ 2005 Seamless geological map generation using ASTER in the Broken HillndashCurnamona Province of Australia Remote Sensing of Environment 99(1ndash2) 159ndash172
Hewson RD Mah A Dunne M amp Cudahy TJ 2003 Mapping mineralogical and structural relationships with satellite-borne ASTER and airborne geophysics at Broken Hill ASEG 16th Geophysical Conference and Exhibition Adelaide February 2003 Australian Society Exploration Geophysicists
Hewson R Robson D Mauger A Cudahy T Thomas M amp Jones S 2013 Extracting mineralogical and geomorphological information using new ASTER mineral maps with airborne geophysics Proceedings of the ASEGndashPESA 2013 23rd International Geophysical Conference and Exhibition 11ndash14 August 2013 Melbourne Australia
Hunt GR amp Ashley RP 1979 Spectra of altered rocks in the visible and near infrared Economic Geology 74 1613ndash1629
Huntington JF Cudahy TJ Yang K Scott KM Mason P Gray DJ Berman M Bischof L Reston M S Mauger AJ Keeling JL amp Phillips RN 1999 Mineral mapping with field spectroscopy for exploration ndash final report CSIROAMIRA Project P435 CSIRO Exploration and Mining Report 419R
Iwasaki A Fujisada H Akao H Shindou O amp Akagi S 2001 Enhancement of spectral separation performance for ASTERSWIR Proceedings of SPIE (International Society for Optical Engineering) 4486 42ndash50
Iwasaki A amp Tonooka H 2005 Validation of a crosstalk correction algorithm for ASTERSWIR IEEE Transactions on Geoscience and Remote Sensing 43(12) 2747ndash2751
Laukamp C Cudahy C Caccetta M Thomas M Close D amp Lennartz R 2013 Successful mineral exploration using multispectral remote sensing data ndash ASTER Geoscience Map of Australia In Proceedings 12th Biennial Meeting of the Society of Geology Applied to Mineral Deposits (SGA) Uppsala Sweden 12ndash15 August 2013
Lewis P amp Downes PM 2008 Mineral systems and processes in New South Wales a project to enhance understanding and assist exploration Quarterly Notes of the Geological Survey of New South Wales 128
McQueen KG 2008 A guide for mineral exploration through the regolith in the Cobar Region Lachlan Orogen New South Wales Cooperative Research Centre for Landscape Environments and Mineral Exploration
Michael S 2012 Satellite imagery the range and value CSIRO Publishing for Australian Society for Exploration Geophysicists Preview 2012(160) 20ndash25
Raymond O 1993 Wagga WaggandashKyeamba region geological map 1100 000 Australian Geological Survey Organisation Canberra
Ricchetti E 2000 Multispectral satellite image and ancillary data integration for geological classification Photogrammetric Engineering amp Remote Sensing 66(4) 429ndash435
Rowan LC amp Mars JC 2003 Lithologic mapping in the Mountain Pass California area using Advanced Spaceborne Thermal Emission and Reflection Radiometer (ASTER) data Remote Sensing of Environment 84 350ndash366
Salisbury JW amp DrsquoAria DM 1992 Emissivity of terrestrial materials in the 8ndash14 μm atmospheric window Remote Sensing of Environment 42 83ndash106
Scarth P Roumlder A amp Schmidt M 2010 Tracking grazing pressure and climate interaction ndash the role of Landsat fractional cover in time series analysis In Proceedings of the 15th Australasian Remote Sensing and Photogrammetry Conference (ARSPC) 13ndash17 September Alice Springs Australia
Sherman DM 1985 The electronic structures of Fe3+ coordination sites in iron oxides application to spectra bonding and magnetism Physics and Chemistry of Minerals 12 161ndash175
Vincent RK amp Thomson F 1972 Spectral compositional imaging of silicate rocks Journal of Geophysical Research 77(14) 2465ndash2472
Yamaguchi Y Fujisada H Kahle A Tsu H Kato M Watanabe H Sato I amp Kudoh M 2001 ASTER instrument performance operation status and application to earth sciences In Geoscience and Remote Sensing Symposium 2001 IGARSS lsquo01 IEEE 2001 International vol3 1215ndash1216
26 May 2014
ShippingCONTACT Please note that we cannot ship to PO boxes
Product Order Form All prices are in Australian dollars and include Goods and Services Tax at 10 unless otherwise noted Only Australian orders are subject to the GST and all international orders will be processed exclusive of GST All totals will be billed in Australian Dollars International customers will be charged the equivalent of this rate in their respective currencies at the time the bank processes the transaction
Credit card surcharge MasterCard 04 Visa 04 AMEX 15 Diners Club 24 Other payment (NA)
Subtotal (excl GST for internationals)
TOTAL
Be sure to select international postage above if you are an overseas customer
Item Quantity Line Total Price (incl GST)
International $45 (excl GST) Postage Domestic $8 (1-2 items) $10 (3-5 items) $12 (5+ items) Express $13
o f f i c e
U S E
o n l y
FULL NAME JOB TITLE
ORGANISATION STREET ADDRESS
CITY STATE POSTCODE COUNTRY
PHONE EMAIL
CARD NUMBER NAME ON CARD
CARDHOLDER SIGNATURE DATE EXPIRY SECURITY CODE
We accept payment by credit card cheque or money order (made payable to NSW Department of Trade amp Investment) Payment
Return
Did you know Selected products can be purchased from the NSW Government Online Shop wwwshopnswgovau
Information and Customer Service Centre NSW Department of Trade amp Investment PO Box 344 Hunter Region Mail Centre NSW 2310
mineralpublicationordersindustrynswgovau
+61 2 4931 6700 Enquiries +61 2 4931 6666
wwwresourcesnswgovau
NSW Trade amp Investment Division of Resources amp Energy 516 High Street Maitland NSW 2320 PO Box 344 Hunter Region Mail Centre NSW 2310 T1300 736 122 T (02) 49316666
wwwresourcesnswgovau
Second edition Bathurst metallogenic 1250 000 map
Replacing the popular 1972 edition the updated map shows 311 metallic industrial construction material and fuel deposits classified by size commodity and deposit type A deposit classification scheme is included along with a timendashspace plot showing major mineralising events
On the back of the map is a comprehensive poster summarising the mining history and geological history of the area It features many colourful and historic images a locality map and a mining timeline
Cost $1980
- _GoBack
- 141726f49c7572d0__MailEndCompose
-
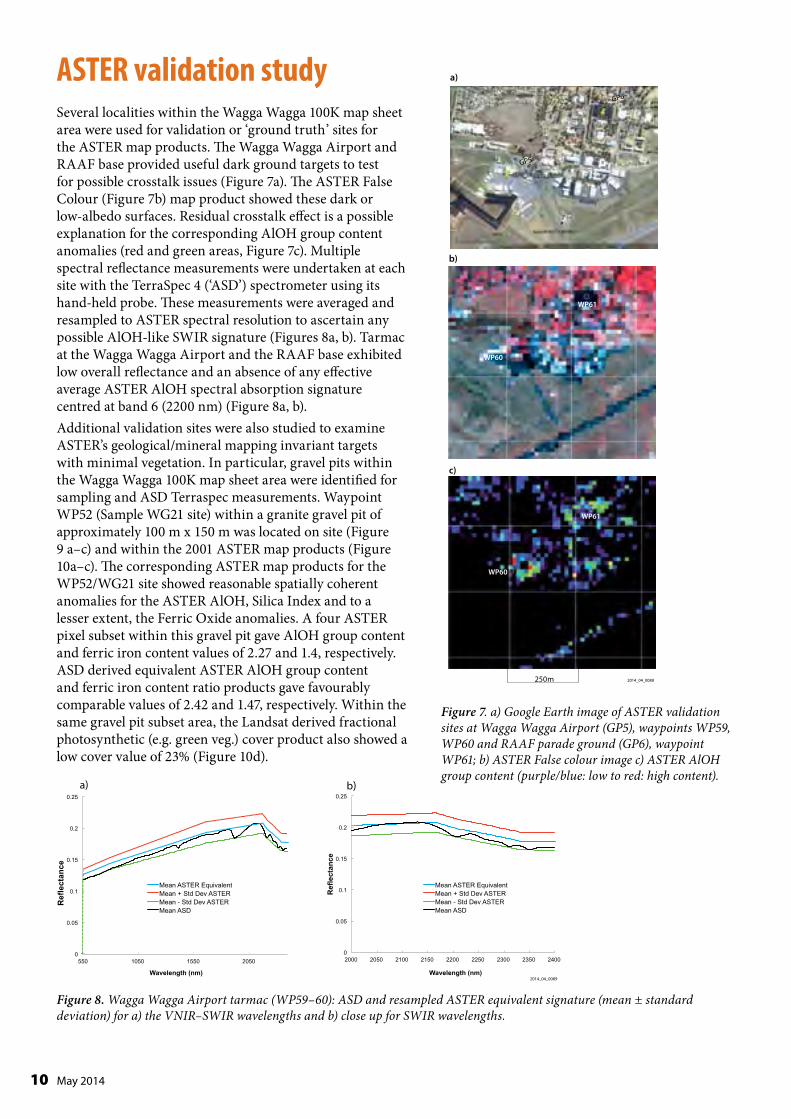
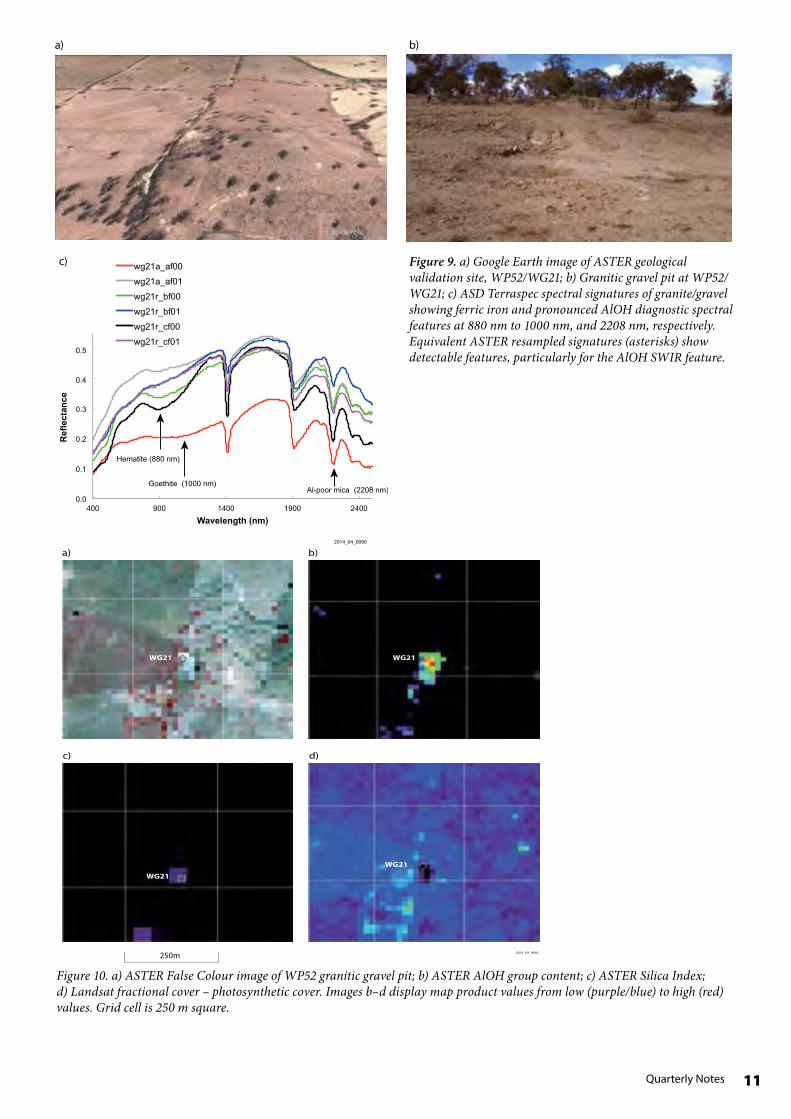
Quarterly Notes
a) b)
c) wg21a_af00 Figure 9 a) Google Earth image of ASTER geological wg21a_af01 validation site WP52WG21 b) Granitic gravel pit at WP52 wg21r_bf00 WG21 c) ASD Terraspec spectral signatures of granitegravel wg21r_bf01 showing ferric iron and pronounced AlOH diagnostic spectral wg21r_cf00 features at 880 nm to 1000 nm and 2208 nm respectively wg21r_cf01 Equivalent ASTER resampled signatures (asterisks) show
05 detectable features particularly for the AlOH SWIR feature 04
03
02
Hematite (880 nm) 01
Goethite (1000 nm) Al-poor mica (2208 nm)
00 400 900 1400 1900 2400
Wavelength (nm)
2014_04_0090
a) b)
Ref
lect
ance
WG21 WG21
c) d)
WG21
WG21
2014_04_0091250m
Figure 10 a) ASTER False Colour image of WP52 granitic gravel pit b) ASTER AlOH group content c) ASTER Silica Index d) Landsat fractional cover ndash photosynthetic cover Images bndashd display map product values from low (purpleblue) to high (red) values Grid cell is 250 m square
11
Results
WAGGA WAGGA 1100 000 map sheet area ASTER map products The Australian ASTER GeoTIFF map products were initially examined individually for the Wagga Wagga 100K map sheet area Several of the 17 products did not show significant anomalies related to geological features and were limited to (cultivated) cropping patterns at best In particular the ASTER imagery used here was acquired in mid-summer 2001 and highlighted exposed fallow fields and soils (Figure 11) The ASTER False Colour map product (Figure 11) also highlighted the town of Wagga Wagga and several vegetated areas with topographic relief (dark red to dark grey) A slight boundary anomaly is apparent at the extreme northwestern edge of the 100K scene from a change of ASTER image scenes ASTERrsquos green vegetation content product (Figure 12a) corresponds approximately with areas of red shown in the ASTER false colour product (Figure 11) although this green vegetation content product is is more correctly generated by a band ratio (bands 3band 2) targeting the chlorophyll lsquored edgersquo Exposed soil and fallow crop fields have no or low green vegetation anomalies (blue) on the floodplains and lowlands while vegetation is highlighted
Wagga Wagga
Vegetated relief
Murrumbidgee River Flood Plain
147deg00rsquoE 35deg00rsquoS
147deg00rsquoE 35deg30rsquoS
147deg30rsquoE 35deg30rsquoS
147deg30rsquoE 35deg00rsquoS
2014_04_0092
0 10 20 km
Figure 11 ASTER false colour products within Wagga Wagga 100K map sheet area
147deg00rsquoE 35deg00rsquoS
147deg00rsquoE 35deg30rsquoS
147deg30rsquoE 35deg30rsquoS
147deg30rsquoE 35deg00rsquoS
0 10 20 km
147deg00rsquoE 35deg00rsquoS
147deg00rsquoE 35deg30rsquoS
147deg30rsquoE 35deg30rsquoS
147deg30rsquoE 35deg00rsquoS
2014_04_0093
Figure 12 a) Wagga Wagga 100K ASTER green vegetation product (blue low red high content) b) ASTER AlOH content (blue low red high content)
within areas of topographic relief (Figures 11 12a) ASTERrsquos AlOH content product (Figure 12b) shows very limited clay anomalies except for the Wagga Wagga township and an apparent association with vegetated occurrences shown in the green vegetation product (Figure 12a) A green vegetation mask based on the ASTER product was applied during the generation of the AlOH composition map product and minimal anomalies were apparent
12 May 2014
13 Quarterly Notes
147deg00rsquoE 35deg00rsquoS
147deg00rsquoE 35deg30rsquoS
147deg30rsquoE 35deg30rsquoS
147deg30rsquoE 35deg00rsquoS
0 10 20 km
147deg00rsquoE 35deg00rsquoS
147deg00rsquoE 35deg30rsquoS
147deg30rsquoE 35deg30rsquoS
147deg30rsquoE 35deg00rsquoS
2014_04_0094
Figure 13 a) Wagga Wagga 100K ASTER ferric oxide content (blue low red high) and b) composition map products Apparent trends in the ferric oxide content are shown in red dashed lines
ASTERrsquos ferric oxide content and composition products (Figures 13a b) show elevated values in contrast with the AlOH group content product (Figure 12b) There is also some variation in composition from the interpreted goethite-rich (bluendashcyan) to hematite-rich (redndashyellow) (Figure 13b) Some linear trends were
Figure 13a) show boundaries and possible lineaments related to floodplain alluvium regolith or geological units Although Cudahy (2012) described the ferric oxide content as having moderate accuracy a comment is also noted for the potential of pixel spectral mixing errors and an inverse relationship with the green vegetation product This could also be either related to the obscuring effect of vegetationcrops or spectral signature ambiguities given the proximity of VNIR spectral features The ASTER FeOH and ferrous iron products in the Wagga Wagga 100K map sheet area did not generate coherent or distinct features apart from some isolated paddock anomalies The ASTER MgOH group content and composition products showed minimal occurrences except for some anomalies in the far southwestern corner which occupied farm fields adjacent to Ordovician metasedimentary rocks Likewise the kaolinite group Index showed only minor anomalies Both the ASTER MgOH group content and composition and kaolinite index products were masked for green vegetation during processing (Cudahy 2012) The Silica Index (Figure 14) proved to have less noise and highlighted more anomalies than the ASTER quartz index although the range in values and image contrast were limited Subtle anomalies highlighted by the Silica Index generally occurred within paddocks corresponding to low green vegetation and also as broader subtle variations (Figure 14)
147deg00rsquoE 35deg00rsquoS
147deg00rsquoE 35deg30rsquoS
147deg30rsquoE 35deg30rsquoS
147deg30rsquoE 35deg00rsquoS
2014_04_0095
Figure 14 Wagga Wagga 100K map sheet area ASTER silica index
apparent although the anomalies were often biased by the cropping patterns and exposed paddock soils Nonetheless some linear trends (red dashed lines in
Burkes
Creek
Sandy Creek
Murrumbidgee River
OrsquoBriens
Cre
ek
Yerong
Creek
Oly
mpi
c
Highway
Highway
Sturt
a) b)
147deg00rsquoE 147deg30rsquoE 147deg00rsquoE 147deg30rsquoE 35deg00rsquoS 35deg00rsquoS 35deg00rsquoS 35deg00rsquoS
Bulloc Bulloc Range Burngoogee Ranges
Melebo Mountains
35deg30rsquoS 35deg30rsquoS 35deg30rsquoS 35deg30rsquoS 147deg00rsquoE 147deg30rsquoE 147deg00rsquoE 147deg30rsquoE
0 10 20 km 0 10 20 km
2014_04_0096a 2014_04_0096b
Figure 15 a) Wagga Wagga 100K SRTM 80 m slope (blue low red high) b) SRTM 80 m sun-shaded imagery draped with ASTER green vegetation product (Figure 12a) masked for slope gt10
147deg00rsquoE 147deg30rsquoE35deg00rsquoS 35deg00rsquoS REFERENCE
OR
DO
VIC
IAN
S
ILU
RIA
ND
EV
ON
IAN
CE
NO
ZOICWP75 Cza Alluvium
Czg Gravelly siltstone colluvium
Du Sandstone minor conglomerate siltstone
WP76
WP74 WP73 WP72
WP77
Wagga Svu Quartzndashfeldspar phyric felsic volcanicsWagga
WP60 Sgb Buchargingah granite
WP21 Sgc Collingullie Granite
Sgf Mount Flakney Granite
Sgk Kyeamba Monzogranite
Sgr Burrandana granite
Sgw Wantabadgery Granite
Ou Siltstone shale phyllite minor schist quartzite
WP9
WP10 WP20 WP23 WP34 WP22WP11 WP19WP32
WP31 WP24WP62 WP36 WP17WP43 The Rock WP16
WP12WP58 WP13 WP15WP64 WP25WP66
WP63 WP14
WP26WP27WP49 WP28WP50 WP29 WaypointWP47
WP71WP57 Highway WP70
WP56 WP69Yerong Creek WP51 WP54 WP68 Major roadWP55
WP67WP53 Watercourse
WP52 Lake or swamp
35deg30rsquoS 35deg30rsquoS 0 10 20 km 147deg00rsquoE 147deg30rsquoE
2014_04_0097
Figure 16 Wagga Wagga 100K geology map (Raymond 1993) combined with SRTM 80 m slope gt10 showing geological units within areas of high relief
14 May 2014
15 Quarterly Notes
The nature of the geomorphology and extensive agricultural cultivation of the Wagga Wagga 100K sheet area prompted the use of DEM data to discriminate the likely geologically exposed areas Processing the SRTM 80 m DEM for slope information highlighted the major ranges and topographic relief (Figure 15a) Sun-shaded DEM imagery also highlighted these landforms (Figure 15b) Generation of a mask based on slopes greater than 10 was useful to observe relationships with the various ASTER products For example when ASTERrsquos green vegetation product masked within areas of slope gt10 is combined with sun-shaded imagery much of the higher relief is observed to be moderately to highly vegetated (Figure 15b) Figure 16 shows simplified geological units combined with SRTM data An attempt to overcome the limited range of anomalies observed within the Wagga Wagga 100K ASTER silica index product (Figure 14) using a histogram equalisation stretch within the same data range highlighted both more noise and some coherent anomalies (Figure 17a) Masking of this product with SRTM Slope product greater than 10 (Figure 17b) helped to discriminate exposed geological units as shown in Figure 16 Elevated areas of the quartz-rich sandstone of Bulloc Bulloc Range and metasedimentary rock of Livingstone National Park were highlighted by this approach (Figure 17b)
Geophysical products A similar approach to displaying and enhancing the Wagga Wagga 100K ASTER map products was applied to the airborne radiometric data where anomalous regions were extracted within the areas of elevated slope Histogram equalisation stretching of the K Th and U radioelements highlighted a mixture of alluvial deposition and outcropping geology (Figure 18a) The potassium data coherently mapped the alluvium and floodplains of Burkes Creek and the Murrumbidgee River (Figure 18a) The Mount Flakney Granite and the Bulloc Bulloc Range Ordovician (Ou) and Devonian sandstones (Du) were highlighted as anomalous using the entire 100K map sheet dataset (with histogram equalisation) but more subtle variations in radioelement composition were apparent when slope masking was applied and a simple 2 linear histogram was applied for image stretching (Figure 18b) Compositional variations within these units appeared to be enhanced by limiting the focus to areas of higher relief Increased thicknesses of aeolian deposits alluvium or colluvium on lowlands and areas of reduced slope may mask and dilute radiometric sensing of some of these units
2014_04_0098a
147deg00rsquoE 35deg00rsquoS
147deg00rsquoE 35deg30rsquoS
147deg30rsquoE 35deg30rsquoS
147deg30rsquoE 35deg00rsquoS
147deg00rsquoE 35deg00rsquoS
147deg00rsquoE 35deg30rsquoS
147deg30rsquoE 35deg30rsquoS
147deg30rsquoE 35deg00rsquoS
2014_04_0098b
0 10 20 km
Figure 17 a) Wagga Wagga 100K ASTER Silica Index product generated with a histogram equalisation stretch b) Histogram equalised ASTER silica index masked for slope gt10 (purple blue low to red high content) Areas highlighted are Bulloc Bulloc Range (white) and Livingstone National Park (yellow)
a)
b)
2014_04_0099
16 May 2014
a)
Bullo
c Bu
lloc
Rang
e D
uO
u
Mt F
lakn
ey G
rani
te
Mur
rum
bidg
ee R
iver
Burkes Creek
K U
Te
rnar
y K
Th U
Th
b)
Slop
e m
aske
d Te
rnar
ySl
ope
mas
ked
K Sl
ope
mas
ked
ThSl
ope
mas
ked
U
Figu
re 1
8 a
) Wag
ga W
agga
100
K a
irbor
ne ra
diom
etri
c dat
a K
Th U
and
as a
Ter
nary
imag
e (RG
B K
Th U
) di
spla
yed
with
a h
istog
ram
equa
lisat
ion
stre
tch
b)
K Th
U T
erna
ry im
age m
aske
d fo
r slo
pes gt
10
disp
laye
d w
ith a
2
line
ar h
istog
ram
stre
tch
Geo
logi
cal f
eatu
res d
iscus
sed
in te
xt a
re ci
rcle
d
17 Quarterly Notes
0 10 20 km
c) d)
a) b)
Bulloc Bulloc Range DuOu
Mt Flakney Granite (Sgf)
Figure 19 Apparent trends in the ASTER ferric oxide content (from Figure 13a) are shown as red dashed lines a) TMI 1VD (greyscale) overlain with ASTER ferric oxide content b) TMI 1VD (greyscale) overlain with K Th U Ternary RGB imagery (Red K Green Th Blue U) c) RTP TMI (greyscale) over tilt-filtered RTP TMI (pseudocolour) d) Sun-shaded SRTM DEM (greyscale) overlain with tilt-filtered TMI (pseudocolour)
Bulloc Bulloc Range DuOu
Mt Flakney Granite (Sgf)
Bulloc Bulloc Range DuOu
Mt Flakney Granite (Sgf)
2014_04_0100
Filtered aeromagnetic data for the Wagga Wagga 100K map sheet area were used in an effort to extract structural information and also to highlight near-surface trends of iron-bearing unitsmagnetite and possible correlations with the ASTER map products ASTERrsquos ferric oxide content showed some trends albeit revealed within exposed paddocks (Figure 13a) that showed northwest-trending and some possible northeast-trending features that correlated approximately with First Vertical Derivative (1VD) TMI lineaments (Figure 19a) The VNIR spectral signature of magnetite is essentially aspectral and not likely to be revealed by the ASTER Ferric Oxide Content product directly However weathering of magnetite-bearing rocks may possibly be associated with increased ferric iron oxide minerals within soils exposed here Integrating radiometric ternary imagery over TMI 1VD (Figure 19b) reveals similar northwest trends as Figure 19a In addition Figure 19b reveals a
complex series of north-northwest-trending lineaments along the western boundary of the K-rich Mount Flakney Granite and northwest-trending lineaments east of the sheared Bulloc Bulloc Range Devonian and Ordovician units RTP TMI over tilt-filtered Reduced to the Pole (RTP) TMI (Figure 19c) highlighted several lineaments with some corresponding to those interpreted with ASTER ferric oxide and radiometric data (Figure 19a b) The integration of tilt-filtered TMI over sun-shaded SRTM DEM (Figure 19d) also revealed some correlation of northndashnorth-northwest and cross-cutting north-northeast lineaments with topographic relief and valleys (Figure 5a) related to either outcropping geological units or possible structural and tectonic movements The tilt-filtered TMI within this Wagga 100K area appears to reveal increased high-frequency features and anomalies useful for detailed interpretation
REFERENCE
Highway
Major road
Watercourse
Lake or swamp
Cza
Czg
Du
Svu
Sgb
Sgr
Ou
Alluvium
Gravelly siltstone colluvium
Buchargingah granite
Burrandana granite
Sandstone minor conglomerate siltstone
Quartzndashfeldspar phyric felsic volcanics
Siltstone shale phyllite minor schist quartzite
CE
NO
ZOIC
DE
VO
NIA
NS
ILU
RIA
NO
RD
OV
ICIA
N
2014_04_0101
Yerong
Burkes
Creek
Cree
k
Creek
Stony
Watt
le
Creek
Hig
hway
Oly
mpi
c
The Rock
YerongCreek
A
B
147deg00rsquoE
147deg00rsquoE 147deg14rsquoE
147deg14rsquoE
35deg12rsquoS 35deg12rsquoS
35deg24rsquoS 35deg24rsquoS
0 5 10 km
Yerong
Burkes
Creek
Cree
k
Creek
Stony
Watt
le
Creek
Hig
hway
Oly
mpi
c The Rock
Yerong Creek
A
B
147deg00rsquoE
147deg00rsquoE 147deg14rsquoE
147deg14rsquoE
35deg12rsquoS 35deg12rsquoS
35deg24rsquoS 35deg24rsquoS
0 5 10 km
REFERENCE
Cza
Czg
Alluvium
Gravelly siltstone colluvium
Du Sandstone minor conglomerate siltstone
Svu Quartzndashfeldspar phyric felsic volcanics
Buchargingah granite
Burrandana granite
Ou Siltstone shale phyllite minor schist quartzite
Highway
Major road
Watercourse
Lake or swamp
Sgb
Sgr
2014_04_0101
Figure 20 Location of The Rock Hill (A) and Flowerpot Hill (B) on part of the Wagga Wagga 100K geological map (Raymond 1993)
a) b) O
RD
OV
ICIA
N
SIL
UR
IAN
DE
VO
NIA
NC
EN
OZO
IC
c) d)
NA
NA
NA
NA
NA NAWG16
WG17 WG18
WG23
WG26
WG19
Mag Low-Demagnetisation (removal of iron via metasomatic fluid alteration)
Axis Axis
Mag Low Radiometrics ternary RGB K Th U
Radiometrics Potassium (Histogram equalised)
O 10km
2014_04_0102
Figure 21 The Rock Hill and Flowerpot Hill area of Figure 20 (approx) a) ASTER false colour b) RTP TMI over Tilt-filtered TMI c) Radiometrics Ternary (RGB K Th U) d) Radiometrics K (blue low red high) Major lineaments magnetic low and fold structure are shown NA = site not sampled in study
18 May 2014
b)REFERENCE
Waypoint site
Highway
Major road
Watercourse
Lake or swamp
Cza
Czg
Du
Svu
Sgb
Sgr
Ou
Alluvium
Gravelly siltstone colluvium
Buchargingah granite
Burrandana granite
Sandstone minor conglomerate siltstone
Quartzndashfeldspar phyric felsic volcanics
Siltstone shale phyllite minor schist quartzite
CE
NO
ZOIC
DE
VO
NIA
NS
ILU
RIA
NO
RD
OV
ICIA
N
2014_04_0103a
Yerong
Burke
s
Creek
Cree
k
Creek
Stony
Watt
le
Creek
Hig
hway
Oly
mpi
c
The Rock
YerongCreek
WP66WP63
WP37
WP56
WP57
WP50
WP35WP62
WP38
WP49
WP36
WP47
35deg23rsquoS147deg00rsquoE
147deg00rsquoE 147deg14rsquoE
35deg23rsquoS147deg14rsquoE
35deg14rsquoS35deg14rsquoS
0 5 10 km
Quarterly Notes
a) REFERENCE
Cza
Czg
Alluvium
Gravelly siltstone colluvium
CE
NO
ZOIC
Sandstone minor conglomerate siltstone
Mag Low ASTER AIOH content 35deg14rsquoS 35deg14rsquoS
35deg23rsquoS 35deg23rsquoS 147deg00rsquoE
147deg00rsquoE 147deg14rsquoE
147deg14rsquoE
2014_04_0103b
Yerong
Burke
s
Creek
Cree
k
Creek
Stony
Watt
le
Creek
Hig
hway
Oly
mpi
c
The Rock
Yerong Creek
WP66 WP63
WP37
WP56
WP57
WP50
WP35 WP62
WP38
WP49
WP36
WP47
35deg23rsquoS 147deg00rsquoE
147deg00rsquoE 147deg14rsquoE
35deg23rsquoS 147deg14rsquoE
35deg14rsquoS35deg14rsquoS
0 5 10 km
b)
c)
Du
Svu
Sgb
Sgr
Ou Siltstone shale phyllite minor schist quartzite
Waypoint site
Highway
Major road
Watercourse
Lake or swamp 2014_04_0103a
The Rock Hill and Flowerpot Hill Devonian and Ordovician metasedimentary units in the central western part of the Wagga Wagga 100K map sheet area (Figure 20) provided a useful target and potentially prospective area to closely examine ASTER and geophysical mapping issues and opportunities for data integration The ASTER false colour product highlights the elevated Bulloc Bulloc Range including The Rock and Flowerpot Hill surrounded by farm paddocks and cultivation (Figure 21a) The geophysics highlights some interesting lineaments a fold structure and a magnetic low (Figures 21bndashd) In particular the tilt-filtered TMI data shows a prominent pair of north-northwestndashsouth-southeast lineaments (Figure 21b) approximately parallel to the apparent hinge linefold axis of the DevonianOrdovician metasedimentary rocks (Figure 21c d) and also bounding a likely deep-seated magnetic low (Figure 21b) Ternary and K radiometric anomalies appear to cross-cut the
OR
DO
VIC
IAN
S
ILU
RIA
ND
EV
ON
IAN
Quartzndashfeldspar phyric felsic volcanics
Buchargingah granite
Burrandana granite
ASTER silica index 35deg14rsquoS
35deg23rsquoS 35deg23rsquoS 147deg00rsquoE
147deg00rsquoE 147deg14rsquoE
147deg14rsquoE
35deg14rsquoS
0 5 10 km
2014_04_0103c
Devonian and Ordovician stratigraphy when they are overlain on the geology map (Figure 22a) A modified version of the ASTER AlOH content map masked for both SRTM-derived slopes greater than 10 and less than 45 Landsat-derived photosynthetic (PV or lsquogreenrsquo) vegetation fraction cover appears to highlight some increase in mica content in the main hinge line axis (red areas Figure 22b) Figure 22b was also displayed using histogram equalisation using thresholds described by Cudahy (2012) The silica index product with a histogram equalisation stretch also appears to highlight some increase in silica along the axis (Figure 22c) Field observations of increased quartz and ASD spectral measurements identifying AlOH minerals phengite and kaolinite (Figure 23) appear to confirm this interpretation Hematite is also common within The Rock Hill and Flowerpot Hill area
Figure 22 The Rock Hill and Flowerpot Hill a) Wagga Wagga 100K geological map with geophysical features from Figure 21 b) ASTER AlOH masked for gt10 slope and lt45 PV Landsat fraction histogram equalised Mica anomaly is circled c) ASTER silica index histogram equalised Silica anomaly is circled Purpleblue low to red high content
19
Ref
lect
ance
050
040
030
020
010
000
wg26r_bw00000
wg23r_bw00001
Hematite signature (860 nm) Al poor mica or Phengite (eg 2209 nm absorption)
400 900 1400 1900 2400
Wavelength (nm) 2014_04_0104
Figure 23 Example ASD spectral signature of rock outcrop samples (WG23 26 ndash see Figure 21a) at Flowerpot Hill showing Al-poor micaAlOH and hematite diagnostic features
ASTER data issues and qualifications on interpretation Acquisition of ASTER satellite imagery at about 1030 am (Australian Eastern Daylight Time) can potentially produce sharp shadows on steep westerly slopes within high relief areas The ASTER satellite sensor has an additional issue of potential false anomalies from the lsquocrosstalkrsquo mis-calibration of its shortwave IR sensor (bands 5ndash9) as used for the generation of AlOH or micaclay mineral maps Dark shaded areas appear on the western slopes of The Rock and Flowerpot Hill as a result of north- and northwest-trending ridgelines as shown in the sun-shaded DEM imagery generated to simulate illumination conditions on 1112001 at 1030 am (blue ellipses Figure 24a) These areas of deep shadow appear to be coincident with some of the AlOH anomalies (red ellipse Figure 22b) and potentially the result of false anomalies associated with crosstalk
0 4km a)
WP 62 WP 35
WP 36 WP 37
WP 33
WP 38
WP 65
WP 66
WP 58
WP 45
SRTM DEM sun shaded (el 60˚ Az 72˚)
b)
(Figure 24b) However areas of full illumination on the northeast slopes also show AlOH anomalies and the crosstalk explanation does not entirely negate the AlOH presence Overall these results suggest that residual crosstalk effects are a possibility within dark areas of shadow and vegetation cover and bitumen (eg the Wagga AirfieldRAAF base) The validation of ASTER study sites can be assisted with the aid of DEMs fractional cover information field observations and ideally a VNIRndashSWIR spectrometer
ASTER AIOH mica content (hist eq) masked for 45 lt green vegetationgt 10 slope
Figure 24 a) Sun-shaded SRTM 80 m DEM of The Rock Hill and Flowerpot Hill (60deg elevation 072deg azimuth) simulating illumination conditions and shaded relief during ASTER image acquisition (1112001) b) ASTER AlOH content and corresponding areas of shaded relief (dashed ellipses)
Figure 25 The Rock Reserve WP62 a) Casuarina open woodland b) ferruginous gravel with lichen and moss ground cover c) typical canopy cover
20 May 2014
Quarterly Notes
a) b) c)
WP62
WP35
WP36 WP37
WP38WP40 WP39
WP58
WP65 WP63
WP66
WP62
WP35
WP36 WP37
WP38WP40 WP39
WP58
WP65 WP63
WP66
WP62
WP35
WP36 WP37
WP38WP40 WP39
WP58
WP65 WP63
WP66
0 20 40 60 80 100 0 20 40 60 80 100 0 20 40 60 80
non-photosynthetic Bare ground photosynthetic
4km 2014_04_01060
Figure 26 a) ndash c) Landsat fractional cover estimates for The Rock Hill mdash the same area as in Figure 24
Field observations and ASD in-situ field measurements of gravel lag vegetation ground litter etc at Waypoint WP62 (Figure 22a 24a) were undertaken near The Rock (Figure 25andashc) AusCover fractional cover estimates using Landsat acquired 1012001 one day before the ASTER gave values of 18 bare ground 41 photosynthetic and 40 non-photosynthetic vegetation cover for supplied 30m pixels encompassing WP62 Fractional cover imagery for the Bulloc Bulloc RangeThe Rock shows that the cover is dominated by photosynthetic and to a lesser extent non-photosynthetic vegetation (Figures 26andashc) ASD in-situ field measurements of gravel lag vegetation and ground litter at WP62 were processed to simulate ASTER ferric oxide content and green vegetation indices (Figure 27) This limited series of measurements suggested that the presence of dry vegetation matter (eg lichen bark leaf litter) can hinder the ASTER interpretation of ferric iron (eg hematite goethite) useful for regolith profile information andor alteration involving hematisation (Figure 27) Simulated values for ASTERrsquos AlOH content index from W62 gravel
The Rock Hill - Waypoint 62
Green tree and shrub foliage ground moss Devonian ferruginous sandstone gravel lag Lichen bark and leaf litter
1 3
0
4
2
AST
ER -
Gre
en V
eget
atio
n
ASTER - Ferric Oxide Content
Figure 27 ASD field spectral signatures of vegetation and gravel samples from The Rock Hill (WP 62) resampled and processed into equivalent ASTER map indices for green vegetation and ferric oxide content
lag ASD measurements produced values between 19 and 215 within the threshold range used to generate ASTER AlOH content imagery (Cudahy 2012) This compares favourably with the ASTER AlOH content index value of 20 as an average for 2 x 30 m pixels at WP62 extracted from the map product
Cobar 1100 000 and Canbelego 1100 000 map sheet areas The ASTER map products over the Cobar 1250 000 map sheet area are less affected by agricultural cultivation than the Wagga Wagga area as highlighted by ASTERrsquos false colour showing only approximately 25 under cultivationcropping to the east (Figure 28a) Isolated cloud cover is also apparent in the eastern third of the Cobar 1250 000 map sheet area where the map product is generated from a separate ASTER scene (Figure 28a) ASTERrsquos regolith product is useful for highlighting the extensive ephemeral drainage patterns (Figure 28b) As described by Cudahy (2012) the Regolith product based on the Landsat TM Regolith ratios helps to separate regolith and geological units while vegetated areas are highlighted by whitebright areas and clouds in blue (Figure 28b) ASTERrsquos green vegetation product also shows the limited nature of the green vegetation cover restricted to watercourses outside of the cultivated areas (Figure 28c) The land cover is more explicitly highlighted in the Landsat-derived fractional cover image which shows that close to the time of ASTER acquisition (September 2003) the most exposed bare ground was within the Cobar 100K map sheet area and to a lesser extent Canbelego 100K (reddish areas Figure 28d) Non photosynthetic vegetation (lsquodry vegetationrsquo) still appears pervasive in the non-cultivated areas (blue areas Figure 28d) which may be an issue for some ASTER map products
21
100
c) d)
a) b)
145ordm30E 147ordm00E 145ordm30E 147ordm00E 31ordm00S 31ordm00S
32ordm00S 32ordm00S
145ordm30E 147ordm00E 145ordm30E 147ordm00E
31ordm00S 31ordm00S
32ordm00S 32ordm00S
Figure 28 Cobar 1250K map sheet area a) ASTER false colour Note clouds and shadows in lower right b) ASTER regolith colour coded as for standard CSIRO Landsat Regolith product (Cudahy 2012) c) ASTER green vegetation (blue low red high) d) Landsat fractional cover RGB Red bare ground Green photosynthetic vegetation Blue non-photosynthetic vegetation (linear stretch 0ndash100)
a) b) 145ordm30E 147ordm00E 145ordm30E 147ordm00E
31ordm00S 31ordm00S
32ordm00S32ordm00S
Figure 29 Cobar 1250K map sheet area a) ASTER ferric oxide content (blue low red high) b) ASTER ferric oxide composition (histogram equalised) (blue goethitic red hematitic) c) ASTER AlOH group content (histogram equalised) (blue low red high) Note that cloud cover in eastern 100K maps introduces false anomalies (see Figure 28a)
32ordm00S
31ordm00S
c) 145ordm30E 147ordm00E
31ordm00S
32ordm00S
2014_04_0109
22 May 2014
23 Quarterly Notes
a) b) 145ordm30E 147ordm00E 145ordm30E 147ordm00E
31ordm00S 31ordm00S
32ordm00S 32ordm00S
147ordm00E
31ordm00S 145ordm30E 147ordm00E 145ordm30E
31ordm00S
32ordm00S32ordm00S
Figure 30 a) ASTER AlOH group composition (histogram equalised) (blue Al-rich micawell ordered kaolinite red Al-poor mica) b) ASTER silica index (histogram equalised) (blue low red high) c) Radiometric K (blue low red high) d) Radiometric Th (blue low red high)
c) d)
2014_04_0110
The ASTER Ferric Oxide Content product highlights coherent and continuous spatial distribution across the Cobar 1250 000 sheet area with increased abundance within the Cobar 100K area (Figure 29a) An improved insight into the ferric iron oxide was provided by the ASTERrsquos ferric oxide composition using histogram equalisation (Figure 29b) rather than a Gaussian stretch within the same threshold stretch limits advised by Cudahy (2012) Using the histogram equalised version of the ASTER ferric oxide composition product highlights more clearly an apparent increase in hematitic composition within the western Cobar 250K including the Cobar 100K map sheet area (Figure 29b) The presence of hematite versus goethite may be important for regolith interpretation and understanding of the arearsquos possible lateritic weathering (Huntington et al 1999) However care should also be taken when interpreting ferric oxide content and composition in the presence of dry vegetation matter mdash as observed at The Rock Hill (Figure 27) and also noted by Cudahy (2012) The areas highlighted by ASTER with increased hematite also coincide with increased abundance of AlOH minerals as shown by the histogram equalised version of the ASTER AlOH group content (greenndashyellow areas Figure 29c) The ASTER AlOH group composition product (histogram equalised Figure 30a) highlights extensive
areas of low values (blue) in the western Cobar 250K sheet area including within the Cobar 100K Cudahy (2012) interpreted such low ASTER AlOH composition product values as mapping well-ordered kaolinite or Al-rich white mica These areas also appear to coincide with the interpreted hematite-rich areas shown in Figure 29b (red areas) If a lateritic profile mineral model (Huntington et al 1999) is assumed then questions arise whether these areas lie within the highly weathered hematite-bearing duricrust or less-weathered ordered kaolinite-bearing saprolite The ASTER kaolin group index product for Cobar 250K sheet area does not indicate significant anomalies using linear or histogram equalised versions Cobar regolith landform mapping indicates much of the Cobar 100K area is highly weathered in situ bedrock (Gibson 1999) However validation field work involving sampling and ASD measurements should clarify these issues The ASTER silica index product does appear to indicate high silica content along the western boundary of the Cobar 100K sheet area that coincides with elevated areas mapped by Gibson (1999) containing cappings of silicified sedimentary units (histogram equalised Figure 30b) Geophysical radiometric products K and Th also highlight distinctive units with the Cobar 100K and Canbelego 100K map sheet areas (Figures 30c d) The K and Th images mostly appear to map in an approximate complementary way areas of alluvial
a)
147ordm00E 31ordm00S
145ordm30E
32ordm00S
b) 145ordm30E 147ordm00E
31ordm00S
32ordm00S
Figure 31 a) RGB composite ASTERrsquos AlOH content (histogram equalised) ferric oxide content silica index (histogram equalised) b) RGB composite K ASTERrsquos ferric oxide content AlOH content over shaded DEM
(eg K) and in situ regolith units (eg Th) (Figures 30c d) In particular the drainage areas appear rich in apparently K-bearing clays (Figure 30c) whilst the Th occurs where there are non-drainage in situ relict areas (Figure 30c) possibly related to ferricrete Further ground truthing would help this interpretation An RGB composite image of ASTERrsquos AlOH group content ferric oxide content and silica index products appeared to discriminate generally elevated combined clay- and quartz-rich units (eg red+blue areas shown as purple) from ferric iron oxide minerals (green) within some drainage areas (Figure 31a) A RGB composite image of the radioelement K ASTER ferric oxide content and ASTER AlOH group content products also generated significant and complex spatially coherent patterns particularly within the Cobar and Canbelego 100K sheet areas that appear worthy of further examination for regolith information (Figure 31b)
2014_04_0111
Conclusions This project demonstrated within the NSW study areas of Wagga Wagga and Cobar the usefulness of the recently released Australia ASTER map products supplied by CSIROGA for identifying or discriminating variations in surface composition The map products included mineral identitiesgroups within geological units possible overprinted alteration andor weathered regolith These map products can potentially aid mineral exploration in NSW within semi-arid areas such as Cobar and to a lesser extent within open woodland and cultivated environments such as Wagga Wagga Although several ASTER map products provided useful information as individual entities their application generally benefits exploration when integrated with geophysical topographical and fractional land cover information In particular DEM-derived slope information and vegetation fractional data were used to mask and refine ASTER map products in the Wagga area within the temperate and vegetated Riverine Plains Anomalous AlOH- and silica-rich areas were discriminated and associated with radiometric and high frequency filtered TMI-inferred structures in the vicinity of the Bulloc Bulloc Range especially at The Rock Hill ASTER Ferric Iron Content product within the Wagga Wagga area also appeared to show northwest lineament trends similar to those highlighted by filtered TMI products Map generation for the Murrumbidgee floodplains using radiometric data also appeared to benefit from topographic slope masking to exclude areas of alluvial and aeolian transported cover More spatially coherent anomalous areas particularly related to the regolith were identified by the ASTER map products in the semi-arid and rangeland terrain of Cobar The application of different histogram stretches such as histogram equalisation was found to further enhance the display of anomalous features mdash although care should be applied regarding data thresholds The application of the ASTER map products individually as RGB composites or integrated with radiometric data appears useful for regolith mapping and identifying weathering profile-related mineralogy at Cobar Effects of residual ASTER crosstalk mis-calibration within areas of shadowdark surfacesdense vegetation and possible interpretation ambiguities between VNIR-derived ferric oxide and dry vegetation highlight the importance of validation fieldwork to check anomalous areas and their spectral signatures The validation of ASTER study sites may be assisted by DEM and fractional cover information Further investigations into the benefits of integrating artificially illuminated shaded topographic relief and AusCover fractional land cover information relevant for ASTER acquisition dates are recommended
24 May 2014
25 Quarterly Notes
Acknowledgements This study has been supported and funded by the Geological Survey of New South Wales in part for the purpose of contributing to the knowledge of the Wagga Wagga 1100 000 map sheet geology for mineral exploration Geophysical and associated data for the Wagga Wagga and Cobar study areas were received from the Geological Survey of New South Wales ASTER GeoTIFFs and BSQ ASTER map products were also gratefully obtained from Geoscience Australia and CSIROndashEarth Science amp Resource Engineering whilst the original ASTER imagery was made available by NASA and METI GIS shapefiles for the Wagga Wagga and Cobar 1250 000 map sheet areas were also gratefully obtained from Geoscience Australia Assistance is also gratefully acknowledged from Thomas Cuday and Carsten Laukamp of CSIRO and Matilda Thomas of Geoscience Australia Support from Professor Simon Jones and Laurie Buxton of RMIT University was also helpful during this study
References Caccetta M Collings S amp Cudahy C 2013 A calibration methodology for continental scale mapping using ASTER imagery Remote Sensing of Environment 139 306ndash317
Chan RA Greene RSB de Souza Kovacs N Maly BER McQueen KG amp Scott KM 2003 Regolith geomorphology geochemistry and mineralisation of the SussexndashCoolabah area in the CobarndashGirilambone region North-Western Lachlan Foldbelt NSW CRC LEME openfile report 148 NSW DMR Report GS2001319
Chen XY 1997 Quaternary sedimentation parna landforms and soil landscapes of the Wagga Wagga 1100 000 map sheet south-eastern Australia Australian Journal of Soil Research 35(3) 643ndash668
Chen XY amp McKane DJ 1997 Soil Landscapes of the Wagga Wagga 100K Sheet map and report Department of Land and Water Conservation Sydney
Clark RN King TVV Klejwa M Swayze GA amp Vergo N 1990 High spectral resolution reflectance spectroscopy of minerals Journal of Geophysical Research 95(B8) 12653ndash12680
Cudahy TJ 1997 PIMA-II spectral characteristics of natural kaolins CSIRO Exploration and Mining Report 420R 57 pp
Cudahy TJ 2012 Satellite ASTER Geoscience Product Notes for Australia Version 1 7th August 2012 CSIRO ePublish No EP-30-07-12-44
Downes PM McEvilly R amp Raphael NM 2004 Mineral deposits and models Cootamundra 1250 000 map sheet area Quarterly Notes of the Geological Survey of New South Wales 116 1ndash38
Downes PM amp Seccombe PK 2008 Sulfur isotope signatures for orogenic gold deposits Lachlan Orogen New South Wales In Proceedings of PACRIM Congress 24ndash26 November 2008 AusIMM Gold Coast Queensland Australia
Duke EF 1994 Near infrared spectra of muscovite Tschermak substitution and metamorphic reaction process implications for remote sensing Geology 22 621ndash624
Gibson DL 1999 Explanatory notes for the 1500 000 Cobar regolith landform map CRC LEME Geological Survey of NSW Open File Report 76
Grove CI Hook SJ amp Paylor ED III 1992 Laboratory reflectance spectra of 160 minerals 04 to 25 micrometers NASA Jet Propulsion Laboratory report JPL Publication 92-2
Hewson R 2013 Using ASTER and geophysical mapping to assist exploration over Wagga Wagga 1100 000 sheet area Geological Survey of New South Wales File GS20131558
Hewson RD amp Cudahy TJ 2011 Issues Affecting Geological Mapping with ASTER Data A Case Study of the Mt Fitton Area South Australia In Ramachandran B Justice CO amp Abrahams MJ (eds) Land Remote Sensing and Global Environmental Change NASArsquos Earth Observing System and the Science of ASTER and MODIS Applications in ASTER pp 273ndash300 Springer-Verlag New York
Hewson RD Cudahy TJ Drake-Brockman J Meyers J amp Hashemi A 2006 Mapping geology associated with manganese mineralization using spectral sensing techniques at Woodie Woodie East Pilbara Exploration Geophysics 37 389ndash400
Hewson RD Cudahy TJ amp Huntington JF 2001 Geologic and alteration mapping at Mt Fitton South Australia using ASTER satellite-borne data In Geoscience and Remote Sensing Symposium 2001 IGARSS lsquo01 IEEE 2001 International vol2 724ndash726
Hewson RD Cudahy TJ Mizuhiko S Ueda K amp Mauger AJ 2005 Seamless geological map generation using ASTER in the Broken HillndashCurnamona Province of Australia Remote Sensing of Environment 99(1ndash2) 159ndash172
Hewson RD Mah A Dunne M amp Cudahy TJ 2003 Mapping mineralogical and structural relationships with satellite-borne ASTER and airborne geophysics at Broken Hill ASEG 16th Geophysical Conference and Exhibition Adelaide February 2003 Australian Society Exploration Geophysicists
Hewson R Robson D Mauger A Cudahy T Thomas M amp Jones S 2013 Extracting mineralogical and geomorphological information using new ASTER mineral maps with airborne geophysics Proceedings of the ASEGndashPESA 2013 23rd International Geophysical Conference and Exhibition 11ndash14 August 2013 Melbourne Australia
Hunt GR amp Ashley RP 1979 Spectra of altered rocks in the visible and near infrared Economic Geology 74 1613ndash1629
Huntington JF Cudahy TJ Yang K Scott KM Mason P Gray DJ Berman M Bischof L Reston M S Mauger AJ Keeling JL amp Phillips RN 1999 Mineral mapping with field spectroscopy for exploration ndash final report CSIROAMIRA Project P435 CSIRO Exploration and Mining Report 419R
Iwasaki A Fujisada H Akao H Shindou O amp Akagi S 2001 Enhancement of spectral separation performance for ASTERSWIR Proceedings of SPIE (International Society for Optical Engineering) 4486 42ndash50
Iwasaki A amp Tonooka H 2005 Validation of a crosstalk correction algorithm for ASTERSWIR IEEE Transactions on Geoscience and Remote Sensing 43(12) 2747ndash2751
Laukamp C Cudahy C Caccetta M Thomas M Close D amp Lennartz R 2013 Successful mineral exploration using multispectral remote sensing data ndash ASTER Geoscience Map of Australia In Proceedings 12th Biennial Meeting of the Society of Geology Applied to Mineral Deposits (SGA) Uppsala Sweden 12ndash15 August 2013
Lewis P amp Downes PM 2008 Mineral systems and processes in New South Wales a project to enhance understanding and assist exploration Quarterly Notes of the Geological Survey of New South Wales 128
McQueen KG 2008 A guide for mineral exploration through the regolith in the Cobar Region Lachlan Orogen New South Wales Cooperative Research Centre for Landscape Environments and Mineral Exploration
Michael S 2012 Satellite imagery the range and value CSIRO Publishing for Australian Society for Exploration Geophysicists Preview 2012(160) 20ndash25
Raymond O 1993 Wagga WaggandashKyeamba region geological map 1100 000 Australian Geological Survey Organisation Canberra
Ricchetti E 2000 Multispectral satellite image and ancillary data integration for geological classification Photogrammetric Engineering amp Remote Sensing 66(4) 429ndash435
Rowan LC amp Mars JC 2003 Lithologic mapping in the Mountain Pass California area using Advanced Spaceborne Thermal Emission and Reflection Radiometer (ASTER) data Remote Sensing of Environment 84 350ndash366
Salisbury JW amp DrsquoAria DM 1992 Emissivity of terrestrial materials in the 8ndash14 μm atmospheric window Remote Sensing of Environment 42 83ndash106
Scarth P Roumlder A amp Schmidt M 2010 Tracking grazing pressure and climate interaction ndash the role of Landsat fractional cover in time series analysis In Proceedings of the 15th Australasian Remote Sensing and Photogrammetry Conference (ARSPC) 13ndash17 September Alice Springs Australia
Sherman DM 1985 The electronic structures of Fe3+ coordination sites in iron oxides application to spectra bonding and magnetism Physics and Chemistry of Minerals 12 161ndash175
Vincent RK amp Thomson F 1972 Spectral compositional imaging of silicate rocks Journal of Geophysical Research 77(14) 2465ndash2472
Yamaguchi Y Fujisada H Kahle A Tsu H Kato M Watanabe H Sato I amp Kudoh M 2001 ASTER instrument performance operation status and application to earth sciences In Geoscience and Remote Sensing Symposium 2001 IGARSS lsquo01 IEEE 2001 International vol3 1215ndash1216
26 May 2014
ShippingCONTACT Please note that we cannot ship to PO boxes
Product Order Form All prices are in Australian dollars and include Goods and Services Tax at 10 unless otherwise noted Only Australian orders are subject to the GST and all international orders will be processed exclusive of GST All totals will be billed in Australian Dollars International customers will be charged the equivalent of this rate in their respective currencies at the time the bank processes the transaction
Credit card surcharge MasterCard 04 Visa 04 AMEX 15 Diners Club 24 Other payment (NA)
Subtotal (excl GST for internationals)
TOTAL
Be sure to select international postage above if you are an overseas customer
Item Quantity Line Total Price (incl GST)
International $45 (excl GST) Postage Domestic $8 (1-2 items) $10 (3-5 items) $12 (5+ items) Express $13
o f f i c e
U S E
o n l y
FULL NAME JOB TITLE
ORGANISATION STREET ADDRESS
CITY STATE POSTCODE COUNTRY
PHONE EMAIL
CARD NUMBER NAME ON CARD
CARDHOLDER SIGNATURE DATE EXPIRY SECURITY CODE
We accept payment by credit card cheque or money order (made payable to NSW Department of Trade amp Investment) Payment
Return
Did you know Selected products can be purchased from the NSW Government Online Shop wwwshopnswgovau
Information and Customer Service Centre NSW Department of Trade amp Investment PO Box 344 Hunter Region Mail Centre NSW 2310
mineralpublicationordersindustrynswgovau
+61 2 4931 6700 Enquiries +61 2 4931 6666
wwwresourcesnswgovau
NSW Trade amp Investment Division of Resources amp Energy 516 High Street Maitland NSW 2320 PO Box 344 Hunter Region Mail Centre NSW 2310 T1300 736 122 T (02) 49316666
wwwresourcesnswgovau
Second edition Bathurst metallogenic 1250 000 map
Replacing the popular 1972 edition the updated map shows 311 metallic industrial construction material and fuel deposits classified by size commodity and deposit type A deposit classification scheme is included along with a timendashspace plot showing major mineralising events
On the back of the map is a comprehensive poster summarising the mining history and geological history of the area It features many colourful and historic images a locality map and a mining timeline
Cost $1980
- _GoBack
- 141726f49c7572d0__MailEndCompose
-
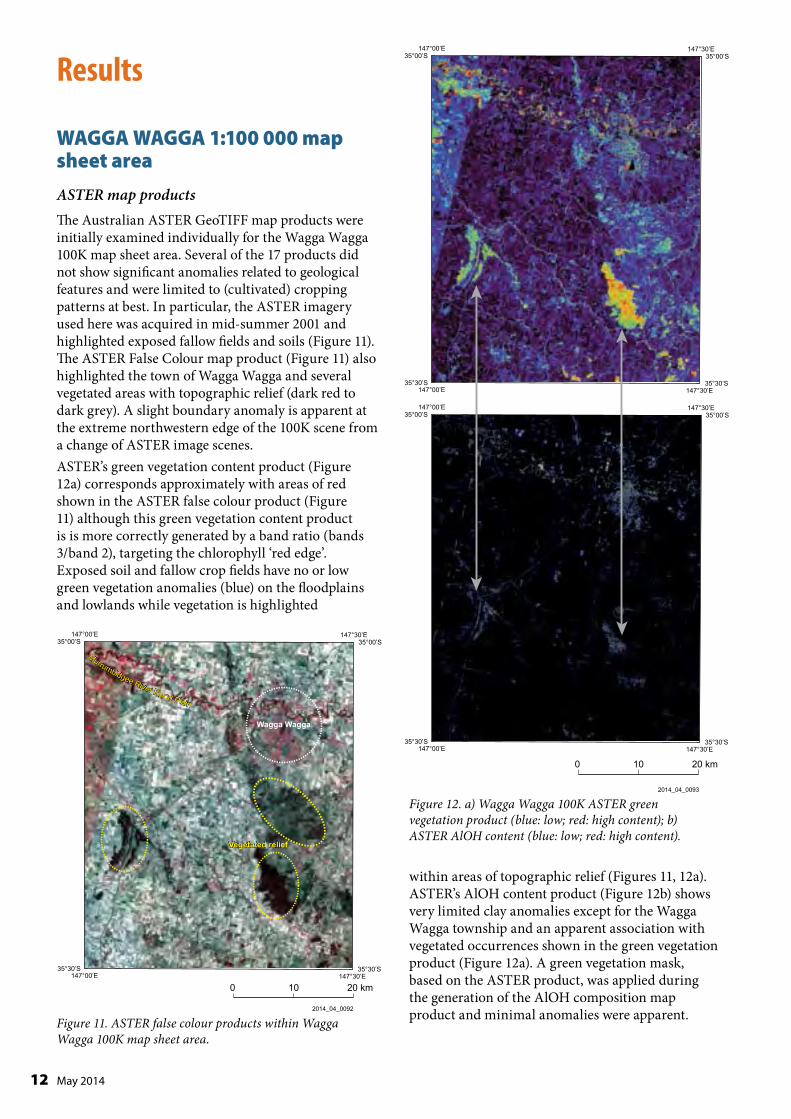
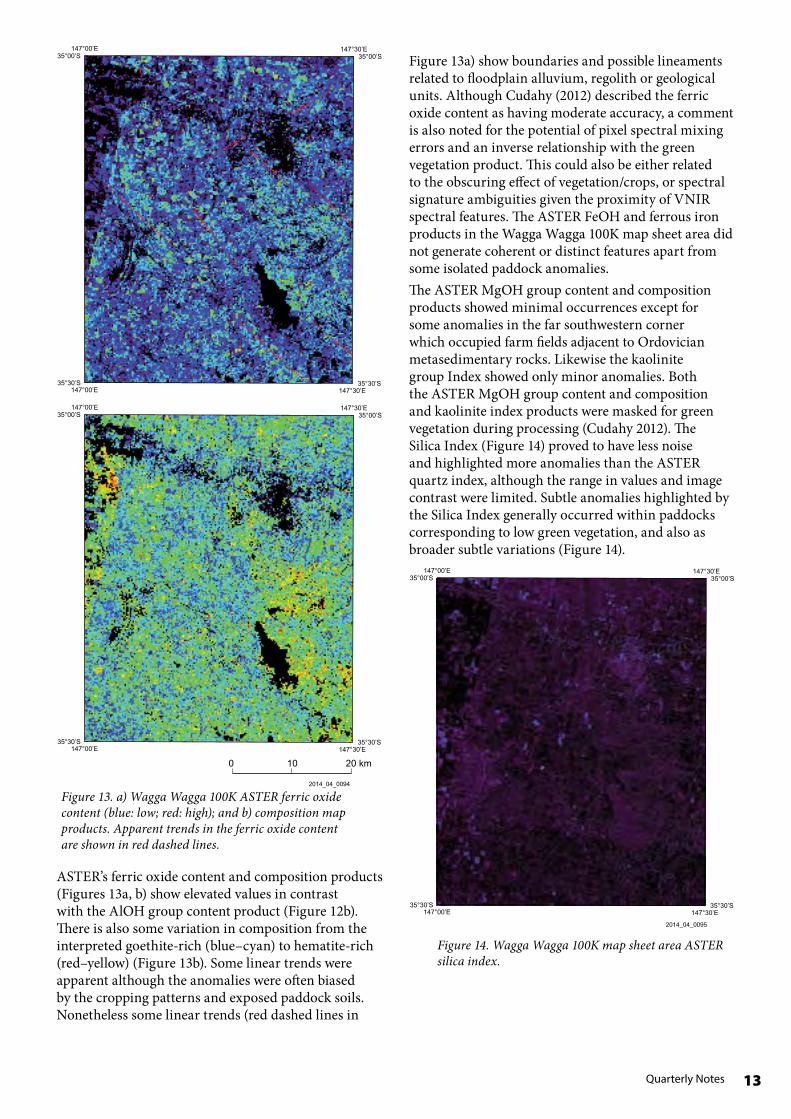
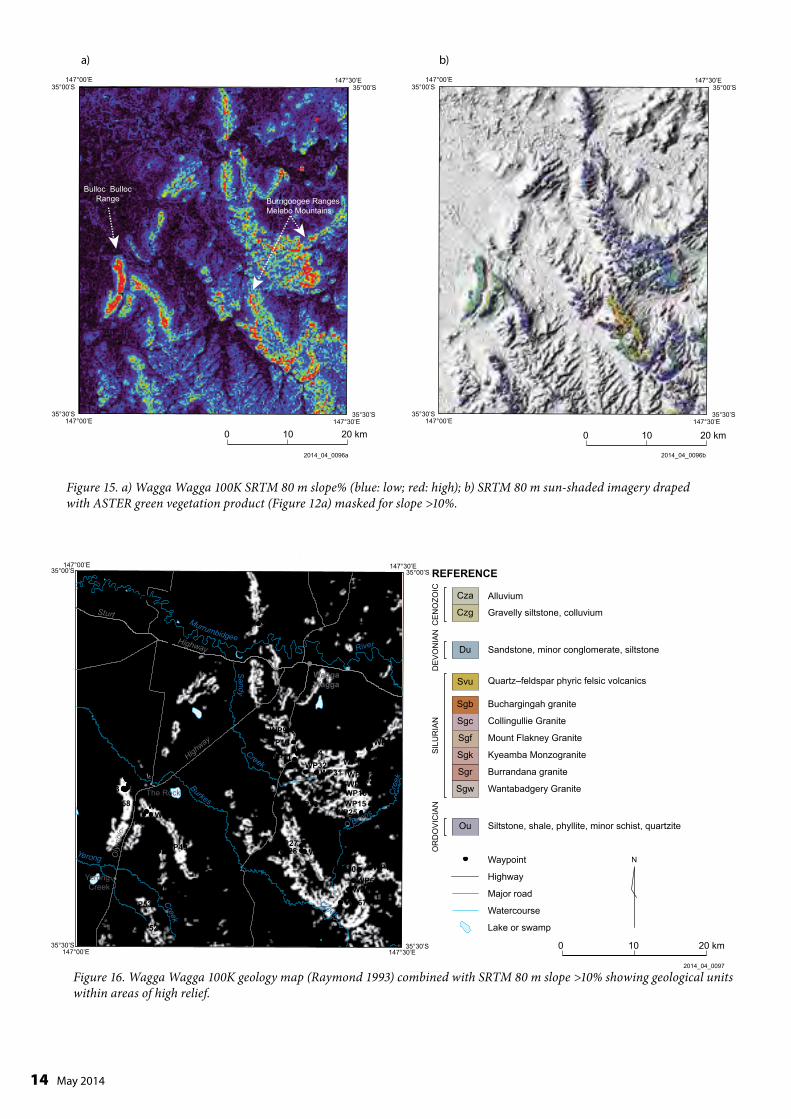
Burkes
Creek
Sandy Creek
Murrumbidgee River
OrsquoBriens
Cre
ek
Yerong
Creek
Oly
mpi
c
Highway
Highway
Sturt
a) b)
147deg00rsquoE 147deg30rsquoE 147deg00rsquoE 147deg30rsquoE 35deg00rsquoS 35deg00rsquoS 35deg00rsquoS 35deg00rsquoS
Bulloc Bulloc Range Burngoogee Ranges
Melebo Mountains
35deg30rsquoS 35deg30rsquoS 35deg30rsquoS 35deg30rsquoS 147deg00rsquoE 147deg30rsquoE 147deg00rsquoE 147deg30rsquoE
0 10 20 km 0 10 20 km
2014_04_0096a 2014_04_0096b
Figure 15 a) Wagga Wagga 100K SRTM 80 m slope (blue low red high) b) SRTM 80 m sun-shaded imagery draped with ASTER green vegetation product (Figure 12a) masked for slope gt10
147deg00rsquoE 147deg30rsquoE35deg00rsquoS 35deg00rsquoS REFERENCE
OR
DO
VIC
IAN
S
ILU
RIA
ND
EV
ON
IAN
CE
NO
ZOICWP75 Cza Alluvium
Czg Gravelly siltstone colluvium
Du Sandstone minor conglomerate siltstone
WP76
WP74 WP73 WP72
WP77
Wagga Svu Quartzndashfeldspar phyric felsic volcanicsWagga
WP60 Sgb Buchargingah granite
WP21 Sgc Collingullie Granite
Sgf Mount Flakney Granite
Sgk Kyeamba Monzogranite
Sgr Burrandana granite
Sgw Wantabadgery Granite
Ou Siltstone shale phyllite minor schist quartzite
WP9
WP10 WP20 WP23 WP34 WP22WP11 WP19WP32
WP31 WP24WP62 WP36 WP17WP43 The Rock WP16
WP12WP58 WP13 WP15WP64 WP25WP66
WP63 WP14
WP26WP27WP49 WP28WP50 WP29 WaypointWP47
WP71WP57 Highway WP70
WP56 WP69Yerong Creek WP51 WP54 WP68 Major roadWP55
WP67WP53 Watercourse
WP52 Lake or swamp
35deg30rsquoS 35deg30rsquoS 0 10 20 km 147deg00rsquoE 147deg30rsquoE
2014_04_0097
Figure 16 Wagga Wagga 100K geology map (Raymond 1993) combined with SRTM 80 m slope gt10 showing geological units within areas of high relief
14 May 2014
15 Quarterly Notes
The nature of the geomorphology and extensive agricultural cultivation of the Wagga Wagga 100K sheet area prompted the use of DEM data to discriminate the likely geologically exposed areas Processing the SRTM 80 m DEM for slope information highlighted the major ranges and topographic relief (Figure 15a) Sun-shaded DEM imagery also highlighted these landforms (Figure 15b) Generation of a mask based on slopes greater than 10 was useful to observe relationships with the various ASTER products For example when ASTERrsquos green vegetation product masked within areas of slope gt10 is combined with sun-shaded imagery much of the higher relief is observed to be moderately to highly vegetated (Figure 15b) Figure 16 shows simplified geological units combined with SRTM data An attempt to overcome the limited range of anomalies observed within the Wagga Wagga 100K ASTER silica index product (Figure 14) using a histogram equalisation stretch within the same data range highlighted both more noise and some coherent anomalies (Figure 17a) Masking of this product with SRTM Slope product greater than 10 (Figure 17b) helped to discriminate exposed geological units as shown in Figure 16 Elevated areas of the quartz-rich sandstone of Bulloc Bulloc Range and metasedimentary rock of Livingstone National Park were highlighted by this approach (Figure 17b)
Geophysical products A similar approach to displaying and enhancing the Wagga Wagga 100K ASTER map products was applied to the airborne radiometric data where anomalous regions were extracted within the areas of elevated slope Histogram equalisation stretching of the K Th and U radioelements highlighted a mixture of alluvial deposition and outcropping geology (Figure 18a) The potassium data coherently mapped the alluvium and floodplains of Burkes Creek and the Murrumbidgee River (Figure 18a) The Mount Flakney Granite and the Bulloc Bulloc Range Ordovician (Ou) and Devonian sandstones (Du) were highlighted as anomalous using the entire 100K map sheet dataset (with histogram equalisation) but more subtle variations in radioelement composition were apparent when slope masking was applied and a simple 2 linear histogram was applied for image stretching (Figure 18b) Compositional variations within these units appeared to be enhanced by limiting the focus to areas of higher relief Increased thicknesses of aeolian deposits alluvium or colluvium on lowlands and areas of reduced slope may mask and dilute radiometric sensing of some of these units
2014_04_0098a
147deg00rsquoE 35deg00rsquoS
147deg00rsquoE 35deg30rsquoS
147deg30rsquoE 35deg30rsquoS
147deg30rsquoE 35deg00rsquoS
147deg00rsquoE 35deg00rsquoS
147deg00rsquoE 35deg30rsquoS
147deg30rsquoE 35deg30rsquoS
147deg30rsquoE 35deg00rsquoS
2014_04_0098b
0 10 20 km
Figure 17 a) Wagga Wagga 100K ASTER Silica Index product generated with a histogram equalisation stretch b) Histogram equalised ASTER silica index masked for slope gt10 (purple blue low to red high content) Areas highlighted are Bulloc Bulloc Range (white) and Livingstone National Park (yellow)
a)
b)
2014_04_0099
16 May 2014
a)
Bullo
c Bu
lloc
Rang
e D
uO
u
Mt F
lakn
ey G
rani
te
Mur
rum
bidg
ee R
iver
Burkes Creek
K U
Te
rnar
y K
Th U
Th
b)
Slop
e m
aske
d Te
rnar
ySl
ope
mas
ked
K Sl
ope
mas
ked
ThSl
ope
mas
ked
U
Figu
re 1
8 a
) Wag
ga W
agga
100
K a
irbor
ne ra
diom
etri
c dat
a K
Th U
and
as a
Ter
nary
imag
e (RG
B K
Th U
) di
spla
yed
with
a h
istog
ram
equa
lisat
ion
stre
tch
b)
K Th
U T
erna
ry im
age m
aske
d fo
r slo
pes gt
10
disp
laye
d w
ith a
2
line
ar h
istog
ram
stre
tch
Geo
logi
cal f
eatu
res d
iscus
sed
in te
xt a
re ci
rcle
d
17 Quarterly Notes
0 10 20 km
c) d)
a) b)
Bulloc Bulloc Range DuOu
Mt Flakney Granite (Sgf)
Figure 19 Apparent trends in the ASTER ferric oxide content (from Figure 13a) are shown as red dashed lines a) TMI 1VD (greyscale) overlain with ASTER ferric oxide content b) TMI 1VD (greyscale) overlain with K Th U Ternary RGB imagery (Red K Green Th Blue U) c) RTP TMI (greyscale) over tilt-filtered RTP TMI (pseudocolour) d) Sun-shaded SRTM DEM (greyscale) overlain with tilt-filtered TMI (pseudocolour)
Bulloc Bulloc Range DuOu
Mt Flakney Granite (Sgf)
Bulloc Bulloc Range DuOu
Mt Flakney Granite (Sgf)
2014_04_0100
Filtered aeromagnetic data for the Wagga Wagga 100K map sheet area were used in an effort to extract structural information and also to highlight near-surface trends of iron-bearing unitsmagnetite and possible correlations with the ASTER map products ASTERrsquos ferric oxide content showed some trends albeit revealed within exposed paddocks (Figure 13a) that showed northwest-trending and some possible northeast-trending features that correlated approximately with First Vertical Derivative (1VD) TMI lineaments (Figure 19a) The VNIR spectral signature of magnetite is essentially aspectral and not likely to be revealed by the ASTER Ferric Oxide Content product directly However weathering of magnetite-bearing rocks may possibly be associated with increased ferric iron oxide minerals within soils exposed here Integrating radiometric ternary imagery over TMI 1VD (Figure 19b) reveals similar northwest trends as Figure 19a In addition Figure 19b reveals a
complex series of north-northwest-trending lineaments along the western boundary of the K-rich Mount Flakney Granite and northwest-trending lineaments east of the sheared Bulloc Bulloc Range Devonian and Ordovician units RTP TMI over tilt-filtered Reduced to the Pole (RTP) TMI (Figure 19c) highlighted several lineaments with some corresponding to those interpreted with ASTER ferric oxide and radiometric data (Figure 19a b) The integration of tilt-filtered TMI over sun-shaded SRTM DEM (Figure 19d) also revealed some correlation of northndashnorth-northwest and cross-cutting north-northeast lineaments with topographic relief and valleys (Figure 5a) related to either outcropping geological units or possible structural and tectonic movements The tilt-filtered TMI within this Wagga 100K area appears to reveal increased high-frequency features and anomalies useful for detailed interpretation
REFERENCE
Highway
Major road
Watercourse
Lake or swamp
Cza
Czg
Du
Svu
Sgb
Sgr
Ou
Alluvium
Gravelly siltstone colluvium
Buchargingah granite
Burrandana granite
Sandstone minor conglomerate siltstone
Quartzndashfeldspar phyric felsic volcanics
Siltstone shale phyllite minor schist quartzite
CE
NO
ZOIC
DE
VO
NIA
NS
ILU
RIA
NO
RD
OV
ICIA
N
2014_04_0101
Yerong
Burkes
Creek
Cree
k
Creek
Stony
Watt
le
Creek
Hig
hway
Oly
mpi
c
The Rock
YerongCreek
A
B
147deg00rsquoE
147deg00rsquoE 147deg14rsquoE
147deg14rsquoE
35deg12rsquoS 35deg12rsquoS
35deg24rsquoS 35deg24rsquoS
0 5 10 km
Yerong
Burkes
Creek
Cree
k
Creek
Stony
Watt
le
Creek
Hig
hway
Oly
mpi
c The Rock
Yerong Creek
A
B
147deg00rsquoE
147deg00rsquoE 147deg14rsquoE
147deg14rsquoE
35deg12rsquoS 35deg12rsquoS
35deg24rsquoS 35deg24rsquoS
0 5 10 km
REFERENCE
Cza
Czg
Alluvium
Gravelly siltstone colluvium
Du Sandstone minor conglomerate siltstone
Svu Quartzndashfeldspar phyric felsic volcanics
Buchargingah granite
Burrandana granite
Ou Siltstone shale phyllite minor schist quartzite
Highway
Major road
Watercourse
Lake or swamp
Sgb
Sgr
2014_04_0101
Figure 20 Location of The Rock Hill (A) and Flowerpot Hill (B) on part of the Wagga Wagga 100K geological map (Raymond 1993)
a) b) O
RD
OV
ICIA
N
SIL
UR
IAN
DE
VO
NIA
NC
EN
OZO
IC
c) d)
NA
NA
NA
NA
NA NAWG16
WG17 WG18
WG23
WG26
WG19
Mag Low-Demagnetisation (removal of iron via metasomatic fluid alteration)
Axis Axis
Mag Low Radiometrics ternary RGB K Th U
Radiometrics Potassium (Histogram equalised)
O 10km
2014_04_0102
Figure 21 The Rock Hill and Flowerpot Hill area of Figure 20 (approx) a) ASTER false colour b) RTP TMI over Tilt-filtered TMI c) Radiometrics Ternary (RGB K Th U) d) Radiometrics K (blue low red high) Major lineaments magnetic low and fold structure are shown NA = site not sampled in study
18 May 2014
b)REFERENCE
Waypoint site
Highway
Major road
Watercourse
Lake or swamp
Cza
Czg
Du
Svu
Sgb
Sgr
Ou
Alluvium
Gravelly siltstone colluvium
Buchargingah granite
Burrandana granite
Sandstone minor conglomerate siltstone
Quartzndashfeldspar phyric felsic volcanics
Siltstone shale phyllite minor schist quartzite
CE
NO
ZOIC
DE
VO
NIA
NS
ILU
RIA
NO
RD
OV
ICIA
N
2014_04_0103a
Yerong
Burke
s
Creek
Cree
k
Creek
Stony
Watt
le
Creek
Hig
hway
Oly
mpi
c
The Rock
YerongCreek
WP66WP63
WP37
WP56
WP57
WP50
WP35WP62
WP38
WP49
WP36
WP47
35deg23rsquoS147deg00rsquoE
147deg00rsquoE 147deg14rsquoE
35deg23rsquoS147deg14rsquoE
35deg14rsquoS35deg14rsquoS
0 5 10 km
Quarterly Notes
a) REFERENCE
Cza
Czg
Alluvium
Gravelly siltstone colluvium
CE
NO
ZOIC
Sandstone minor conglomerate siltstone
Mag Low ASTER AIOH content 35deg14rsquoS 35deg14rsquoS
35deg23rsquoS 35deg23rsquoS 147deg00rsquoE
147deg00rsquoE 147deg14rsquoE
147deg14rsquoE
2014_04_0103b
Yerong
Burke
s
Creek
Cree
k
Creek
Stony
Watt
le
Creek
Hig
hway
Oly
mpi
c
The Rock
Yerong Creek
WP66 WP63
WP37
WP56
WP57
WP50
WP35 WP62
WP38
WP49
WP36
WP47
35deg23rsquoS 147deg00rsquoE
147deg00rsquoE 147deg14rsquoE
35deg23rsquoS 147deg14rsquoE
35deg14rsquoS35deg14rsquoS
0 5 10 km
b)
c)
Du
Svu
Sgb
Sgr
Ou Siltstone shale phyllite minor schist quartzite
Waypoint site
Highway
Major road
Watercourse
Lake or swamp 2014_04_0103a
The Rock Hill and Flowerpot Hill Devonian and Ordovician metasedimentary units in the central western part of the Wagga Wagga 100K map sheet area (Figure 20) provided a useful target and potentially prospective area to closely examine ASTER and geophysical mapping issues and opportunities for data integration The ASTER false colour product highlights the elevated Bulloc Bulloc Range including The Rock and Flowerpot Hill surrounded by farm paddocks and cultivation (Figure 21a) The geophysics highlights some interesting lineaments a fold structure and a magnetic low (Figures 21bndashd) In particular the tilt-filtered TMI data shows a prominent pair of north-northwestndashsouth-southeast lineaments (Figure 21b) approximately parallel to the apparent hinge linefold axis of the DevonianOrdovician metasedimentary rocks (Figure 21c d) and also bounding a likely deep-seated magnetic low (Figure 21b) Ternary and K radiometric anomalies appear to cross-cut the
OR
DO
VIC
IAN
S
ILU
RIA
ND
EV
ON
IAN
Quartzndashfeldspar phyric felsic volcanics
Buchargingah granite
Burrandana granite
ASTER silica index 35deg14rsquoS
35deg23rsquoS 35deg23rsquoS 147deg00rsquoE
147deg00rsquoE 147deg14rsquoE
147deg14rsquoE
35deg14rsquoS
0 5 10 km
2014_04_0103c
Devonian and Ordovician stratigraphy when they are overlain on the geology map (Figure 22a) A modified version of the ASTER AlOH content map masked for both SRTM-derived slopes greater than 10 and less than 45 Landsat-derived photosynthetic (PV or lsquogreenrsquo) vegetation fraction cover appears to highlight some increase in mica content in the main hinge line axis (red areas Figure 22b) Figure 22b was also displayed using histogram equalisation using thresholds described by Cudahy (2012) The silica index product with a histogram equalisation stretch also appears to highlight some increase in silica along the axis (Figure 22c) Field observations of increased quartz and ASD spectral measurements identifying AlOH minerals phengite and kaolinite (Figure 23) appear to confirm this interpretation Hematite is also common within The Rock Hill and Flowerpot Hill area
Figure 22 The Rock Hill and Flowerpot Hill a) Wagga Wagga 100K geological map with geophysical features from Figure 21 b) ASTER AlOH masked for gt10 slope and lt45 PV Landsat fraction histogram equalised Mica anomaly is circled c) ASTER silica index histogram equalised Silica anomaly is circled Purpleblue low to red high content
19
Ref
lect
ance
050
040
030
020
010
000
wg26r_bw00000
wg23r_bw00001
Hematite signature (860 nm) Al poor mica or Phengite (eg 2209 nm absorption)
400 900 1400 1900 2400
Wavelength (nm) 2014_04_0104
Figure 23 Example ASD spectral signature of rock outcrop samples (WG23 26 ndash see Figure 21a) at Flowerpot Hill showing Al-poor micaAlOH and hematite diagnostic features
ASTER data issues and qualifications on interpretation Acquisition of ASTER satellite imagery at about 1030 am (Australian Eastern Daylight Time) can potentially produce sharp shadows on steep westerly slopes within high relief areas The ASTER satellite sensor has an additional issue of potential false anomalies from the lsquocrosstalkrsquo mis-calibration of its shortwave IR sensor (bands 5ndash9) as used for the generation of AlOH or micaclay mineral maps Dark shaded areas appear on the western slopes of The Rock and Flowerpot Hill as a result of north- and northwest-trending ridgelines as shown in the sun-shaded DEM imagery generated to simulate illumination conditions on 1112001 at 1030 am (blue ellipses Figure 24a) These areas of deep shadow appear to be coincident with some of the AlOH anomalies (red ellipse Figure 22b) and potentially the result of false anomalies associated with crosstalk
0 4km a)
WP 62 WP 35
WP 36 WP 37
WP 33
WP 38
WP 65
WP 66
WP 58
WP 45
SRTM DEM sun shaded (el 60˚ Az 72˚)
b)
(Figure 24b) However areas of full illumination on the northeast slopes also show AlOH anomalies and the crosstalk explanation does not entirely negate the AlOH presence Overall these results suggest that residual crosstalk effects are a possibility within dark areas of shadow and vegetation cover and bitumen (eg the Wagga AirfieldRAAF base) The validation of ASTER study sites can be assisted with the aid of DEMs fractional cover information field observations and ideally a VNIRndashSWIR spectrometer
ASTER AIOH mica content (hist eq) masked for 45 lt green vegetationgt 10 slope
Figure 24 a) Sun-shaded SRTM 80 m DEM of The Rock Hill and Flowerpot Hill (60deg elevation 072deg azimuth) simulating illumination conditions and shaded relief during ASTER image acquisition (1112001) b) ASTER AlOH content and corresponding areas of shaded relief (dashed ellipses)
Figure 25 The Rock Reserve WP62 a) Casuarina open woodland b) ferruginous gravel with lichen and moss ground cover c) typical canopy cover
20 May 2014
Quarterly Notes
a) b) c)
WP62
WP35
WP36 WP37
WP38WP40 WP39
WP58
WP65 WP63
WP66
WP62
WP35
WP36 WP37
WP38WP40 WP39
WP58
WP65 WP63
WP66
WP62
WP35
WP36 WP37
WP38WP40 WP39
WP58
WP65 WP63
WP66
0 20 40 60 80 100 0 20 40 60 80 100 0 20 40 60 80
non-photosynthetic Bare ground photosynthetic
4km 2014_04_01060
Figure 26 a) ndash c) Landsat fractional cover estimates for The Rock Hill mdash the same area as in Figure 24
Field observations and ASD in-situ field measurements of gravel lag vegetation ground litter etc at Waypoint WP62 (Figure 22a 24a) were undertaken near The Rock (Figure 25andashc) AusCover fractional cover estimates using Landsat acquired 1012001 one day before the ASTER gave values of 18 bare ground 41 photosynthetic and 40 non-photosynthetic vegetation cover for supplied 30m pixels encompassing WP62 Fractional cover imagery for the Bulloc Bulloc RangeThe Rock shows that the cover is dominated by photosynthetic and to a lesser extent non-photosynthetic vegetation (Figures 26andashc) ASD in-situ field measurements of gravel lag vegetation and ground litter at WP62 were processed to simulate ASTER ferric oxide content and green vegetation indices (Figure 27) This limited series of measurements suggested that the presence of dry vegetation matter (eg lichen bark leaf litter) can hinder the ASTER interpretation of ferric iron (eg hematite goethite) useful for regolith profile information andor alteration involving hematisation (Figure 27) Simulated values for ASTERrsquos AlOH content index from W62 gravel
The Rock Hill - Waypoint 62
Green tree and shrub foliage ground moss Devonian ferruginous sandstone gravel lag Lichen bark and leaf litter
1 3
0
4
2
AST
ER -
Gre
en V
eget
atio
n
ASTER - Ferric Oxide Content
Figure 27 ASD field spectral signatures of vegetation and gravel samples from The Rock Hill (WP 62) resampled and processed into equivalent ASTER map indices for green vegetation and ferric oxide content
lag ASD measurements produced values between 19 and 215 within the threshold range used to generate ASTER AlOH content imagery (Cudahy 2012) This compares favourably with the ASTER AlOH content index value of 20 as an average for 2 x 30 m pixels at WP62 extracted from the map product
Cobar 1100 000 and Canbelego 1100 000 map sheet areas The ASTER map products over the Cobar 1250 000 map sheet area are less affected by agricultural cultivation than the Wagga Wagga area as highlighted by ASTERrsquos false colour showing only approximately 25 under cultivationcropping to the east (Figure 28a) Isolated cloud cover is also apparent in the eastern third of the Cobar 1250 000 map sheet area where the map product is generated from a separate ASTER scene (Figure 28a) ASTERrsquos regolith product is useful for highlighting the extensive ephemeral drainage patterns (Figure 28b) As described by Cudahy (2012) the Regolith product based on the Landsat TM Regolith ratios helps to separate regolith and geological units while vegetated areas are highlighted by whitebright areas and clouds in blue (Figure 28b) ASTERrsquos green vegetation product also shows the limited nature of the green vegetation cover restricted to watercourses outside of the cultivated areas (Figure 28c) The land cover is more explicitly highlighted in the Landsat-derived fractional cover image which shows that close to the time of ASTER acquisition (September 2003) the most exposed bare ground was within the Cobar 100K map sheet area and to a lesser extent Canbelego 100K (reddish areas Figure 28d) Non photosynthetic vegetation (lsquodry vegetationrsquo) still appears pervasive in the non-cultivated areas (blue areas Figure 28d) which may be an issue for some ASTER map products
21
100
c) d)
a) b)
145ordm30E 147ordm00E 145ordm30E 147ordm00E 31ordm00S 31ordm00S
32ordm00S 32ordm00S
145ordm30E 147ordm00E 145ordm30E 147ordm00E
31ordm00S 31ordm00S
32ordm00S 32ordm00S
Figure 28 Cobar 1250K map sheet area a) ASTER false colour Note clouds and shadows in lower right b) ASTER regolith colour coded as for standard CSIRO Landsat Regolith product (Cudahy 2012) c) ASTER green vegetation (blue low red high) d) Landsat fractional cover RGB Red bare ground Green photosynthetic vegetation Blue non-photosynthetic vegetation (linear stretch 0ndash100)
a) b) 145ordm30E 147ordm00E 145ordm30E 147ordm00E
31ordm00S 31ordm00S
32ordm00S32ordm00S
Figure 29 Cobar 1250K map sheet area a) ASTER ferric oxide content (blue low red high) b) ASTER ferric oxide composition (histogram equalised) (blue goethitic red hematitic) c) ASTER AlOH group content (histogram equalised) (blue low red high) Note that cloud cover in eastern 100K maps introduces false anomalies (see Figure 28a)
32ordm00S
31ordm00S
c) 145ordm30E 147ordm00E
31ordm00S
32ordm00S
2014_04_0109
22 May 2014
23 Quarterly Notes
a) b) 145ordm30E 147ordm00E 145ordm30E 147ordm00E
31ordm00S 31ordm00S
32ordm00S 32ordm00S
147ordm00E
31ordm00S 145ordm30E 147ordm00E 145ordm30E
31ordm00S
32ordm00S32ordm00S
Figure 30 a) ASTER AlOH group composition (histogram equalised) (blue Al-rich micawell ordered kaolinite red Al-poor mica) b) ASTER silica index (histogram equalised) (blue low red high) c) Radiometric K (blue low red high) d) Radiometric Th (blue low red high)
c) d)
2014_04_0110
The ASTER Ferric Oxide Content product highlights coherent and continuous spatial distribution across the Cobar 1250 000 sheet area with increased abundance within the Cobar 100K area (Figure 29a) An improved insight into the ferric iron oxide was provided by the ASTERrsquos ferric oxide composition using histogram equalisation (Figure 29b) rather than a Gaussian stretch within the same threshold stretch limits advised by Cudahy (2012) Using the histogram equalised version of the ASTER ferric oxide composition product highlights more clearly an apparent increase in hematitic composition within the western Cobar 250K including the Cobar 100K map sheet area (Figure 29b) The presence of hematite versus goethite may be important for regolith interpretation and understanding of the arearsquos possible lateritic weathering (Huntington et al 1999) However care should also be taken when interpreting ferric oxide content and composition in the presence of dry vegetation matter mdash as observed at The Rock Hill (Figure 27) and also noted by Cudahy (2012) The areas highlighted by ASTER with increased hematite also coincide with increased abundance of AlOH minerals as shown by the histogram equalised version of the ASTER AlOH group content (greenndashyellow areas Figure 29c) The ASTER AlOH group composition product (histogram equalised Figure 30a) highlights extensive
areas of low values (blue) in the western Cobar 250K sheet area including within the Cobar 100K Cudahy (2012) interpreted such low ASTER AlOH composition product values as mapping well-ordered kaolinite or Al-rich white mica These areas also appear to coincide with the interpreted hematite-rich areas shown in Figure 29b (red areas) If a lateritic profile mineral model (Huntington et al 1999) is assumed then questions arise whether these areas lie within the highly weathered hematite-bearing duricrust or less-weathered ordered kaolinite-bearing saprolite The ASTER kaolin group index product for Cobar 250K sheet area does not indicate significant anomalies using linear or histogram equalised versions Cobar regolith landform mapping indicates much of the Cobar 100K area is highly weathered in situ bedrock (Gibson 1999) However validation field work involving sampling and ASD measurements should clarify these issues The ASTER silica index product does appear to indicate high silica content along the western boundary of the Cobar 100K sheet area that coincides with elevated areas mapped by Gibson (1999) containing cappings of silicified sedimentary units (histogram equalised Figure 30b) Geophysical radiometric products K and Th also highlight distinctive units with the Cobar 100K and Canbelego 100K map sheet areas (Figures 30c d) The K and Th images mostly appear to map in an approximate complementary way areas of alluvial
a)
147ordm00E 31ordm00S
145ordm30E
32ordm00S
b) 145ordm30E 147ordm00E
31ordm00S
32ordm00S
Figure 31 a) RGB composite ASTERrsquos AlOH content (histogram equalised) ferric oxide content silica index (histogram equalised) b) RGB composite K ASTERrsquos ferric oxide content AlOH content over shaded DEM
(eg K) and in situ regolith units (eg Th) (Figures 30c d) In particular the drainage areas appear rich in apparently K-bearing clays (Figure 30c) whilst the Th occurs where there are non-drainage in situ relict areas (Figure 30c) possibly related to ferricrete Further ground truthing would help this interpretation An RGB composite image of ASTERrsquos AlOH group content ferric oxide content and silica index products appeared to discriminate generally elevated combined clay- and quartz-rich units (eg red+blue areas shown as purple) from ferric iron oxide minerals (green) within some drainage areas (Figure 31a) A RGB composite image of the radioelement K ASTER ferric oxide content and ASTER AlOH group content products also generated significant and complex spatially coherent patterns particularly within the Cobar and Canbelego 100K sheet areas that appear worthy of further examination for regolith information (Figure 31b)
2014_04_0111
Conclusions This project demonstrated within the NSW study areas of Wagga Wagga and Cobar the usefulness of the recently released Australia ASTER map products supplied by CSIROGA for identifying or discriminating variations in surface composition The map products included mineral identitiesgroups within geological units possible overprinted alteration andor weathered regolith These map products can potentially aid mineral exploration in NSW within semi-arid areas such as Cobar and to a lesser extent within open woodland and cultivated environments such as Wagga Wagga Although several ASTER map products provided useful information as individual entities their application generally benefits exploration when integrated with geophysical topographical and fractional land cover information In particular DEM-derived slope information and vegetation fractional data were used to mask and refine ASTER map products in the Wagga area within the temperate and vegetated Riverine Plains Anomalous AlOH- and silica-rich areas were discriminated and associated with radiometric and high frequency filtered TMI-inferred structures in the vicinity of the Bulloc Bulloc Range especially at The Rock Hill ASTER Ferric Iron Content product within the Wagga Wagga area also appeared to show northwest lineament trends similar to those highlighted by filtered TMI products Map generation for the Murrumbidgee floodplains using radiometric data also appeared to benefit from topographic slope masking to exclude areas of alluvial and aeolian transported cover More spatially coherent anomalous areas particularly related to the regolith were identified by the ASTER map products in the semi-arid and rangeland terrain of Cobar The application of different histogram stretches such as histogram equalisation was found to further enhance the display of anomalous features mdash although care should be applied regarding data thresholds The application of the ASTER map products individually as RGB composites or integrated with radiometric data appears useful for regolith mapping and identifying weathering profile-related mineralogy at Cobar Effects of residual ASTER crosstalk mis-calibration within areas of shadowdark surfacesdense vegetation and possible interpretation ambiguities between VNIR-derived ferric oxide and dry vegetation highlight the importance of validation fieldwork to check anomalous areas and their spectral signatures The validation of ASTER study sites may be assisted by DEM and fractional cover information Further investigations into the benefits of integrating artificially illuminated shaded topographic relief and AusCover fractional land cover information relevant for ASTER acquisition dates are recommended
24 May 2014
25 Quarterly Notes
Acknowledgements This study has been supported and funded by the Geological Survey of New South Wales in part for the purpose of contributing to the knowledge of the Wagga Wagga 1100 000 map sheet geology for mineral exploration Geophysical and associated data for the Wagga Wagga and Cobar study areas were received from the Geological Survey of New South Wales ASTER GeoTIFFs and BSQ ASTER map products were also gratefully obtained from Geoscience Australia and CSIROndashEarth Science amp Resource Engineering whilst the original ASTER imagery was made available by NASA and METI GIS shapefiles for the Wagga Wagga and Cobar 1250 000 map sheet areas were also gratefully obtained from Geoscience Australia Assistance is also gratefully acknowledged from Thomas Cuday and Carsten Laukamp of CSIRO and Matilda Thomas of Geoscience Australia Support from Professor Simon Jones and Laurie Buxton of RMIT University was also helpful during this study
References Caccetta M Collings S amp Cudahy C 2013 A calibration methodology for continental scale mapping using ASTER imagery Remote Sensing of Environment 139 306ndash317
Chan RA Greene RSB de Souza Kovacs N Maly BER McQueen KG amp Scott KM 2003 Regolith geomorphology geochemistry and mineralisation of the SussexndashCoolabah area in the CobarndashGirilambone region North-Western Lachlan Foldbelt NSW CRC LEME openfile report 148 NSW DMR Report GS2001319
Chen XY 1997 Quaternary sedimentation parna landforms and soil landscapes of the Wagga Wagga 1100 000 map sheet south-eastern Australia Australian Journal of Soil Research 35(3) 643ndash668
Chen XY amp McKane DJ 1997 Soil Landscapes of the Wagga Wagga 100K Sheet map and report Department of Land and Water Conservation Sydney
Clark RN King TVV Klejwa M Swayze GA amp Vergo N 1990 High spectral resolution reflectance spectroscopy of minerals Journal of Geophysical Research 95(B8) 12653ndash12680
Cudahy TJ 1997 PIMA-II spectral characteristics of natural kaolins CSIRO Exploration and Mining Report 420R 57 pp
Cudahy TJ 2012 Satellite ASTER Geoscience Product Notes for Australia Version 1 7th August 2012 CSIRO ePublish No EP-30-07-12-44
Downes PM McEvilly R amp Raphael NM 2004 Mineral deposits and models Cootamundra 1250 000 map sheet area Quarterly Notes of the Geological Survey of New South Wales 116 1ndash38
Downes PM amp Seccombe PK 2008 Sulfur isotope signatures for orogenic gold deposits Lachlan Orogen New South Wales In Proceedings of PACRIM Congress 24ndash26 November 2008 AusIMM Gold Coast Queensland Australia
Duke EF 1994 Near infrared spectra of muscovite Tschermak substitution and metamorphic reaction process implications for remote sensing Geology 22 621ndash624
Gibson DL 1999 Explanatory notes for the 1500 000 Cobar regolith landform map CRC LEME Geological Survey of NSW Open File Report 76
Grove CI Hook SJ amp Paylor ED III 1992 Laboratory reflectance spectra of 160 minerals 04 to 25 micrometers NASA Jet Propulsion Laboratory report JPL Publication 92-2
Hewson R 2013 Using ASTER and geophysical mapping to assist exploration over Wagga Wagga 1100 000 sheet area Geological Survey of New South Wales File GS20131558
Hewson RD amp Cudahy TJ 2011 Issues Affecting Geological Mapping with ASTER Data A Case Study of the Mt Fitton Area South Australia In Ramachandran B Justice CO amp Abrahams MJ (eds) Land Remote Sensing and Global Environmental Change NASArsquos Earth Observing System and the Science of ASTER and MODIS Applications in ASTER pp 273ndash300 Springer-Verlag New York
Hewson RD Cudahy TJ Drake-Brockman J Meyers J amp Hashemi A 2006 Mapping geology associated with manganese mineralization using spectral sensing techniques at Woodie Woodie East Pilbara Exploration Geophysics 37 389ndash400
Hewson RD Cudahy TJ amp Huntington JF 2001 Geologic and alteration mapping at Mt Fitton South Australia using ASTER satellite-borne data In Geoscience and Remote Sensing Symposium 2001 IGARSS lsquo01 IEEE 2001 International vol2 724ndash726
Hewson RD Cudahy TJ Mizuhiko S Ueda K amp Mauger AJ 2005 Seamless geological map generation using ASTER in the Broken HillndashCurnamona Province of Australia Remote Sensing of Environment 99(1ndash2) 159ndash172
Hewson RD Mah A Dunne M amp Cudahy TJ 2003 Mapping mineralogical and structural relationships with satellite-borne ASTER and airborne geophysics at Broken Hill ASEG 16th Geophysical Conference and Exhibition Adelaide February 2003 Australian Society Exploration Geophysicists
Hewson R Robson D Mauger A Cudahy T Thomas M amp Jones S 2013 Extracting mineralogical and geomorphological information using new ASTER mineral maps with airborne geophysics Proceedings of the ASEGndashPESA 2013 23rd International Geophysical Conference and Exhibition 11ndash14 August 2013 Melbourne Australia
Hunt GR amp Ashley RP 1979 Spectra of altered rocks in the visible and near infrared Economic Geology 74 1613ndash1629
Huntington JF Cudahy TJ Yang K Scott KM Mason P Gray DJ Berman M Bischof L Reston M S Mauger AJ Keeling JL amp Phillips RN 1999 Mineral mapping with field spectroscopy for exploration ndash final report CSIROAMIRA Project P435 CSIRO Exploration and Mining Report 419R
Iwasaki A Fujisada H Akao H Shindou O amp Akagi S 2001 Enhancement of spectral separation performance for ASTERSWIR Proceedings of SPIE (International Society for Optical Engineering) 4486 42ndash50
Iwasaki A amp Tonooka H 2005 Validation of a crosstalk correction algorithm for ASTERSWIR IEEE Transactions on Geoscience and Remote Sensing 43(12) 2747ndash2751
Laukamp C Cudahy C Caccetta M Thomas M Close D amp Lennartz R 2013 Successful mineral exploration using multispectral remote sensing data ndash ASTER Geoscience Map of Australia In Proceedings 12th Biennial Meeting of the Society of Geology Applied to Mineral Deposits (SGA) Uppsala Sweden 12ndash15 August 2013
Lewis P amp Downes PM 2008 Mineral systems and processes in New South Wales a project to enhance understanding and assist exploration Quarterly Notes of the Geological Survey of New South Wales 128
McQueen KG 2008 A guide for mineral exploration through the regolith in the Cobar Region Lachlan Orogen New South Wales Cooperative Research Centre for Landscape Environments and Mineral Exploration
Michael S 2012 Satellite imagery the range and value CSIRO Publishing for Australian Society for Exploration Geophysicists Preview 2012(160) 20ndash25
Raymond O 1993 Wagga WaggandashKyeamba region geological map 1100 000 Australian Geological Survey Organisation Canberra
Ricchetti E 2000 Multispectral satellite image and ancillary data integration for geological classification Photogrammetric Engineering amp Remote Sensing 66(4) 429ndash435
Rowan LC amp Mars JC 2003 Lithologic mapping in the Mountain Pass California area using Advanced Spaceborne Thermal Emission and Reflection Radiometer (ASTER) data Remote Sensing of Environment 84 350ndash366
Salisbury JW amp DrsquoAria DM 1992 Emissivity of terrestrial materials in the 8ndash14 μm atmospheric window Remote Sensing of Environment 42 83ndash106
Scarth P Roumlder A amp Schmidt M 2010 Tracking grazing pressure and climate interaction ndash the role of Landsat fractional cover in time series analysis In Proceedings of the 15th Australasian Remote Sensing and Photogrammetry Conference (ARSPC) 13ndash17 September Alice Springs Australia
Sherman DM 1985 The electronic structures of Fe3+ coordination sites in iron oxides application to spectra bonding and magnetism Physics and Chemistry of Minerals 12 161ndash175
Vincent RK amp Thomson F 1972 Spectral compositional imaging of silicate rocks Journal of Geophysical Research 77(14) 2465ndash2472
Yamaguchi Y Fujisada H Kahle A Tsu H Kato M Watanabe H Sato I amp Kudoh M 2001 ASTER instrument performance operation status and application to earth sciences In Geoscience and Remote Sensing Symposium 2001 IGARSS lsquo01 IEEE 2001 International vol3 1215ndash1216
26 May 2014
ShippingCONTACT Please note that we cannot ship to PO boxes
Product Order Form All prices are in Australian dollars and include Goods and Services Tax at 10 unless otherwise noted Only Australian orders are subject to the GST and all international orders will be processed exclusive of GST All totals will be billed in Australian Dollars International customers will be charged the equivalent of this rate in their respective currencies at the time the bank processes the transaction
Credit card surcharge MasterCard 04 Visa 04 AMEX 15 Diners Club 24 Other payment (NA)
Subtotal (excl GST for internationals)
TOTAL
Be sure to select international postage above if you are an overseas customer
Item Quantity Line Total Price (incl GST)
International $45 (excl GST) Postage Domestic $8 (1-2 items) $10 (3-5 items) $12 (5+ items) Express $13
o f f i c e
U S E
o n l y
FULL NAME JOB TITLE
ORGANISATION STREET ADDRESS
CITY STATE POSTCODE COUNTRY
PHONE EMAIL
CARD NUMBER NAME ON CARD
CARDHOLDER SIGNATURE DATE EXPIRY SECURITY CODE
We accept payment by credit card cheque or money order (made payable to NSW Department of Trade amp Investment) Payment
Return
Did you know Selected products can be purchased from the NSW Government Online Shop wwwshopnswgovau
Information and Customer Service Centre NSW Department of Trade amp Investment PO Box 344 Hunter Region Mail Centre NSW 2310
mineralpublicationordersindustrynswgovau
+61 2 4931 6700 Enquiries +61 2 4931 6666
wwwresourcesnswgovau
NSW Trade amp Investment Division of Resources amp Energy 516 High Street Maitland NSW 2320 PO Box 344 Hunter Region Mail Centre NSW 2310 T1300 736 122 T (02) 49316666
wwwresourcesnswgovau
Second edition Bathurst metallogenic 1250 000 map
Replacing the popular 1972 edition the updated map shows 311 metallic industrial construction material and fuel deposits classified by size commodity and deposit type A deposit classification scheme is included along with a timendashspace plot showing major mineralising events
On the back of the map is a comprehensive poster summarising the mining history and geological history of the area It features many colourful and historic images a locality map and a mining timeline
Cost $1980
- _GoBack
- 141726f49c7572d0__MailEndCompose
-
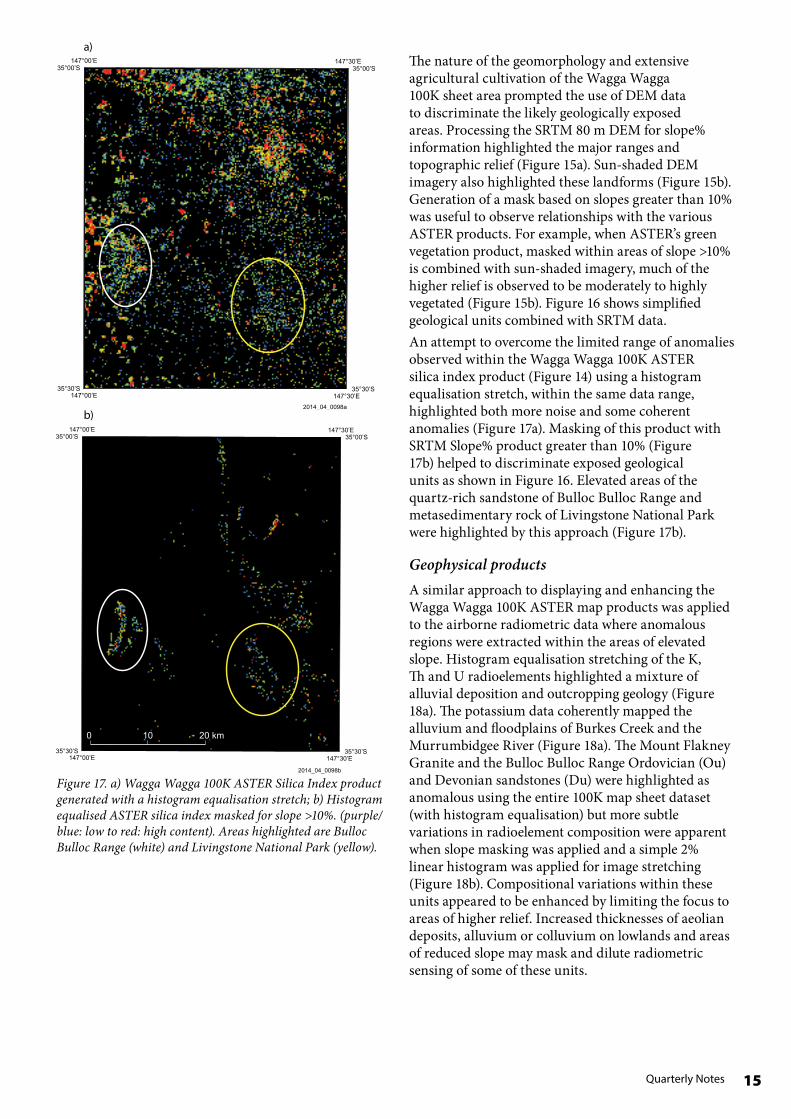
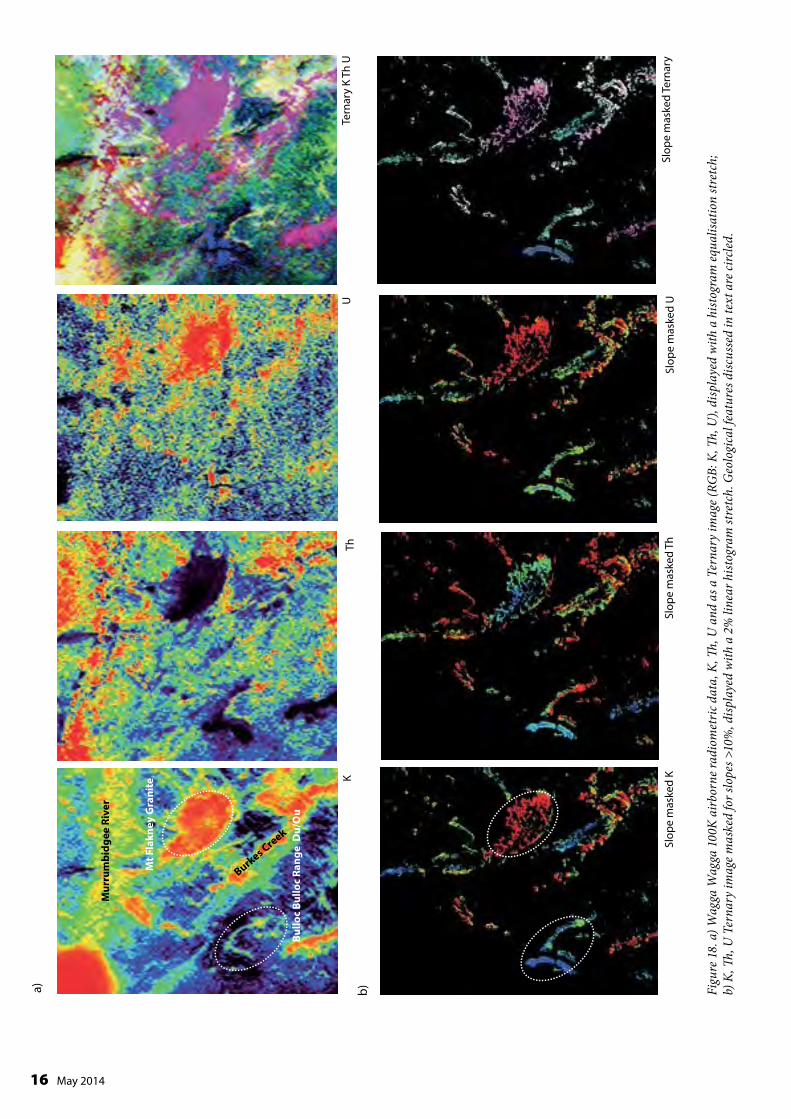
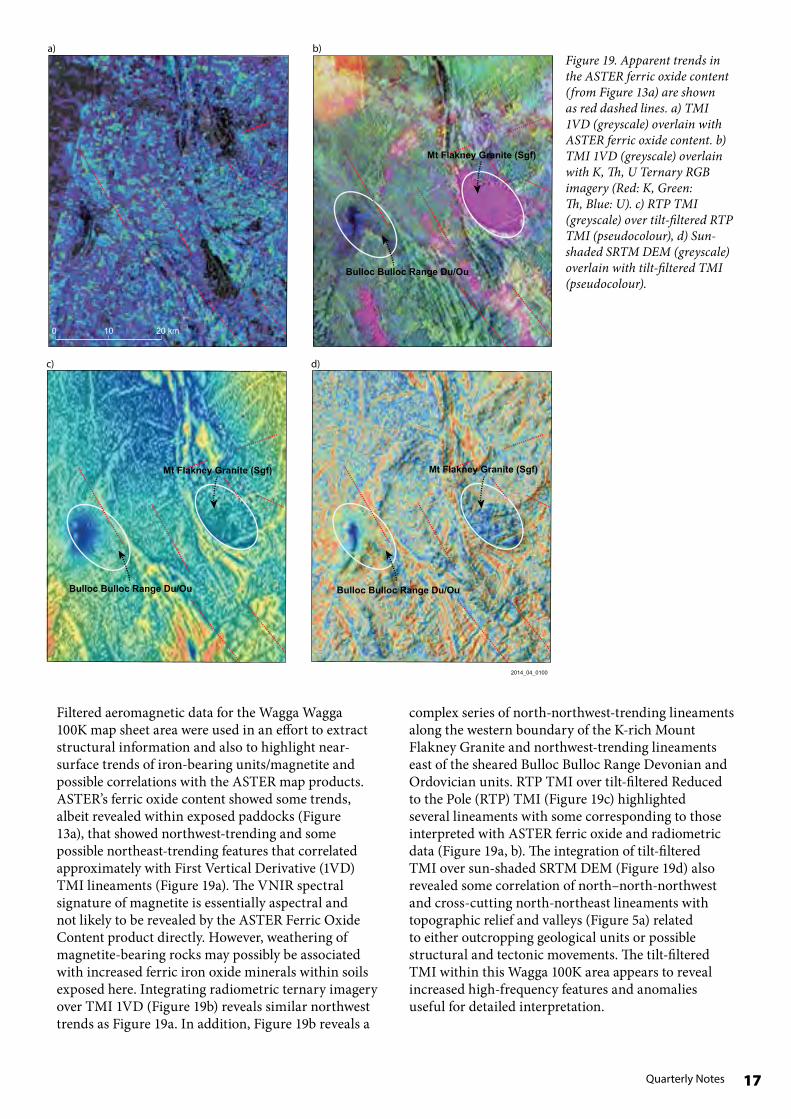
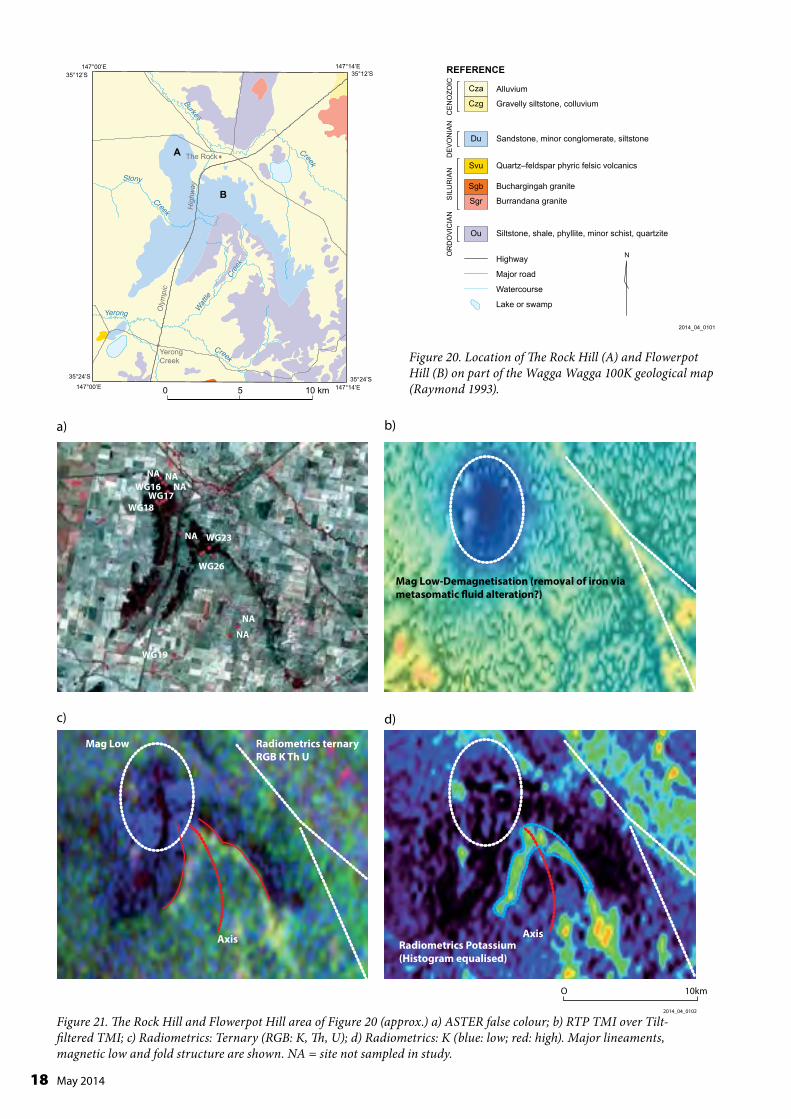
REFERENCE
Highway
Major road
Watercourse
Lake or swamp
Cza
Czg
Du
Svu
Sgb
Sgr
Ou
Alluvium
Gravelly siltstone colluvium
Buchargingah granite
Burrandana granite
Sandstone minor conglomerate siltstone
Quartzndashfeldspar phyric felsic volcanics
Siltstone shale phyllite minor schist quartzite
CE
NO
ZOIC
DE
VO
NIA
NS
ILU
RIA
NO
RD
OV
ICIA
N
2014_04_0101
Yerong
Burkes
Creek
Cree
k
Creek
Stony
Watt
le
Creek
Hig
hway
Oly
mpi
c
The Rock
YerongCreek
A
B
147deg00rsquoE
147deg00rsquoE 147deg14rsquoE
147deg14rsquoE
35deg12rsquoS 35deg12rsquoS
35deg24rsquoS 35deg24rsquoS
0 5 10 km
Yerong
Burkes
Creek
Cree
k
Creek
Stony
Watt
le
Creek
Hig
hway
Oly
mpi
c The Rock
Yerong Creek
A
B
147deg00rsquoE
147deg00rsquoE 147deg14rsquoE
147deg14rsquoE
35deg12rsquoS 35deg12rsquoS
35deg24rsquoS 35deg24rsquoS
0 5 10 km
REFERENCE
Cza
Czg
Alluvium
Gravelly siltstone colluvium
Du Sandstone minor conglomerate siltstone
Svu Quartzndashfeldspar phyric felsic volcanics
Buchargingah granite
Burrandana granite
Ou Siltstone shale phyllite minor schist quartzite
Highway
Major road
Watercourse
Lake or swamp
Sgb
Sgr
2014_04_0101
Figure 20 Location of The Rock Hill (A) and Flowerpot Hill (B) on part of the Wagga Wagga 100K geological map (Raymond 1993)
a) b) O
RD
OV
ICIA
N
SIL
UR
IAN
DE
VO
NIA
NC
EN
OZO
IC
c) d)
NA
NA
NA
NA
NA NAWG16
WG17 WG18
WG23
WG26
WG19
Mag Low-Demagnetisation (removal of iron via metasomatic fluid alteration)
Axis Axis
Mag Low Radiometrics ternary RGB K Th U
Radiometrics Potassium (Histogram equalised)
O 10km
2014_04_0102
Figure 21 The Rock Hill and Flowerpot Hill area of Figure 20 (approx) a) ASTER false colour b) RTP TMI over Tilt-filtered TMI c) Radiometrics Ternary (RGB K Th U) d) Radiometrics K (blue low red high) Major lineaments magnetic low and fold structure are shown NA = site not sampled in study
18 May 2014
b)REFERENCE
Waypoint site
Highway
Major road
Watercourse
Lake or swamp
Cza
Czg
Du
Svu
Sgb
Sgr
Ou
Alluvium
Gravelly siltstone colluvium
Buchargingah granite
Burrandana granite
Sandstone minor conglomerate siltstone
Quartzndashfeldspar phyric felsic volcanics
Siltstone shale phyllite minor schist quartzite
CE
NO
ZOIC
DE
VO
NIA
NS
ILU
RIA
NO
RD
OV
ICIA
N
2014_04_0103a
Yerong
Burke
s
Creek
Cree
k
Creek
Stony
Watt
le
Creek
Hig
hway
Oly
mpi
c
The Rock
YerongCreek
WP66WP63
WP37
WP56
WP57
WP50
WP35WP62
WP38
WP49
WP36
WP47
35deg23rsquoS147deg00rsquoE
147deg00rsquoE 147deg14rsquoE
35deg23rsquoS147deg14rsquoE
35deg14rsquoS35deg14rsquoS
0 5 10 km
Quarterly Notes
a) REFERENCE
Cza
Czg
Alluvium
Gravelly siltstone colluvium
CE
NO
ZOIC
Sandstone minor conglomerate siltstone
Mag Low ASTER AIOH content 35deg14rsquoS 35deg14rsquoS
35deg23rsquoS 35deg23rsquoS 147deg00rsquoE
147deg00rsquoE 147deg14rsquoE
147deg14rsquoE
2014_04_0103b
Yerong
Burke
s
Creek
Cree
k
Creek
Stony
Watt
le
Creek
Hig
hway
Oly
mpi
c
The Rock
Yerong Creek
WP66 WP63
WP37
WP56
WP57
WP50
WP35 WP62
WP38
WP49
WP36
WP47
35deg23rsquoS 147deg00rsquoE
147deg00rsquoE 147deg14rsquoE
35deg23rsquoS 147deg14rsquoE
35deg14rsquoS35deg14rsquoS
0 5 10 km
b)
c)
Du
Svu
Sgb
Sgr
Ou Siltstone shale phyllite minor schist quartzite
Waypoint site
Highway
Major road
Watercourse
Lake or swamp 2014_04_0103a
The Rock Hill and Flowerpot Hill Devonian and Ordovician metasedimentary units in the central western part of the Wagga Wagga 100K map sheet area (Figure 20) provided a useful target and potentially prospective area to closely examine ASTER and geophysical mapping issues and opportunities for data integration The ASTER false colour product highlights the elevated Bulloc Bulloc Range including The Rock and Flowerpot Hill surrounded by farm paddocks and cultivation (Figure 21a) The geophysics highlights some interesting lineaments a fold structure and a magnetic low (Figures 21bndashd) In particular the tilt-filtered TMI data shows a prominent pair of north-northwestndashsouth-southeast lineaments (Figure 21b) approximately parallel to the apparent hinge linefold axis of the DevonianOrdovician metasedimentary rocks (Figure 21c d) and also bounding a likely deep-seated magnetic low (Figure 21b) Ternary and K radiometric anomalies appear to cross-cut the
OR
DO
VIC
IAN
S
ILU
RIA
ND
EV
ON
IAN
Quartzndashfeldspar phyric felsic volcanics
Buchargingah granite
Burrandana granite
ASTER silica index 35deg14rsquoS
35deg23rsquoS 35deg23rsquoS 147deg00rsquoE
147deg00rsquoE 147deg14rsquoE
147deg14rsquoE
35deg14rsquoS
0 5 10 km
2014_04_0103c
Devonian and Ordovician stratigraphy when they are overlain on the geology map (Figure 22a) A modified version of the ASTER AlOH content map masked for both SRTM-derived slopes greater than 10 and less than 45 Landsat-derived photosynthetic (PV or lsquogreenrsquo) vegetation fraction cover appears to highlight some increase in mica content in the main hinge line axis (red areas Figure 22b) Figure 22b was also displayed using histogram equalisation using thresholds described by Cudahy (2012) The silica index product with a histogram equalisation stretch also appears to highlight some increase in silica along the axis (Figure 22c) Field observations of increased quartz and ASD spectral measurements identifying AlOH minerals phengite and kaolinite (Figure 23) appear to confirm this interpretation Hematite is also common within The Rock Hill and Flowerpot Hill area
Figure 22 The Rock Hill and Flowerpot Hill a) Wagga Wagga 100K geological map with geophysical features from Figure 21 b) ASTER AlOH masked for gt10 slope and lt45 PV Landsat fraction histogram equalised Mica anomaly is circled c) ASTER silica index histogram equalised Silica anomaly is circled Purpleblue low to red high content
19
Ref
lect
ance
050
040
030
020
010
000
wg26r_bw00000
wg23r_bw00001
Hematite signature (860 nm) Al poor mica or Phengite (eg 2209 nm absorption)
400 900 1400 1900 2400
Wavelength (nm) 2014_04_0104
Figure 23 Example ASD spectral signature of rock outcrop samples (WG23 26 ndash see Figure 21a) at Flowerpot Hill showing Al-poor micaAlOH and hematite diagnostic features
ASTER data issues and qualifications on interpretation Acquisition of ASTER satellite imagery at about 1030 am (Australian Eastern Daylight Time) can potentially produce sharp shadows on steep westerly slopes within high relief areas The ASTER satellite sensor has an additional issue of potential false anomalies from the lsquocrosstalkrsquo mis-calibration of its shortwave IR sensor (bands 5ndash9) as used for the generation of AlOH or micaclay mineral maps Dark shaded areas appear on the western slopes of The Rock and Flowerpot Hill as a result of north- and northwest-trending ridgelines as shown in the sun-shaded DEM imagery generated to simulate illumination conditions on 1112001 at 1030 am (blue ellipses Figure 24a) These areas of deep shadow appear to be coincident with some of the AlOH anomalies (red ellipse Figure 22b) and potentially the result of false anomalies associated with crosstalk
0 4km a)
WP 62 WP 35
WP 36 WP 37
WP 33
WP 38
WP 65
WP 66
WP 58
WP 45
SRTM DEM sun shaded (el 60˚ Az 72˚)
b)
(Figure 24b) However areas of full illumination on the northeast slopes also show AlOH anomalies and the crosstalk explanation does not entirely negate the AlOH presence Overall these results suggest that residual crosstalk effects are a possibility within dark areas of shadow and vegetation cover and bitumen (eg the Wagga AirfieldRAAF base) The validation of ASTER study sites can be assisted with the aid of DEMs fractional cover information field observations and ideally a VNIRndashSWIR spectrometer
ASTER AIOH mica content (hist eq) masked for 45 lt green vegetationgt 10 slope
Figure 24 a) Sun-shaded SRTM 80 m DEM of The Rock Hill and Flowerpot Hill (60deg elevation 072deg azimuth) simulating illumination conditions and shaded relief during ASTER image acquisition (1112001) b) ASTER AlOH content and corresponding areas of shaded relief (dashed ellipses)
Figure 25 The Rock Reserve WP62 a) Casuarina open woodland b) ferruginous gravel with lichen and moss ground cover c) typical canopy cover
20 May 2014
Quarterly Notes
a) b) c)
WP62
WP35
WP36 WP37
WP38WP40 WP39
WP58
WP65 WP63
WP66
WP62
WP35
WP36 WP37
WP38WP40 WP39
WP58
WP65 WP63
WP66
WP62
WP35
WP36 WP37
WP38WP40 WP39
WP58
WP65 WP63
WP66
0 20 40 60 80 100 0 20 40 60 80 100 0 20 40 60 80
non-photosynthetic Bare ground photosynthetic
4km 2014_04_01060
Figure 26 a) ndash c) Landsat fractional cover estimates for The Rock Hill mdash the same area as in Figure 24
Field observations and ASD in-situ field measurements of gravel lag vegetation ground litter etc at Waypoint WP62 (Figure 22a 24a) were undertaken near The Rock (Figure 25andashc) AusCover fractional cover estimates using Landsat acquired 1012001 one day before the ASTER gave values of 18 bare ground 41 photosynthetic and 40 non-photosynthetic vegetation cover for supplied 30m pixels encompassing WP62 Fractional cover imagery for the Bulloc Bulloc RangeThe Rock shows that the cover is dominated by photosynthetic and to a lesser extent non-photosynthetic vegetation (Figures 26andashc) ASD in-situ field measurements of gravel lag vegetation and ground litter at WP62 were processed to simulate ASTER ferric oxide content and green vegetation indices (Figure 27) This limited series of measurements suggested that the presence of dry vegetation matter (eg lichen bark leaf litter) can hinder the ASTER interpretation of ferric iron (eg hematite goethite) useful for regolith profile information andor alteration involving hematisation (Figure 27) Simulated values for ASTERrsquos AlOH content index from W62 gravel
The Rock Hill - Waypoint 62
Green tree and shrub foliage ground moss Devonian ferruginous sandstone gravel lag Lichen bark and leaf litter
1 3
0
4
2
AST
ER -
Gre
en V
eget
atio
n
ASTER - Ferric Oxide Content
Figure 27 ASD field spectral signatures of vegetation and gravel samples from The Rock Hill (WP 62) resampled and processed into equivalent ASTER map indices for green vegetation and ferric oxide content
lag ASD measurements produced values between 19 and 215 within the threshold range used to generate ASTER AlOH content imagery (Cudahy 2012) This compares favourably with the ASTER AlOH content index value of 20 as an average for 2 x 30 m pixels at WP62 extracted from the map product
Cobar 1100 000 and Canbelego 1100 000 map sheet areas The ASTER map products over the Cobar 1250 000 map sheet area are less affected by agricultural cultivation than the Wagga Wagga area as highlighted by ASTERrsquos false colour showing only approximately 25 under cultivationcropping to the east (Figure 28a) Isolated cloud cover is also apparent in the eastern third of the Cobar 1250 000 map sheet area where the map product is generated from a separate ASTER scene (Figure 28a) ASTERrsquos regolith product is useful for highlighting the extensive ephemeral drainage patterns (Figure 28b) As described by Cudahy (2012) the Regolith product based on the Landsat TM Regolith ratios helps to separate regolith and geological units while vegetated areas are highlighted by whitebright areas and clouds in blue (Figure 28b) ASTERrsquos green vegetation product also shows the limited nature of the green vegetation cover restricted to watercourses outside of the cultivated areas (Figure 28c) The land cover is more explicitly highlighted in the Landsat-derived fractional cover image which shows that close to the time of ASTER acquisition (September 2003) the most exposed bare ground was within the Cobar 100K map sheet area and to a lesser extent Canbelego 100K (reddish areas Figure 28d) Non photosynthetic vegetation (lsquodry vegetationrsquo) still appears pervasive in the non-cultivated areas (blue areas Figure 28d) which may be an issue for some ASTER map products
21
100
c) d)
a) b)
145ordm30E 147ordm00E 145ordm30E 147ordm00E 31ordm00S 31ordm00S
32ordm00S 32ordm00S
145ordm30E 147ordm00E 145ordm30E 147ordm00E
31ordm00S 31ordm00S
32ordm00S 32ordm00S
Figure 28 Cobar 1250K map sheet area a) ASTER false colour Note clouds and shadows in lower right b) ASTER regolith colour coded as for standard CSIRO Landsat Regolith product (Cudahy 2012) c) ASTER green vegetation (blue low red high) d) Landsat fractional cover RGB Red bare ground Green photosynthetic vegetation Blue non-photosynthetic vegetation (linear stretch 0ndash100)
a) b) 145ordm30E 147ordm00E 145ordm30E 147ordm00E
31ordm00S 31ordm00S
32ordm00S32ordm00S
Figure 29 Cobar 1250K map sheet area a) ASTER ferric oxide content (blue low red high) b) ASTER ferric oxide composition (histogram equalised) (blue goethitic red hematitic) c) ASTER AlOH group content (histogram equalised) (blue low red high) Note that cloud cover in eastern 100K maps introduces false anomalies (see Figure 28a)
32ordm00S
31ordm00S
c) 145ordm30E 147ordm00E
31ordm00S
32ordm00S
2014_04_0109
22 May 2014
23 Quarterly Notes
a) b) 145ordm30E 147ordm00E 145ordm30E 147ordm00E
31ordm00S 31ordm00S
32ordm00S 32ordm00S
147ordm00E
31ordm00S 145ordm30E 147ordm00E 145ordm30E
31ordm00S
32ordm00S32ordm00S
Figure 30 a) ASTER AlOH group composition (histogram equalised) (blue Al-rich micawell ordered kaolinite red Al-poor mica) b) ASTER silica index (histogram equalised) (blue low red high) c) Radiometric K (blue low red high) d) Radiometric Th (blue low red high)
c) d)
2014_04_0110
The ASTER Ferric Oxide Content product highlights coherent and continuous spatial distribution across the Cobar 1250 000 sheet area with increased abundance within the Cobar 100K area (Figure 29a) An improved insight into the ferric iron oxide was provided by the ASTERrsquos ferric oxide composition using histogram equalisation (Figure 29b) rather than a Gaussian stretch within the same threshold stretch limits advised by Cudahy (2012) Using the histogram equalised version of the ASTER ferric oxide composition product highlights more clearly an apparent increase in hematitic composition within the western Cobar 250K including the Cobar 100K map sheet area (Figure 29b) The presence of hematite versus goethite may be important for regolith interpretation and understanding of the arearsquos possible lateritic weathering (Huntington et al 1999) However care should also be taken when interpreting ferric oxide content and composition in the presence of dry vegetation matter mdash as observed at The Rock Hill (Figure 27) and also noted by Cudahy (2012) The areas highlighted by ASTER with increased hematite also coincide with increased abundance of AlOH minerals as shown by the histogram equalised version of the ASTER AlOH group content (greenndashyellow areas Figure 29c) The ASTER AlOH group composition product (histogram equalised Figure 30a) highlights extensive
areas of low values (blue) in the western Cobar 250K sheet area including within the Cobar 100K Cudahy (2012) interpreted such low ASTER AlOH composition product values as mapping well-ordered kaolinite or Al-rich white mica These areas also appear to coincide with the interpreted hematite-rich areas shown in Figure 29b (red areas) If a lateritic profile mineral model (Huntington et al 1999) is assumed then questions arise whether these areas lie within the highly weathered hematite-bearing duricrust or less-weathered ordered kaolinite-bearing saprolite The ASTER kaolin group index product for Cobar 250K sheet area does not indicate significant anomalies using linear or histogram equalised versions Cobar regolith landform mapping indicates much of the Cobar 100K area is highly weathered in situ bedrock (Gibson 1999) However validation field work involving sampling and ASD measurements should clarify these issues The ASTER silica index product does appear to indicate high silica content along the western boundary of the Cobar 100K sheet area that coincides with elevated areas mapped by Gibson (1999) containing cappings of silicified sedimentary units (histogram equalised Figure 30b) Geophysical radiometric products K and Th also highlight distinctive units with the Cobar 100K and Canbelego 100K map sheet areas (Figures 30c d) The K and Th images mostly appear to map in an approximate complementary way areas of alluvial
a)
147ordm00E 31ordm00S
145ordm30E
32ordm00S
b) 145ordm30E 147ordm00E
31ordm00S
32ordm00S
Figure 31 a) RGB composite ASTERrsquos AlOH content (histogram equalised) ferric oxide content silica index (histogram equalised) b) RGB composite K ASTERrsquos ferric oxide content AlOH content over shaded DEM
(eg K) and in situ regolith units (eg Th) (Figures 30c d) In particular the drainage areas appear rich in apparently K-bearing clays (Figure 30c) whilst the Th occurs where there are non-drainage in situ relict areas (Figure 30c) possibly related to ferricrete Further ground truthing would help this interpretation An RGB composite image of ASTERrsquos AlOH group content ferric oxide content and silica index products appeared to discriminate generally elevated combined clay- and quartz-rich units (eg red+blue areas shown as purple) from ferric iron oxide minerals (green) within some drainage areas (Figure 31a) A RGB composite image of the radioelement K ASTER ferric oxide content and ASTER AlOH group content products also generated significant and complex spatially coherent patterns particularly within the Cobar and Canbelego 100K sheet areas that appear worthy of further examination for regolith information (Figure 31b)
2014_04_0111
Conclusions This project demonstrated within the NSW study areas of Wagga Wagga and Cobar the usefulness of the recently released Australia ASTER map products supplied by CSIROGA for identifying or discriminating variations in surface composition The map products included mineral identitiesgroups within geological units possible overprinted alteration andor weathered regolith These map products can potentially aid mineral exploration in NSW within semi-arid areas such as Cobar and to a lesser extent within open woodland and cultivated environments such as Wagga Wagga Although several ASTER map products provided useful information as individual entities their application generally benefits exploration when integrated with geophysical topographical and fractional land cover information In particular DEM-derived slope information and vegetation fractional data were used to mask and refine ASTER map products in the Wagga area within the temperate and vegetated Riverine Plains Anomalous AlOH- and silica-rich areas were discriminated and associated with radiometric and high frequency filtered TMI-inferred structures in the vicinity of the Bulloc Bulloc Range especially at The Rock Hill ASTER Ferric Iron Content product within the Wagga Wagga area also appeared to show northwest lineament trends similar to those highlighted by filtered TMI products Map generation for the Murrumbidgee floodplains using radiometric data also appeared to benefit from topographic slope masking to exclude areas of alluvial and aeolian transported cover More spatially coherent anomalous areas particularly related to the regolith were identified by the ASTER map products in the semi-arid and rangeland terrain of Cobar The application of different histogram stretches such as histogram equalisation was found to further enhance the display of anomalous features mdash although care should be applied regarding data thresholds The application of the ASTER map products individually as RGB composites or integrated with radiometric data appears useful for regolith mapping and identifying weathering profile-related mineralogy at Cobar Effects of residual ASTER crosstalk mis-calibration within areas of shadowdark surfacesdense vegetation and possible interpretation ambiguities between VNIR-derived ferric oxide and dry vegetation highlight the importance of validation fieldwork to check anomalous areas and their spectral signatures The validation of ASTER study sites may be assisted by DEM and fractional cover information Further investigations into the benefits of integrating artificially illuminated shaded topographic relief and AusCover fractional land cover information relevant for ASTER acquisition dates are recommended
24 May 2014
25 Quarterly Notes
Acknowledgements This study has been supported and funded by the Geological Survey of New South Wales in part for the purpose of contributing to the knowledge of the Wagga Wagga 1100 000 map sheet geology for mineral exploration Geophysical and associated data for the Wagga Wagga and Cobar study areas were received from the Geological Survey of New South Wales ASTER GeoTIFFs and BSQ ASTER map products were also gratefully obtained from Geoscience Australia and CSIROndashEarth Science amp Resource Engineering whilst the original ASTER imagery was made available by NASA and METI GIS shapefiles for the Wagga Wagga and Cobar 1250 000 map sheet areas were also gratefully obtained from Geoscience Australia Assistance is also gratefully acknowledged from Thomas Cuday and Carsten Laukamp of CSIRO and Matilda Thomas of Geoscience Australia Support from Professor Simon Jones and Laurie Buxton of RMIT University was also helpful during this study
References Caccetta M Collings S amp Cudahy C 2013 A calibration methodology for continental scale mapping using ASTER imagery Remote Sensing of Environment 139 306ndash317
Chan RA Greene RSB de Souza Kovacs N Maly BER McQueen KG amp Scott KM 2003 Regolith geomorphology geochemistry and mineralisation of the SussexndashCoolabah area in the CobarndashGirilambone region North-Western Lachlan Foldbelt NSW CRC LEME openfile report 148 NSW DMR Report GS2001319
Chen XY 1997 Quaternary sedimentation parna landforms and soil landscapes of the Wagga Wagga 1100 000 map sheet south-eastern Australia Australian Journal of Soil Research 35(3) 643ndash668
Chen XY amp McKane DJ 1997 Soil Landscapes of the Wagga Wagga 100K Sheet map and report Department of Land and Water Conservation Sydney
Clark RN King TVV Klejwa M Swayze GA amp Vergo N 1990 High spectral resolution reflectance spectroscopy of minerals Journal of Geophysical Research 95(B8) 12653ndash12680
Cudahy TJ 1997 PIMA-II spectral characteristics of natural kaolins CSIRO Exploration and Mining Report 420R 57 pp
Cudahy TJ 2012 Satellite ASTER Geoscience Product Notes for Australia Version 1 7th August 2012 CSIRO ePublish No EP-30-07-12-44
Downes PM McEvilly R amp Raphael NM 2004 Mineral deposits and models Cootamundra 1250 000 map sheet area Quarterly Notes of the Geological Survey of New South Wales 116 1ndash38
Downes PM amp Seccombe PK 2008 Sulfur isotope signatures for orogenic gold deposits Lachlan Orogen New South Wales In Proceedings of PACRIM Congress 24ndash26 November 2008 AusIMM Gold Coast Queensland Australia
Duke EF 1994 Near infrared spectra of muscovite Tschermak substitution and metamorphic reaction process implications for remote sensing Geology 22 621ndash624
Gibson DL 1999 Explanatory notes for the 1500 000 Cobar regolith landform map CRC LEME Geological Survey of NSW Open File Report 76
Grove CI Hook SJ amp Paylor ED III 1992 Laboratory reflectance spectra of 160 minerals 04 to 25 micrometers NASA Jet Propulsion Laboratory report JPL Publication 92-2
Hewson R 2013 Using ASTER and geophysical mapping to assist exploration over Wagga Wagga 1100 000 sheet area Geological Survey of New South Wales File GS20131558
Hewson RD amp Cudahy TJ 2011 Issues Affecting Geological Mapping with ASTER Data A Case Study of the Mt Fitton Area South Australia In Ramachandran B Justice CO amp Abrahams MJ (eds) Land Remote Sensing and Global Environmental Change NASArsquos Earth Observing System and the Science of ASTER and MODIS Applications in ASTER pp 273ndash300 Springer-Verlag New York
Hewson RD Cudahy TJ Drake-Brockman J Meyers J amp Hashemi A 2006 Mapping geology associated with manganese mineralization using spectral sensing techniques at Woodie Woodie East Pilbara Exploration Geophysics 37 389ndash400
Hewson RD Cudahy TJ amp Huntington JF 2001 Geologic and alteration mapping at Mt Fitton South Australia using ASTER satellite-borne data In Geoscience and Remote Sensing Symposium 2001 IGARSS lsquo01 IEEE 2001 International vol2 724ndash726
Hewson RD Cudahy TJ Mizuhiko S Ueda K amp Mauger AJ 2005 Seamless geological map generation using ASTER in the Broken HillndashCurnamona Province of Australia Remote Sensing of Environment 99(1ndash2) 159ndash172
Hewson RD Mah A Dunne M amp Cudahy TJ 2003 Mapping mineralogical and structural relationships with satellite-borne ASTER and airborne geophysics at Broken Hill ASEG 16th Geophysical Conference and Exhibition Adelaide February 2003 Australian Society Exploration Geophysicists
Hewson R Robson D Mauger A Cudahy T Thomas M amp Jones S 2013 Extracting mineralogical and geomorphological information using new ASTER mineral maps with airborne geophysics Proceedings of the ASEGndashPESA 2013 23rd International Geophysical Conference and Exhibition 11ndash14 August 2013 Melbourne Australia
Hunt GR amp Ashley RP 1979 Spectra of altered rocks in the visible and near infrared Economic Geology 74 1613ndash1629
Huntington JF Cudahy TJ Yang K Scott KM Mason P Gray DJ Berman M Bischof L Reston M S Mauger AJ Keeling JL amp Phillips RN 1999 Mineral mapping with field spectroscopy for exploration ndash final report CSIROAMIRA Project P435 CSIRO Exploration and Mining Report 419R
Iwasaki A Fujisada H Akao H Shindou O amp Akagi S 2001 Enhancement of spectral separation performance for ASTERSWIR Proceedings of SPIE (International Society for Optical Engineering) 4486 42ndash50
Iwasaki A amp Tonooka H 2005 Validation of a crosstalk correction algorithm for ASTERSWIR IEEE Transactions on Geoscience and Remote Sensing 43(12) 2747ndash2751
Laukamp C Cudahy C Caccetta M Thomas M Close D amp Lennartz R 2013 Successful mineral exploration using multispectral remote sensing data ndash ASTER Geoscience Map of Australia In Proceedings 12th Biennial Meeting of the Society of Geology Applied to Mineral Deposits (SGA) Uppsala Sweden 12ndash15 August 2013
Lewis P amp Downes PM 2008 Mineral systems and processes in New South Wales a project to enhance understanding and assist exploration Quarterly Notes of the Geological Survey of New South Wales 128
McQueen KG 2008 A guide for mineral exploration through the regolith in the Cobar Region Lachlan Orogen New South Wales Cooperative Research Centre for Landscape Environments and Mineral Exploration
Michael S 2012 Satellite imagery the range and value CSIRO Publishing for Australian Society for Exploration Geophysicists Preview 2012(160) 20ndash25
Raymond O 1993 Wagga WaggandashKyeamba region geological map 1100 000 Australian Geological Survey Organisation Canberra
Ricchetti E 2000 Multispectral satellite image and ancillary data integration for geological classification Photogrammetric Engineering amp Remote Sensing 66(4) 429ndash435
Rowan LC amp Mars JC 2003 Lithologic mapping in the Mountain Pass California area using Advanced Spaceborne Thermal Emission and Reflection Radiometer (ASTER) data Remote Sensing of Environment 84 350ndash366
Salisbury JW amp DrsquoAria DM 1992 Emissivity of terrestrial materials in the 8ndash14 μm atmospheric window Remote Sensing of Environment 42 83ndash106
Scarth P Roumlder A amp Schmidt M 2010 Tracking grazing pressure and climate interaction ndash the role of Landsat fractional cover in time series analysis In Proceedings of the 15th Australasian Remote Sensing and Photogrammetry Conference (ARSPC) 13ndash17 September Alice Springs Australia
Sherman DM 1985 The electronic structures of Fe3+ coordination sites in iron oxides application to spectra bonding and magnetism Physics and Chemistry of Minerals 12 161ndash175
Vincent RK amp Thomson F 1972 Spectral compositional imaging of silicate rocks Journal of Geophysical Research 77(14) 2465ndash2472
Yamaguchi Y Fujisada H Kahle A Tsu H Kato M Watanabe H Sato I amp Kudoh M 2001 ASTER instrument performance operation status and application to earth sciences In Geoscience and Remote Sensing Symposium 2001 IGARSS lsquo01 IEEE 2001 International vol3 1215ndash1216
26 May 2014
ShippingCONTACT Please note that we cannot ship to PO boxes
Product Order Form All prices are in Australian dollars and include Goods and Services Tax at 10 unless otherwise noted Only Australian orders are subject to the GST and all international orders will be processed exclusive of GST All totals will be billed in Australian Dollars International customers will be charged the equivalent of this rate in their respective currencies at the time the bank processes the transaction
Credit card surcharge MasterCard 04 Visa 04 AMEX 15 Diners Club 24 Other payment (NA)
Subtotal (excl GST for internationals)
TOTAL
Be sure to select international postage above if you are an overseas customer
Item Quantity Line Total Price (incl GST)
International $45 (excl GST) Postage Domestic $8 (1-2 items) $10 (3-5 items) $12 (5+ items) Express $13
o f f i c e
U S E
o n l y
FULL NAME JOB TITLE
ORGANISATION STREET ADDRESS
CITY STATE POSTCODE COUNTRY
PHONE EMAIL
CARD NUMBER NAME ON CARD
CARDHOLDER SIGNATURE DATE EXPIRY SECURITY CODE
We accept payment by credit card cheque or money order (made payable to NSW Department of Trade amp Investment) Payment
Return
Did you know Selected products can be purchased from the NSW Government Online Shop wwwshopnswgovau
Information and Customer Service Centre NSW Department of Trade amp Investment PO Box 344 Hunter Region Mail Centre NSW 2310
mineralpublicationordersindustrynswgovau
+61 2 4931 6700 Enquiries +61 2 4931 6666
wwwresourcesnswgovau
NSW Trade amp Investment Division of Resources amp Energy 516 High Street Maitland NSW 2320 PO Box 344 Hunter Region Mail Centre NSW 2310 T1300 736 122 T (02) 49316666
wwwresourcesnswgovau
Second edition Bathurst metallogenic 1250 000 map
Replacing the popular 1972 edition the updated map shows 311 metallic industrial construction material and fuel deposits classified by size commodity and deposit type A deposit classification scheme is included along with a timendashspace plot showing major mineralising events
On the back of the map is a comprehensive poster summarising the mining history and geological history of the area It features many colourful and historic images a locality map and a mining timeline
Cost $1980
- _GoBack
- 141726f49c7572d0__MailEndCompose
-
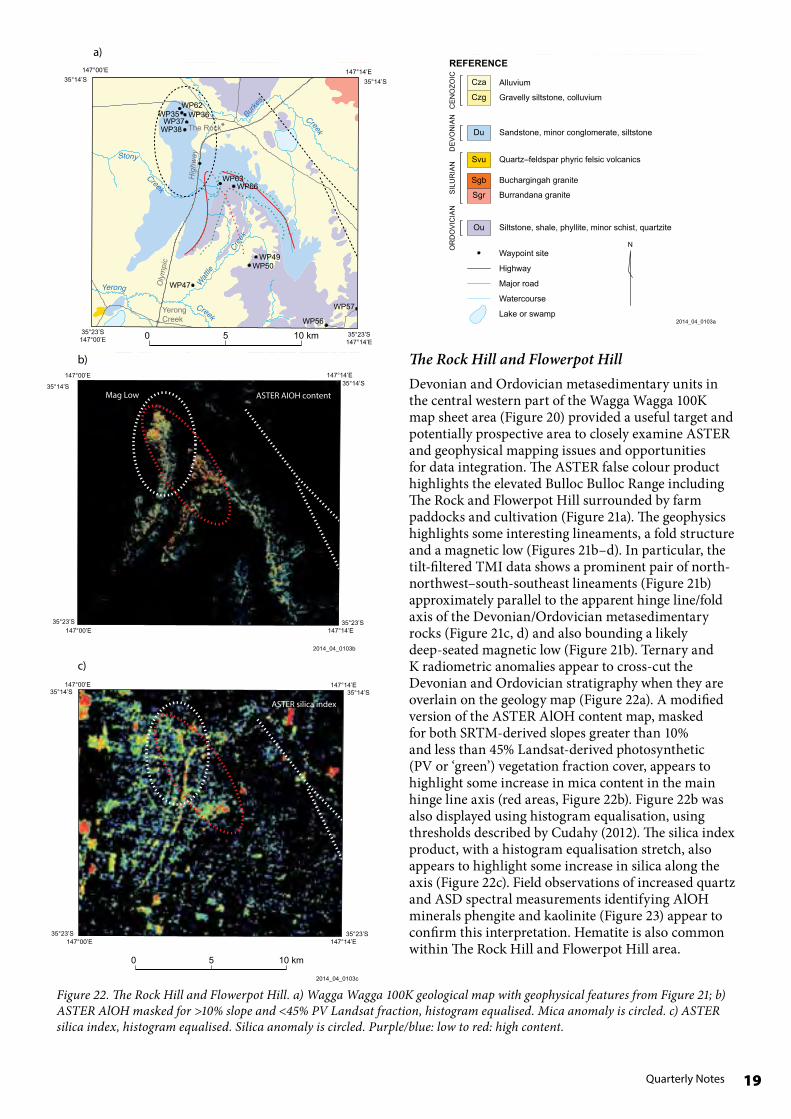
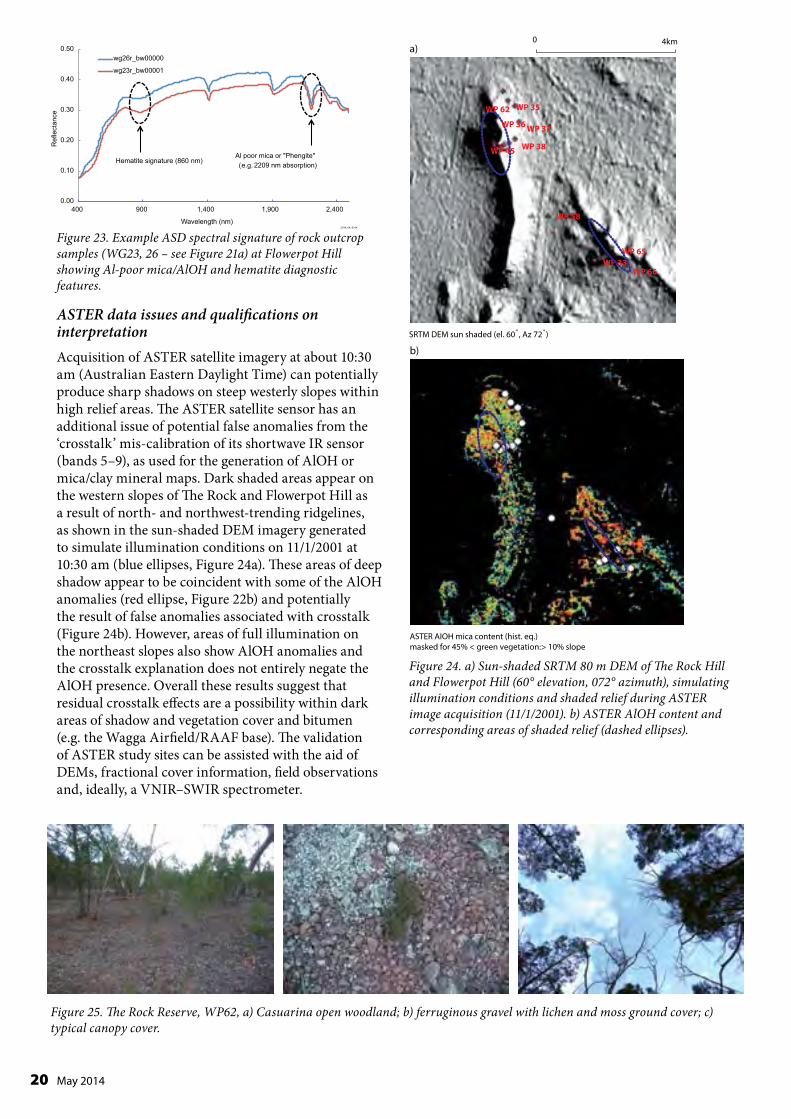
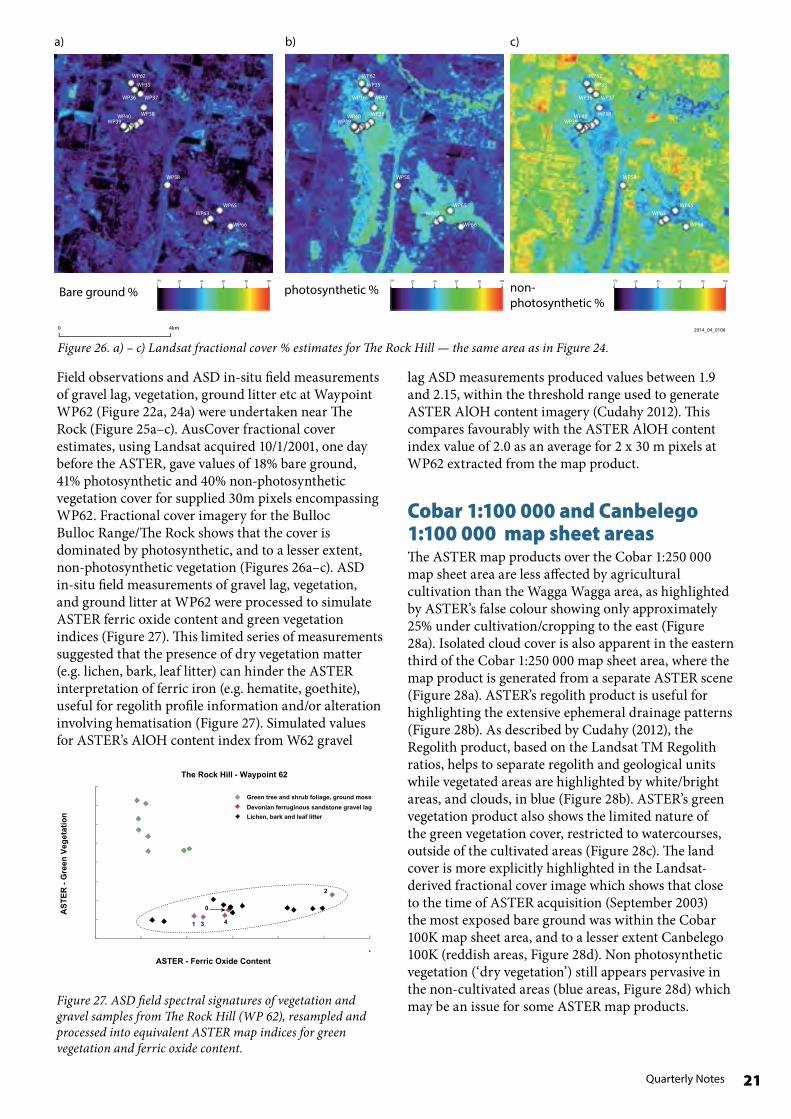
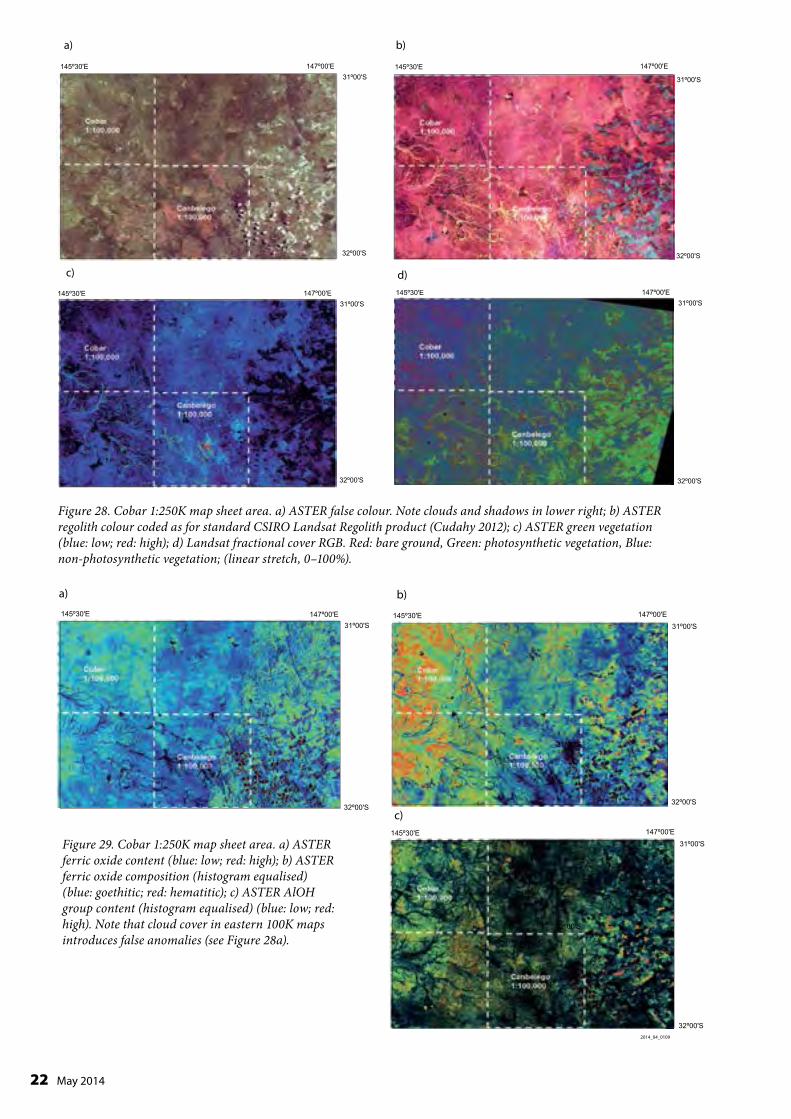
c) d)
a) b)
145ordm30E 147ordm00E 145ordm30E 147ordm00E 31ordm00S 31ordm00S
32ordm00S 32ordm00S
145ordm30E 147ordm00E 145ordm30E 147ordm00E
31ordm00S 31ordm00S
32ordm00S 32ordm00S
Figure 28 Cobar 1250K map sheet area a) ASTER false colour Note clouds and shadows in lower right b) ASTER regolith colour coded as for standard CSIRO Landsat Regolith product (Cudahy 2012) c) ASTER green vegetation (blue low red high) d) Landsat fractional cover RGB Red bare ground Green photosynthetic vegetation Blue non-photosynthetic vegetation (linear stretch 0ndash100)
a) b) 145ordm30E 147ordm00E 145ordm30E 147ordm00E
31ordm00S 31ordm00S
32ordm00S32ordm00S
Figure 29 Cobar 1250K map sheet area a) ASTER ferric oxide content (blue low red high) b) ASTER ferric oxide composition (histogram equalised) (blue goethitic red hematitic) c) ASTER AlOH group content (histogram equalised) (blue low red high) Note that cloud cover in eastern 100K maps introduces false anomalies (see Figure 28a)
32ordm00S
31ordm00S
c) 145ordm30E 147ordm00E
31ordm00S
32ordm00S
2014_04_0109
22 May 2014
23 Quarterly Notes
a) b) 145ordm30E 147ordm00E 145ordm30E 147ordm00E
31ordm00S 31ordm00S
32ordm00S 32ordm00S
147ordm00E
31ordm00S 145ordm30E 147ordm00E 145ordm30E
31ordm00S
32ordm00S32ordm00S
Figure 30 a) ASTER AlOH group composition (histogram equalised) (blue Al-rich micawell ordered kaolinite red Al-poor mica) b) ASTER silica index (histogram equalised) (blue low red high) c) Radiometric K (blue low red high) d) Radiometric Th (blue low red high)
c) d)
2014_04_0110
The ASTER Ferric Oxide Content product highlights coherent and continuous spatial distribution across the Cobar 1250 000 sheet area with increased abundance within the Cobar 100K area (Figure 29a) An improved insight into the ferric iron oxide was provided by the ASTERrsquos ferric oxide composition using histogram equalisation (Figure 29b) rather than a Gaussian stretch within the same threshold stretch limits advised by Cudahy (2012) Using the histogram equalised version of the ASTER ferric oxide composition product highlights more clearly an apparent increase in hematitic composition within the western Cobar 250K including the Cobar 100K map sheet area (Figure 29b) The presence of hematite versus goethite may be important for regolith interpretation and understanding of the arearsquos possible lateritic weathering (Huntington et al 1999) However care should also be taken when interpreting ferric oxide content and composition in the presence of dry vegetation matter mdash as observed at The Rock Hill (Figure 27) and also noted by Cudahy (2012) The areas highlighted by ASTER with increased hematite also coincide with increased abundance of AlOH minerals as shown by the histogram equalised version of the ASTER AlOH group content (greenndashyellow areas Figure 29c) The ASTER AlOH group composition product (histogram equalised Figure 30a) highlights extensive
areas of low values (blue) in the western Cobar 250K sheet area including within the Cobar 100K Cudahy (2012) interpreted such low ASTER AlOH composition product values as mapping well-ordered kaolinite or Al-rich white mica These areas also appear to coincide with the interpreted hematite-rich areas shown in Figure 29b (red areas) If a lateritic profile mineral model (Huntington et al 1999) is assumed then questions arise whether these areas lie within the highly weathered hematite-bearing duricrust or less-weathered ordered kaolinite-bearing saprolite The ASTER kaolin group index product for Cobar 250K sheet area does not indicate significant anomalies using linear or histogram equalised versions Cobar regolith landform mapping indicates much of the Cobar 100K area is highly weathered in situ bedrock (Gibson 1999) However validation field work involving sampling and ASD measurements should clarify these issues The ASTER silica index product does appear to indicate high silica content along the western boundary of the Cobar 100K sheet area that coincides with elevated areas mapped by Gibson (1999) containing cappings of silicified sedimentary units (histogram equalised Figure 30b) Geophysical radiometric products K and Th also highlight distinctive units with the Cobar 100K and Canbelego 100K map sheet areas (Figures 30c d) The K and Th images mostly appear to map in an approximate complementary way areas of alluvial
a)
147ordm00E 31ordm00S
145ordm30E
32ordm00S
b) 145ordm30E 147ordm00E
31ordm00S
32ordm00S
Figure 31 a) RGB composite ASTERrsquos AlOH content (histogram equalised) ferric oxide content silica index (histogram equalised) b) RGB composite K ASTERrsquos ferric oxide content AlOH content over shaded DEM
(eg K) and in situ regolith units (eg Th) (Figures 30c d) In particular the drainage areas appear rich in apparently K-bearing clays (Figure 30c) whilst the Th occurs where there are non-drainage in situ relict areas (Figure 30c) possibly related to ferricrete Further ground truthing would help this interpretation An RGB composite image of ASTERrsquos AlOH group content ferric oxide content and silica index products appeared to discriminate generally elevated combined clay- and quartz-rich units (eg red+blue areas shown as purple) from ferric iron oxide minerals (green) within some drainage areas (Figure 31a) A RGB composite image of the radioelement K ASTER ferric oxide content and ASTER AlOH group content products also generated significant and complex spatially coherent patterns particularly within the Cobar and Canbelego 100K sheet areas that appear worthy of further examination for regolith information (Figure 31b)
2014_04_0111
Conclusions This project demonstrated within the NSW study areas of Wagga Wagga and Cobar the usefulness of the recently released Australia ASTER map products supplied by CSIROGA for identifying or discriminating variations in surface composition The map products included mineral identitiesgroups within geological units possible overprinted alteration andor weathered regolith These map products can potentially aid mineral exploration in NSW within semi-arid areas such as Cobar and to a lesser extent within open woodland and cultivated environments such as Wagga Wagga Although several ASTER map products provided useful information as individual entities their application generally benefits exploration when integrated with geophysical topographical and fractional land cover information In particular DEM-derived slope information and vegetation fractional data were used to mask and refine ASTER map products in the Wagga area within the temperate and vegetated Riverine Plains Anomalous AlOH- and silica-rich areas were discriminated and associated with radiometric and high frequency filtered TMI-inferred structures in the vicinity of the Bulloc Bulloc Range especially at The Rock Hill ASTER Ferric Iron Content product within the Wagga Wagga area also appeared to show northwest lineament trends similar to those highlighted by filtered TMI products Map generation for the Murrumbidgee floodplains using radiometric data also appeared to benefit from topographic slope masking to exclude areas of alluvial and aeolian transported cover More spatially coherent anomalous areas particularly related to the regolith were identified by the ASTER map products in the semi-arid and rangeland terrain of Cobar The application of different histogram stretches such as histogram equalisation was found to further enhance the display of anomalous features mdash although care should be applied regarding data thresholds The application of the ASTER map products individually as RGB composites or integrated with radiometric data appears useful for regolith mapping and identifying weathering profile-related mineralogy at Cobar Effects of residual ASTER crosstalk mis-calibration within areas of shadowdark surfacesdense vegetation and possible interpretation ambiguities between VNIR-derived ferric oxide and dry vegetation highlight the importance of validation fieldwork to check anomalous areas and their spectral signatures The validation of ASTER study sites may be assisted by DEM and fractional cover information Further investigations into the benefits of integrating artificially illuminated shaded topographic relief and AusCover fractional land cover information relevant for ASTER acquisition dates are recommended
24 May 2014
25 Quarterly Notes
Acknowledgements This study has been supported and funded by the Geological Survey of New South Wales in part for the purpose of contributing to the knowledge of the Wagga Wagga 1100 000 map sheet geology for mineral exploration Geophysical and associated data for the Wagga Wagga and Cobar study areas were received from the Geological Survey of New South Wales ASTER GeoTIFFs and BSQ ASTER map products were also gratefully obtained from Geoscience Australia and CSIROndashEarth Science amp Resource Engineering whilst the original ASTER imagery was made available by NASA and METI GIS shapefiles for the Wagga Wagga and Cobar 1250 000 map sheet areas were also gratefully obtained from Geoscience Australia Assistance is also gratefully acknowledged from Thomas Cuday and Carsten Laukamp of CSIRO and Matilda Thomas of Geoscience Australia Support from Professor Simon Jones and Laurie Buxton of RMIT University was also helpful during this study
References Caccetta M Collings S amp Cudahy C 2013 A calibration methodology for continental scale mapping using ASTER imagery Remote Sensing of Environment 139 306ndash317
Chan RA Greene RSB de Souza Kovacs N Maly BER McQueen KG amp Scott KM 2003 Regolith geomorphology geochemistry and mineralisation of the SussexndashCoolabah area in the CobarndashGirilambone region North-Western Lachlan Foldbelt NSW CRC LEME openfile report 148 NSW DMR Report GS2001319
Chen XY 1997 Quaternary sedimentation parna landforms and soil landscapes of the Wagga Wagga 1100 000 map sheet south-eastern Australia Australian Journal of Soil Research 35(3) 643ndash668
Chen XY amp McKane DJ 1997 Soil Landscapes of the Wagga Wagga 100K Sheet map and report Department of Land and Water Conservation Sydney
Clark RN King TVV Klejwa M Swayze GA amp Vergo N 1990 High spectral resolution reflectance spectroscopy of minerals Journal of Geophysical Research 95(B8) 12653ndash12680
Cudahy TJ 1997 PIMA-II spectral characteristics of natural kaolins CSIRO Exploration and Mining Report 420R 57 pp
Cudahy TJ 2012 Satellite ASTER Geoscience Product Notes for Australia Version 1 7th August 2012 CSIRO ePublish No EP-30-07-12-44
Downes PM McEvilly R amp Raphael NM 2004 Mineral deposits and models Cootamundra 1250 000 map sheet area Quarterly Notes of the Geological Survey of New South Wales 116 1ndash38
Downes PM amp Seccombe PK 2008 Sulfur isotope signatures for orogenic gold deposits Lachlan Orogen New South Wales In Proceedings of PACRIM Congress 24ndash26 November 2008 AusIMM Gold Coast Queensland Australia
Duke EF 1994 Near infrared spectra of muscovite Tschermak substitution and metamorphic reaction process implications for remote sensing Geology 22 621ndash624
Gibson DL 1999 Explanatory notes for the 1500 000 Cobar regolith landform map CRC LEME Geological Survey of NSW Open File Report 76
Grove CI Hook SJ amp Paylor ED III 1992 Laboratory reflectance spectra of 160 minerals 04 to 25 micrometers NASA Jet Propulsion Laboratory report JPL Publication 92-2
Hewson R 2013 Using ASTER and geophysical mapping to assist exploration over Wagga Wagga 1100 000 sheet area Geological Survey of New South Wales File GS20131558
Hewson RD amp Cudahy TJ 2011 Issues Affecting Geological Mapping with ASTER Data A Case Study of the Mt Fitton Area South Australia In Ramachandran B Justice CO amp Abrahams MJ (eds) Land Remote Sensing and Global Environmental Change NASArsquos Earth Observing System and the Science of ASTER and MODIS Applications in ASTER pp 273ndash300 Springer-Verlag New York
Hewson RD Cudahy TJ Drake-Brockman J Meyers J amp Hashemi A 2006 Mapping geology associated with manganese mineralization using spectral sensing techniques at Woodie Woodie East Pilbara Exploration Geophysics 37 389ndash400
Hewson RD Cudahy TJ amp Huntington JF 2001 Geologic and alteration mapping at Mt Fitton South Australia using ASTER satellite-borne data In Geoscience and Remote Sensing Symposium 2001 IGARSS lsquo01 IEEE 2001 International vol2 724ndash726
Hewson RD Cudahy TJ Mizuhiko S Ueda K amp Mauger AJ 2005 Seamless geological map generation using ASTER in the Broken HillndashCurnamona Province of Australia Remote Sensing of Environment 99(1ndash2) 159ndash172
Hewson RD Mah A Dunne M amp Cudahy TJ 2003 Mapping mineralogical and structural relationships with satellite-borne ASTER and airborne geophysics at Broken Hill ASEG 16th Geophysical Conference and Exhibition Adelaide February 2003 Australian Society Exploration Geophysicists
Hewson R Robson D Mauger A Cudahy T Thomas M amp Jones S 2013 Extracting mineralogical and geomorphological information using new ASTER mineral maps with airborne geophysics Proceedings of the ASEGndashPESA 2013 23rd International Geophysical Conference and Exhibition 11ndash14 August 2013 Melbourne Australia
Hunt GR amp Ashley RP 1979 Spectra of altered rocks in the visible and near infrared Economic Geology 74 1613ndash1629
Huntington JF Cudahy TJ Yang K Scott KM Mason P Gray DJ Berman M Bischof L Reston M S Mauger AJ Keeling JL amp Phillips RN 1999 Mineral mapping with field spectroscopy for exploration ndash final report CSIROAMIRA Project P435 CSIRO Exploration and Mining Report 419R
Iwasaki A Fujisada H Akao H Shindou O amp Akagi S 2001 Enhancement of spectral separation performance for ASTERSWIR Proceedings of SPIE (International Society for Optical Engineering) 4486 42ndash50
Iwasaki A amp Tonooka H 2005 Validation of a crosstalk correction algorithm for ASTERSWIR IEEE Transactions on Geoscience and Remote Sensing 43(12) 2747ndash2751
Laukamp C Cudahy C Caccetta M Thomas M Close D amp Lennartz R 2013 Successful mineral exploration using multispectral remote sensing data ndash ASTER Geoscience Map of Australia In Proceedings 12th Biennial Meeting of the Society of Geology Applied to Mineral Deposits (SGA) Uppsala Sweden 12ndash15 August 2013
Lewis P amp Downes PM 2008 Mineral systems and processes in New South Wales a project to enhance understanding and assist exploration Quarterly Notes of the Geological Survey of New South Wales 128
McQueen KG 2008 A guide for mineral exploration through the regolith in the Cobar Region Lachlan Orogen New South Wales Cooperative Research Centre for Landscape Environments and Mineral Exploration
Michael S 2012 Satellite imagery the range and value CSIRO Publishing for Australian Society for Exploration Geophysicists Preview 2012(160) 20ndash25
Raymond O 1993 Wagga WaggandashKyeamba region geological map 1100 000 Australian Geological Survey Organisation Canberra
Ricchetti E 2000 Multispectral satellite image and ancillary data integration for geological classification Photogrammetric Engineering amp Remote Sensing 66(4) 429ndash435
Rowan LC amp Mars JC 2003 Lithologic mapping in the Mountain Pass California area using Advanced Spaceborne Thermal Emission and Reflection Radiometer (ASTER) data Remote Sensing of Environment 84 350ndash366
Salisbury JW amp DrsquoAria DM 1992 Emissivity of terrestrial materials in the 8ndash14 μm atmospheric window Remote Sensing of Environment 42 83ndash106
Scarth P Roumlder A amp Schmidt M 2010 Tracking grazing pressure and climate interaction ndash the role of Landsat fractional cover in time series analysis In Proceedings of the 15th Australasian Remote Sensing and Photogrammetry Conference (ARSPC) 13ndash17 September Alice Springs Australia
Sherman DM 1985 The electronic structures of Fe3+ coordination sites in iron oxides application to spectra bonding and magnetism Physics and Chemistry of Minerals 12 161ndash175
Vincent RK amp Thomson F 1972 Spectral compositional imaging of silicate rocks Journal of Geophysical Research 77(14) 2465ndash2472
Yamaguchi Y Fujisada H Kahle A Tsu H Kato M Watanabe H Sato I amp Kudoh M 2001 ASTER instrument performance operation status and application to earth sciences In Geoscience and Remote Sensing Symposium 2001 IGARSS lsquo01 IEEE 2001 International vol3 1215ndash1216
26 May 2014
ShippingCONTACT Please note that we cannot ship to PO boxes
Product Order Form All prices are in Australian dollars and include Goods and Services Tax at 10 unless otherwise noted Only Australian orders are subject to the GST and all international orders will be processed exclusive of GST All totals will be billed in Australian Dollars International customers will be charged the equivalent of this rate in their respective currencies at the time the bank processes the transaction
Credit card surcharge MasterCard 04 Visa 04 AMEX 15 Diners Club 24 Other payment (NA)
Subtotal (excl GST for internationals)
TOTAL
Be sure to select international postage above if you are an overseas customer
Item Quantity Line Total Price (incl GST)
International $45 (excl GST) Postage Domestic $8 (1-2 items) $10 (3-5 items) $12 (5+ items) Express $13
o f f i c e
U S E
o n l y
FULL NAME JOB TITLE
ORGANISATION STREET ADDRESS
CITY STATE POSTCODE COUNTRY
PHONE EMAIL
CARD NUMBER NAME ON CARD
CARDHOLDER SIGNATURE DATE EXPIRY SECURITY CODE
We accept payment by credit card cheque or money order (made payable to NSW Department of Trade amp Investment) Payment
Return
Did you know Selected products can be purchased from the NSW Government Online Shop wwwshopnswgovau
Information and Customer Service Centre NSW Department of Trade amp Investment PO Box 344 Hunter Region Mail Centre NSW 2310
mineralpublicationordersindustrynswgovau
+61 2 4931 6700 Enquiries +61 2 4931 6666
wwwresourcesnswgovau
NSW Trade amp Investment Division of Resources amp Energy 516 High Street Maitland NSW 2320 PO Box 344 Hunter Region Mail Centre NSW 2310 T1300 736 122 T (02) 49316666
wwwresourcesnswgovau
Second edition Bathurst metallogenic 1250 000 map
Replacing the popular 1972 edition the updated map shows 311 metallic industrial construction material and fuel deposits classified by size commodity and deposit type A deposit classification scheme is included along with a timendashspace plot showing major mineralising events
On the back of the map is a comprehensive poster summarising the mining history and geological history of the area It features many colourful and historic images a locality map and a mining timeline
Cost $1980
- _GoBack
- 141726f49c7572d0__MailEndCompose
-
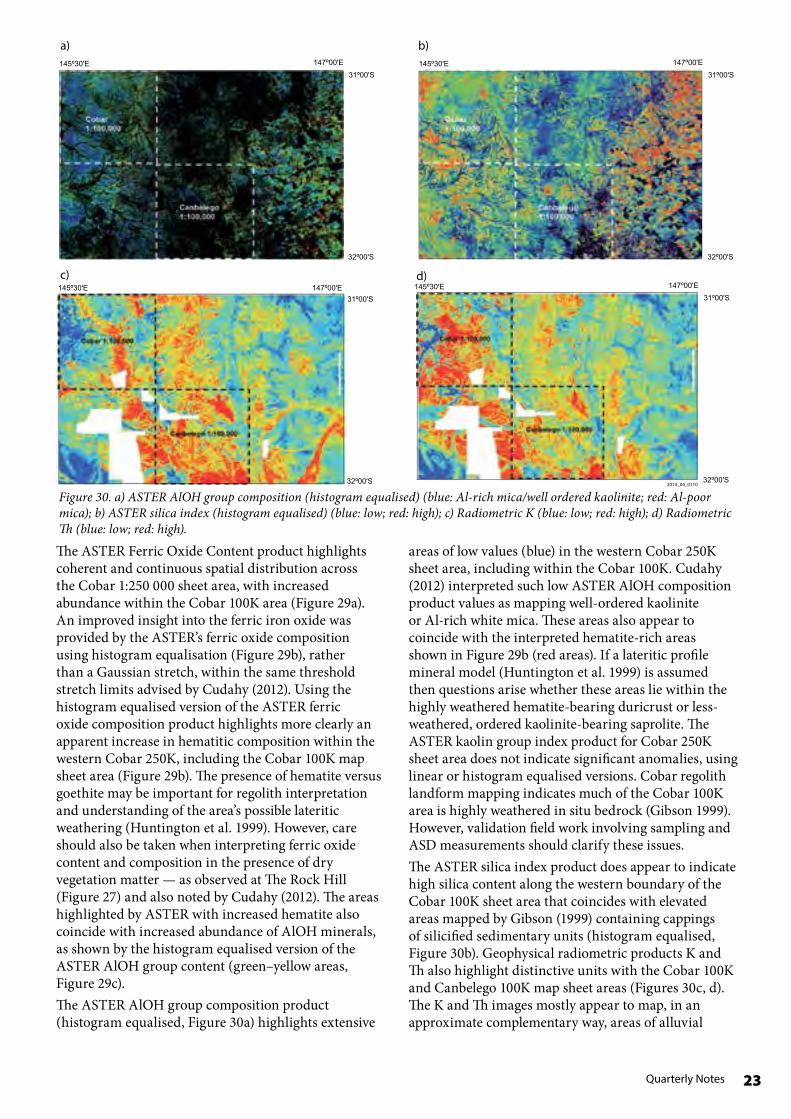
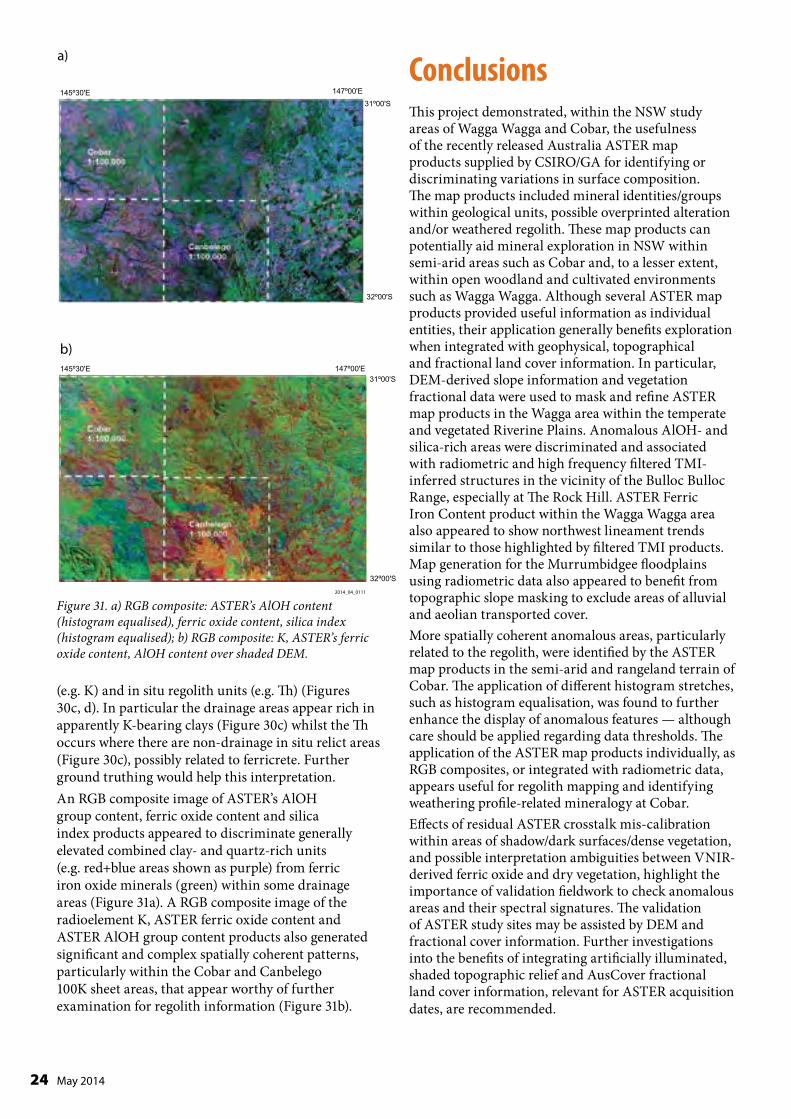
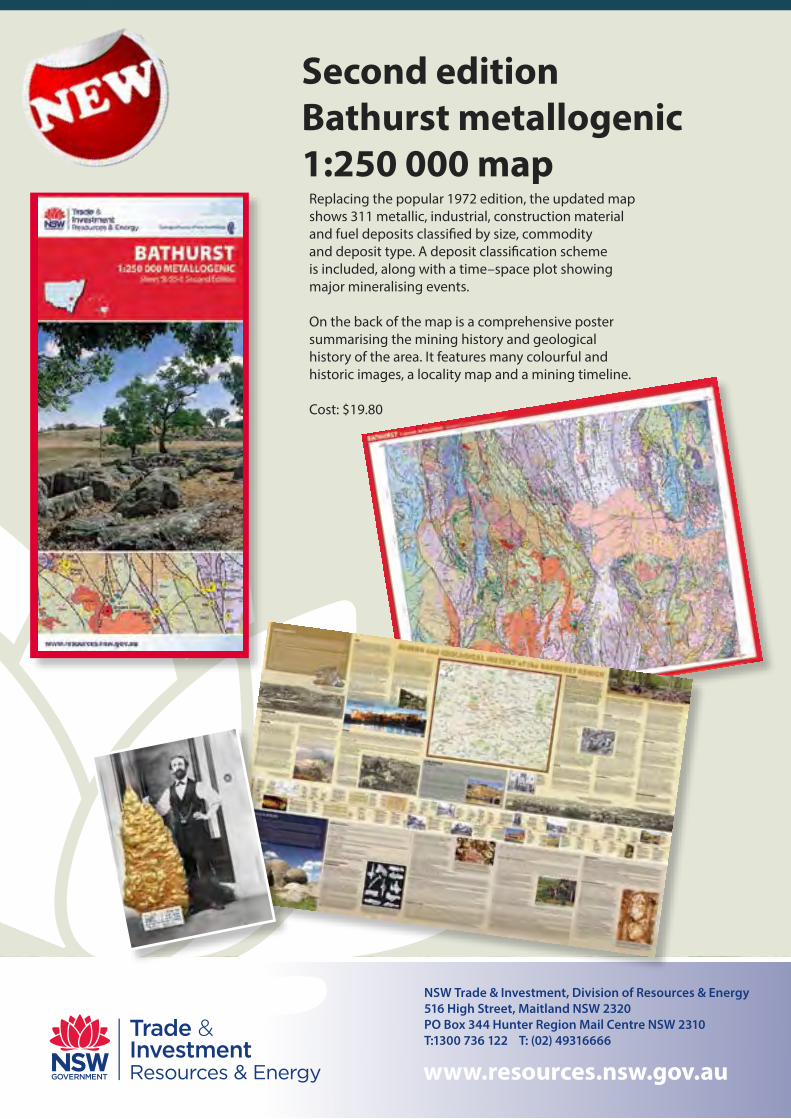