using a standard penning gauge as a powerful means of ... · pdf fileusing a standard penning...
TRANSCRIPT

Victor Bellido-González,
Sarah Powell,
Benoit Daniel,
John Counsell,
Dermot Monaghan
Gencoa - Dermot Monaghan
Using a standard Penning Gauge as a powerful means of
monitoring and feedback control

Structure of the presentation
• Plasma Spectroscopy• In-situ & Ex-situ Monitoring
• Feedback Control
• Penning Gauge and PEM
• Examples of spectra and uses• Examples of plasma instabilities / drifts
• Feedback modes from Penning Gauge
• Conclusions

Plasma or Optical Emission Monitoring (PEM)
Optic fibre
monitoring

Optical Emission Spectroscopy - The Plasma Spectrum
Magnetron Sputtering Ti/Ar
0
500
1000
1500
350 450 550 650 750 850
Wavelength, nm
Pla
sma
em
issi
on
, a
.u.
Process Control by Optical Emission Spectroscopy
450 550 650
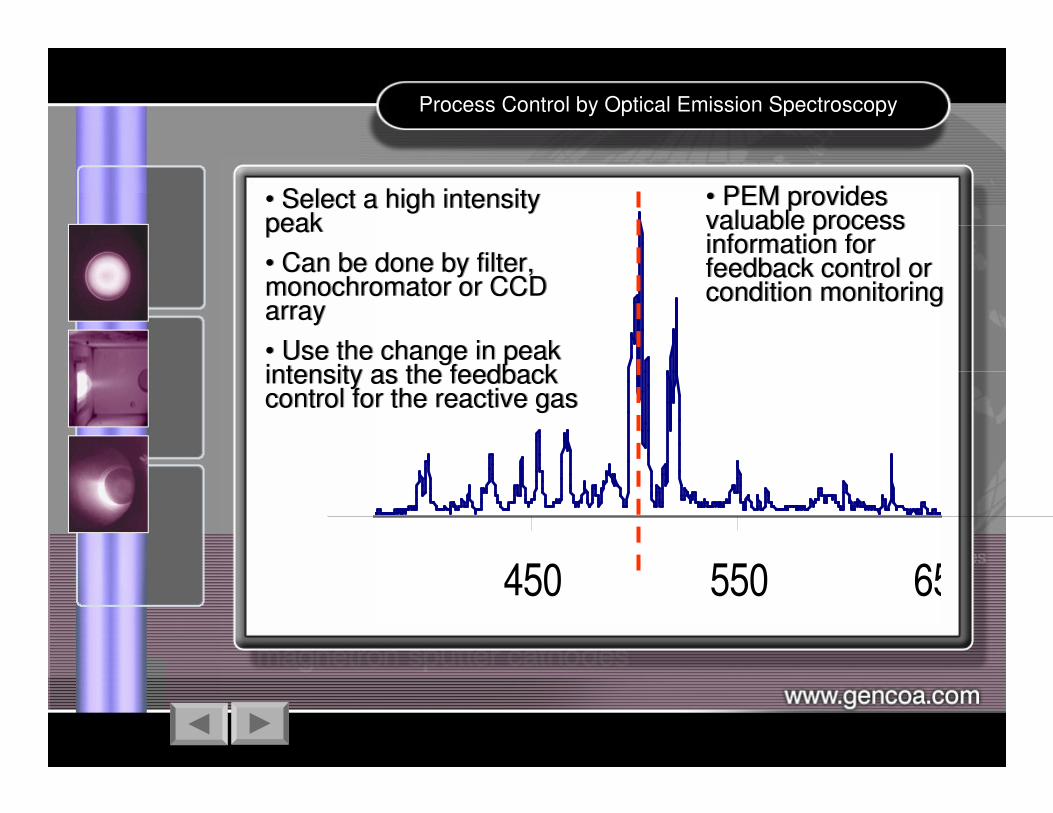
• Select a high intensity peak
• Can be done by filter, monochromator or CCD array
• Use the change in peak intensity as the feedback control for the reactive gas
• Select a high intensity peak
• Can be done by filter, monochromator or CCD array
• Use the change in peak intensity as the feedback control for the reactive gas
• PEM provides valuable process information for feedback control or condition monitoring
• PEM provides valuable process information for feedback control or condition monitoring

Reactive gas input alters intensity due to target poisoning
500 550

PEM picks up the changes in the plasma environment
PACVD - DLC deposition
0
1000
2000
3000
4000
325 375 425
Wavelength, nm
Pla
sma
Em
issi
on
, a
.u.
IPA-01
IPA-03
IPA-04
IPA-06
DIRECT mode:
More REACTIVE GAS ≡ More signale.g. DLC- PACVD process

Control of the reactive gas input in a INVERSE mode
Magnetron Sputtering - TiOx deposition
0
200
400
600
800
1000
1200
400 450 500 550 600
Wavelength, nm
Pla
sma
Em
issi
on
, a
.u.
O2= 0
O2= 14
O2= 18
O2= 22
INVERSE mode:
More REACTIVE GAS ≡ Less signale.g. Ti sputtering (Ar + O2)

In-situ plasma monitoring - conventional

Examples of Reactive Sputtering
Reactive gas input
Exhaust
Substrate
Target
Control
Part. Press.
Transp.,σ,nVoltage, Freq.Plasma emmission

Ideal Controller Handles ALL I/O’s
Inputs
• PEM
•Metal line / multiple
lines
• Gas line
• Argon line
• Plasma spectrum
• Target voltage
• Gas partial pressure
Inputs
• PEM
•Metal line / multiple
lines
• Gas line
• Argon line
• Plasma spectrum
• Target voltage
• Gas partial pressure
Outputs (Actuator)
• Reactive Gas Flow
• Target Voltage
• Target Power Output
• Gas partial pressure (Ar /
throttle valve)
Outputs (Actuator)
• Reactive Gas Flow
• Target Voltage
• Target Power Output
• Gas partial pressure (Ar /
throttle valve)
Controller
• Why is Multi-function important?
• Some processes are hard to control and drifts / fluctuations can
occur
• Why is Multi-function important?
• Some processes are hard to control and drifts / fluctuations can
occur
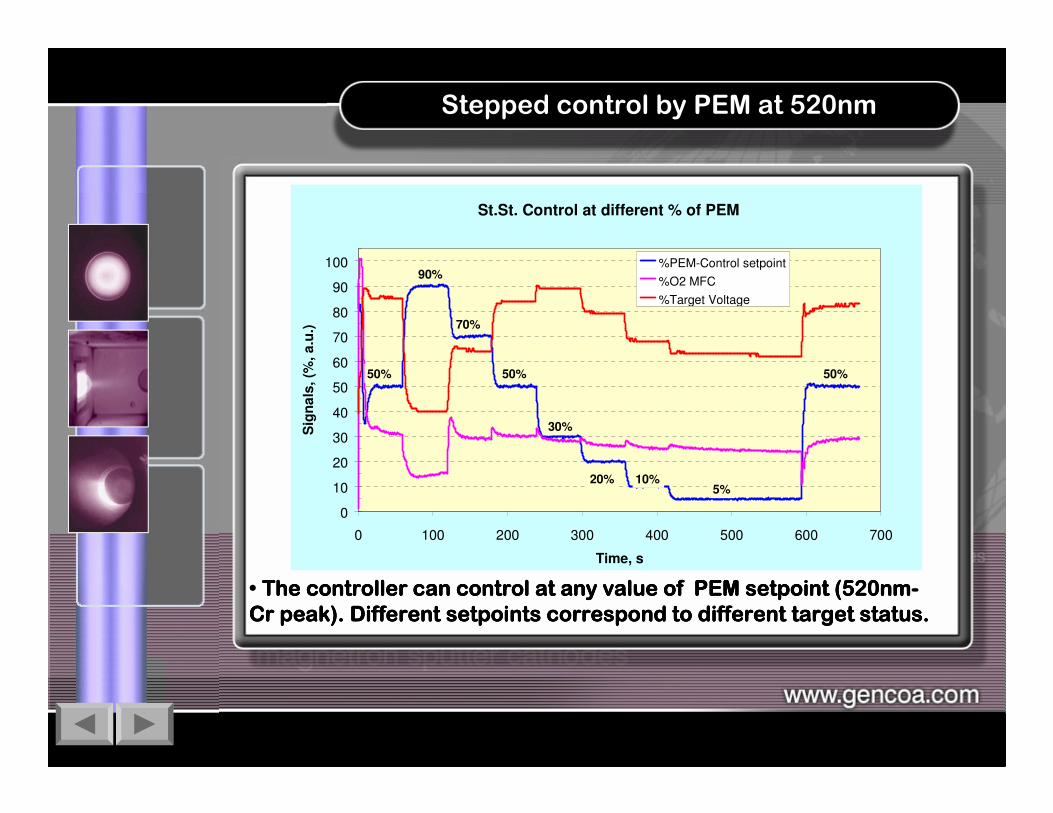
Stepped control by PEM at 520nm
St.St. Control at different % of PEM
0
10
20
30
40
50
60
70
80
90
100
0 100 200 300 400 500 600 700
Time, s
Sig
na
ls, (%
, a
.u.)
%PEM-Control setpoint
%O2 MFC
%Target Voltage
50%
90%
70%
50%
30%
20% 10%5%
50%
• The controller can control at any value of PEM The controller can control at any value of PEM The controller can control at any value of PEM The controller can control at any value of PEM setpointsetpointsetpointsetpoint (520nm(520nm(520nm(520nm----
Cr peak). Different Cr peak). Different Cr peak). Different Cr peak). Different setpointssetpointssetpointssetpoints correspond to different target status.correspond to different target status.correspond to different target status.correspond to different target status.

Ex-situ monitoring – inside a Penning Gauge
• A plasma is generated inside a Penning type pressure gauge.
• The ionisation in the gas creates a current between the anode and cathode which represents the pressure.
• The information from the plasma spectrum can be extracted.
• A plasma is generated inside a Penning type pressure gauge.
• The ionisation in the gas creates a current between the anode and cathode which represents the pressure.
• The information from the plasma spectrum can be extracted.

Pro / Cons of In/Ex situ PEM
In-Situ Pro’s
• High intensity plasma signal
• Represents the process
environment – displays all
species
• Faster response from process
• Allows local zone control
• Measures all species
In-Situ Con’s
• Subject to drifts and
disturbances as process
environment changes
• Requires a process plasma
In-Situ Pro’s
• High intensity plasma signal
• Represents the process
environment – displays all
species
• Faster response from process
• Allows local zone control
• Measures all species
In-Situ Con’s
• Subject to drifts and
disturbances as process
environment changes
• Requires a process plasma
Ex-Situ Pro’s
• Less subject to drifts and
substrate disturbances
• Process can be off – remote
plasma generation
• Measures the excess gas
• Optics don’t coat or heat-up
and are outside the vacuum
Ex-Situ Con’s
• Plasma intensity lower
• Reaction time slower
• Generally no local zone control
• Only for gases

What other things can PEM Achieve?
• Diagnose the system condition
• Predict a suitable process start condition
• Eliminate long term drift – condition monitoring • Rate measurement
• Intelligent plasma pre-treatment
• Improve uniformity of deposition or pre-treatment
– zone control• Leak detection
• Preventative maintenance

-200
0
200
400
600
800
1000
1200
200 300 400 500 600 700 800
Wavelength (nm)
Inte
ns
ity
Measured Intensity - plasma and gauge on
Measured Intensity - dark - process plasma off - gauge on -Hydrogen peak from moisture
Full optical spectrum from penning gauge

50% O2 8.5E-04 Torr
0
100
200
300
400
500
600
700
800
0 100 200 300 400 500 600 700 800 900 1000
Wavelength (nm)
Ine
ns
ity
O2 peak
Full optical spectrum from penning gauge with O2 in chamber
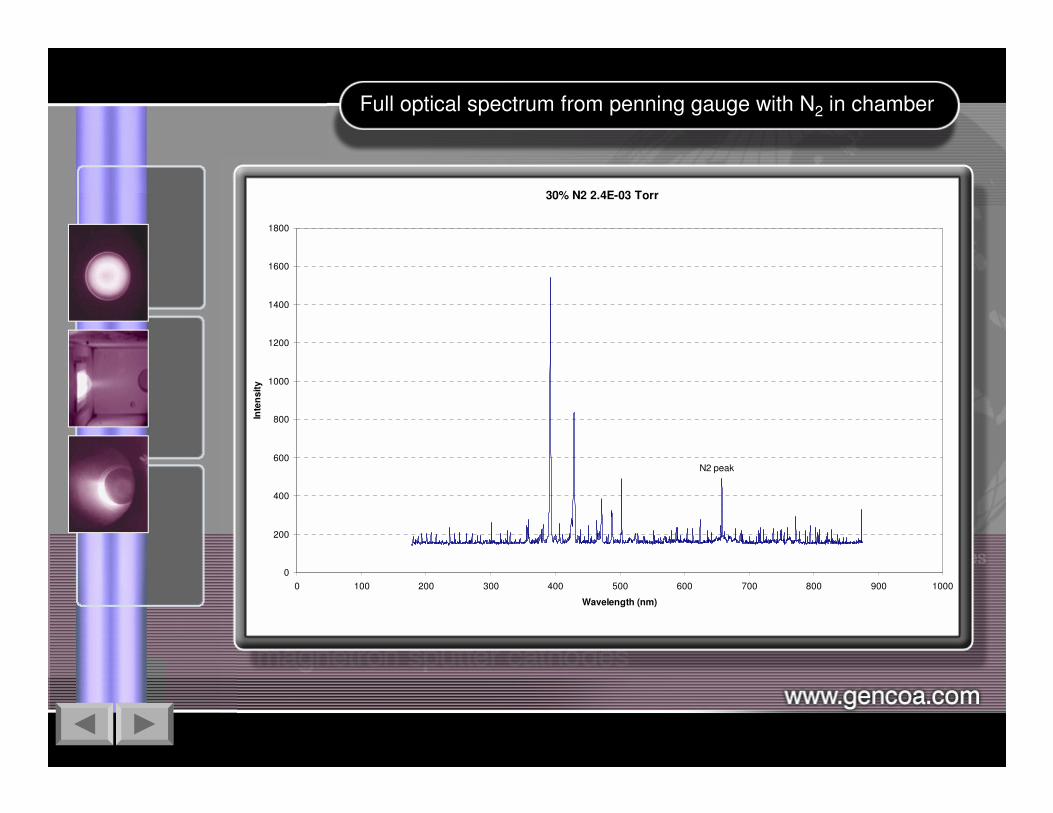
30% N2 2.4E-03 Torr
0
200
400
600
800
1000
1200
1400
1600
1800
0 100 200 300 400 500 600 700 800 900 1000
Wavelength (nm)
Inte
ns
ity
N2 peak
Full optical spectrum from penning gauge with N2 in chamber

Examples of water monitoring

TiOx Penning gauge sensor control using Gencoa Speedflo
0
0.5
1
1.5
2
2.5
3
3.5
4
4.5
0 50 100 150 200 250 300
Time (s)
Ga
s f
ee
db
ac
k (
sc
cm
)
0
0.2
0.4
0.6
0.8
1
1.2
1.4
1.6
1.8
Ta
rge
t / S
en
so
r (v
)
Gas Feedback (SCCM)
Target voltage (V)
Sensor (V)
Set point (V)
Variable setpoint feedback control from O2 signal in Gauge

Penning gauge sensor control for TiN
-10
0
10
20
30
40
50
60
70
80
90
0 50 100 150 200 250 300 350 400 450
Time (s)
Ga
s fe
ed
ba
ck
(s
cc
m)
0
0.5
1
1.5
2
2.5
3
3.5
Ta
rge
t / S
en
so
r (V
)
Gas Feedback (SCCM)
Sensor (V)
Set point (V)
Target Voltage (V)
Variable setpoint feedback control from N2 signal in Gauge

TiN penning sensor with Speedflo feedback control - substrate rotation on/off
0
2
4
6
8
10
12
14
0 50 100 150 200 250
Time, s
MF
C, T
i (5
00
nm
) a
nd
Ta
rge
t V
sig
na
ls
0
0.05
0.1
0.15
0.2
0.25
0.3
0.35
0.4
0.45
Se
tpo
int
an
d C
on
tro
l s
ign
als
Ch2 Ti 500 nm fromprocess chamber -monitor only notcontrol
Ch4 Target V signal -monitoring only oftarget voltage assubstrate movementvaries
MFC1 - change inreactive gas inputfrom Speedflo tomaintain control
Ch1 Penning N2670nm as feedbackcontrol signal
setpoint Ch1 - theintensity / gas signalto control around
Rotation on
Rotation off
Intensity in Gauge - Setpoint
& Control not disturbed
samples moved
closer to plasma
samples moved
away from plasma
In chamber plasma disturbance as a result of substrate movement & position
MFC1
Ch4
Ch2
Ch1
Setpoint
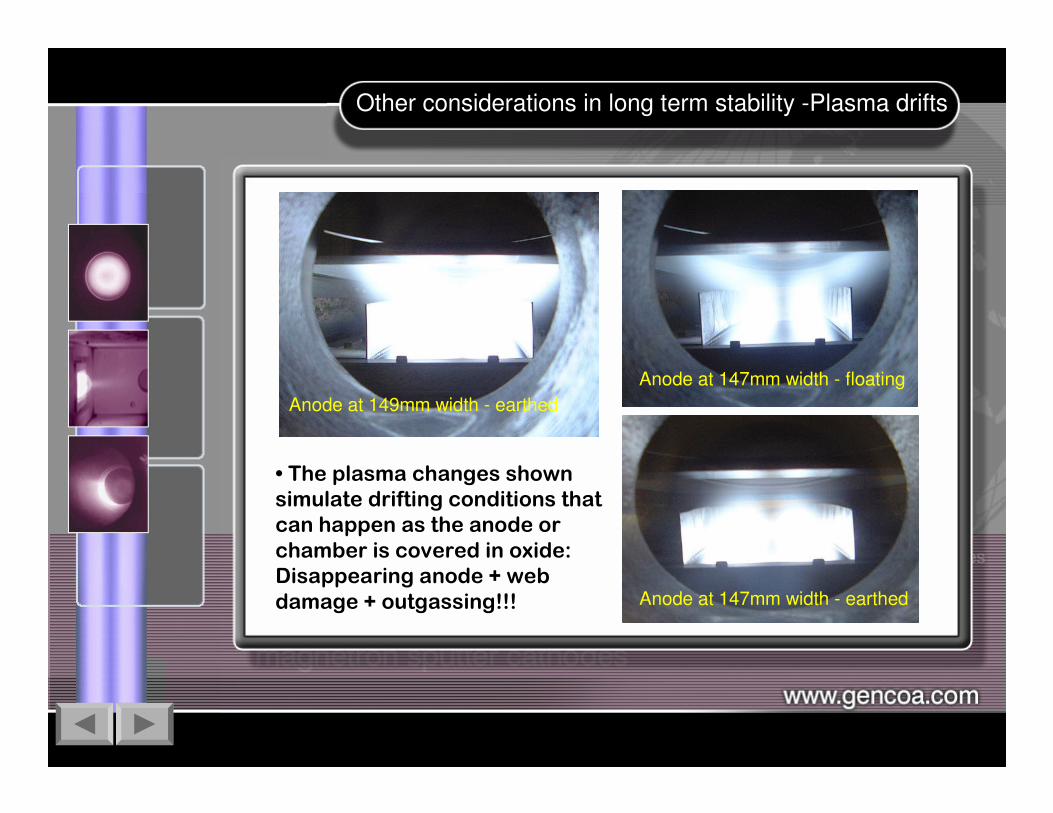
Other considerations in long term stability -Plasma drifts
Anode at 149mm width - earthed
Anode at 147mm width - floating
Anode at 147mm width - earthed
• The plasma changes shown
simulate drifting conditions that
can happen as the anode or
chamber is covered in oxide:
Disappearing anode + web
damage + outgassing!!!
Monitoring - increased productivity
• Things can change with time on a short and / or long
term basis and in different ways and for different reasons depending upon the material system and operating parameters. Monitoring can help.
• A summary of possible advantages:
• Increase rates with feedback control
• Detect faults by monitoring – water, leaks, outgassing
• Set plasma pre-treatment parameters to the environment
• Predict drift into unsuitable process regimes
• Optimise uniformity of deposition of plasma treatment
• Predicting maintenance intervals

Where to monitor – In/Ex-Situ?
• Both have their advantages and disadvantages and the optimum solution is probably to combine both.
• In-Situ is better for zonal control (large area) and where drifts and
local plasma disturbances are less likely to occur.
• Ex-Situ in principle is better for reactive gas control as it measures
the excess. Also can sense the chamber environment before any
process has begun.
• There are now a very powerful array of sensors that can be fed into
a controller and combined to optimise short and long-term
performance.
• This intelligent monitoring can then be use to control any number of
outputs simultaneously – MFC (gas or argon), source power (thermal
or sputtering), pumping.

The controller needs to very flexible
• To be able to provide the required short term and
long term control the use of multiple inputs and outputs are highly desirable.
• The software then needs to be able to easily combine the
configurations of the different inputs and outputs and allow the most
appropriate combination to be used.
• In addition the integration of the input signal to ‘smooth’ out
some short-term process shifts should be possible

Conclusions
• Process monitoring and feedback control can improve
process yields and reduce product variations.
• Plasma emission monitoring provides an excellent tool
to diagnose the process environment.
• By choosing or combining In-situ with Ex-situ
monitoring a more robust solution is possible.
• Process monitoring and feedback control can improve
process yields and reduce product variations.
• Plasma emission monitoring provides an excellent tool
to diagnose the process environment.
• By choosing or combining In-situ with Ex-situ
monitoring a more robust solution is possible.