uses of alkaline phosphatase activity in evaluating phytoplankton community phosphorus deficiency
TRANSCRIPT

Hydrobiologia 361: 145–156, 1998. 145c 1998Kluwer Academic Publishers. Printed in Belgium.
Uses of alkaline phosphatase activity in evaluating phytoplanktoncommunity phosphorus deficiency
Charles Rose1 & Richard P. AxlerNatural Resources Research Institute, University of Minnesota-Duluth, Duluth, MN 55811, U.S.A.1 Present address: Department of Environmental and Technological Studies, St. Cloud State University, St. Cloud,MN 56301, U.S.A.
Received 16 September 1997; in revised form 6 November 1997; accepted 6 November 1997
Key words:Alkaline phosphatase activity, growth bioassays, Lake Superior, phosphorus deficiency, phytoplankton
Abstract
The phosphorus (P) deficiency status of phytoplankton communities was measured using the physiological indicator,alkaline phosphatase activity (APA) and nutrient-addition growth bioassays in field sampled from four northeasternMinnesota lakes and the far western arm of Lake Superior. Phosphorus additions generally reduced APA, whileother treatments increased activity. Samples receiving nitrogen (N) and P increased APA after a long lag period.P-addition bioassays of Lake Superior were consistent with phytoplankton P limitation and variations in APAindicated potential seasonal and spatial changes in P deficiency status. The results suggest that APA reliablyreflected the phytoplankton P status, but may not provide sufficient information when N or NP limitation is present.
Introduction
The phosphatase group of enzymes hydrolyze esterbonds between phosphates and dissolved organic mole-cules, making phosphates available for cellular assimi-lation. Phytoplankton-associated alkaline phosphataseactivity (APA) has been used as an indicator of phos-phorus (P) deficiency because it is synthesized at lowlevels of P availability (Pettersson, 1980), repressedwhen P becomes available (Perry, 1972; Elser & Kim-mell, 1986) and has been shown to be inversely relatedto extracellular and intracellular P concentrations (seeJansson et al., 1988 for summary). However, it is dif-ficult to distinguish among phosphatases produced byother organisms such as zooplankton (Jansson, 1976;Boavida & Heath, 1984) or bacterioplankton (Cembel-la et al., 1984; Jansson et al., 1988), and there may alsobe a background level of constitutive enzymes. Anoth-er limitation of its use as an indicator of P-deficiency isthat substrate availability is likely to limit the reaction’srate in nature, not the enzyme concentration.
Despite these concerns, APA has been shown to berelated to algal P limitation in natural systems (Fitzger-ald & Nelson, 1966; Berman, 1970; Healey & Hendzel,
1979, 1980; Smith & Kalff, 1981; Vincent, 1981; Gage& Gorham, 1985; St. Amand et al., 1989; Istvanovicset al., 1992; Vrba et al., 1995 and others). Enzymaticassays may also avoid container and incubation arti-facts associated with nutrient enrichment bioassays(Elser & Kimmel, 1986). Jansson et al. (1988) sug-gested that APA may be used as a P-deficiency indi-cator when the origins of the enzymes are addressedand when used in conjunction with other indicators.Because most APA methods use artificial substratesunder optimized conditions, and thein situ pool ofhydrolyzable organic phosphorus is difficult to deter-mine (Jansson et al., 1988), they are generally used as aP-deficiency indicator or to assess spatial and temporalchange rather than as anin situ estimate of inorganicphosphate regeneration.
This study was designed to determine if APA pat-terns were consistent with expected responses duringchanging nutrient status (due to nutrient additions) inphytoplankton growth bioassays, and how APA can beused to indicate changes in phytoplankton nutrient sta-tus in a lake with strong P limitation (Lake Superior).
gsb: PIPS Nr.: 158723 BIO2KAPhy4290.tex; 28/05/1998; 23:34; v.7; p.1

146
Figure 1. Sampling sites in northeastern Minnesota and the farwestern arm of Lake Superior.
Study area
Four northeastern Minnesota lakes were used to pro-vide lakes with differing trophic status and nutrientlimitation and to take advantage of existing state mon-itoring programs (see Figure 1). Thrush Lake is a6.62 ha oligotrophic, headwater lake. Dunnigan is a34.6 ha, mesotrophic lake and Divide is a 23.4 ha,mesotrophic headwater lake. The three lakes are locat-ed in the Superior National Forest. The fourth lake,Sand Lake, is a 49.8 ha, shallow, meso-eutrophic,seepage lake surrounded by agricultural land. Theselakes were part of the Minnesota Pollution ControlAgency’s Acid Deposition Monitoring Program. Fur-ther information regarding these lakes is contained inAxler et al. (1991a and 1994). Figure 1 also shows thatthe primary Lake Superior sampling site (LR3) usedfor APA experiments was located about 5 km east ofthe mouth of the Lester River (46� 48.30’ N, 91� 58.20
W). Other sampling stations were located along a tran-sect from the mouth of the Lester River to near thecenter of the far western arm of Lake Superior (LR1,LR2, and LR5), near the Gooseberry River mouth (GRat 47� 090 N, 91� 270 W), and near the Knife River(KR at 46� 56.40 N, 91� 31.90 W). Addition sites in thefar western arm of Lake Superior were also sampled.While phytoplankton productivity in Lake Superior hasconsistently been shown to be P-limited (Schelske etal., 1972; Plumb & Lee, 1974; Shapiro & Glass, 1975;Fahnenstiel et al., 1990), studies of the other four lakeshave shown that their phytoplankton may be nitrogen(N) limited or NP co-limited (Axler et al., 1991a and1994).
Methods
Field sampling
Representative epilimnetic samples for nutrient enrich-ment bioassays and APA measurements were collectedusing van Dorn or Niskin water samplers and compos-ited from depths of 0.1, one and two meters in a 20liter polyethylene container for the northeastern Min-nesota lakes or from one, three, and five meters andcomposited in an 8 liter polyethylene container in LakeSuperior (where epilimnion depth was greater). Theywere kept in the dark, on ice, and transported to theNatural Resources Research Institute (NRRI) labora-tories in Duluth, MN within 4–6 hours. Water sampleswere analyzed for chlorophyll-a (chla-a), soluble reac-tive phosphorus (SRP), and dissolved inorganic nitro-gen (DIN, ammonium and nitrite + nitrate) by standardmethods (APHA 1989; Owen & Axler, 1991). Limitsof detection (LOD) were calculated as approximately2� l�1 for SRP and 5�g l�1 for ammonium and nitrite+ nitrate by assuming LOD was equal to 3� the stan-dard deviation of 10 replicates having concentrationsof� 20�g SRP l�1 and 50�g N l�1 for each nitrogenspecies (Owen & Axler, 1991).
Growth bioassays
Nutrient enrichment growth bioassays on northeasternMinnesota lakes using natural phytoplankton commu-nities were performed in August and October 1990 byfilling 1 liter clear polyethylene cubitainers with lakewater and enriching them with either deionized (DI)-water (controls), 10 mg l�1 phosphorus (KH2PO4-P),100 mg l�1 nitrogen (NH4NO3-N), or both nitrogenand phosphorus (NP). Samples were prefiltered using80�m netting to remove macrozooplankton. Triplicatecubitainers of each treatment were incubated outdoorsin a 1000 l stock tank filled with water. Water tem-peratures approximated the near-surface temperatureof the sampled lakes. Approximately 85% of photo-synthetically active radiation (PAR) was transmittedthrough the cubitainer wall as measured with a Licorquantum sensor (LI192SB). APA, chl-a, and nutrientanalyses were performed on initial lake water samplesand on aliquots collected at the mid- and end-pointsof 7 to 10 day bioassays. Chl-a samples (collected byfiltering approximately 100 ml aliquots through GF/Cfilters) were measured fluorometrically after extractionin 90% acetone (Axler & Owen, 1994).
hy4290.tex; 28/05/1998; 23:34; v.7; p.2

147
For Lake Superior bioassays, 170 ml of lake waterfrom site LR3 or near Knife River was added to 250 mlPyrex Erlenmeyer flasks. Stock P or DI-water (con-trols) were added to triplicate flasks. The flask topswere covered with small plastic petri dishes. The flaskswere incubated at ambient lake temperatures in a lab-oratory incubator set for light saturation (PAR 200–250�mol m�2 sec�2) on a 14/10 hour day/night cycle.Five ml aliquots were withdrawn every second to thirdday over a period of 6–10 days forin-vivochlorophyllfluorescence using a Turner Designs model 10 fluo-rometer with appropriate emission and excitation fil-ters (APHA 1989). Fluorescence values were correctedfor non-chlorophyllous excitation by subtracting GF/Ffiltrate (< 0:7 �m) fluorescence values. This methodwas used on the Lake Superior bioassays because itwas less time and resource intensive.
Alkaline phosphatase activity
The fluorometric procedure of Perry (1972) was usedas modified by Healey & Hendzel (1979) and Deten-beck (1987, pers. comm.) on lake and growth assaysamples. Non-saturating substrate additions were usedwhich allow greater sensitivity than methods with high-er substrate additions (which have high backgroundfluorescence). Samples were analyzed as soon as car-boys arrived in the lab. APA was also measured ontreatments during some bioassays. Lake water wasamended with pH 8.5 Tris buffer with 200 mg Ca l�1
as CaCO3 (as per Healey & Hendzel, 1979) to a finalconcentration of 1 mmol l�1. Fluorometer tubes with4.5 ml of buffered sample were incubated at 55�Cin 1990 (Detenbeck, 1987) or 35�C in 1991 (Healey& Hendzel, 1979) for 5 minutes. Healey & Hendzel(1979) and Pick (1987) found that 35–40�C was theoptimum temperature for APA in a variety of lake sam-ples. This change in the method between years wouldonly affect comparisons between 1990 and 1991 LakeSuperior measurements. Next, 0.5 ml of 1.0 mM 3-O-methylfluorescein phosphate (MFP) in the pH 8.5buffer was added to the 4.5 ml sample. The rate atwhich non-fluorescent MFP was cleaved into fluores-cent methylfluoroscein (MF) and orthophosphate wasmeasured for two minutes at 15 second intervals ona Sequoia-Turner 450 fluorometer with quartz halo-gen lamp, NB440 primary filter, and SC515 secondaryfilter. The fluorescence values were compared to a cal-ibration curve of MF standards prepared for each sam-pling from a stock solution stored at< 0 �C. Qualityassurance procedures (Owen & Axler, 1991) were used
to monitor calibration curve parameters such as regres-sion slope and intercept. The coefficient of variation(r2) for calibration curves exceeded 0.9999.
MFP cleavage rates from unfiltered samples rep-resented total APA, rates from 0.45�m Millipore fil-tered samples represented soluble APA. Differencesbetween the two values were reported as particulateAPA. For lake water samples, triplicate unfilteredand duplicate filtered sub-samples were used to deter-mine analytical precision. During bioassays, duplicateunfiltered and single filtered samples from compos-ite samples of each treatment were used to determineanalytic precision. Background MFP breakdown andpossible bacterial contamination were measured withautoclave-sterilized blanks and sample water with 1 MNaOH/0.2 M EDTA (Detenbeck, 1987). Based onalgal cultures and natural phytoplankton populations,Healey & Hendzel (1979) suggested that particulateAPA of < 3:0 nmol mg chl-a�1 h�1 indicated noP deficiency; 3.0–5.0 nmol mg chl-a�1 h�1 slight Pdeficiency; and> 5:0 nmol mg chl-a�1 h�1 severe Pdeficiency.
Lake Superior samples were size-fractionated forAPA in 1991 by measuring activity levels of filtratepassing through 20, 2.0, 0.45 and 0.2�m filters withlow pressure using 60 ml hand-held syringes. Thoughsize fractionation may not always separate bacterio-plankton and phytoplankton, Cotner & Wetzel (1991)reported that a mean of 94% of chl-a was retained on1�m pore size filters, while a mean of 95% of bacteriapassed through those filters.
Differences among treatment means for chl-a,nutrients, and APA measurements at each time andcomparisons within treatments at different times wereevaluated by Student’st test (Steel & Torrie, 1980).Unless otherwise noted, statistical significanceashould be assumed to bep < 0:05.
Results
Northeastern Minnesota lakes
APA and chl-a measurements were made on samplesfrom each northeastern Minnesota lake in August 1990during the growth bioassays (see Figure 2). For ThrushLake, only the NP treatment values were significant-ly higher than control values. APA increased in thecontrol and N treatments; APA also increased in theNP treatment, although not until after day 4 whenadded P was depleted from the water. APA in the P
hy4290.tex; 28/05/1998; 23:34; v.7; p.3

148
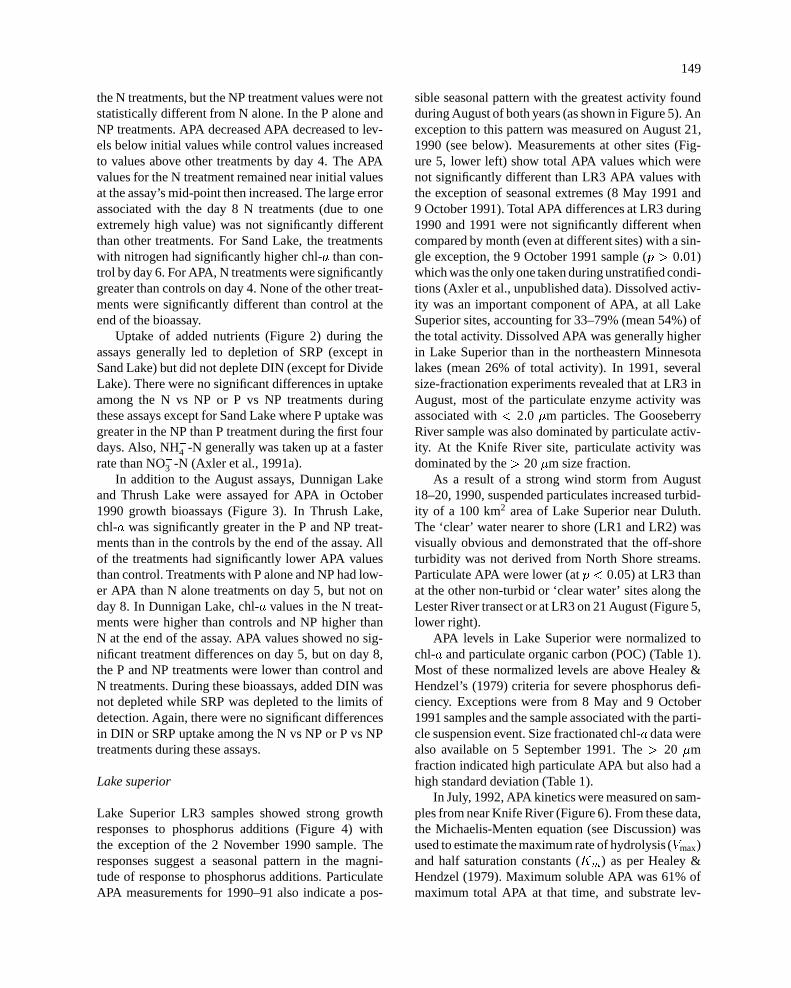
Figure 2. Variations in chl-a (left), particulate APA (center), and SRP and DIN (right) during growth bioassays of northeastern Minnesota lakesduring August, 1990. Different letters indicate differences in means atp < 0:05. Error bars are one standard deviation.
treatment was lower than other treatments on day 8.Each treatment was significantly different from othertreatments and the control. In Dunnigan Lake, phyto-plankton growth showed significant stimulation fromN and significantly greater stimulation from NP. Ourdefinition of co-limitation includes responses where Nand P together are needed for significant algal growth
and when NP stimulates growth significantly more thanN or P alone–even when N or P alone is stimulatory(Axler et al., 1994). The Dunnigan Lake bioassay’sAPA levels decreased in the NP treatments, but notin the P or N treatments. APA in controls increasedsignificantly between day 4 and day 8. In the DivideLake bioassay, chl-a content was higher than control in
hy4290.tex; 28/05/1998; 23:34; v.7; p.4
149
the N treatments, but the NP treatment values were notstatistically different from N alone. In the P alone andNP treatments. APA decreased APA decreased to lev-els below initial values while control values increasedto values above other treatments by day 4. The APAvalues for the N treatment remained near initial valuesat the assay’s mid-point then increased. The large errorassociated with the day 8 N treatments (due to oneextremely high value) was not significantly differentthan other treatments. For Sand Lake, the treatmentswith nitrogen had significantly higher chl-a than con-trol by day 6. For APA, N treatments were significantlygreater than controls on day 4. None of the other treat-ments were significantly different than control at theend of the bioassay.
Uptake of added nutrients (Figure 2) during theassays generally led to depletion of SRP (except inSand Lake) but did not deplete DIN (except for DivideLake). There were no significant differences in uptakeamong the N vs NP or P vs NP treatments duringthese assays except for Sand Lake where P uptake wasgreater in the NP than P treatment during the first fourdays. Also, NH+4 -N generally was taken up at a fasterrate than NO�3 -N (Axler et al., 1991a).
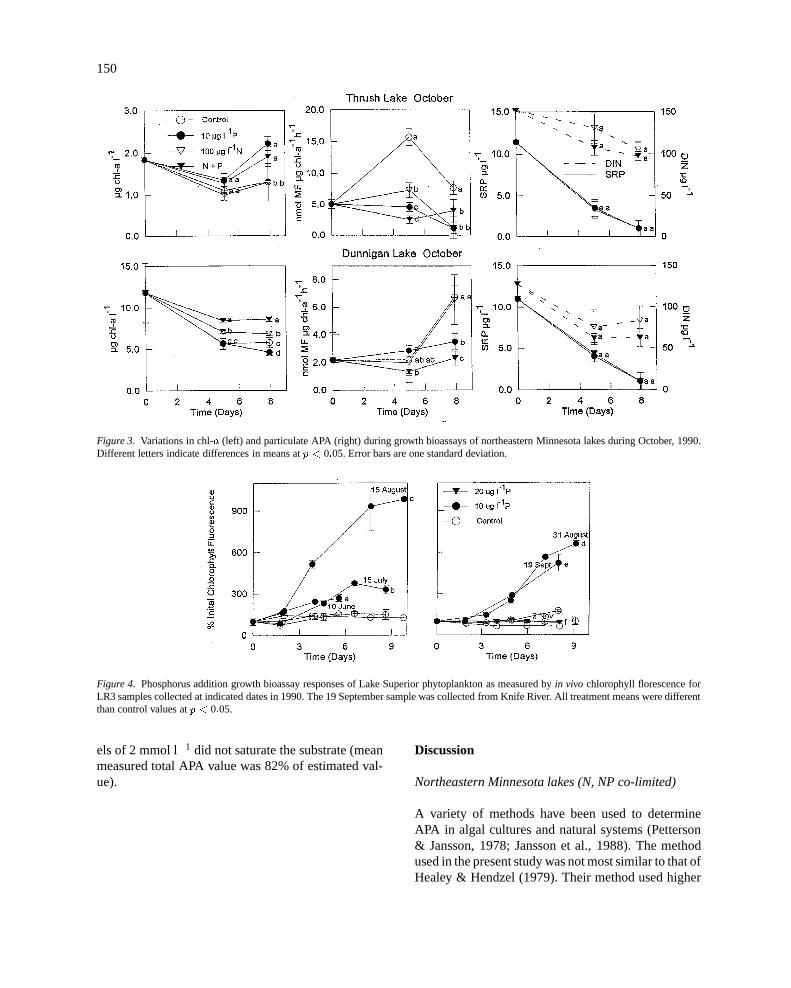
In addition to the August assays, Dunnigan Lakeand Thrush Lake were assayed for APA in October1990 growth bioassays (Figure 3). In Thrush Lake,chl-a was significantly greater in the P and NP treat-ments than in the controls by the end of the assay. Allof the treatments had significantly lower APA valuesthan control. Treatments with P alone and NP had low-er APA than N alone treatments on day 5, but not onday 8. In Dunnigan Lake, chl-a values in the N treat-ments were higher than controls and NP higher thanN at the end of the assay. APA values showed no sig-nificant treatment differences on day 5, but on day 8,the P and NP treatments were lower than control andN treatments. During these bioassays, added DIN wasnot depleted while SRP was depleted to the limits ofdetection. Again, there were no significant differencesin DIN or SRP uptake among the N vs NP or P vs NPtreatments during these assays.
Lake superior
Lake Superior LR3 samples showed strong growthresponses to phosphorus additions (Figure 4) withthe exception of the 2 November 1990 sample. Theresponses suggest a seasonal pattern in the magni-tude of response to phosphorus additions. ParticulateAPA measurements for 1990–91 also indicate a pos-
sible seasonal pattern with the greatest activity foundduring August of both years (as shown in Figure 5). Anexception to this pattern was measured on August 21,1990 (see below). Measurements at other sites (Fig-ure 5, lower left) show total APA values which werenot significantly different than LR3 APA values withthe exception of seasonal extremes (8 May 1991 and9 October 1991). Total APA differences at LR3 during1990 and 1991 were not significantly different whencompared by month (even at different sites) with a sin-gle exception, the 9 October 1991 sample (p > 0:01)which was the only one taken during unstratified condi-tions (Axler et al., unpublished data). Dissolved activ-ity was an important component of APA, at all LakeSuperior sites, accounting for 33–79% (mean 54%) ofthe total activity. Dissolved APA was generally higherin Lake Superior than in the northeastern Minnesotalakes (mean 26% of total activity). In 1991, severalsize-fractionation experiments revealed that at LR3 inAugust, most of the particulate enzyme activity wasassociated with< 2:0 �m particles. The GooseberryRiver sample was also dominated by particulate activ-ity. At the Knife River site, particulate activity wasdominated by the> 20�m size fraction.
As a result of a strong wind storm from August18–20, 1990, suspended particulates increased turbid-ity of a 100 km2 area of Lake Superior near Duluth.The ‘clear’ water nearer to shore (LR1 and LR2) wasvisually obvious and demonstrated that the off-shoreturbidity was not derived from North Shore streams.Particulate APA were lower (atp < 0:05) at LR3 thanat the other non-turbid or ‘clear water’ sites along theLester River transect or at LR3 on 21 August (Figure 5,lower right).
APA levels in Lake Superior were normalized tochl-a and particulate organic carbon (POC) (Table 1).Most of these normalized levels are above Healey &Hendzel’s (1979) criteria for severe phosphorus defi-ciency. Exceptions were from 8 May and 9 October1991 samples and the sample associated with the parti-cle suspension event. Size fractionated chl-a data werealso available on 5 September 1991. The> 20 �mfraction indicated high particulate APA but also had ahigh standard deviation (Table 1).
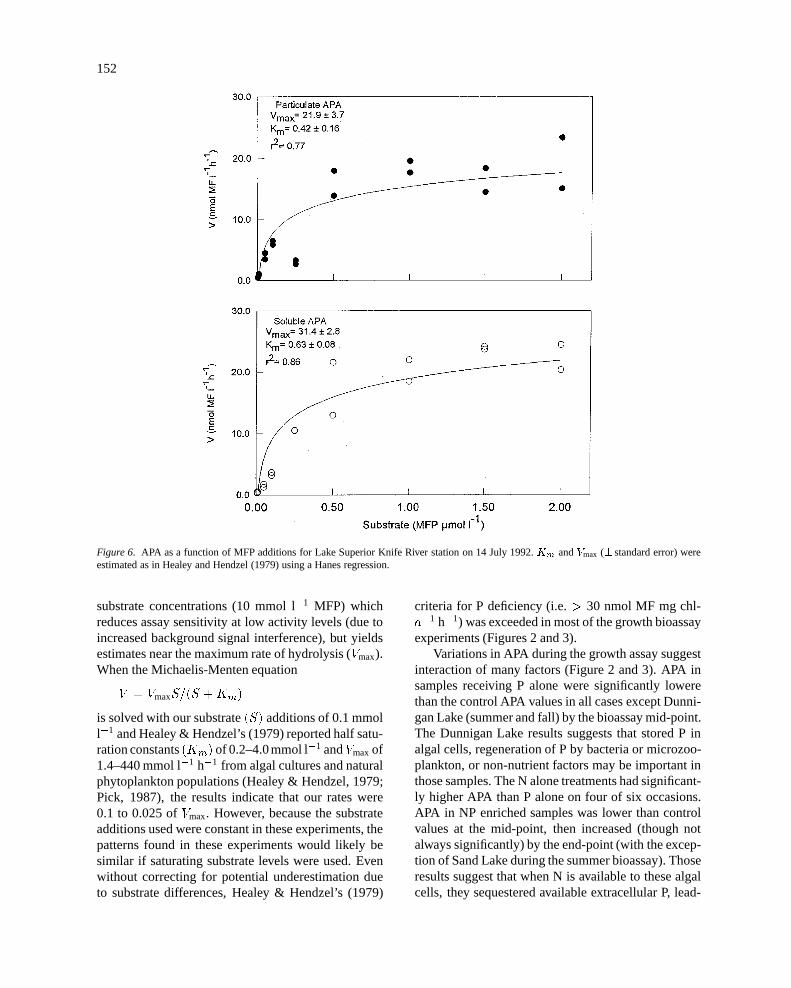
In July, 1992, APA kinetics were measured on sam-ples from near Knife River (Figure 6). From these data,the Michaelis-Menten equation (see Discussion) wasused to estimate the maximum rate of hydrolysis (Vmax)and half saturation constants (Km) as per Healey &Hendzel (1979). Maximum soluble APA was 61% ofmaximum total APA at that time, and substrate lev-
hy4290.tex; 28/05/1998; 23:34; v.7; p.5
150
Figure 3. Variations in chl-a (left) and particulate APA (right) during growth bioassays of northeastern Minnesota lakes during October, 1990.Different letters indicate differences in means atp < 0:05. Error bars are one standard deviation.
Figure 4. Phosphorus addition growth bioassay responses of Lake Superior phytoplankton as measured byin vivo chlorophyll florescence forLR3 samples collected at indicated dates in 1990. The 19 September sample was collected from Knife River. All treatment means were differentthan control values atp < 0:05.
els of 2 mmol l�1 did not saturate the substrate (meanmeasured total APA value was 82% of estimated val-ue).
Discussion
Northeastern Minnesota lakes (N, NP co-limited)
A variety of methods have been used to determineAPA in algal cultures and natural systems (Petterson& Jansson, 1978; Jansson et al., 1988). The methodused in the present study was not most similar to that ofHealey & Hendzel (1979). Their method used higher
hy4290.tex; 28/05/1998; 23:34; v.7; p.6

151
Figure 5. APA during 1990 (upper) and 1991 (middle) at Lester River site LR3; and at other Lake Superior sites (lower left): GR-GooseberryRiver sampling site, KR-Knife River sampling site. The lower right panel represents particulate APA along the Lester River sampling on 21August 1990 (after storm). Station LR-5 as a large patch of clear water at the time of sampling. Error bars are one standard deviation of the totalAPA. Different letters indicate differences in means atp < 0:05.
hy4290.tex; 28/05/1998; 23:34; v.7; p.7
152
Figure 6. APA as a function of MFP additions for Lake Superior Knife River station on 14 July 1992.Km andVmax (� standard error) wereestimated as in Healey and Hendzel (1979) using a Hanes regression.
substrate concentrations (10 mmol l�1 MFP) whichreduces assay sensitivity at low activity levels (due toincreased background signal interference), but yieldsestimates near the maximum rate of hydrolysis (Vmax).When the Michaelis-Menten equation
V = VmaxS=(S +Km)
is solved with our substrate(S) additions of 0.1 mmoll�1 and Healey & Hendzel’s (1979) reported half satu-ration constants(Km) of 0.2–4.0mmol l�1 andVmaxof1.4–440 mmol l�1 h�1 from algal cultures and naturalphytoplankton populations (Healey & Hendzel, 1979;Pick, 1987), the results indicate that our rates were0.1 to 0.025 ofVmax. However, because the substrateadditions used were constant in these experiments, thepatterns found in these experiments would likely besimilar if saturating substrate levels were used. Evenwithout correcting for potential underestimation dueto substrate differences, Healey & Hendzel’s (1979)
criteria for P deficiency (i.e.> 30 nmol MF mg chl-a�1 h�1) was exceeded in most of the growth bioassayexperiments (Figures 2 and 3).
Variations in APA during the growth assay suggestinteraction of many factors (Figure 2 and 3). APA insamples receiving P alone were significantly lowerethan the control APA values in all cases except Dunni-gan Lake (summer and fall) by the bioassay mid-point.The Dunnigan Lake results suggests that stored P inalgal cells, regeneration of P by bacteria or microzoo-plankton, or non-nutrient factors may be important inthose samples. The N alone treatments had significant-ly higher APA than P alone on four of six occasions.APA in NP enriched samples was lower than controlvalues at the mid-point, then increased (though notalways significantly) by the end-point (with the excep-tion of Sand Lake during the summer bioassay). Thoseresults suggest that when N is available to these algalcells, they sequestered available extracellular P, lead-
hy4290.tex; 28/05/1998; 23:34; v.7; p.8

153
Table 1. Particulate alkaline phosphatase activity normal-ized to chl-a and particulate organic carbon (POC). Valuesare means�one standard deviation. NA means POC was notavailable
Date Site nmol MF�g nm MF�g
chl-a�1 h�1 POC�1 h�1
6/29/90 LR3 2:1� 0:0 NA
7/17/90 LR3 8:1� 3:4 22:7� 9:4
8/15/90 LR3 7:8� 3:2 19:7� 8:0
8/21/90 LR1 (clear) 11:2� 1:7 NA
LR2 (clear) 13:9� 2:0 NA
LR3 (turbid) 4:4� 0:8 11:0� 3:5
LR5 (clear) 13:3� 1:3 57:5� 13:5
10/10/90 LR3 6:6� 2:8 14:2� 6:1
6/12/91 Gooseberry 4:3� 3:5 21:4� 17:3
7/25/91 Knife 8:2� 1:9 20:5� 5:4
8/12/91 LR3 5:8� 0:9 24:4� 3:3
9/5/91 Knife 5:9� 0:6 NA
> 20�m 78� 57 NA
2–20�m 4:0� 0:7 NA
0.2–2�m 2:2� 0:2 NA
10/9/91 LR3 0:2� 0:2 NA
Table 2. Comparison of nutrient limitation predic-tions at end of bioassays based on biomass (chl-a)and particulate APA data
Lake Month Biomass APA
prediction prediction
Thrush August NP P
Dunnigan August N and NP not P
Divide August N P
Sand August N not P
Thrush October P P
Dunnigan October N and NP P
ing to increased P demand (indicating N or NP co-limitation). Examples of this include Thrush Lake inAugust and Dunnigan Lake in October. Control treat-ments generally increased as might be expected in anenclosed container where P sources to phytoplanktonin the epilimnion of a lake (such as macrozooplanktonrecycling or atmospheric inputs) are eliminated.
APA changes in the six growth assays were gener-ally consistent with nutrient enrichment growth assayresults (as shown in Table 2). Our criteria for predictingP growth limitation from APA changes was that if APAin P and NP treatments decreased while control and Nalone treatments increased, some form of P limitation
was possible. All other results were considered to pre-dict ‘not-P’ limitation. Surprisingly, Divide Lake inAugust 1990 had initial APA values indicating severeP deficiency, but N deficiency was clearly indicatedby growth bioassay and by ammonium enhancementassay (Axler et al., 1994). P addition caused only aslight chl-a enhancement over NP, relative to N alone.
Four of six APA predictions agreed with biomass-based predictions. These results indicate that enzymeactivity is repressed by the addition of P and support theconclusion that P availability can control APA levels.Also, a comparison of initial APA levels and growthbioasay results from the northeastern Minnesota lakesduring 1990–1991 shows that using APA as a physio-logical indicator predicted P or NP limitation correctlyin 12 out of 14 outcomes (Axler et al., 1994). However,without additional information regarding the nitrogenstatus of phytoplankton communities (which was gath-ered in the 14 bioassays), important nutrient limitationinformation could be missed.
Elser & Kimmel (1986) measured APA changesof phytoplankton following P enrichment and founddecreased activity rates of the enzyme after 24 hourswhen activity was high, but no significant inhibitionwhen activity was low. APA sometimes increased intheir experiments (relative to initial values) after about4 days even in samples receiving 10 mg P l�1. Pick(1987) also found significant APA inhibition fromadded P in as little as three hours, but much longerin most other instances. These experiments demon-strate that during bioassays, the APA levels are oftenaffected by N additions as well as P.
Lake Superior (P-limited)
The APA was used as an indicatior of P-deficiency,to assess seasonal changes in phytoplankton P status,and to help assess spatial variation in phytoplankton P-metabolism due to a severe wind storm and resuspen-sion event. The seasonal pattern found using this phys-iological assay corresponded well with results frombioassays and the storm studies indicating that it isa useful tool for assessing the phosphorus limitationstatus of Lake Superior phytoplankton.
The particulate APA normalized to chl-a values(Table 1) indicated P-limitation for nearly all sam-ples (i.e.> 30 nmol MF mg chl-a�1 h�1 [Healey &Hendzel, 1979]) despite the non-saturating substratelevels used. This was consistent with growth bioas-say results and the presence of dissolved inorganic-Nat levels> 250�g l�1 throughout the growing season
hy4290.tex; 28/05/1998; 23:34; v.7; p.9

154
(Axler, unpublished data). Silicon values were also rel-atively high, about 2 mg Si l�1 with almost no seasonalor depth variation, and so P-limitation alone would bethe expected nutrient response.APA data from a stationoff the eastern end of Isle Royale for 1990–91 using sat-urating MFP concentrations suggest thatVmax may be8–10 higher than our APA measurements (Guildfordet al., 1994). The Isle Royale and LR3 stations hadsimilar POC and chl-a values. Analysis of a kineticsexperiment using water collected from the Knife Riversite in July 1992 suggested that ourVmax values couldhave been underestimated by a factor of� 5 (Figure 6).Therefore, our data indicates severe P stress.
Particulate organic matter (POM) is also used tonormalize APA for indicating P limitation. Healey& Hendzel (1979) and Petterson (1980) reported P-deficiency criteria for particulate APA of> 46 and76 nmol MF mg POC�1 h�1, respectively. Our valuesexceed either of these criteria (assuming POC� 0:43POM [Healey, 1973]) or Istvanovics’ et al. (1992)extreme P deficiency criteria of� 32 nmol mg chl-a�1 h�1 total APA if corrected for substrate limitationas described above.
Pick (1987) found that phosphate additions greaterthan observed under natural conditions in Lake Ontario(33�g P l�1) were needed to inhibit APA to 50% of itsinitial level within 18 hours. Her conclusion was thatAPA may not be a sensitive indicator of phytoplanktonP deficiency. However, the APA levels observed byPick in Lake Ontario were at levels associated with Pdeficiency and indicated spatial and temporal changesdue to water movements. We have several data setsshowing APA reductions of> 50% after 3–4 days inresponse to additions of 10�g P l�1 (Figure 2).
There are several possible reasons for lower levelsof APA associated with the turbidity caused by the windstorm (Figure 5). Turbid water reduced Secchi depth to0.6 m and mid-day light at 2 m to 8.9�mol m�2 s�1,a level shown to limit phytoplankton APA (Wynne andRhee, 1988). SRP remained below detection levels atLR3, suggesting that it should not have inhibited APA.However, total phosphorus greatly increased from� 5to 30�g l�1. Primary productivity of surface phyto-plankton increased compared to the other transect sta-tions, and these higher rates were sustained for nearlya week (Axler et al., 1991b). These results suggest thatthe phytoplankton were able to utilize some of the totalphosphorus (presumably associated with the particles)either directly, or indirectly due to APA of algae or bac-teria attached to large particles, or via P-mineralization(Engle & Sarnelle, 1990). Low light and relatively high
phosphorus utilization both may have been responsiblefor the lower APA levels at LR3 on 21 August 1990.
Several hypotheses could explain the high propor-tion of dissolved phosphatase activity in natural sys-tems. Culture studies of algal and bacterial cells haveshown that algal cells are likely to have extracellu-lar phosphatase release (see summary by Jansson etal., 1988). Cell damage (via zooplankton grazing, fil-tration, or death) may release phosphatases and zoo-plankton digestive enzymes may also be an APA source(Wynne & Gophen, 1981). Once released from the cellsurface, alkaline phosphatases have a half life of daysto weeks (Jansson et al., 1988).
The proportions of APA measured in the size frac-tion experiments are within the ranges reported in theliterature. Pick (1987) found most particulate APAin Lake Ontario associated with< 5 �m particles,though she reported one sample with 40% of APA inthe> 12�m fraction. Berman et al. (1990) measureda wide range (< 5 to� 70%) of> 20�m particulateactivity in oligotrophic Lake Kinneret, Israel. Thesedifferences may be due in part to the relative abilityof different algal taxonomic groups to produce phos-phatases (Elser et al., 1986). The chl-a normalizedAPA levels associated with the> 20�m fraction washigh in Lake Superior (Figure 5) suggesting that algalcells in this size fraction may be under greater P stressthan smaller fractions. Suttle et al. (1991) presentedevidence suggesting that algal cells> 3 �m were out-competed for P by smaller cells; the larger cells wereunder greater P stress. This may indicate the need tostudy competition between bacteria and algae in thesesystems.
Another factor that may play a role in phosphorusregeneration in our study lakes is bacterial cell-surface50-nucleotidase (5PN). The activity of this enzymeis not inhibited by orthophosphate at concentrationsfound in aquatic environments (Ammerman & Azam,1985). Cotner & Wetzel (1991) studied this enzymein Lake Michigan and in a smaller, more productivelake. Their results suggest that 5PN activity may be amore important P-pathway than APA in oligotrophic asopposed to eutrophic systems. They hypothesized thatbecause bacteria are likely to be limited by organic car-bon in oligotrophic systems, their enzymes (5PN) mayliberate orthophosphate,which would then be availableto P limited algae. In eutrophic habitats, bacteria wouldtake up a greater proportion of enzyme-liberated phos-phate. A comparison of this pathway in Lake Superior(P-limited) and Thrush Lake (which switches from Nor NP to P-limitation seasonally) may contribute sup-
hy4290.tex; 28/05/1998; 23:34; v.7; p.10
155
porting evidence for this hypothesis as well as a betterunderstanding of phosphorus pathways.
Conclusions
Our results suggest that caution should be used wheninterpreting APA data. The growth bioassay experi-ments performed for the northeastern Minnesota lakessuggest that when co-limitation or secondary N limi-tation is present, APA may indicate P deficiency with-out a corresponding growth increase from P additions.APA increases after P uptake probably indicate thatthe phosphorus was utilized rather than simply stored.Lean et al. (1989) suggested that physiological assayssuch as APA may be more useful as indicators of nutri-ents ‘not’ limited to natural populations. If this typeof interpretation is used on these results, seldom couldP be discounted as a limiting nutrient. The strengthof APA seems to be as supportive evidence in multipleassay assessments and in assessing short term temporalor spatial changes in phytoplankton nutrient status.
Acknowledgements
J. Ameel, C. Host, C. Owen, C. Radosevich, S. Ran-dall, and C. Tikkanen contributed to the laboratoryportion of this study. R. Strassman and E. Swain fromMPCA, D. Wright, M. Danks, W. Popp, and P. Eil-er from MDNR, and R. Hicks, P. Aas, D. Pasco,and D. Weaver of UMD collected many of the fieldsamples. R. Hicks also supplied POC data for LakeSuperior on 21 August 1990. E. Markham, T. Majer-le, and A. Bellamy assisted with administration orreport preparation. Anonymous reviewers helped toimprove this manuscript. Funding was contributed bythe Minnesota Pollution Control Agency, the Minneso-ta Department of Natural Resources and the GraduateSchool of the University of Minnesota. This is Contri-bution # 212 from the Center for Water and Environ-ment at the Natural Resources Research Institute.
References
Ammerman, J. W. & F. Azam, 1985. Bacterial 50-nucelotidase inaquatic ecosystems: a novel mechanism of phosphorus regenera-tion. Science 227: 338–1340.
American Public Health Association, 1989. Standard methods forthe examination of water and wastewater. 19th edn. Washington,D.C.
Axler, R. P. & C. J. Owen, 1994. Measuring chlorophyll and phaeo-phytin: whom should you believe. Lake & Reservoir Mgmt 8:143–151.
Axler, R. P., C. Rose & C. A. Tikkanen, 1994. Phytoplankton nutri-ent deficiency as related to atmospheric nitrogen deposition innorthern Minnesota acid sensitive lakes. Can. J. Fish. aquat. Sci.51: 1281–1296.
Axler, R. P., C. Rose & C. A. Tikkanen, 1991a. An assessment ofphytoplankton nutrient deficiency in Northern Minnesota acid-sensitive lakes. NRRI/TR/91/18 University of Minnesota-Duluth,Duluth, MN.
Axler, R. P., C. Larsen, C. Owen & C. Rose, 1991b. Water quality,phytoplankton biomass, and responses of algae to water quali-ty. In: Biological community of Lake Superior: The land/waterinterface. Report to the Legislative Commission on MinnesotaResources, St. Paul, MN 55115.
Berman, T., 1970. Alkaline phosphatases and phosphorus availabil-ity in Lake Kinneret. Limnol. Oceanog. 15: 663–674.
Berman, T., D. Wynne & B. Kaplan, 1990. Phosphatases revisit-ed: analysis of particle associated enzyme activities in aquaticsystems. Hydrobiologia 207: 287–294.
Boavida, M. J. & R. T. Heath, 1984. Are the phosphatases releasedby Daphnia magnacomponents of its food? Limnol. Oceanogr.29: 641–645.
Cembella, A. D., N. J. Antia & P. J. Harrison, 1984. The utilizationof inorganic and organic phosphorus compounds as nutrients byeukaryotic microalgae: a multidisciplinary perspective, part 1.Crit. Rev. Microbiol. 10: 317–391.
Cotner, J. B. & R. G. Wetzel, 1991. 50-Nucleotidase activity in aeutrophic lake and an oligotrophic lake. Appl. Envir. Microbiol.57: 1306–1312.
Detenbeck, N., 1987. Nutrient cycling and the growth of benthicalgae in experimentally acidified Little Rock Lake, WI. Ph.D.Thesis, University of Minnesota, Minneapolis, MN.
Elser, J. J. & B. L. Kimmel, 1986. Alteration of phytoplankton phos-phorus status during enrichment experiments: implications forinterpreting nutrient enrichment bioassay results. Hydrobiologia133: 217–222.
Elser, J. J., M. M. Elser & S. R. Carpenter, 1986. Size fractionation ofalgal chlorophyll, carbon fixation, and phosphatase activity: rela-tionships with species-specific size distributions and zooplanktoncommunity structure. J. Plankton Res. 8: 365–383.
Engler, D. L. & O. Sarnelle, 1990. Algal use of sedimentary phos-phorus from an Amazon floodplain lake: Implications for totalphosphorus analysis in turbid waters. Limnol. Oceanogr. 35: 483–490.
Fahnenstiel, G. L., C. L. Schelske & M. J. McCormick, 1990. Phy-toplankton photosynthesis and biomass in Lake Superior: effectsof nutrient enrichment. Verh. int. Ver. Limnol. 24: 371–377.
Fitzgerald, G. P. & T. C. Nelson, 1966. Extractive and enzymaticanalyses for limiting or surplus phosphorus in algae. J. Phycol. 2:32–37.
Gage, M. A. & E. Gorham, 1985. Alkaline phosphatase activity as anindex of phosphorus status of phytoplankton in Minnesota lakes.Freshwat. Biol. 15: 227–233.
Guilford, S. J., L. L. Hendzel, H. J. Kling, E. J. Fee, G. G. C. Robin-son, R. E. Heckey & S. E. M. Kasian, 1994. Effects of lake sizeon phytoplankton nutrient status. Can. J. Fish. aquat. Sci. 51:2769–2783.
Healey, F. P., 1973. Inorganic nutrient uptake and deficiency in algae.Crit. Rev. Microbiol. 3: 69–113.
Healey, F. P. & L. L. Hendzel, 1979. Fluorometric measurement ofalkaline phosphatase activity in algae. Freshwat. Biol. 9: 429–439.
hy4290.tex; 28/05/1998; 23:34; v.7; p.11

156
Healey, F. P. & L. L. Hendzel, 1980. Physiological indicators ofnutrient deficiency in lake phytoplankton. Can. J. Fish. aquat.Sci. 37: 442–453.
Istvanovics, V., K. Pettersson, D. Pierson & R. Bell, 1992. Evaluationof phosphorus deficiency indicators for summer phytoplankton inLake Erken. Limnol. Oceanogr. 37: 890–900.
Jansson, M., 1976. Phosphatases in lakewater. Characteristics ofenzymes from phytoplankton and zooplankton by gel filtration.Science 194: 320–321.
Jansson, M., H. Olsson & K. Petterson, 1988. Phosphatases: origins,characteristics, and function in central Sweden. Hydrobiologia101: 57–175.
Lean, D. R. S., F. R. Pick, S. F. Mitchell, M. T. Downes, P. H. Woods& E. White, 1989. Lake Okaro enclosure experiments: Testecosystems to evaluate plankton phosphorus and nitrogen defi-ciency. Arch. Hydrobiol. Beih. Ergebn. Limnol. 32: 195–211.
Owen, C. J. & R. P. Axler, 1991. Analytical chemistry and quali-ty assurance manual. NRRI/TR-91/05. University of Minnesota,Duluth, Duluth, MN.
Perry, M. J., 1972. Alkaline phosphatase activity in subtropical cen-tral north Pacific waters using a sensitive fluorometric method.Mar. Biol. 15: 113–119.
Petterson, K., 1980. Alkaline phosphatase activity and algal surplusphosphorus and phosphorus-deficiency indicators in Lake Erken.Arch. Hydrobiol. 89: 54–87.
Petterson, K. & M. Jansson, 1978. Determination of phosphataseactivity in lake water – a study of methods. Verh. int. Ver. Limnol.20: 1226–1230.
Pick, F. R., 1987. Interpretation of alkaline phosphatase activity inL. Ontario. Can. J. Fish. aquat. Sci. 44: 2087–2094.
Plumb, R. H. & G. F. Lee, 1974. Phosphate, algae, and taconitetailings in the western arm of Lake Superior. Proc. 17th Conf.Great Lakes Res.: 823–836.
Schelske, C. L., L. E. Feldt, M. A. Santiago & E. F. Stoermer, 1972.Nutrient enrichment and its effects on phytoplankton productionand species composition in Lake Superior. Proc. 15th Conf. GreatLakes Res. Int. Assoc. Great Lakes Res., pp. 149–165.
Shapiro, J. & G. Glass, 1975. Synergistic effects of phosphate andmanganese on growth of Lake Superior algae. Verh. int. Ver.Limnol. 19: 550–553.
Smith, R. E. & J. S. Kalff, 1981. The effect of phosphorus limitationon algal growth rates: evidence from alkaline phosphatase. Can.J. Fish. aquat. Sci. 38: 1421–1427.
St. Amand, A. L., P. A. Soranno, S. R. Carpenter & J. J. Elser, 1989.Algal nutrient deficiency: growth bioassays versus physiologicalindicators. Lake and Reservoir Mgmt 1: 27–35.
Steel, R. G. D. & J. H. Torrie, 1980. Principles and procedures ofstatistics: A biometric approach. 2nd edn. McGraw-Hill. NewYork, 633 pp.
Suttle, C., W. P. Cochlan & J. G. Stockner, 1991. Size-dependentammonium and phosphate uptake, and N:P supply ratios in anoligotrophic lake. Can. J. Fish. aquat. Sci. 48: 1226–1234.
Vincent, W. F., 1981. Rapid physiological assays for nutrient demandby phytoplankton. II. Phosphorus. J. Plankton Res. 3: 699–710.
Vrba, J., V. Vyhnalek, J. Hejzlar & J. Nedoma, 1995. Comparisonof phosphorus deficiency indices during a spring phytoplanktonbloom in a eutrophic reservoir. Freshwat. Biol. 33: 73–81.
Wynne, D. & M. Gophen, 1981. Phosphatase activity in freshwaterzooplankton. Oikos 37: 369–376.
Wynne, D. & G.-Y. Rhee, 1988. Changes in alkaline phos-phatase activity and phosphate uptake in P-limited phytoplank-ton, induced by light intensity and spectral quality. Hydrobiologia160: 173–178.
hy4290.tex; 28/05/1998; 23:34; v.7; p.12