user's guide · welcome screen command ... metatrader 4, amibroker); specifying strategies as...
TRANSCRIPT

Adaptrade Builder
Version 1
User's Guide
Copyright © 2010 - 2014 Adaptrade Software www.Adaptrade.com

Disclaimer
HYPOTHETICAL OR SIMULATED PERFORMANCE RESULTS HAVE CERTAIN
INHERENT LIMITATIONS. UNLIKE AN ACTUAL PERFORMANCE RECORD,
SIMULATED RESULTS DO NOT REPRESENT ACTUAL TRADING. ALSO, SINCE
THE TRADES HAVE NOT ACTUALLY BEEN EXECUTED, THE RESULTS MAY
HAVE UNDER- OR OVER-COMPENSATED FOR THE IMPACT, IF ANY, OF
CERTAIN MARKET FACTORS, SUCH AS LACK OF LIQUIDITY. SIMULATED
TRADING PROGRAMS IN GENERAL ARE ALSO SUBJECT TO THE FACT THAT
THEY ARE DESIGNED WITH THE BENEFIT OF HINDSIGHT. NO
REPRESENTATION IS BEING MADE THAT ANY ACCOUNT WILL OR IS LIKELY
TO ACHIEVE PROFITS OR LOSSES SIMILAR TO THOSE SHOWN.
EasyLanguage and TradeStation are registered trademarks of TradeStation Technologies,
Inc.
Last Revision: September 2014 (version 1.7.2.0)
Copyright © 2010 – 2014 Adaptrade Software
www.Adaptrade.com

iii
Software License Agreement
These license terms are an agreement between Adaptrade Software and you. Please read them. They apply to the software named
above, which includes the media on which you received it, if any. The terms also apply to any
updates,
supplements, including EasyLanguage code files for TradeStation, and
support services
for this software provided by Adaptrade Software, unless other terms accompany those items. If so, those terms apply.
BY CLICKING ON THE "I AGREE" BUTTON WHERE INDICATED, OR BY COPYING, INSTALLING OR OTHERWISE
USING THE SOFTWARE, YOU ACCEPT THESE TERMS. IF YOU DO NOT AGREE TO THE TERMS OF THIS
AGREEMENT, DO NOT INSTALL OR USE THE PROGRAM AND DESTROY ALL COPIES OF IT.
If you comply with these license terms, you have the rights below.
1. LICENSE MODEL. The software is licensed on a per user basis.
2. INSTALLATION AND USE RIGHTS. You may install any number of copies of the software on your devices, provided it is
for your use only. A "single user" license permits the use of the software on no more than one device at a time. A "two-user"
license permits the software to be run on two devices at the same time, and so on.
3. SCOPE OF LICENSE. The software is licensed, not sold. This agreement only gives you some rights to use the software.
Adaptrade Software reserves all other rights. Unless applicable law gives you more rights despite this limitation, you may use
the software only as expressly permitted in this agreement. You may not
reverse engineer, decompile or disassemble the software, except and only to the extent that applicable law expressly
permits, despite this limitation;
make more copies of the software than specified in this agreement or allowed by applicable law, despite this limitation;
publish the software for others to copy;
rent, lease or lend the software;
4. BACKUP COPY. You may make two backup copies of the software. You may use these copies only to reinstall the software.
5. EXPORT RESTRICTIONS. The software is subject to United States export laws and regulations. You must comply with all
domestic and international export laws and regulations that apply to the software. These laws include restrictions on
destinations, end users and end use.
6. SUPPORT SERVICES. Support services are as described on the Adaptrade Software web site, www.Adaptrade.com.
7. ENTIRE AGREEMENT. This agreement, and the terms for supplements, updates and support services that you use, are the
entire agreement for the software and support services.
8. APPLICABLE LAW.
a. United States. If you acquired the software in the United States, California state law governs the interpretation of
this agreement and applies to claims for breach of it, regardless of conflict of laws principles. The laws of the state
where you live govern all other claims, including claims under state consumer protection laws, unfair competition
laws, and in tort.
b. Outside the United States. If you acquired the software in any other country, the laws of that country apply.
9. LEGAL EFFECT. This agreement describes certain legal rights. You may have other rights under the laws of your country.
You may also have rights with respect to the party from whom you acquired the software. This agreement does not change
your rights under the laws of your country if the laws of your country do not permit it to do so.
10. DISCLAIMER OF WARRANTY. THE SOFTWARE IS LICENSED “AS-IS.” YOU BEAR THE RISK OF USING IT.
ADAPTRADE SOFTWARE GIVES NO EXPRESS WARRANTIES, GUARANTEES OR CONDITIONS. YOU MAY
HAVE ADDITIONAL CONSUMER RIGHTS UNDER YOUR LOCAL LAWS WHICH THIS AGREEMENT CANNOT
CHANGE. TO THE EXTENT PERMITTED UNDER YOUR LOCAL LAWS, ADAPTRADE SOFTWARE EXCLUDES
THE IMPLIED WARRANTIES OF MERCHANTABILITY, FITNESS FOR A PARTICULAR PURPOSE AND NON-
INFRINGEMENT.
11. LIMITATION ON AND EXCLUSION OF REMEDIES AND DAMAGES. YOU CAN RECOVER FROM ADAPTRADE
SOFTWARE ONLY DIRECT DAMAGES UP TO THE AMOUNT PAID FOR THE SOFTWARE. YOU CANNOT
RECOVER ANY OTHER DAMAGES, INCLUDING CONSEQUENTIAL, LOST PROFITS, SPECIAL, INDIRECT OR
INCIDENTAL DAMAGES.
This limitation applies to
a. anything related to the software, services, content (including code) on third party Internet sites, or third party
programs; and
b. claims for breach of contract, breach of warranty, guarantee or condition, strict liability, negligence, or other tort to
the extent permitted by applicable law.
It also applies even if Adaptrade Software knew or should have known about the possibility of the damages. The above
limitation or exclusion may not apply to you because your country may not allow the exclusion or limitation of incidental,
consequential or other damages.
iv
Table of Contents
Disclaimer ........................................................................................................................................................... ii
Software License Agreement ............................................................................................................................ iii
Table of Contents ...............................................................................................................................................iv
Introduction ......................................................................................................................................................... 1
Overview .......................................................................................................................................................... 1
Genetic Programming ...................................................................................................................................... 2 References ................................................................................................................................................... 4
Build Algorithm ................................................................................................................................................ 4
Entry and Exit Conditions ................................................................................................................................ 5
Order Types ...................................................................................................................................................... 8
Neural Networks ............................................................................................................................................. 11
Trading Strategy Structure ............................................................................................................................. 12
Example .......................................................................................................................................................... 14
Getting Started .................................................................................................................................................. 19
Installation ..................................................................................................................................................... 19
Windows and Panes ....................................................................................................................................... 21
Working with Project Files............................................................................................................................. 22
Quick Start Steps ............................................................................................................................................ 22
Input Data and Settings .................................................................................................................................... 31
Markets ........................................................................................................................................................... 31 Adding a Market ........................................................................................................................................ 31 Price File Format Window ........................................................................................................................ 32 Custom Indicators ...................................................................................................................................... 33 Remove Button .......................................................................................................................................... 35 Price File Format Button ........................................................................................................................... 35 Select New File Button .............................................................................................................................. 35 Obtaining Price Data ................................................................................................................................. 35 Market Settings .......................................................................................................................................... 36 View Button .............................................................................................................................................. 39
Evaluation Options ......................................................................................................................................... 39 Position Sizing ........................................................................................................................................... 41
Indicators and Order Types ........................................................................................................................... 43
Strategy Options ............................................................................................................................................. 43 Market Sides .............................................................................................................................................. 43 Trading Logic Options .............................................................................................................................. 43 Parameter Ranges ...................................................................................................................................... 45
Metrics ........................................................................................................................................................... 46
Build Options ................................................................................................................................................. 50 Pause/Resume ............................................................................................................................................ 50 Genetic Programming Options .................................................................................................................. 50 Reset on Out-of-Sample Performance ....................................................................................................... 52 Monte Carlo Analysis/Stress Testing ........................................................................................................ 52

v
Build Results ...................................................................................................................................................... 54
Overview ........................................................................................................................................................ 54
Output Window ............................................................................................................................................... 54
Build Results ................................................................................................................................................... 54
Performance Report Window ......................................................................................................................... 55
Build Report Window ..................................................................................................................................... 57
Strategy Code Window ................................................................................................................................... 58
Equity Curve Window ..................................................................................................................................... 59
Trade List Table ............................................................................................................................................. 59
Usage Topics ...................................................................................................................................................... 61
Overview ........................................................................................................................................................ 61
Stress Testing and Monte Carlo Analysis ....................................................................................................... 61
Out-of-Sample Performance........................................................................................................................... 64
Build Time ...................................................................................................................................................... 66
Post-Build Testing and Optimization ............................................................................................................. 67
Common Questions ........................................................................................................................................ 68
Tips and Hints ................................................................................................................................................ 72
Menu Commands .............................................................................................................................................. 74
File Menu Commands .................................................................................................................................... 74 New Project Command .............................................................................................................................. 74 Open Project Command............................................................................................................................. 74 Close Project Command ............................................................................................................................ 75 Save Project Command ............................................................................................................................. 75 Save Project As Command ........................................................................................................................ 75 Save NinjaScript Strategy to File Command ............................................................................................. 75 Save MT4 Strategy to File Command ....................................................................................................... 75 Save to MSA File Command ..................................................................................................................... 75 Print Setup Command ................................................................................................................................ 75 Properties Command ................................................................................................................................. 76 1, 2, 3, …Command .................................................................................................................................. 76 Exit Command ........................................................................................................................................... 76
Edit Menu Commands .................................................................................................................................... 76 Copy Command ......................................................................................................................................... 77 Copy Strategy Command........................................................................................................................... 77
View Menu Commands ................................................................................................................................... 77 Toolbars and Docking Windows Command .............................................................................................. 77 Toolbar ...................................................................................................................................................... 77 Status Bar Command ................................................................................................................................. 77 Status Bar .................................................................................................................................................. 78 Caption Bar Command .............................................................................................................................. 78 Welcome Screen Command ...................................................................................................................... 78 Application Look Command ..................................................................................................................... 79
Strategy menu Commands .............................................................................................................................. 79 Evaluate Command ................................................................................................................................... 79 Evaluate All Command ............................................................................................................................. 79 Build Command......................................................................................................................................... 80 Options Command ..................................................................................................................................... 80
Help Menu Commands ................................................................................................................................... 82 Help Topics Command .............................................................................................................................. 82

vi
About Builder Command........................................................................................................................... 82
Appendix: Performance Metrics ..................................................................................................................... 83
Appendix: Technical Indicators ....................................................................................................................... 90
Appendix: Code Conventions ........................................................................................................................... 95
Index ................................................................................................................................................................... 97

Chapter 1 Introduction
Overview Adaptrade Builder is a stand-alone Windows program that automatically generates trading
strategies for several popular trading platforms, including TradeStation, MultiCharts,
NinjaTrader, MetaTrader 4, and AmiBroker. Builder synthesizes unique combinations of
trading indicators, trading rules, price patterns, entry and exit order types, and other user-
selectable options and generates the corresponding strategy code. The program can generate
an almost unlimited variety of trading strategies, including breakout, trend-following, stop-
and-reverse, end-of-day, day trading, and others. Builder can also generate neural network-
based strategies in which the elements of the network are chosen automatically. All strategies
created by Builder are designed around the user's specified performance requirements and
goals and can be as simple or as complex as desired.
In effect, Builder automates the traditional, manual approach to strategy development in
which the trader selects elements of a trading strategy based on prior experience combined
with knowledge of technical indicators, entry and exit order types, and strategy design. In the
traditional method, a strategy is based on a market “hypothesis”; that is, an idea of how the
market works. A viable trading strategy is typically developed through a long trial-and-error
process involving numerous iterations, revisions, and testing until acceptable results are
achieved.
Figure 1. Main window of Adaptrade Builder.

2
Builder performs each step of this process automatically. The program generates an initial
population of trading strategies by "seeding" the population based on the user's selected
options. The initial population of strategies is then “evolved” over successive generations
using a genetic programming algorithm, guided by performance criteria selected by the user.
The program builds the strategies over the training or “in-sample” data segment and tests
each one over the test or “out-of-sample” data. Each candidate strategy is essentially a
hypothesis that is either supported or refuted by the out-of-sample testing.
The premise behind Builder is that developing a trading strategy is essentially a problem of
statistical inference. The price data can be thought of as a combination of “signal” and
“noise”. The signal is the tradable part of the data, and the noise is everything else. In this
context, the essential challenge is finding strategies that fit the signal while ignoring the
noise and avoiding over-fitting. At the same time, market data is often non-stationary: the
statistical properties change over time. A successful strategy is therefore one that fits the
stationary elements of the market signal with adequate degrees-of-freedom to avoid over-
fitting. Out-of-sample testing is used to verify each of these requirements.
Builder is designed to generate strategies for almost any market and time frame, from tick
data to monthly bars, for stocks, futures, forex, ETFs, and other markets. The strategies
generated by Builder are complete trading strategies, including rules and trading orders for
entering the market, exiting at a profit, and exiting at a loss. The strategy code is provided in
open text file format, which can be pasted into the trading platform's editor for compilation
and subsequent execution to generate trading signals.
Some of the user options in Builder include the code type (e.g., current versions of
TradeStation/MultiCharts, TradeStation 2000i, NinjaTrader 7, MetaTrader 4, AmiBroker);
specifying strategies as long-only, short-only, or combined long and short trading; requiring
the long and short entry rules to be logical opposites; limiting entries and exits to specified
times; limiting the number of entries per day for day trading strategies; including a neural
network in the entry conditions; specifying one of several optional position sizing methods to
include in the strategy code; building using stress testing/Monte Carlo analysis; excluding
specific indicators, entry rules, and exit rules from the build process; and specifying various
aspects of the genetic programming process as well as other features to be included or
excluded from the generated strategies.
Genetic Programming Builder uses a computational technique called genetic programming (GP),
1 which belongs to
a class of techniques called evolutionary algorithms. Evolutionary algorithms and GP in
particular were developed by researchers in artificial intelligence based on the biological
concepts of reproduction and evolution. A GP algorithm “evolves” a population of trading
strategies from an initial population of randomly generated members. Members of the
population compete against each other based on their “fitness.” The fitter members are
selected as “parents” to produce a new member of the population, which replaces a weaker
(less fit) member.
Two parents are combined using a technique called crossover, which mimics genetic
crossover in biological reproduction. In crossover, part of one parent’s genome is combined
with part of the other parent’s genome to produce the child genome. In Builder, genomes
represent the trading rules and order logic of the strategy.
Other members of the population are produced via mutation, is which one member of the
population is selected to be modified by randomly changing parts of its genome. Typically, a
3
majority (e.g., 90%) of new members of the population are produced via crossover, with the
remaining members produced via mutation.
Over successive generations of reproduction, the overall fitness of the population tends to
increase. The process is stopped after some number of generations or when the fitness stops
increasing. The solution is generally taken as the fittest member of the resulting population.
The initial GP population might have as few as 50 members or as many as 1000 or more. A
typical build process might progress over anywhere from 10 to 100 generations or more.
The number of strategies constructed and evaluated during the build process is equal to the
size of the population multiplied by the number of generations.
In the context of building trading strategies, GP enables the synthesis of strategies given only
a high level set of performance goals. The GP process does the rest. This approach has
several significant benefits, including:
Reduces the need for knowledge of technical indicators and strategy design. The GP
algorithm selects the individual trading rules, indicators, and other elements of the
strategy for you.
The rule construction process allows for considerable complexity, including nonlinear
trading rules.
The GP process eliminates the most labor intensive and tedious elements of the
traditional strategy development process; namely, coming up with a new trading idea,
programming it, verifying the code, testing the strategy, modifying the code, and
repeating. This is all done automatically in GP.
The GP process is unbiased. Whereas most traders have developed biases for or against
specific indicators and/or trading logic, GP is guided only by what works.
By incorporating proper trading rule semantics, the GP process in Builder is designed to
produce logically correct trading rules and error-free code.
The GP process often produces results that are not only unique but non-obvious. In
many cases, these hidden gems would be nearly impossible to find any other way.
By automating the build process, the time required to develop a viable strategy can be
reduced from weeks or months to a matter of minutes in some cases, depending on the
length of the input price data file and other build settings.
Genetic programming has been successfully used in a variety of fields, including signal and
image processing, process control, bioinformatics, data modeling, programming code
generation, computer games, and economic modeling; see, for example Poli et al.2 An
overview of using GP in finance is provided by Chen.3 Colin
4 was one of the first to explain
how to use GP for optimizing combinations of rules for a trading strategy.
Various academic studies have demonstrated the benefits of GP in trading. For example,
Karjalainen5 found that price pattern trading rules evolved using GP for S&P 500 futures
provided an advantage over buy-and-hold returns in out-of-sample testing. Similarly, Potvin
et al.6 found that rules generated through a GP process for individual stocks outperformed
buy-and-hold in out-of-sample testing during falling and sideways markets. Kaucic7
combined a genetic algorithm with other learning methods to generate simple trading rules
for the S&P 500 index and found positive results compared to buy-and-hold on out-of-
sample testing.
Until recently, most applications of genetic programming to trading strategy generation have
been academic studies based on limited rule sets, overly simple entry and exit logic, and
custom-written code, making the results unsuitable for most traders. At the same time, most

4
available software that implements GP for market trading has either been targeted to
professional traders and priced accordingly or is very complicated to set up and use.
Adaptrade Builder was designed to make GP simple to use for any trader, individual or
professional, who has a basic understanding of strategy trading and is familiar with one of
the supported trading platforms.
References
1. J. Koza. Genetic Programming. The MIT Press, Cambridge, MA. 1992.
2. R. Poli, W. B. Langdon, and N. F. McPhee. A field guide to genetic programming.
Published via http://lulu.com and freely available at http://www.gp-field-guide.org.uk,
2008. (With contributions from J. R. Koza).
3. Shu-Heng Chen (Editor). Genetic Algorithms and Genetic Programming in
Computational Finance. Kluwer Academic Publishers, Norwell, MA. 2002.
4. A. Colin. Genetic algorithms for financial modeling, Trading on the Edge. 1994, Pages
165-168. John Wiley & Sons, Inc. New York.
5. Risto Karjalainen. Evolving technical trading rules for S&P 500 futures, Advanced
Trading Rules, 2002, Pages 345-366. Elsevier Science, Oxford, UK.
6. Jean-Yves Potvin, Patrick Soriano, Maxime Vallee. Generating trading rules on the
stock markets with genetic programming. Computers & Operations Research, Volume
31, Issue 7, June 2004, Pages 1033-1047.
7. Massimiliano Kaucic. Investment using evolutionary learning methods and technical
rules. European Journal of Operational Research, Volume 207, Issue 3, 16 December
2010, Pages 1717-1727.
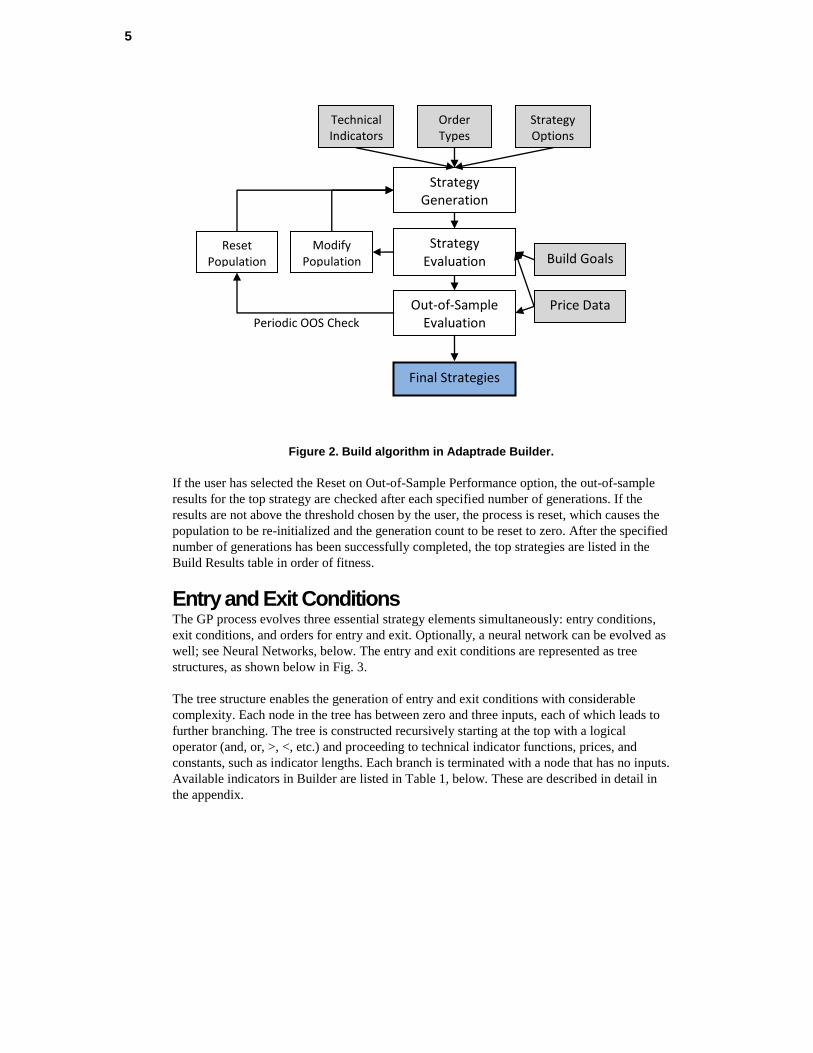
Build Algorithm The build algorithm used in Adaptrade Builder is illustrated below. The gray-shaded boxes
represent the input data, which includes the price data for the markets of interest, the
indicators and order types in the so-called build set, and the options and performance criteria
(build goals) selected by the user.
The algorithm starts with the Strategy Generation step. An initial population of trading
strategies is randomly developed from the available technical indicators and rule types in the
build set. Any options that the user has selected, such as exiting all positions at end-of-day,
are applied at this point. Each strategy is then evaluated over the price data for the selected
markets, and a fitness value is assigned based on a weighted average of the build goals
specified by the user. For example, you might select net profit and drawdown as the two
performance metrics and weight each one equally. The fitness would then be the average of
the net profit and drawdown.
To generate new members of the population, members of the current population are selected
at random, and the fitter ones are chosen as parents for crossover and mutation. A less fit
member is selected at random to be replaced by the new member. The process is repeated
until as many new members have been created as there are members in the current
population. This step represents one generation.
5
Figure 2. Build algorithm in Adaptrade Builder.
If the user has selected the Reset on Out-of-Sample Performance option, the out-of-sample
results for the top strategy are checked after each specified number of generations. If the
results are not above the threshold chosen by the user, the process is reset, which causes the
population to be re-initialized and the generation count to be reset to zero. After the specified
number of generations has been successfully completed, the top strategies are listed in the
Build Results table in order of fitness.
Entry and Exit Conditions The GP process evolves three essential strategy elements simultaneously: entry conditions,
exit conditions, and orders for entry and exit. Optionally, a neural network can be evolved as
well; see Neural Networks, below. The entry and exit conditions are represented as tree
structures, as shown below in Fig. 3.
The tree structure enables the generation of entry and exit conditions with considerable
complexity. Each node in the tree has between zero and three inputs, each of which leads to
further branching. The tree is constructed recursively starting at the top with a logical
operator (and, or, >, <, etc.) and proceeding to technical indicator functions, prices, and
constants, such as indicator lengths. Each branch is terminated with a node that has no inputs.
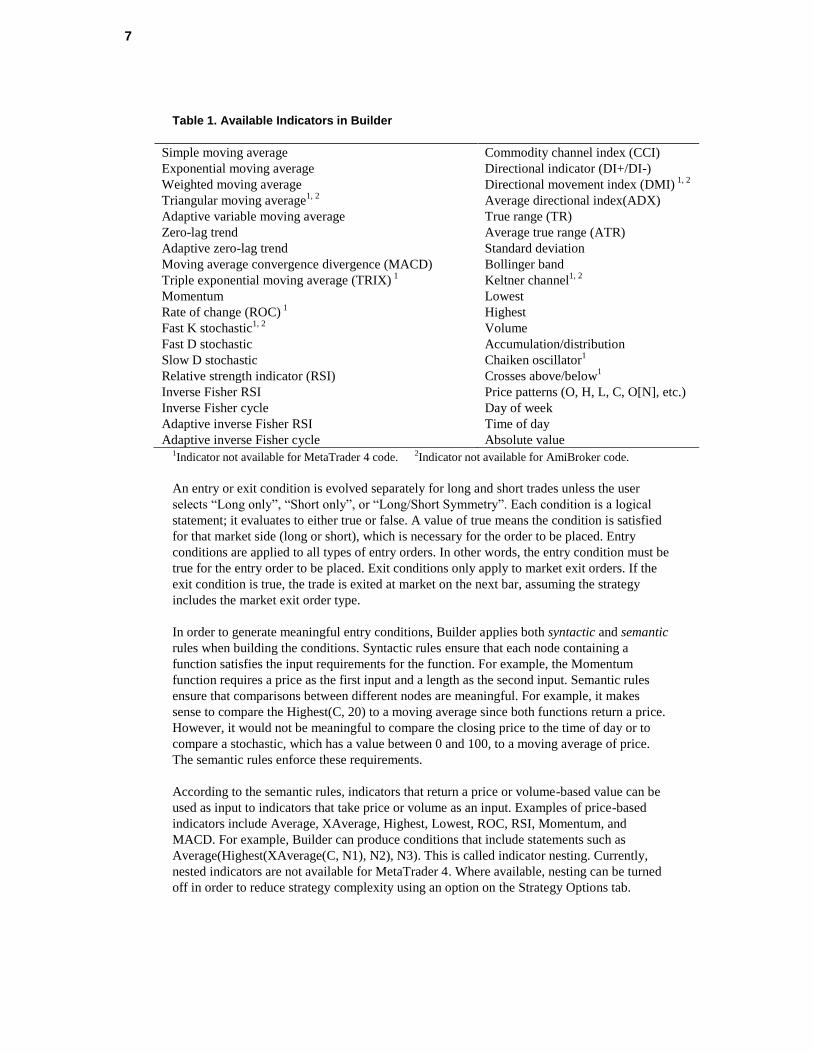
Available indicators in Builder are listed in Table 1, below. These are described in detail in
the appendix.
Strategy Generation
Strategy Evaluation
Out-of-Sample Evaluation
Final Strategies
Technical Indicators
Order Types
Strategy Options
Reset Population
Modify Population
Price Data
Build Goals
Periodic OOS Check

6
Figure 3. Entry condition example showing tree structure.
Note: As shown in Table 1 (see footnotes), not all indicators are available for all code types
(scripting languages). For example, if the MetaTrader 4 code type is selected on the
Evaluation Options tab prior to building, some indicators will be excluded from the build set
and will not be included in the strategies. If a strategy previously built for
TradeStation/MultiCharts includes one or more of these indicators and is then re-evaluated
when the MetaTrader 4 code type has been selected, the resulting code will be invalid and
will not compile in MetaTrader. Also, some indicators generate different values in different
platforms, and Builder has been designed to duplicate these differences depending on the
selected code type. For this reason, a strategy may produce different results when evaluated
under a different code type than was selected for building the strategy.
The EasyLanguage code corresponding to the tree structure shown in Fig. 3 is listed below.
VarL1 = Highest(C, 20);
VarL2 = Average(H, 23);
VarL3 = Momentum(L, 30);
VarL4 = AbsValue(VarL3);
VarL5 = H[6];
VarL6 = VarL5 – L;
VarL7 = SlowD(14);
VarL8 = FastK(5);
CondL1 = VarL1 < VarL2;
CondL2 = VarL4 >= VarL6;
CondL3 = CondL1 or CondL2;
CondL4 = VarL7 > VarL8
EntCondL = CondL3 and CondL4;
In this example, the long entry condition is given by the last statement, EntCondL.
The crossover operator of the GP process replaces a subtree in one parent with a subtree from
the other parent. For example, the subtree on the right of Fig. 3, starting with “>” (i.e.,
SlowD(14) > FastK(5)), might be replaced with a different subtree from another member of
the population. Mutation changes individual nodes in the tree. For example, the “Average”
node might be replaced with “Lowest” so that the subtree Average(H, 23) becomes
Lowest(H, 23).
7
Table 1. Available Indicators in Builder
Simple moving average
Exponential moving average
Weighted moving average
Triangular moving average1, 2
Adaptive variable moving average
Zero-lag trend
Adaptive zero-lag trend
Moving average convergence divergence (MACD)
Triple exponential moving average (TRIX) 1
Momentum
Rate of change (ROC) 1
Fast K stochastic1, 2
Fast D stochastic
Slow D stochastic
Relative strength indicator (RSI)
Inverse Fisher RSI
Inverse Fisher cycle
Adaptive inverse Fisher RSI
Adaptive inverse Fisher cycle
Commodity channel index (CCI)
Directional indicator (DI+/DI-)
Directional movement index (DMI) 1, 2
Average directional index(ADX)
True range (TR)
Average true range (ATR)
Standard deviation
Bollinger band
Keltner channel1, 2
Lowest
Highest
Volume
Accumulation/distribution
Chaiken oscillator1
Crosses above/below1
Price patterns (O, H, L, C, O[N], etc.)
Day of week
Time of day
Absolute value 1Indicator not available for MetaTrader 4 code. 2Indicator not available for AmiBroker code.
An entry or exit condition is evolved separately for long and short trades unless the user
selects “Long only”, “Short only”, or “Long/Short Symmetry”. Each condition is a logical
statement; it evaluates to either true or false. A value of true means the condition is satisfied
for that market side (long or short), which is necessary for the order to be placed. Entry
conditions are applied to all types of entry orders. In other words, the entry condition must be
true for the entry order to be placed. Exit conditions only apply to market exit orders. If the
exit condition is true, the trade is exited at market on the next bar, assuming the strategy
includes the market exit order type.
In order to generate meaningful entry conditions, Builder applies both syntactic and semantic
rules when building the conditions. Syntactic rules ensure that each node containing a
function satisfies the input requirements for the function. For example, the Momentum
function requires a price as the first input and a length as the second input. Semantic rules
ensure that comparisons between different nodes are meaningful. For example, it makes
sense to compare the Highest(C, 20) to a moving average since both functions return a price.
However, it would not be meaningful to compare the closing price to the time of day or to
compare a stochastic, which has a value between 0 and 100, to a moving average of price.
The semantic rules enforce these requirements.
According to the semantic rules, indicators that return a price or volume-based value can be
used as input to indicators that take price or volume as an input. Examples of price-based
indicators include Average, XAverage, Highest, Lowest, ROC, RSI, Momentum, and
MACD. For example, Builder can produce conditions that include statements such as
Average(Highest(XAverage(C, N1), N2), N3). This is called indicator nesting. Currently,
nested indicators are not available for MetaTrader 4. Where available, nesting can be turned
off in order to reduce strategy complexity using an option on the Strategy Options tab.

8
Order Types Entry Orders
The following types of entry orders are available in Builder:
Market Entry
Stop Entry
Limit Entry
Entry orders are placed when the entry conditions, as described in the previous section, are
true. A market entry means the trade enters at the open of the next bar. Stop and limit entries
are placed at a specified price away from the market. Stop orders are intended to be placed
above the market for a long entry and below the market for a short entry. Limit orders are
intended to be placed below the market for a long entry and above the market for a short
entry.
Stop and limit entry prices in Builder are calculated as follows:
EntryPrice = PriceValue +/- Fr * PriceDiff
where:
PriceValue is one of: price, price[N], Highest(price, N), Lowest(price, N),
Average(price, N), XAverage(price, N), or DayPrice;
price is one of: O, H, L, or C;
price[N] is the price N bars ago;
DayPrice is one of: OpenD(0), HighD(0), LowD(0), or CloseD(1);
Fr is a constant multiplier; and
PriceDiff is one of: true range, ATR, PriceValue1 – PriceValue2, or
AbsValue(PriceValue1 – PriceValue2).
The listed functions, such as OpenD(0) and Highest(price, N), are shown as written in
TradeStation’s EasyLanguage. PriceValue, Fr, PriceDiff, and the associated function
parameters are chosen by Builder during the build process.
The following are examples of long stop entry prices:
EntryPrice = Average(C, 10) + 3.5 * AbsValue(C[5] – H[14])
EntryPrice = H + 2.1 * AbsValue (Average(C,20) – Lowest(H,15))
These could also be short limit entries since short limit entries are also above the market and
therefore use a “+” sign to add the price difference to the price value.
Examples of short stop entry prices are shown below:
EntryPrice = OpenD(0) – 1.7 * AvgTrueRange (11)
EntryPrice = C[16] – 4.3*AbsValue(XAverage(L,5)–Xaverage(C,2))
These could also be long limit entries since long limit entries are also below the market and
therefore use a “-” sign to subtract the price difference from the price value.

9
The following types of exit orders are available in Builder:
Exit at Target ($)
Exit at Target (%)
Exit at Target (Price)
Trailing Stop ($ Floor)
Trailing Stop (ATR Floor)
Protective Stop ($)
Protective Stop (%)
Protective Stop (Price)
Exit After N Bars
Exit After N Bars Profit
Exit After N Bars Loss
Exit After Time
Exit at Market
Exit End-of-Day
Target Exits
The three target exits use limit orders to exit the trade at a price that represents a profit for
the trade. The first target exit type ($) uses a fixed-size target based on the value of the profit
target (e.g., dollars for accounts denominated in dollars) and is applied per share or contract.
For example, a target size of $500 means the target price is calculated so that if the target is
hit, the profit will be $500 per share or contract before trading costs. For the E-mini S&P
futures, for example, this means the stop size would be 10 points above the entry price for a
long trade because each point is worth $50 for the E-mini. For a stock trade, regardless of the
number of shares, a $2 target would be placed two points above the entry price for a long
trade or 2 two points below the entry for a short trade. The size of the target chosen by the
program during building is based on the "Fixed Stop Size" parameter range entered on the
Strategy Options tab.
Percentage targets are set at a percentage of the entry price above (below) the entry price for
a long (short) trade. For example, if the entry price is 25, a 5% target would be placed 1.25
points above the entry for a long trade. The percentage value is chosen from the "Percentage
Stop Size" parameter range on the Strategy Options tab.
Price-based target exits are constructed the same way as limit entry orders. Specifically, the
price for this type of target exit is calculated as follows:
ExitPrice = EntryPrice +/- Fr * PriceDiff
where EntryPrice is the entry price for the trade, and Fr and PriceDiff are as defined
above for entry orders.
For example, the following could be the price for a short target exit:
ExitPrice = EntryPrice – 4.3 * AbsValue(C[10]–Xaverage(C,2))
Similarly, if the first minus sign were changed to a plus sign, this could be the exit price for a
long target exit.
Trailing Stops
Trailing stops in Builder are activated when the open profit on a closed-bar basis is above a
threshold called the floor. There are two types of trailing stops in Builder: ones with fixed-
10
size floors ($ Floor), and ones where the floor is calculated as a multiple of the average true
range (ATR Floor). For fixed-size floors, the size of the floor is selected by the program from
the "Fixed Stop Size" parameter range entered on the Strategy Options tab. For ATR-based
floors, the multiple of the ATR is selected from the "ATR Multiple" range on Strategy
Options. Once the threshold has been reached, the trailing stop is placed so that a percentage
of the open profit is locked in. The stop remains active until the trade exits. The percentage
of profit to lock in is chosen by Builder from the range 0 to 100 percent.
Protective Stops
As with target exits, there are three types of protective (also known as money management)
stops. The fixed-size protective ($) stops use a fixed value (e.g., in dollars for accounts
denominated in dollars), which is applied per share or contract. For example, a stop size of
$500 means the stop price is calculated so that if the stop is hit, the loss will be $500 per
share or contract. For the E-mini S&P futures, for example, this means the stop size would be
10 points below the entry price for a long trade because each point is worth $50 for the E-
mini. For a stock trade, regardless of the number of shares, a $2 stop would be placed two
points below the entry price for a long trade. The size of the stop is based on the range
entered on the Strategy Options tab ("Fixed Stop Size" parameter range).
Percentage (%) protective stops are set at a percentage of the entry price below the entry
price. These types of stops are often used for stock trading. For example, if the entry price is
25, a 5% protective stop would be placed 1.25 points below the entry for a long trade. The
percentage value is chosen from the "Percentage Stop Size" parameter range on the Strategy
Options tab.
Price-based protective stops are constructed the same way as price-based target exits. In fact,
the only difference is that the sign is reversed preceding the PriceDiff portion of the
ExitPrice equation presented above. For example, the equation presented above to illustrate a
short target exit alternatively could be a long protective stop.
Exiting After N Bars
The “Exit After N Bars” exit order causes the trade to exit at the open of the next bar when
the number of bars since entry is greater than or equal to N, which is a strategy input chosen
by Builder during the build process. The "Exit After N Bars Profit" and "Exit After N Bars
Loss" exits work similarly. With the "Exit After N Bars Profit" exit, the trade is exited at the
open of the next bar if the number of bars since entry is greater than or equal to N and the
close of the bar is greater (less) than the entry price for a long (short) trade; i.e., if the trade is
profitable before costs.
Likewise, with the "Exit After N Bars Loss" exit, the trade is exited at the open of the next
bar if the number of bars since entry is greater than or equal to N and the close of the bar is
less (greater) than the entry price for a long (short) trade; i.e., if the trade is unprofitable
before costs. Normally, N is selected from the "Lookback, Indicators" parameter range on
Strategy Options. However, for intraday strategies for which the end-of-day exit has been
selected, N is chosen to be between 1 and the number of bars in the trading session.
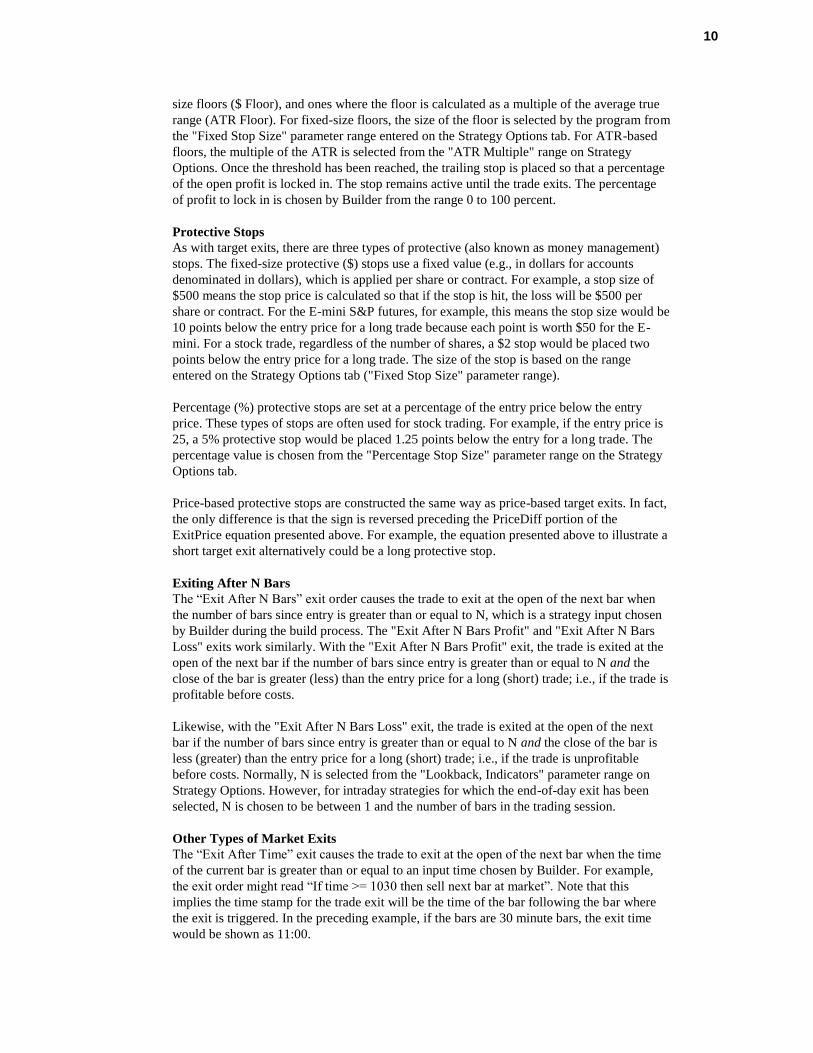
Other Types of Market Exits
The “Exit After Time” exit causes the trade to exit at the open of the next bar when the time
of the current bar is greater than or equal to an input time chosen by Builder. For example,
the exit order might read “If time >= 1030 then sell next bar at market”. Note that this
implies the time stamp for the trade exit will be the time of the bar following the bar where
the exit is triggered. In the preceding example, if the bars are 30 minute bars, the exit time
would be shown as 11:00.

11
The “Exit at Market” exit causes the trade to exit at the open of the next bar when the exit
condition is true on the current bar.
The “Exit End-of-Day” exit causes the trade to exit at the close of the last bar of the current
day if intraday or daily bars are used. On weekly or monthly data, this exit causes the trade to
exit at the close of the current bar. For TradeStatio and MultiCharts, this exit type is
primarily for back-testing purposes. To achieve end-of-day exits in real-time trading on
intraday data in TradeStation and MultiCharts, the optional time-based exit on the Strategy
Options tab should be used. This exit type is not available for MetaTrader 4 or AmiBroker.
For NinjaTrader, this exit only applies to intraday data.
Neural Networks Neural networks are nonlinear models loosely based on the way the brain is structured as a
network of interconnected neurons. A neural network is established by fitting it to a given set
of input and output data with the goal of accurately predicting the output from input data not
used in the fitting process. A successful neural network is one that generalizes well to new
input data.
A neural network is often described graphically as a set of nodes connecting an input layer
through a "hidden" layer of nodes to one or more outputs. The inputs are summed together
using a set of weights that connect the nodes to produce the output. The weights are
determined by the fitting or training process. A neural network with a single output and one
hidden layer is shown below in Fig. 4.
Figure 4. A neural network with a single output and one hidden layer.
The output from the network is defined by the following equations:
H1 = tanh(w11 * I1 + w21 * I2 + … + wn1 * In)
H2 = tanh(w12 * I1 + w22 * I2 + … + wn2 * In)
…
Hm = tanh(w1m * I1 + w2m * I2 + … + wnm * In)
Output = tanh(wnm+1 * H1 + wnm+2 * H2 + … + wnm+m * Hm)
The Ii represent the inputs. In the context of trading, these could be anything that might have
some predictive value for trading, such as momentum, stochastics, ADX, moving averages,
etc. The Hj represent the hidden nodes, the weights are given by the wkl, and the output value
by Output. The hyperbolic tangent function, tanh, returns a value in the range -1 to +1, so the

12
output will lie in this range. The inputs are typically scaled so that they also lie between -1
and +1.
Training the network to determine the weight values involves iterating on the weights using
known input-output data. The technique traditionally used to adjust the weights in an
iterative manner is called back-propagation, although any similar approach may be used,
such as a genetic algorithm.
In Builder, the inputs to the network are chosen by the genetic programming process and
evolved along with the entry and exit conditions using the same processes of crossover and
mutation used to evolve the entry and exit conditions. The output of the network allows for a
long entry if it's greater than or equal to 0.5 and for a short entry if it's less than or equal to -
0.5. This condition is in addition to any existing entry conditions (see Trading Strategy
Structure, below). For example, if there is a long entry condition, it must be true and the
neural network output must be at least 0.5 for a long entry.
As suggested above, the inputs to the neural network are scaled so that they lie between -1
and +1. The scaling is performed on a moving or trailing basis over the most recent
NNLookBack bars. In other words, the minimum and maximum values of each input over
the most recent NNLookBack bars are used to scale each input so that it lies between -1 and
+1. The value of NNLookBack is a user-selectable option with a default value of 100.
In addition to evolving the inputs to the network, Builder also evolves the number of nodes
in the hidden layer and the weight values. The initial number of inputs is a user-selectable
option, along with the maximum number of nodes in the hidden layer. The number of inputs
may change from strategy to strategy over successive generations as the inputs from different
strategies are combined using crossover.
The total number of weights in the network will be given by (n + 1) * m, where n is the
number of inputs and m is the number of nodes in the hidden layer, provided m is at least
one. If there is no hidden layer (i.e., m is zero), the number of weights is the same as the
number of inputs. In the resulting strategy code, each weight is listed as a strategy input.
Other strategy inputs may result from the network inputs, such as the look-back length of a
moving average.
To include a neural network, simply check the option on the Strategy Options tab and click
the Neural Network Settings button to select the available settings, such as the initial number
of inputs and the maximum number of hidden nodes. To develop strategies in which the
neural network provides the only entry condition, set the tree depth (Build Options) to zero,
which will ensure that the usual entry conditions are always "true".
Trading Strategy Structure Trading strategies in Builder have the following general form, shown below in pseudo-
code:*
Inputs: N1, N2, N3, …
LongEntryCondition = …
ShortEntryCondition = …
LongExitCondition = …

13
ShortExitCondition = …
[Neural network inputs]
[Neural network output function]
If [position is flat and] LongEntryCondition is true
[and neural network output >= 0.5] then
Long entry order…
Initialize long exit orders as necessary…
If [position is flat and] ShortEntryCondition is true
[and neural network output <= -0.5] then
Short entry order…
Initialize short exit orders as necessary…
If position is long then
Long exit order 1…
Long exit order 2…
…
If position is short then
Short exit order 1…
Short exit order 2…
…
[End-of-day exit]
* Code shown in brackets [] is optional.
Strategies in Builder start with the list of inputs. An input is provided for any indicator
parameter, price pattern look-back length, and any parameters required by the entry and exit
orders, such as the look-back length for the ATR.
The LongEntryCondition through ShortExitCondition variables are the true/false conditions
evolved by the genetic programming process, such as shown in Fig. 3. A long entry order is
placed if the long entry condition is true, subject to the optional conditions, such as that the
position is currently flat (out of the market) and that the neural network output value is above
the threshold value. Likewise, a short entry order is placed if the short entry condition is true,
subject to the optional conditions. An open long trade is exited at the next open if the long
exit condition is true on the current bar. An open short trade is covered (exited) at the next
open if the short exit condition is true is on the current bar.
Only one type of entry order is allowed for each side of the market (long/short), although
they can be different for each side unless the symmetry option is selected. When an entry
order is placed, one or more variables for the exit orders may be initialized within the entry
order code block.
The statements for the exit orders follow the entry orders. One or more exit orders may be
chosen by the program, with a maximum of one exit order of each type listed above. Unless
the necessary orders have been excluded from the build set by the user, the program will
ensure that each strategy has an exit-at-a-loss and an exit-at-a-profit. This prevents trades
from remaining open indefinitely.

14
The optional end-of-day exit must be specified by the user on the Order Types tab in order to
be included in the strategy.
The meaning of common input variables and order labels used in the strategy code is
explained in Appendix: Code Conventions.
Example As a simple, introductory example, Builder was run on daily bars of a stock index futures
market for a small population and a limited number of generations. The performance metrics
chosen to guide the process are shown below in Fig. 5. These settings imply that the fitness
function was a weighted average of the net profit, number of trades, correlation coefficient,
statistical significance, and the return/drawdown ratio. Specific targets were set for the
number of trades and the return/drawdown ratio. The other selected metrics were maximized.
The build options were set mostly to the defaults, as shown in Fig. 6. The population size was set to
100 and the number of generations to five. All members of the population were saved (“Save 100 best
strategies”), and the Reset on Build checkbox was unchecked. This means that when the build stops
after five generations, the build process will continue where it stopped when the Build button is
clicked again. Specifically, the program will initialize the new population with the prior population,
rather than starting over. That way, if the build process is progressing well, the population can be
evolved beyond the initial five generations.
Figure 5. Build metrics for example build.

15
Figure 6. Build options for example build.
Figure 7. Percentage of population members with out-of-sample net profit greater than $1,000.
0
20
40
60
80
100
120
0 5 10
Number of Generations
% Members w/OOS Profit > $1000
16
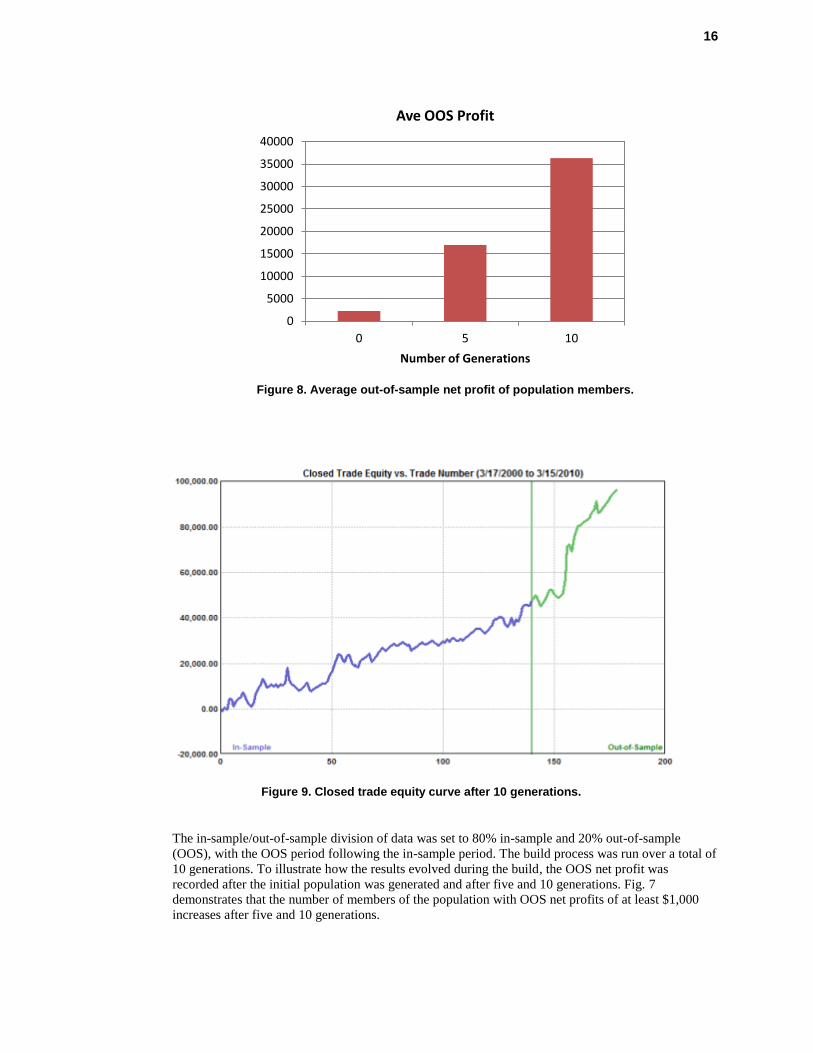
Figure 8. Average out-of-sample net profit of population members.
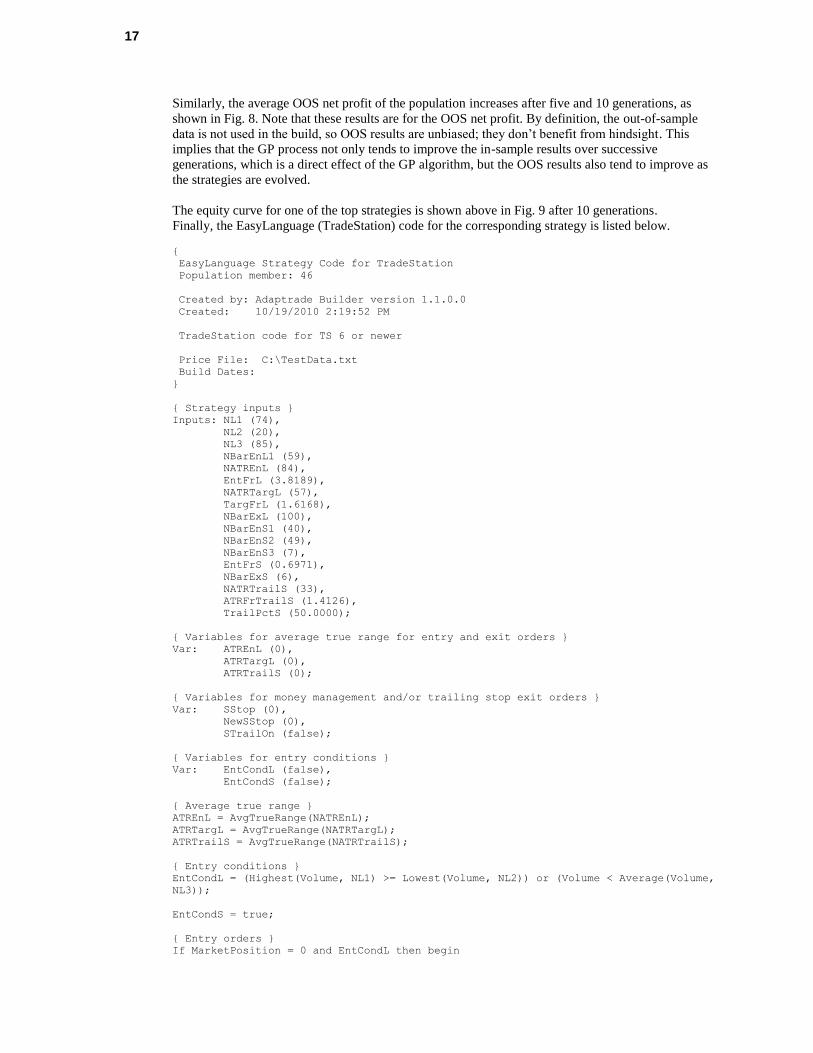
Figure 9. Closed trade equity curve after 10 generations.
The in-sample/out-of-sample division of data was set to 80% in-sample and 20% out-of-sample
(OOS), with the OOS period following the in-sample period. The build process was run over a total of
10 generations. To illustrate how the results evolved during the build, the OOS net profit was
recorded after the initial population was generated and after five and 10 generations. Fig. 7
demonstrates that the number of members of the population with OOS net profits of at least $1,000
increases after five and 10 generations.
0
5000
10000
15000
20000
25000
30000
35000
40000
0 5 10
Number of Generations
Ave OOS Profit
17
Similarly, the average OOS net profit of the population increases after five and 10 generations, as
shown in Fig. 8. Note that these results are for the OOS net profit. By definition, the out-of-sample
data is not used in the build, so OOS results are unbiased; they don’t benefit from hindsight. This
implies that the GP process not only tends to improve the in-sample results over successive
generations, which is a direct effect of the GP algorithm, but the OOS results also tend to improve as
the strategies are evolved.
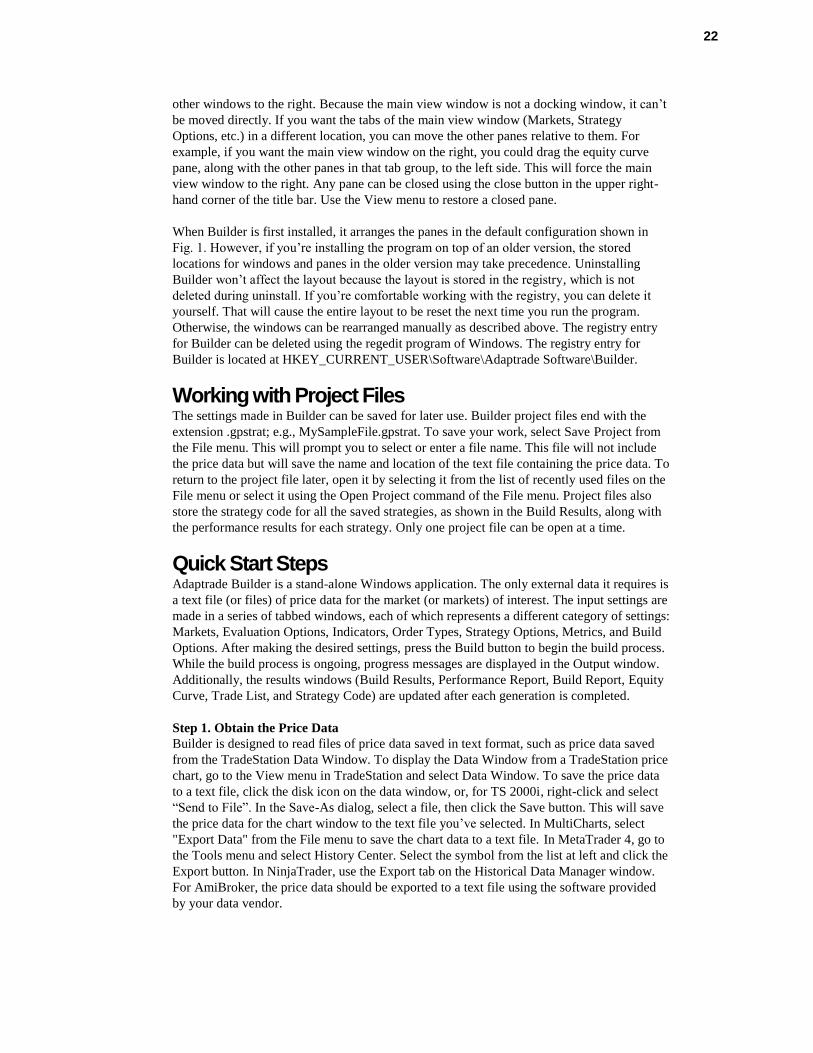
The equity curve for one of the top strategies is shown above in Fig. 9 after 10 generations.
Finally, the EasyLanguage (TradeStation) code for the corresponding strategy is listed below.
{
EasyLanguage Strategy Code for TradeStation
Population member: 46
Created by: Adaptrade Builder version 1.1.0.0
Created: 10/19/2010 2:19:52 PM
TradeStation code for TS 6 or newer
Price File: C:\TestData.txt
Build Dates:
}
{ Strategy inputs }
Inputs: NL1 (74),
NL2 (20),
NL3 (85),
NBarEnL1 (59),
NATREnL (84),
EntFrL (3.8189),
NATRTargL (57),
TargFrL (1.6168),
NBarExL (100),
NBarEnS1 (40),
NBarEnS2 (49),
NBarEnS3 (7),
EntFrS (0.6971),
NBarExS (6),
NATRTrailS (33),
ATRFrTrailS (1.4126),
TrailPctS (50.0000);
{ Variables for average true range for entry and exit orders }
Var: ATREnL (0),
ATRTargL (0),
ATRTrailS (0);
{ Variables for money management and/or trailing stop exit orders }
Var: SStop (0),
NewSStop (0),
STrailOn (false);
{ Variables for entry conditions }
Var: EntCondL (false),
EntCondS (false);
{ Average true range }
ATREnL = AvgTrueRange(NATREnL);
ATRTargL = AvgTrueRange(NATRTargL);
ATRTrailS = AvgTrueRange(NATRTrailS);
{ Entry conditions }
EntCondL = (Highest(Volume, NL1) >= Lowest(Volume, NL2)) or (Volume < Average(Volume,
NL3));
EntCondS = true;
{ Entry orders }
If MarketPosition = 0 and EntCondL then begin

18
Buy next bar at XAverage(L, NBarEnL1) + EntFrL * ATREnL stop;
end;
If MarketPosition = 0 and EntCondS then begin
Sell short next bar at Highest(H, NBarEnS1) - EntFrS * AbsValue(Lowest(L,
NBarEnS2) - Lowest(H, NBarEnS3)) stop;
STrailOn = false;
SStop = Power(10, 10);
end;
{ Exit orders, long trades }
If MarketPosition > 0 then begin
If BarsSinceEntry >= NBarExL then
Sell next bar at market;
Sell next bar at EntryPrice + TargFrL * ATRTargL limit;
end;
{ Exit orders, short trades }
If MarketPosition < 0 then begin
If EntryPrice - C > ATRFrTrailS * ATRTrailS then
STrailOn = true;
If STrailOn then begin
NewSStop = EntryPrice - TrailPctS * (EntryPrice - C)/100.;
SStop = MinList(SStop, NewSStop);
end;
If BarsSinceEntry >= NBarExS then
Buy to cover next bar at market;
If STrailOn then
Buy to cover next bar at SStop stop;
end;
This example represents one of the simpler strategies you might create with Builder. Strategies can be
created with as much or as little complexity as you want. For other examples, please see the
newsletter section on the Adaptrade.com web site.

Chapter 2 Getting Started
Installation
Minimum System Requirements:
1.2 GHz processor
512 MB RAM
1 GB hard disk space
Windows XP, Vista or Windows 7 operating system
Monitor: 17 inch or larger
Adaptrade Builder can be downloaded at any time from the download page of the Adaptrade
Software web site (www.Adaptrade.com). The program initially installs as a trial, which can
be activated (i.e., converted to a licensed copy) following purchase. The trial version is the
same as the paid version; i.e., there is no separate installation for the paid version. The
download file is a self-extracting installation file. To install Builder, browse to the location of
the downloaded file via Windows Explorer (also known as “My Computer”) and double-click
on the file to open it. Alternatively, select Run from the Accessories menu under the list of
programs in the Start menu, browse to the location of the downloaded file, click Open, then
click OK in the Run window. The installation should begin.
The installation program will prompt you for the location to install the program files. The
default location is the folder Program Files\Adaptrade Software\Adaptrade Builder x.x\, where
x.x is the version number (e.g., 1.5). You can install the program in another location if you
wish.
Note about 32 vs. 64-bit versions: The 32-bit version of Builder will run on both 32 and 64-
bit versions of Windows. However, the 64-bit version will be able to take advantage of all
available installed memory to process larger data files. If you're not sure which version of
Windows you have, you can check the System settings under the Control Panel. Both the 32
and 64-bit versions are compiled from the same code and are functionally identical, including
the project (.gpstrat) files they generate. Because they're the same program, only one may be
installed on the same computer. If your computer runs 64-bit Windows, it's strongly
recommended that you install the 64-bit version.
Once the installation is complete, you should find the Builder icon, as displayed on the title
page of the user’s guide, on your desktop and the Builder program in the programs menu. You
should also find a folder called Examples in the Adaptrade Builder folder. The Examples
folder contains sample files that can be opened by Builder.
To activate Builder, enter the license ID and password provided in the purchase receipt in the
spaces provided on the activation screen, which will be displayed when the program is first
run. Please note that the licensed version of Builder and the trial version are identical. The
trial version is converted to a licensed version after purchase by entering the license ID and
password. There is no separate download for the licensed executable. The most recent version
of Builder can always be found on the trial download page of the Adaptrade Software web site
(www.Adaptrade.com).

20
Bonus files. If your purchase includes set of bonus strategies, they will be provided via a
separate download link at the time of purchase. Please check your online order receipt for the
download link for these files. Install the bonus files by double-clicking the file after download.
TradeStation/MultiCharts Installation Notes. Several files that work in conjunction with
Builder need to be installed separately into TradeStation or MultiCharts. These files can be
found in the EasyLanguage folder in the Adaptrade Builder folder under Program Files after
Builder is installed. For current versions of TradeStation, the files end with the file extension
.eld. For TS 2000i, the file extension is .els, and for MultiCharts, the extension is .pla. The
files should be imported into TradeStation using the import command of the File menu. For
MultiCharts, the files can be imported via the Import command of the File menu in the
PowerLanguage Editor. Please refer to the platform documentation for instructions on
importing .eld/.els/.pla files into TradeStation/MultiCharts.
The specific files that need to be imported into TradeStation/MultiCharts include
NNCOMPUTE, which contains functions for use with the neural network option in Builder,
and BUILDER_ADAPTINDICATORS, which contains the adaptive indicators (Adaptive
VMA, Adaptive ZLT, etc.).
NinjaTrader 7 Installation Notes. Strategies created with the NinjaTrader code option
require several indicator and strategy files to run. Without these files, the NinjaScript code
will not compile or execute. These files are contained in a zip file named
NinjaTrader.Adaptrade.zip, which can be found in the NinjaScript folder in the Adaptrade
Builder folder under Program Files after Builder is installed. To install the files, open
NinjaTrader, select Utilities from the File menu and select Import NinjaScript… Browse to
the NinjaScript folder in the Adaptrade Builder installation folder and select the
NinjaTrader.Adaptrade.zip file. Follow the prompts to install the files into NinjaTrader.
MetaTrader 4 Installation Notes. MetaTrader 4 strategies created by Builder require files
contained in three folders: Include, Indicators, and Libraries. These folders can be found in the
MT4 folder in the Adaptrade Builder folder under Program Files after Builder is installed. The
files in these folders provide basic functionality that any MetaTrader 4 strategy generated by
Builder may require. All the files contained in the three folders should be copied to the
corresponding folders within your MetaTrader 4 installation so that MetaTrader 4 can find
them when compiling strategies. For MT4 version 600 and newer, the correct folder locations
can be found using the "Open Data Folder" command of the File menu in MT4. The general
form of the folder path is
C:\Users\User_account_name\AppData\Roaming\MetaQuotes\Terminal\Instance_id, in which
User_account_name and Instance_id are specific to the user's computer. Within this folder, the
Include, Indicators, and Libraries folders are located in the MQL4 folder.
In versions of MT4 prior to version 600, the three folders are located in the installation folder
in the experts folder (C:\Program Files (x86)\MetaTrader 4\experts\).
AmiBroker Installation Notes. AmiBroker strategies created by Builder require an
associated "include" file: ASBuilderCommon.afl. This file can be found in the AFL folder in
the Adaptrade Builder folder after Builder is installed. This file needs to be copied to the
Include folder in the AmiBroker Formulas folder under Program Files. The full path under 64-
bit Windows is C:\Program Files\AmiBroker\Formulas\Include. This file provides basic
functionality that all AmiBroker strategies generated by Builder require.
When installing a new version of Builder on a computer that currently has a prior version
installed, please note the following:

21
It’s usually unnecessary to uninstall a prior version of Builder before installing a newer
one. However, if the version number is the same through the second decimal (e.g. 1.2.1
and 1.2.2 are both version 1.2), the newer version will be installed in the same folder as
the current version by default and will over-write the older version, making it impossible
to use the older version.
Provided the installation is on the same computer as the prior installation, no new
activation code should be required. The new version should install already activated. If
not, it may be necessary to enter your license ID and password, as provided on your
purchase receipt. If you need an additional activation, please contact Adaptrade Software.
Uninstalling an older version will not affect any project files (.gpstrat files) you may have
created or saved.
New versions of Builder are designed to read files (.gpstrat files) from prior versions.
However, once a file is saved in the new version of Builder, you will not be able to open
it in an older version.
The window layout stored with a currently installed version of Builder is not removed
when that version is uninstalled. This means that if a new version, such as 1.1.0, has a
different window layout than the prior installed version, the layout may need to be
adjusted when the program is first run. All panes in Builder can be moved and resized by
clicking and dragging. You can reset the layout by deleting the registry entry for Builder
using the regedit program of Windows. The registry entry for Builder is located at
HKEY_CURRENT_USER\Software\Adaptrade Software\Builder.
Builder can be uninstalled through the Windows Control Panel.
Windows and Panes The user interface of Adaptrade Builder consists of a number of different windows. The
input data windows, as shown in Fig. 10 below and in the upper left corner of Fig. 1 (p. 1),
comprise the main view window of Builder. These tabbed windows always stay together and
are always anchored to the outer window frame. The tabs of the main view window
(Markets, Evaluation Options, Indicators, Order Types, Strategy Options, Metrics, and Build
Options) can be moved relative to each other by clicking on the tab and dragging it to a
different position. For example, to move the Markets tab so that it follows the Build Options
tab, click and drag the Markets tab to that location. These tabbed windows can be moved
relative to each other, but will always stay in the main view window.
The other windows are referred to as docking windows or panes. The panes are floating
windows that can be re-positioned by clicking and dragging. The panes consist of the
Performance Report, Build Report, Equity Curve, Trade List, Strategy Code, Build Results,
and Output windows. Panes are moved by clicking and dragging them relative to each other
and to the outer window frame. To move a pane, click the title bar and start dragging the
window. This action will cause a set of docking locations to appear. You can move the
mouse cursor over the different docking locations to see a preview of where the window will
appear if you release the mouse at that location. You will usually see four docking locations
(top, bottom, left, right) for the entire program window (main frame) and four others relative
to the current pane location.
When two or more panes are moved to the same location, they appear with tabs, as with
Equity Curve and Strategy Code windows. The tabs can be moved relative to each other by
clicking and dragging, as was discussed above for the tabs of the main view window.
To rearrange the pane windows, sometimes it’s necessary to move them in multiple steps.
For example, to move the equity curve window so that it sits above the output window, you
might need to move the output window to the bottom first, and move the equity curve and
22
other windows to the right. Because the main view window is not a docking window, it can’t
be moved directly. If you want the tabs of the main view window (Markets, Strategy
Options, etc.) in a different location, you can move the other panes relative to them. For
example, if you want the main view window on the right, you could drag the equity curve
pane, along with the other panes in that tab group, to the left side. This will force the main
view window to the right. Any pane can be closed using the close button in the upper right-
hand corner of the title bar. Use the View menu to restore a closed pane.
When Builder is first installed, it arranges the panes in the default configuration shown in
Fig. 1. However, if you’re installing the program on top of an older version, the stored
locations for windows and panes in the older version may take precedence. Uninstalling
Builder won’t affect the layout because the layout is stored in the registry, which is not
deleted during uninstall. If you’re comfortable working with the registry, you can delete it
yourself. That will cause the entire layout to be reset the next time you run the program. Otherwise, the windows can be rearranged manually as described above. The registry entry
for Builder can be deleted using the regedit program of Windows. The registry entry for
Builder is located at HKEY_CURRENT_USER\Software\Adaptrade Software\Builder.
Working with Project Files The settings made in Builder can be saved for later use. Builder project files end with the
extension .gpstrat; e.g., MySampleFile.gpstrat. To save your work, select Save Project from
the File menu. This will prompt you to select or enter a file name. This file will not include
the price data but will save the name and location of the text file containing the price data. To
return to the project file later, open it by selecting it from the list of recently used files on the
File menu or select it using the Open Project command of the File menu. Project files also
store the strategy code for all the saved strategies, as shown in the Build Results, along with
the performance results for each strategy. Only one project file can be open at a time.
Quick Start Steps Adaptrade Builder is a stand-alone Windows application. The only external data it requires is
a text file (or files) of price data for the market (or markets) of interest. The input settings are
made in a series of tabbed windows, each of which represents a different category of settings:
Markets, Evaluation Options, Indicators, Order Types, Strategy Options, Metrics, and Build
Options. After making the desired settings, press the Build button to begin the build process.
While the build process is ongoing, progress messages are displayed in the Output window.
Additionally, the results windows (Build Results, Performance Report, Build Report, Equity
Curve, Trade List, and Strategy Code) are updated after each generation is completed.
Step 1. Obtain the Price Data
Builder is designed to read files of price data saved in text format, such as price data saved
from the TradeStation Data Window. To display the Data Window from a TradeStation price
chart, go to the View menu in TradeStation and select Data Window. To save the price data
to a text file, click the disk icon on the data window, or, for TS 2000i, right-click and select
“Send to File”. In the Save-As dialog, select a file, then click the Save button. This will save
the price data for the chart window to the text file you’ve selected. In MultiCharts, select
"Export Data" from the File menu to save the chart data to a text file. In MetaTrader 4, go to
the Tools menu and select History Center. Select the symbol from the list at left and click the
Export button. In NinjaTrader, use the Export tab on the Historical Data Manager window.
For AmiBroker, the price data should be exported to a text file using the software provided
by your data vendor.

23
Step 2. Select the Price Data File Created in Step 1
Open Builder and click on the Markets tab, shown below in Fig. 10. Click the Add button to
add a price file or click Remove to delete one from the table. Multiple files can be added to
the table. Select the files to include in the build by checking the boxes in the Market Data
table. The strategies will be built over the data from all selected files.
When you add a file of price data, Builder opens the Price File Format window, as shown in
Fig. 11. The top table displays the contents of the price file and enables you to set the
formatting that tells the program how to read and interpret the data in the file. Select the field
delimiter (comma, semi-colon, tab, or space) used in your file to separate the data fields. The
default column headings for the data fields are date, time, open, high, low, close, and
volume. Click any column heading in the table to change, add, or remove its label. Each
column of data you want the program to read should have a label. Change the heading for the
volume column(s) as necessary, depending on whether the price file contains one column of
volume data or separate columns for up-tick and down-tick volume. Click the Clear Column
Headings button to remove all column labels in order to start fresh.
If necessary, use the Data Format pull-down menu to select a locale for reading the price
data. For example, price data saved from MetaTrader 4 have an unusual combination of
date/time and number formats that can be read using the "French (Switzerland)" locale.
Figure 10. Settings for the price data are made on the Markets tab.
Once you've selected the format for the file of price data, clicking OK will return you to the
Markets tab. Selecting an entry in the Market Data table displays the settings for that market
in the Settings table to the right. Click on any entry in the Settings table to change its value.
Builder will try to properly infer the bar type, bar size, and session times from the data file. If
any of these are incorrect, they should be manually corrected here. In the File Settings
section of Settings, the Bar Type and, where applicable, Bar Size (for intraday data) or Range
Bar Size (for range bars) should match the data in the file.
The settings in the Build/Evaluation Settings section of Settings are the settings you want to
use when building and/or evaluating a strategy. The point value and trading costs

24
(Costs/Share (r/t)) should always be entered. The point value for stocks and forex should be
"1". For futures, the point value depends on the contract.
Step 3. Select the In-sample/Out-of-Sample Dates
The Markets tab also includes controls for changing the start and end dates for analysis as
well as the in-sample/out-of-sample dates. You can change the start and end dates for
building or evaluating a strategy by clicking on the calendar controls at either end of the in-
sample/out-of-sample slider. Move the slider to change the dates for in-sample and out-of-
sample analysis. The in-sample data are used in building the strategy. Out-of-sample (OOS)
data are used in evaluating the strategies following the build. Because the OOS data are not
used during the build process, the results achieved on the OOS segment are unbiased.
Generally speaking, a ratio of between three and five to one for in-sample to OOS data is
recommended.
Figure 11. The format of the price file is selected on the Price File Format window.
Step 4. Select Position Sizing and Evaluation Options
Position sizing and other options that affect how strategies are evaluated are selected on the
Evaluation Options tab, shown in Fig. 12. You can choose from six different position sizing
methods. Since most of the methods depend on the accumulated account equity, the starting
account equity value can be entered on this tab. This is the equity value at the start of the
trading period. You can also choose whether you want the build process to select the method
for you and/or whether the build process will select the position sizing parameter value, such
as the fixed fraction for fixed fractional position sizing. Other options on this tab include the
maximum number of shares or contracts that will be traded and whether or not to round the
position size to the nearest value, such as rounding the number of shares to the nearest 100.

25
Figure 12. Position sizing options and other options that affect how strategies are
evaluated are listed on the Evaluation Options tab.
Figure 13. The indicators available in Builder are listed on the Indicators tab. Indicators
can be removed from the build set by un-checking the from the "Consider" column.
Step 5. Select Indicators and Order Types
Indicators are selected on the Indicators tab, shown in Fig. 13. The available order types are
listed in the table on the Order Types tab, as shown in Fig. 14. The tables on these two tabs
represent the build set, which contains the list of possible indicators and the list of order
types that the program draws from during the genetic programming process. To remove a
specific indicator or type of order from the build set, click the corresponding row in the
Consider column of the table. Removing an indicator or order type from the build set means

26
it won’t be considered by the program when constructing strategies. Removing too many
items may reduce the likelihood of finding viable strategies. Clicking an order type in the
Include column in the Order Types table ensures that the order type will be included in each
generated strategy.
Figure 14. The types of trading orders available in Builder are listed on the Order Types
tab. Orders types can be added or removed from the build set using the Consider
column and added to each strategy using the Include column.
Step 6. Select Options on the Strategy Options Tab
The Strategy Options tab is shown in Fig. 15. The settings on this tab control the types of
strategies generated by Builder. Options on this tab include Market Sides, which allows you
to restrict entries to either long or short trades only, several Trading Logic Options, such as
exiting at the end-of-day, and minimum and maximum values for constants used by the
program, such as the multipliers for the average true range (ATR) and look-back lengths for
indicators and price patterns.
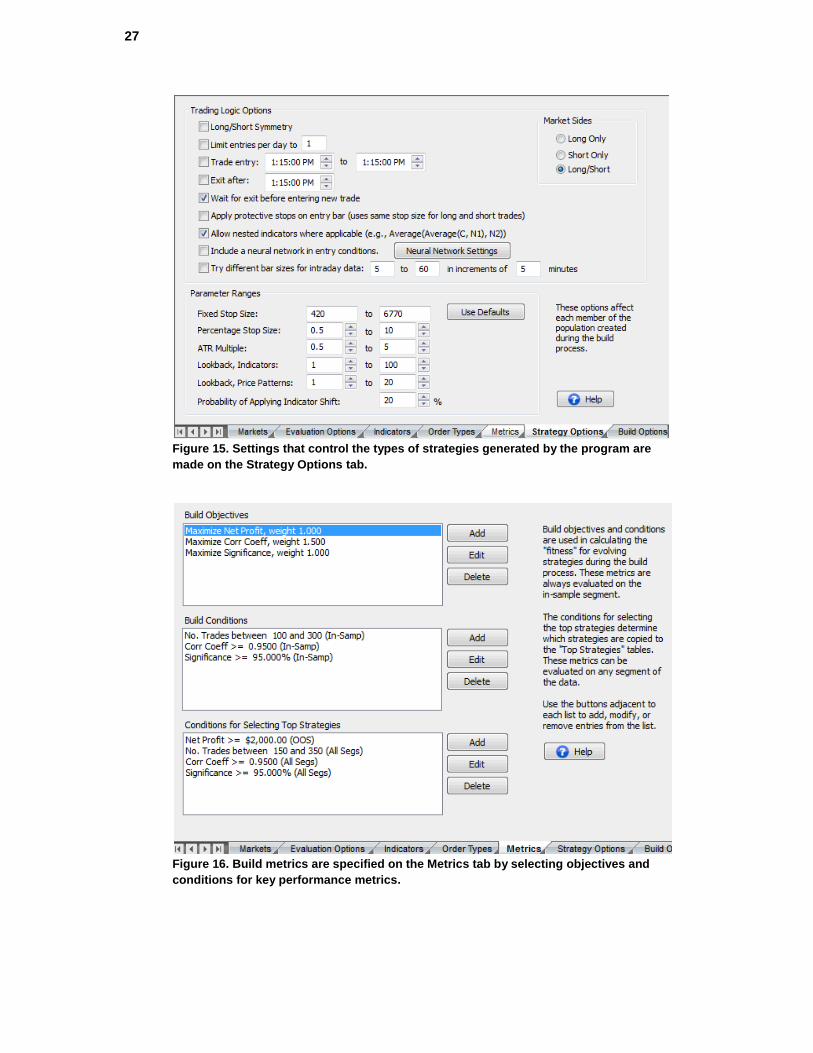
27
Figure 15. Settings that control the types of strategies generated by the program are
made on the Strategy Options tab.
Figure 16. Build metrics are specified on the Metrics tab by selecting objectives and
conditions for key performance metrics.

28
Figure 17. Options that affect the build process are specified on the Build Options tab.
Step 7. Select the Build Metrics
The Metrics tab is shown in Fig. 16. This is where you select the build objectives and
conditions that will guide the build process. Strategies are ranked during the genetic
programming process according to the fitness, which is a combination of the build objectives
and conditions selected on this tab. The objectives are metrics that you want to minimize
(e.g., drawdown) or maximize (e.g., net profit). The conditions are expressed as inequality or
equality statements, such as a correlation coefficient greater than or equal to 0.95 or the
number of trades between 100 and 300. The third list box is for selecting conditions for
filtering the strategies for the Top Strategies results. Use the buttons adjacent to each list to
add, modify, or remove entries from the list.
Step 8. Choose the Build Options
The Build Options tab is shown in Fig. 17. Different options that influence the build process
are selected on this tab. For example, this is where you enter the population size and the
number of generations. You can also choose to have the build process automatically check
the out-of-sample results periodically after each specified number of generations and
reinitialize the population if the selected metric is not met. For example, the selection shown
in Fig. 17 will rebuild if the out-of-sample net profit for the highest ranked strategy is less
than zero after each five generations.
You can also modify the crossover and mutation percentages, tree depth, and tournament size
on this tab. These options are discussed further in the next chapter. To incorporate the best
strategies from the prior build into the next build, uncheck the Reset on Build box before
building. This will cause Builder to initialize the population with the saved strategies from
the prior build. The number of saved strategies is specified using the “Save [] best strategies”
option. If the Reset on Build box is checked, the population will be initialized randomly.
After making the preceding settings, it’s good practice to save them by selecting Save Project
from the File menu. This will prompt you to select or enter a file name for saving all the
settings you’ve made up to this point. The resulting file will have the file extension
“.gpstrat”. This file will not include the price data but will save the name and location of the
text file containing the price data. To return to the project file later, open it by selecting it
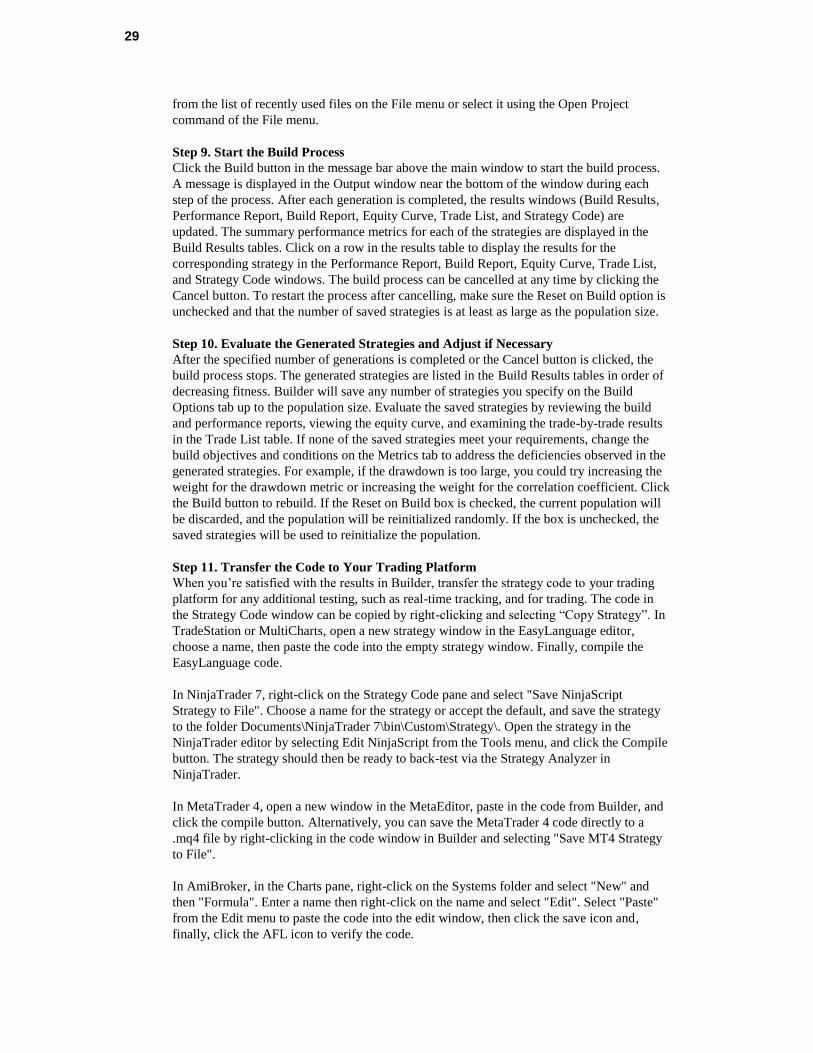
29
from the list of recently used files on the File menu or select it using the Open Project
command of the File menu.
Step 9. Start the Build Process
Click the Build button in the message bar above the main window to start the build process.
A message is displayed in the Output window near the bottom of the window during each
step of the process. After each generation is completed, the results windows (Build Results,
Performance Report, Build Report, Equity Curve, Trade List, and Strategy Code) are
updated. The summary performance metrics for each of the strategies are displayed in the
Build Results tables. Click on a row in the results table to display the results for the
corresponding strategy in the Performance Report, Build Report, Equity Curve, Trade List,
and Strategy Code windows. The build process can be cancelled at any time by clicking the
Cancel button. To restart the process after cancelling, make sure the Reset on Build option is
unchecked and that the number of saved strategies is at least as large as the population size.
Step 10. Evaluate the Generated Strategies and Adjust if Necessary
After the specified number of generations is completed or the Cancel button is clicked, the
build process stops. The generated strategies are listed in the Build Results tables in order of
decreasing fitness. Builder will save any number of strategies you specify on the Build
Options tab up to the population size. Evaluate the saved strategies by reviewing the build
and performance reports, viewing the equity curve, and examining the trade-by-trade results
in the Trade List table. If none of the saved strategies meet your requirements, change the
build objectives and conditions on the Metrics tab to address the deficiencies observed in the
generated strategies. For example, if the drawdown is too large, you could try increasing the
weight for the drawdown metric or increasing the weight for the correlation coefficient. Click
the Build button to rebuild. If the Reset on Build box is checked, the current population will
be discarded, and the population will be reinitialized randomly. If the box is unchecked, the
saved strategies will be used to reinitialize the population.
Step 11. Transfer the Code to Your Trading Platform
When you’re satisfied with the results in Builder, transfer the strategy code to your trading
platform for any additional testing, such as real-time tracking, and for trading. The code in
the Strategy Code window can be copied by right-clicking and selecting “Copy Strategy”. In
TradeStation or MultiCharts, open a new strategy window in the EasyLanguage editor,
choose a name, then paste the code into the empty strategy window. Finally, compile the
EasyLanguage code.
In NinjaTrader 7, right-click on the Strategy Code pane and select "Save NinjaScript
Strategy to File". Choose a name for the strategy or accept the default, and save the strategy
to the folder Documents\NinjaTrader 7\bin\Custom\Strategy\. Open the strategy in the
NinjaTrader editor by selecting Edit NinjaScript from the Tools menu, and click the Compile
button. The strategy should then be ready to back-test via the Strategy Analyzer in
NinjaTrader.
In MetaTrader 4, open a new window in the MetaEditor, paste in the code from Builder, and
click the compile button. Alternatively, you can save the MetaTrader 4 code directly to a
.mq4 file by right-clicking in the code window in Builder and selecting "Save MT4 Strategy
to File".
In AmiBroker, in the Charts pane, right-click on the Systems folder and select "New" and
then "Formula". Enter a name then right-click on the name and select "Edit". Select "Paste"
from the Edit menu to paste the code into the edit window, then click the save icon and,
finally, click the AFL icon to verify the code.

30
To test the strategy in TradeStation/MultiCharts, insert it into the corresponding chart, such
as the chart used to generate the price data file for analysis, and set the ”Maximum number of
bars study will reference” (in TradeStation, Format Strategies, Properties for All) to the
MaxBarsBack value listed in the Build Results table.
In MultiCharts, the value is entered under Format Signal, Properties ("Maximum number of
bars study will reference"). This ensures that the strategy has enough data to start calculating
the indicators at the beginning of the chart.
In NinjaTrader, this value is entered on the Backtest tab of the Strategy Analyzer window
("Min. bars required").
In MetaTrader 4, select the strategy (Expert Advisor) on the Tester window (Settings tab),
and select the symbol and date range. For best results in MetaTrader, select "Every tick" as
the Model, then click the Start button to run the back-test.
In AmiBroker, right-click on the strategy in the Systems folder of the Charts pane and select
"Analysis". On the Analysis window, reset the parameter values by clicking on the
Parameters icon, and check the settings by clicking on the Settings icon. Finally, click the
Backtest icon to run the test.
Note: If you're pasting the strategy code over the code for an existing strategy, it will be
necessary to reset the input values before running the back-test. In TradeStation, delete the
strategy from the chart and re-insert it to reset the input values. In MetaTrader 4, this can be
done by clicking the Expert properties button on the Tester window and clicking the Reset
button on the Inputs tab. In AmiBroker, click the Parameters icon on the Analysis window
and click "Reset all".
To insure that you get the same results in the trading platform as in Builder, make sure that
the basic settings, such as trading costs and point value, are set correctly. For example, in
TradeStation, costs should be set to one-half the value in Builder since Builder deducts costs
on a round-turn basis, whereas TradeStation deducts costs per-side. Also make sure the start
and end dates of the chart are the same as in Builder and that the MaxBarsBack value in
TradeStation/MultiCharts is the same. Slight differences may still occur, due primarily to
slight calculation differences. Because the series of trades in a backtest are rarely
independent from one another, when one trade exits at a different bar, it can cause
subsequent trades to enter and exit at different prices as well. See the section Common
Questions (Usage Topics) for more information on possible sources of difference between
the results in Builder and those in the trading platform.
To get help on any feature or command while using Builder, press F1 at any time.
The remaining chapters discuss the settings and features of Builder in detail.
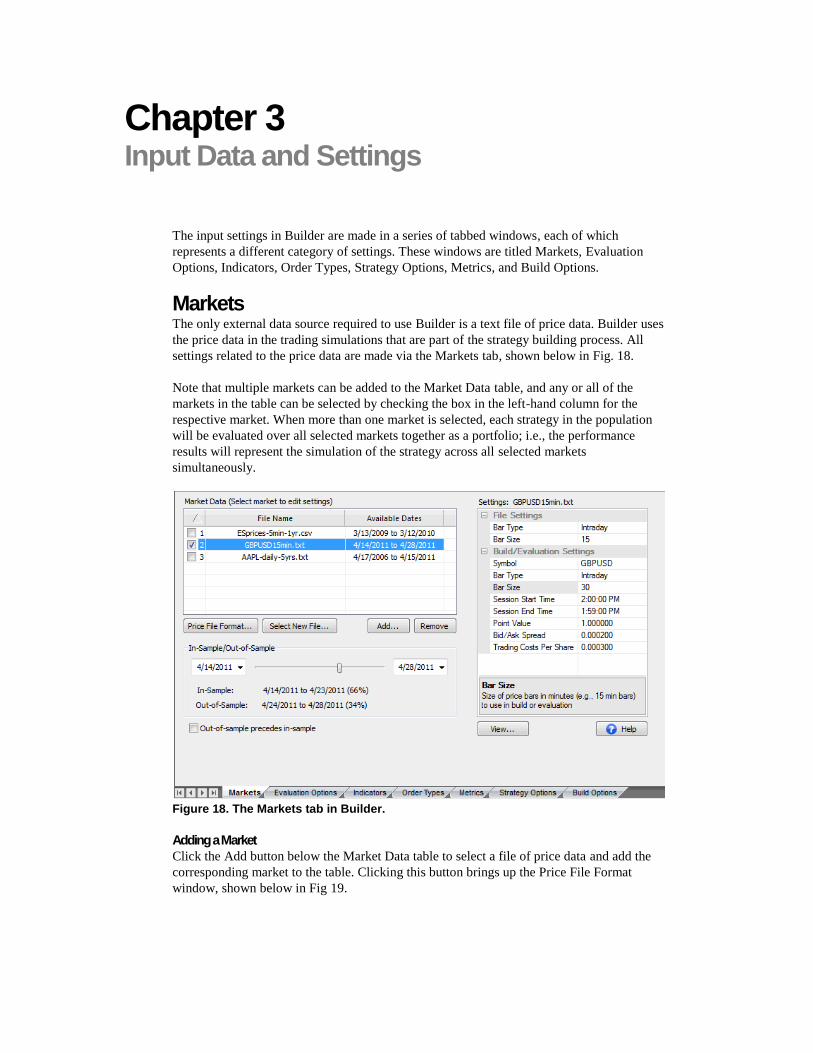
Chapter 3 Input Data and Settings
The input settings in Builder are made in a series of tabbed windows, each of which
represents a different category of settings. These windows are titled Markets, Evaluation
Options, Indicators, Order Types, Strategy Options, Metrics, and Build Options.
Markets The only external data source required to use Builder is a text file of price data. Builder uses
the price data in the trading simulations that are part of the strategy building process. All
settings related to the price data are made via the Markets tab, shown below in Fig. 18.
Note that multiple markets can be added to the Market Data table, and any or all of the
markets in the table can be selected by checking the box in the left-hand column for the
respective market. When more than one market is selected, each strategy in the population
will be evaluated over all selected markets together as a portfolio; i.e., the performance
results will represent the simulation of the strategy across all selected markets
simultaneously.
Figure 18. The Markets tab in Builder.
Adding a Market
Click the Add button below the Market Data table to select a file of price data and add the
corresponding market to the table. Clicking this button brings up the Price File Format
window, shown below in Fig 19.

32
Price File Format Window
The Price File Format window is used to specify the format of the file of price data. To speed
data loading, Builder only displays the first 200 lines of the price file in the table at the top of
the window by default. To see all the lines in the file, uncheck the box below the table
labeled "Display first 200 lines only".
The column headings identify the type of data contained in each column, which can be one
of the following: date, time, open, high, low, close, volume, up-tick volume, down-tick
volume, indicator, or "don't read/ignore". At a minimum, a price file should contain columns
for the date and the closing price of each bar. To take advantage of all the features of Builder,
a price file should contain the date, time, open, high, low, close, and volume (or up-tick and
down-tick volumes). If the date and time are together in one field (e.g., 11/5/2012 13:15 or
20090531 13:15), the field should be labeled "date" and no "time" field should be present.
Figure 19. The Price File Format window allows you to specify the format of the file of
price data.
Builder is designed to read files of price data in several text file formats. An example of this
data format, as obtained from the TradeStation Data Window, is shown below.
"Date","Time","Open","High","Low","Close","Up","Down"
06/15/2009,0640,504.60,505.10,500.90,503.00,3655,3577
06/15/2009,0650,503.00,503.80,496.60,497.60,5245,6854
06/15/2009,0700,497.70,499.10,496.70,499.00,2275,2029
06/15/2009,0710,498.80,498.80,497.00,497.80,1980,2202
06/15/2009,0720,497.90,498.70,496.50,497.30,2153,2274
06/15/2009,0730,497.20,497.60,496.60,497.00,1453,1411
06/15/2009,0740,496.90,497.00,493.40,493.80,3057,4165
These data are stored in comma-delimited format, in which commas separate the different
fields (date, time, open, high, low, etc.). Other field delimiters can be selected by checking
the boxes below the table. Builder can read files delimited by commas, semi-colons, tabs, or

33
spaces. When a new delimiter is selected, the table will be redrawn. If you're not sure how
your data file is delimited, try the different delimiters until the fields are displayed in separate
columns.
The “Up” and “Down” fields are the up and down tick data for intraday bars. For other bar
types, a single volume field will be present. Builder does not use open interest.
To change the label for any column, click on the column heading and select the appropriate
label from the pop-up window. Select "don't read/ignore" to have the program skip over a
column of data; this corresponds to a blank column heading.
If the volume is not specified, it is set to zero. If any price field is not specified, it is set to the
closing price. For example, if only the close is available, the open, high, and low are set to
the close on each bar.
If the price file includes columns for both the up-tick and down-tick volume, check the box
"Set volume to sum of up-tick and down-tick volumes" below the table of price data to
combine the two volume fields for the total volume. Generally speaking, the two fields
should be combined in order for volume-based indicators to evaluate properly. If it appears
that a volume-based indicator is not evaluating properly, try deselecting this option.
The first line of the price file can contain an optional line of text labels, which is skipped
over if found.
Data Format Pull-Down Menu
Above the table of price data is an option to change how the program interprets the data it
finds in the price file. The Data Format pull-down menu defaults to "English (United States)"
format, which means dates are assumed to be given as MM/DD/YYYY, prices use a comma
as the digit grouping symbol and a period as the decimal symbol (e.g., 1,000.01), among
other conventions. If the data file employs other conventions, a different selection can be
made using this pull-down. For example, to accommodate dates in the format
DD/MM/YYYY, the format can be changed to "English (United Kingdom)". For reading
data exported from MetaTrader 4, use "French (Switzerland)".
Clear Column Headings Button
The Clear Column Headings button removes all column headings from the table of price data
and removes all custom indicator specifications from the table of custom indicators. This
button can be used to initially clear the default column formatting prior to setting up the
column headings and custom indicator settings. If you inadvertently remove key settings,
such as custom indicator details, click the Cancel button to close the window without saving
any changes.
Custom Indicators
Builder can include custom indicators in the build process. To use this feature, it's necessary
to provide a column in the price file with the custom indicator value for each bar. In
TradeStation and MultiCharts, this can be done by plotting the indicator on the price chart
and saving the chart data to a text file. This adds a column to the text file with the indicator
values.
To include the indicator in the build process, click on the column heading in the "Price file
contents" table of the Price File Format window and select "Indicator" as the column
heading. This will label the corresponding column as "Indicator 1", "Indicator 2", etc., as
shown in Fig. 19. This also adds an entry to the Custom Indicators table, located below the
table of price data in the Price File Format window.

34
Builder needs to know two things about each custom indicator you want to use: (1) the code
statement needed to calculate the indicator values when the strategy is run, and (2) the return
type of the indicator. For example, in Fig. 19, indicator #1 uses the code statement
"MyCustInd1(C, 15, 100, 1)." This is the code that will be included in the strategies
generated by Builder in which the custom indicator is used. This code should correspond to
the indicator values in the price file. For example, evaluating the code statement
MyCustInd1(C, 15, 100, 1) in a strategy should produce the values shown in the price file
under the column labeled Indicator 1.
Note: If a custom indicator cannot be represented in the target language using a single
function call, there are two options for using the custom indicator in Builder: (1) re-write the
indicator so that it's values are generated by a single function call, or (2) edit the strategy
code generated by Builder after the build process is complete.
The return type for Indicator 1 in Fig. 19 is "Price". This means the values produced by the
indicator are equivalent to the symbol's price, such as the close, open, high, etc. The table
below lists the different allowable return types with examples of common indicators that
return that type.
Return Type Definition/Examples
Price Any market price; C, Average(C, N), Highest(L, N), Keltner
Price difference Difference between two prices; MACD, momentum, H - L, ATR
Price rate of change Ratio of two prices (price 1/price 2); ROC
Oscillator, 0 - 100 Indicators scaled to return between 0 and 100; FastK, SlowD, RSI
Oscillator, -50 - +50 Indicators scaled to return between -50 and +50
ADX ADX, DMI
Volume volume, Average(volume, N)
Day of week 0 for Sunday, 1 for Monday, etc.
Time of day HHMM format; e.g., 1425 for 2:25 pm
True/false 0 for false, 1 for true
Custom User-specified min to max range; e.g., -0.1 to +0.4
The return type is used by Builder to determine which indicators can be meaningfully
compared to other indicators. It's necessary to specify the correct return type in order for the
program to properly incorporate the custom indicator into the logical conditions for entry and
exit.
For each custom indicator in the table of custom indicators, select the indicator in the table
and enter the code statement in the edit field to the right of the table and select the return
type; see Fig. 19. For any indicator with a custom return type, enter the minimum and
maximum values that the indicator can return. It's best to avoid selecting a custom return
type unless necessary because this will limit the ways in which the custom indicator can be
used in the logical conditions.
The maximum look-back length required to evaluate the custom indicator can be entered
below the fields for the custom return values. For example, in Fig. 19, the first custom
indicator looks back a maximum of 100 bars. This is the number of bars of data needed to
evaluate the indicator and should be entered as the Max Look-back Length. The look-back
lengths are used to calculate the Max Bars Back value, which is needed when inserting the
strategy into a chart in TradeStation or MultiCharts.

35
Note: Once a custom indicator has been included in a built strategy, changing the market and
re-evaluating the strategy may cause errors if the data columns for the same custom
indicators are not available in the new price file.
Note: If multiple markets (price files) are selected in the Market Data table and one file
contains custom indicators, then all price files selected in the table must contain the same
custom indicators (i.e., the same columns and specifications). Otherwise, the build process
will fail when trying to apply the custom indicator(s) to markets for which the required data
is not found.
Remove Button
Clicking the Remove button will remove the selected market from the Markets Data table.
Price File Format Button
Clicking the Price File Format button brings up the Price File Format window, as discussed
above. This can be used to change how the program reads the price file and/or to change the
specifications of any custom indicators being used in the program.
Select New File Button
Clicking the Select New File button opens a file selection dialog window that allows you to
select a new file of price data to replace the currently selected one. The settings currently in
place will be applied to the new file, including the formatting selected on the Price File
Format window. This can be used to avoid repeating the settings previously made on the
Price File Format window for a new project file. To do this, select "save as" from the File
menu to save the current project file to a new name. Open the new project file and use this
button to change the file of price data. All the settings will be applied to the new file of price
data.
Obtaining Price Data
Builder can utilize price data obtained from any source provided the file is in comma-
delimited text format and can be formatted under the Price File Format window.
TradeStation
For TradeStation users, the easiest way to obtain the price data file for use in Builder is to
save the data from a TradeStation chart window. This can be done through the Data Window.
To display the Data Window, go to the View menu in TradeStation and select Data Window
or, in TS 8 or above, right-click on a chart and select View Data Window. To save the price
data to a text file, click the disk icon on the data window, or, for TS 2000i, right-click and
select “Send to File”. In the Save-As dialog, select a file, then click the Save button. This
will save the price data for the chart window to the text file you’ve selected.
MultiCharts
In MultiCharts, select "Export Data" from the File menu to save the chart data to a text file.
NinjaTrader
In NinjaTrader, use the Export tab on the Historical Data Manager window to save the data
to a text file. The resulting file will contain 1 minute bars in semi-colon delimited format.
Check the semi-colon delimiter box on the Price File Format window after selecting the file
in Builder. Once in Builder, the bar type and size can be changed using the settings in the
Build/Evaluation Settings section of the Settings window, as explained below.

36
MetaTrader 4
In MetaTrader 4, go to the Tools menu and select History Center. Select the symbol from the
list at left and click the Export button. On the Price File Format window, select "French
(Switzerland)" from the Data Format pull-down menu.
Third-Party Data Providers. If you obtain your price data from a data vendor, the vendor
should have a software program that can be used to export the data to different formats and
bar sizes. Builder requires data in a text file format, such as csv or txt files. Once in Builder,
the bar type and size can be changed using the settings in the Build/Evaluation Settings
section of the Settings window, as explained below.
Market Settings
Multiple price files can be added to the Markets tab, and any number or all of them can be
selected for building. For example, in Fig. 18, three price files have been added and market
#2 has been selected, as indicated by the check box in the left-hand column of the Market
Data table. Once the strategy is built, it can be evaluated on other markets by checking the
corresponding rows in the table and selecting Evaluate from the Strategy menu. If more than
one market is checked, the performance results will be for the portfolio of all selected
markets.
The Available Dates column in the Markets table displays the date range for data read from
the price file. This column is for informational purposes only; it cannot be edited. To change
the range of dates used for building or evaluating a strategy, use the date controls in the In-
Sample/Out-of-Sample settings section (see below).
Selecting an entry in the Market Data table displays the settings for that market in the
Settings table to the right (see Fig. 18). Click on any entry in the Settings table to change its
value. In the File Settings section of Settings, the Bar Type and, where applicable, Bar Size
(for intraday data) or Range Bar Size (for range bars) should match the data in the file.
Builder will try to properly infer the bar type, bar size, and session times from the data file. If
any of these are incorrect, they should be manually corrected. For example, if the data in the
price file represent 5 min bars, the Bar Type should be "Intraday" and the Bar Size should be
5. For range bars, the Range Bar Size is the high-to-low range of each bar in points.
The settings in the Build/Evaluation Settings section of Settings are the settings you want to
use when building and/or evaluating a strategy. These can be different than the File Settings.
For example, if the data file contained 30 minute bars, the bar type might be changed to daily
bars for building and/or evaluating strategies on that time frame.
Symbol
A text label can be entered for the Symbol setting to help identify the market. Any valid text
string can be entered. The symbol is used in the build report, trade list, and for other display
purposes.
Bar Type, Bar Size, and Range Bar Size
These are the basic settings that determine the type of bars that will be used when building or
evaluating strategies. Clicking on the Bar Type entry will open a pull-down menu with the
following choices: Intraday, Daily, Weekly, Monthly, Tick, Range, Unknown. Intraday bars
are specified in minutes, such as 5 min bars or 60 min bars; the smallest allowable value is 1
minute. The Bar Size setting, which is only shown when the Bar Type is Intraday, should
contain the number of minutes for intraday data. Range bars represent trading within a
specified point range, such as five points. All bars in a range bar chart have the same range.
For range bars, a Range Bar Size setting will be available, which should be set to the desired
size (high-to-low range) of the bars in points.

37
The Daily, weekly, and monthly Bar Type options represent bars that span a day, week, and
month, respectively. Tick bars are built up from a specified number of transactions or ticks
and are typically used in futures trading. A single tick represents a transaction that took place
at a certain price and time. It could be for any number of contracts. Single-tick data is not a
valid input option in Builder. Tick bars contain multiple ticks so that each bar has an open,
high, low, and closing price.
Any valid bar type selection can be made, provided the price data in the file can be converted
to the selected type. Price data provided as 1 minute intraday bars allow for the most
flexibility because they can be converted to any other intraday size, as well as to range bars,
daily, weekly, and monthly bars. No data type can be converted to tick bars since none of the
data types includes information on the number of ticks in the bar.
The program will attempt to convert the available data to the selected bar type and will
display a warning message to the Output window if the conversion may not be accurate. For
example, if the price data are provided as tick bars and the selection is for 5 min bars, there is
no way to guarantee that accurate 5 min bars can be constructed because the tick bars may
not be smaller than 5 min bars and/or the tick bars may not close at the precise closing time
of the 5 min bars. As another example, converting from 3 minute bars to 10 minute bars will
not be accurate because there is no even multiple of 3 minute bars that can be used to
construct a 10 minute bar. It's the user's responsibility to make sure the selected data settings
are sufficiently accurate and that they match the data used in the target platform when
executing a strategy in real time.
Note: When selecting the range bar size for range bars, the size should be large enough
compared to the interval of the available data to capture the normal oscillations of the data.
For example, if the available price data consist of 5 min bars, the size of the range bars
should be as large as the normal range of movement that occurs within 5 minutes. Otherwise,
more range bars will be formed in real time than in back-testing.
Session Times
The Session Start Time and Session End Time settings can be used to redefine the trading
session for any bar type, provided intraday data are available that includes the selected times.
For example, these settings cannot change the session times of daily, weekly, or monthly
bars or the session times of range or tick bars that span a day or longer. Only one session is
defined in Builder for each symbol, although a combined session, such as day-plus-evening,
can be used if the session times encompass both sessions.
If the session times are changed, it's important to make sure the data used in the trading
platform exactly match the settings made in Builder. For example, if the normal session
times are 8:30 - 3:15 and are changed to 11:00 - 3:00 in Builder, the strategy should be
executed on data that use session times of 11:00 - 3:00. Otherwise, much different results
may be found in the trading platform than in Builder.
To restrict trades to a range of times, it's often better to use the trade entry and exit time
range options under Strategy Options, rather than changing the session times.
Point Value
Each symbol should have a valid point value. For example, the E-mini S&P 500 futures have
a point value of $50. This is the value that is multiplied by price to determine the value per
contract. For stocks and forex, the point value should be set to 1. Note that when forex
symbols have a point value of 1, the position size is typically 10,000 or 100,000 for one lot.
The point value setting has a default value of 1.
38
Bid/Ask Spread
The bid/ask spread is the difference between the current price buyers are willing to purchase
the instrument for and the price sellers are willing to sell it for. The bid is the lower price,
whereas the ask is the higher price. Buy orders are always filled at the ask, and sell orders are
always filled at the bid. A price chart displays the bid price only. In Builder, the bid/ask
spread is only used if the Order Fill Rule option on the Evaluation Options tab ("Use
Bid/Ask spread to determine fills") is checked. If so, market buy orders will be filled above
the apparent market price (based on the chart), whereas market sell orders will be filled at the
price seen on the chart. The bid/ask spread is part of the cost of the trade.
The bid/ask spread is intended for forex trading and is not typically used for trading futures.
When developing forex strategies for MetaTrader 4, this option should be used because
MetaTrader 4 uses the bid/ask spread when evaluating strategies. This is consistent with the
common practice in forex trading of paying for the trade through the spread rather than
paying the broker a fixed commission.
If the bid/ask option is selected, Builder also uses the bid/ask spread to determine if a
pending order is filled. For example, a buy stop order is only filled if the ask price, which is
above the chart price (bid), touches the stop price. If, for example, the price bar on the chart
just touches the stop price, it may appear that the order should be filled, but Builder won't
show the historical trade as filled unless the ask price reached the buy stop price. Similarly, a
buy limit order will not be recorded as filled unless the ask price reaches down to the buy
limit price. Sell stops and limits are filled at the bid, so, unlike buy orders, their fill prices
directly correspond to the chart prices. This is also how MetaTrader 4 determines fills.
Note: In addition to the bid/ask spread, MetaTrader 4 applies a minimum price distance to
determine if an order can be placed. If a pending order (stop or limit) is too close to the
market at the time it's placed, the order will be rejected. This is based on the idea that there
won't be sufficient time to place the order before the market moves through the order price.
Builder doesn't reject such orders, which can sometimes cause a discrepancy in back-testing
between Builder and MetaTrader 4.
Trading Costs Per Share
The Trading Costs Per Share entry represents the total trading costs (commissions, fees, and
slippage) deducted from each trade on a round-turn basis (i.e., deducted once per trade) per
share or contract. For stock and forex trades, where the point value is 1, this value would
typically be less than $1, depending on the share price (e.g., if the per-trade costs are $30 for
a lot size of 100,000, the per-share costs in Builder would be 30/100000 or 0.0003), whereas
for futures, which have point values greater than 1, the costs might be $5 - $75 per contract.
Note that TradeStation typically deducts trading costs on a per-side basis, so you should use
one-half the trading cost amount in TradeStation that you enter in Builder.
Trading costs should always be included though they need not be precise. The purpose is to
insure the strategies generated during the build process overcome trading costs. Entering a
slightly higher cost value than anticipated in reality may guide the process towards more
robust strategies. However, setting trading costs too high may prevent the program from
finding viable strategies that have a low average trade profit/loss.
In-Sample/Out-of-Sample Settings
The Markets tab also includes controls for changing the start and end dates for analysis as
well as the in-sample/out-of-sample dates. To change the start and end dates for building or
evaluating a strategy, click on the calendar controls at either end of the in-sample/out-of-
sample slider or type the desired date directly into the date box.

39
Move the slider to change the dates for in-sample and out-of-sample analysis. The in-sample
data are used in building the strategy. Out-of-sample (OOS) data are used in evaluating the
strategies following the build. Because the OOS data are not used during the build process,
the results achieved on the OOS segment are unbiased. Generally speaking, a ratio of
between three and five to one for in-sample to OOS data is recommended. When selecting
Evaluate or Evaluate All from the Strategy menu, both in-sample and OOS data are used.
The check box below the slider control (Out-of-sample precedes in-sample) allows you to
specify whether the OOS period follows the in-sample period or precedes it. Some traders
prefer to perform OOS testing on data following the in-sample period, whereas others prefer
to perform the OOS testing on data prior to the in-sample period. Leave the box unchecked
to perform OOS testing on data following the in-sample period or check the box to perform
OOS testing on data prior to the in-sample period.
There can only be one OOS period at a time. Builder stores the dates for the in-sample period
over which the strategies were built. Once the strategies in a given project file (.gpstrat) have
been built, these build dates cannot be changed unless you rebuild the strategies. If you
change the start and end dates after building and select Evaluate from the Strategy menu,
Builder will use the stored build dates to determine the dates for the in-sample and OOS
periods. If by changing the start and end dates, the date range is extended both before and
after the build (in-sample) period, there may be two OOS periods, one prior to the build dates
and one following them. Because the program can only have one OOS period, it will use the
larger of the two periods when reporting and plotting the OOS results.
If multiple market have been selected in the Market Data table, the date range selections
apply to all markets. The default dates shown in the calendar controls represent the earliest
starting date and latest ending date over all selected markets.
View Button
Click the View button to display a window listing the data that have been read. The Price
Data window displays the data in the format selected in the Build/Evaluation Settings section
of the Settings window. For example, if the data file contains 1 minute bars, but the Bar Type
under Build/Evaluation Settings has been changed to Range, range bars will be shown in this
window.
This window also allows you to save the data to a csv (comma-delimited text) file via the
File menu or copy the data to the clipboard via the Edit menu. If the Copy command is
chosen, the data will be copied in tab-delimited format, which permits it to be pasted directly
into a spreadsheet.
Evaluation Options When a strategy is evaluated, the program applies the options on the Evaluation Options tab,
shown in Fig. 12 in the previous chapter. Most of the options on this tab are for position
sizing.
In addition to position sizing, you can choose the type of code output on this tab. Select
TradeStation/MultiCharts for TradeStation version 6 and above and for recent versions of
MultiCharts, TS 2000i for TradeStation version 2000i, NinjaTrader for NinjaScript code for
NinjaTrader 7, MetaTrader 4 for MQL4 code, or AmiBroker for AFL code. The code for
all of the saved strategies listed in the Build Results table is stored in the project file
(extension .gpstrat). If you want to generate code for a different platform, change the
selection here, select the desired strategy from the Build Results table, and select Evaluate

40
from the Strategy menu. The code will be re-written for the new code type as part of the
evaluation process.
Note: As shown in Table 1, not all indicators are available for all code types. Also, some
indicators give different results in each platform. For this reason, the same results may not be
found if the code type is changed and the strategy is re-evaluated. Also, if an indicator is not
available for one platform, converting to a different code type may result in invalid code.
This can also happen due to indicator nesting, which is unavailable in MetaTrader 4.
In the section "Input Options" under the position sizing section, there are two check boxes.
The option "Apply stress tests and display Monte Carlo results" optionally evaluates the
strategy results using the stress testing and Monte Carlo options on the Build Options tab; see
the section Stress Testing and Monte Carlo Analysis under Usage Topics for a more detailed
explanation of the stress testing process. Briefly, stress testing involves evaluating the
strategy multiple times, each time under slightly different conditions; for example, using
randomized prices or randomized input parameter values. When stress testing, the different
evaluations are combined using Monte Carlo analysis, and the results are reported at the
confidence level specified on the Build Options tab.
The option "Evaluate intraday strategies at optimal bar size if applicable" works in
conjunction with the option on the Strategy Options tab to try different bar sizes for intraday
data when building. If that option is selected, the option here will evaluate the strategy using
the optimal intraday bar size found during the build process. On the other hand, if the option
in this section is unchecked, the strategy will be evaluated using whichever market data
settings are currently in place in the Settings table on the Markets tab. This option has no
effect unless the strategy being evaluated has an optimal intraday bar size found from using
the option to try different intraday bar sizes.
The "Order Fill Rules" on this tab affect how simulated trading orders are filled during back-
testing. The limit order rule only fills limit orders when the limit price is exceeded. If
unchecked, limit orders will be shown as filled when the limit price is touched. For strategies
applied to small bars, such as 1 minute or tick bars, it will usually be more accurate to
assume that a limit order is not filled unless the limit price is exceeded. In practice, a limit
order may not be filled if the limit price is only touched because there may be insufficient
volume to fill all the orders at that price or better. Therefore, it's prudent to select this option
when the volume on a typical price bar is expected to be small.
The bid/ask rule uses the bid/ask spread to determine fill prices and whether or not stop and
limit orders are filled. The default setting is "on", which will generally give more accurate
results. Since MetaTrader 4 uses the bid/ask spread in this manner, this option should always
be selected when building and evaluating strategies for MetaTrader 4. Please see Input Data
and Settings, Markets, Market Settings for more information on the bid/ask spread.
The option "Fill limit order no better than limit price" prevents a limit order from being filled
at a more favorable price due to a gap opening. For example, if an order to buy on a limit is
in effect and the next bar opens below the limit price, it's possible that you would get filled at
or near the open of the bar, which would be a more favorable fill than the order price.
However, it's also possible that the order would not be filled until the market went back up to
your order price. This option assumes the worst-case scenario of being filled at no better than
the order price. Selecting this option will provide conservative fill estimates for limit orders.
The options on this tab are applied whenever a strategy is evaluated, which means not just
when building the strategy but also when selecting the Evaluate or Evaluate All commands.
As a result, you can change the options on this tab, such as an order fill rule or the code
output option, and re-evaluate an existing strategy to see the effect. Re-evaluating a
41
strategy recalculates the performance results and rewrites the code without changing
the strategy itself.
The same is true for position sizing. To see how different position sizing settings would
affect the results, change the position sizing here and select Evaluate from the Strategy menu.
To return to the position sizing that was selected or evolved with the strategy when it was
built, click the "Reset to Build Settings" button in the position sizing section. Then select
Evaluate from the Strategy menu to rewrite the code and re-calculate the results.
Position Sizing
Position sizing determines how many shares or contracts are traded on each trade. Builder
includes six different position sizing methods. The position sizing method used to evaluate a
strategy is also implemented in the strategy code generated by Builder, so that when running
the code in the trading platform, the same position sizing should be seen as in Builder.
You can optionally choose to have Builder evolve the position sizing as part of the build
process. If you check the box "Let build process evolve position sizing", then Builder will
apply the sub-option selected below that. You can either elect to have the program evolve
both the position sizing method (i.e., one of the six available methods) along with the
associated parameter value ("Method and parameter value"), or have the program evolve
only the parameter value ("Parameter value only") while using the position sizing method
selected under "Position Sizing Method".
The six available position sizing methods are as follows:
Fixed size. This method simply uses whatever value you provide as the number of shares or
contracts for each trade. A fixed size of 1, for example, will trade one contract or share for
each trade. For forex trading, a typical fixed size would be either 10000 or 100000. It's
important to set the "Maximum number of shares/contracts strategy is allowed to trade" to a
value at least as big as the fixed size entered here.
Constant value. With constant value position sizing, each position is sized so that it has a
specified value, such as $1000 per trade. This method can be used when you want to allocate a
specified amount of equity to each trade. The constant value method will determine the
number of shares or contracts corresponding to your specified amount. For example, if you
plan to purchase a stock at a price of $25 and you want to spend $35,000, you would trade
35000/25 or 1400 shares. In this case, the constant value amount is 35000; each trade will be
sized so that the position value is $35,000.
Percent of equity. In this method, the number of shares or contracts is chosen so that the
value of the position is equal to the selected percent of account equity. For example, if the
percent of equity is 40%, the position size will have a value equal to 40% of the account
equity. If the account equity were $30,000, the position would have a value of 0.4 x 30000 or
$12,000. If the share price were $25, the position size would be 12000/25 or 480 shares. In
other words, a position size of 480 shares at $25 per share has a value of $12,000, which is
40% of the equity value of $30,000.
Fixed fractional. In fixed fractional position sizing, the number of shares or contracts is based
on the risk of the trade. For example, you might risk 2% of account equity on each trade.
Fixed fractional position sizing has been written about extensively by Ralph Vince. See, for
example, his book "Portfolio Management Formulas," John Wiley & Sons, New York, 1990.
The risk of a trade is defined as the dollar amount that the trade would lose per contract or
share if it were a loss. In Builder, the trade risk is taken as the size of the money management

42
stop applied, if any, to each trade. If the strategy doesn’t use protective (money management)
stops, the trade risk will be taken as the largest historical loss per contract or share. The largest
loss is the largest loss up until the point at which the trade is taken. If subsequent losses are
larger, the trade risk will be larger for subsequent trades.
As an example, consider a stock trading system that uses a 2 point stop. It might enter long at
a price of 48 with a sell stop at 46. The risk per share would be $2. With a fixed fraction of
5% and account equity of $20,000, fixed fractional position sizing would risk 0.05 * 20000
or $1,000 on the next trade. Since the risk per share is $2, this means 1000/2 or 500 shares
would be traded.
Fixed ratio. In fixed ratio position sizing the key parameter is the delta. This is the amount of
profit per share or contract to increase the number of shares or contracts by one. A delta of
$3,000, for example, means that if you're currently trading one contract, you would need to
increase your account equity by $3,000 to start trading two contracts. Once you get to two
contracts, you would need an additional profit of $6,000 to start trading three contracts. At
three contracts, you would need an additional profit of $9,000 to start trading four contracts,
and so on. Fixed ratio position sizing was developed by Ryan Jones in his book "The Trading
Game," John Wiley & Sons, New York, 1999.
Normally, the delta is the amount per share or contract, as in the example above. For some
instruments, such as forex, this would be inconvenient because forex uses a point value of 1
and typically trades in increments of 10,000 or 100,000 shares. To accommodate this, the
delta is specified per multiples of shares when the option to round the share size to the nearest
number of shares (see below) is selected. For example, if the "round to.." option is selected
with an increment of 10,000 shares (i.e., "Round position size to nearest 10,000 shares"), then
the delta would be specified as the amount per 10,000 shares.
The fixed ratio method will start trading with a position size equal to the minimum number of
shares/contracts specified on this tab (see below). For example, if the minimum number of
shares for a forex strategy is set to 10,000, this will be the position size calculated by the fixed
ratio method for a profit of zero. As profits are accrued, the position size will increase, based
on the delta, in increments specified by the "round to.." option.
Fixed amount per share. In this position sizing method, you choose the amount of account
equity required to trade each share or contract. For example, if the dollar amount is $5,000,
you would trade one contract for every $5,000 in the account. If the account equity is
currently $50,000, the position size would be 10 contracts for the next trade.
When Builder evaluates a strategy, it tracks the account equity and simulates how the account
equity changes from trade to trade, starting with the first date in the trading period and
accumulating the profits and losses up through the last date in the date range. The starting
equity value, shown on this tab, is the value of the simulated trading account at the start of
trading. The default value of starting equity is $100,000. As the equity changes, the position
size will generally change as well. In all position sizing methods except for fixed size and
constant value, the position size increases as the account equity rises and decreases when the
account equity drops.
Note: When building over multiple market together (i.e., a portfolio), the same position sizing
(including parameter values) is used for each market. Also, the portfolio equity is used in the
position sizing calculations. This is the accumulated equity from trading over all markets in
the portfolio.

43
Under Position Sizing Options, you can enter the minimum number of shares or contracts that
the strategy will trade. This value, which defaults to 1, is applied to all trades. After the
position size is calculated, the position size is increased to the minimum if the position size
would otherwise fall below the minimum. Likewise, you can enter the maximum number of
shares or contracts that can be traded. This limit, which defaults to 100, is applied to all trades.
After the position size is calculated, the position size is reduced to the limit if the position
size would otherwise exceed the limit.
There is also an option to round the position size to the nearest number of shares or contracts.
For example, if you enter a value of 100, the number of shares will be rounded to the nearest
100 shares. The default value is 1. For forex trading, this can be used to trade in even lot sizes
of 10,000 or 100,000 by setting the rounding value to 10,000 or 100,000, respectively. In this
case, the minimum number of shares should be set to the same value, and the maximum value
to some multiple of the minimum.
Indicators and Order Types Indicators are selected on the Indicators tab, shown in Fig. 13 in the previous chapter. The
available order types are listed on the Order Types tab, as shown in Fig. 14. The tables on
these two tabs represent the build set, which contains the indicators and order types that the
program draws from during the genetic programming process. To remove a specific indicator
or type of order from the build set, click the corresponding row in the Consider column of the
table. To restore the previous settings, click the Reset button. To include all items for
consideration during the build process, click the "Consider All" button, which will place an
"X" in the Consider column for each item. To remove all items from consideration, click the
"Consider None" button. Removing an indicator or order type from the build set means it
won’t be considered by the program when constructing strategies. Removing too many items
may reduce the likelihood of finding viable strategies. The list of indicators is shown in
Table 1 in Chapter 1. The indicators themselves are described in the appendix. The different
types of entry and exit orders were discussed in Chapter 1.
The table of order types on the Order Types tab includes a column labeled "Include".
Clicking an order type in the Include column ensures that the order type will be included in
each generated strategy. For example, to make sure each strategy includes a protective
(money management) stop, click the Include column entry for one of the Protective Stop
order types.
Note: If an indicator or order type is not available for the chosen trading platform, as
determined from the code output selection on the Evaluation Options tab, the table entry will
be grayed-out and will not be available for selection.
Strategy Options The Strategy Options tab is shown in Fig. 15 in the previous chapter. The settings on this tab
control the types of strategies generated by Builder. Note that if any option is grayed-out, it is
not available for the chosen code type.
Market Sides
This option allows you to restrict entries to either long-only, short-only, or both long and
short trades.
Trading Logic Options
The Long/Short Symmetry option, if checked, constructs the short-side entry condition by
logically reversing the rule for the long side. This will reduce the system complexity, which

44
may increase the reliability of the strategy. However, some markets have a clear directional
bias, such as stock indexes, which tend to have an upward bias. In such cases, it may be
better to use different rules for long and short trades.
For intraday strategies, you can specify the maximum number of trade entries per day by
checking the box Limit entries per day to [] and entering the desired maximum number of
daily entries in the box. Limiting the number of entries per day can often improve results for
intraday strategies because it reduces the number of different market conditions that must be
accommodated.
Entry times for intraday trades can be restricted to a time range using the Trade entry
option. Enter the starting and ending times using the time selectors. This will restrict entries
to the time range chosen. To force trades to exit by a certain time, enter the desired exit time
in the Exit after option. If an intraday trade is open at that time, it will be closed at market
on the next bar. The Exit after option uses the "Exit at Time" order type, as shown on the
Order Types tab. Consequently, selecting this option also selects the "Exit at Time" order
type. If you subsequently de-select this order type on the Order Types tab, you will have to
select the Exit after option again to re-establish it.
The option to Wait for exit before entering new trade is checked by default. This adds an
entry condition that only allows an entry if the current position is flat. If this option is
unchecked, a long entry may reverse a short position and vice-versa. Uncheck this option to
create "stop and reverse" strategies that are always in the market, either long or short.
The option to Apply protective stops on entry bar immediately applies the protective stop
order upon trade entry. This means the protective stop will be applied on the bar of entry,
rather than waiting until the close of the bar like most orders. In TradeStation, selecting this
option applies the protective stop order using the SetStopLoss EasyLanguage command. This
option only applies to existing protective stop orders; it does not add a protective stop if one
does not already exist. Also, because this option must accommodate the SetStopLoss
command in EasyLanguage, it uses the same size stop for both long and short trades.
Indicator nesting can be turned on or off using the option Allow nested indicators where
applicable. If checked, this option allows strategies built for EasyLanguage to take other
indicators as input, such as Momentum(TriAverage(L, N1), N2). The number of levels of
nesting is determined by the tree depth, which is determined for each strategy during the
build process. Indicator nesting is not available for MetaTrader 4 strategies. In this case, the
option is ignored.
A neural network can be included in each strategy by selecting the option Include a neural
network in entry conditions. As explained in the section Neural Networks in Chapter 1,
Introduction, a neural network is a nonlinear function of one or more inputs, which Builder
will select and evolve along with the entry and exit conditions if this option is included. The
output of the neural network will supplement the entry conditions. Click the button Neural
Network Settings to select the settings that affect the definition of the neural networks, as
shown below in Fig. 20. Please refer to Chapter 1 for more information.
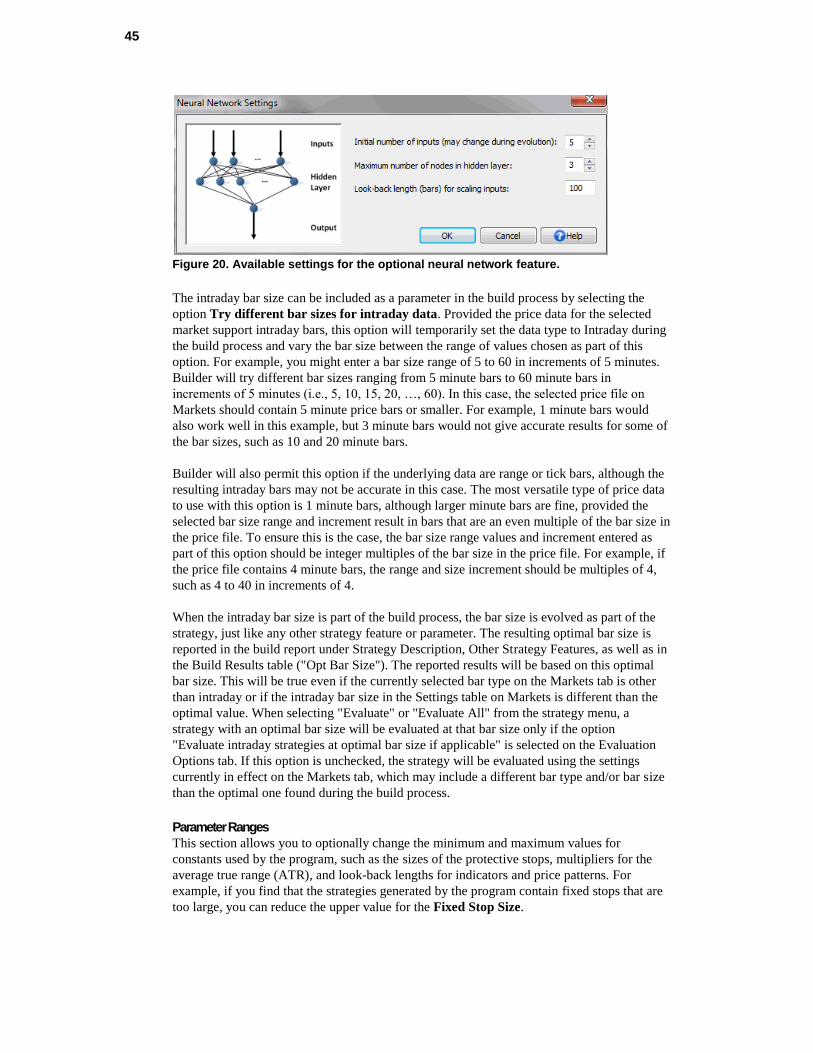
45
Figure 20. Available settings for the optional neural network feature. The intraday bar size can be included as a parameter in the build process by selecting the
option Try different bar sizes for intraday data. Provided the price data for the selected
market support intraday bars, this option will temporarily set the data type to Intraday during
the build process and vary the bar size between the range of values chosen as part of this
option. For example, you might enter a bar size range of 5 to 60 in increments of 5 minutes.
Builder will try different bar sizes ranging from 5 minute bars to 60 minute bars in
increments of 5 minutes (i.e., 5, 10, 15, 20, …, 60). In this case, the selected price file on
Markets should contain 5 minute price bars or smaller. For example, 1 minute bars would
also work well in this example, but 3 minute bars would not give accurate results for some of
the bar sizes, such as 10 and 20 minute bars.
Builder will also permit this option if the underlying data are range or tick bars, although the
resulting intraday bars may not be accurate in this case. The most versatile type of price data
to use with this option is 1 minute bars, although larger minute bars are fine, provided the
selected bar size range and increment result in bars that are an even multiple of the bar size in
the price file. To ensure this is the case, the bar size range values and increment entered as
part of this option should be integer multiples of the bar size in the price file. For example, if
the price file contains 4 minute bars, the range and size increment should be multiples of 4,
such as 4 to 40 in increments of 4.
When the intraday bar size is part of the build process, the bar size is evolved as part of the
strategy, just like any other strategy feature or parameter. The resulting optimal bar size is
reported in the build report under Strategy Description, Other Strategy Features, as well as in
the Build Results table ("Opt Bar Size"). The reported results will be based on this optimal
bar size. This will be true even if the currently selected bar type on the Markets tab is other
than intraday or if the intraday bar size in the Settings table on Markets is different than the
optimal value. When selecting "Evaluate" or "Evaluate All" from the strategy menu, a
strategy with an optimal bar size will be evaluated at that bar size only if the option
"Evaluate intraday strategies at optimal bar size if applicable" is selected on the Evaluation
Options tab. If this option is unchecked, the strategy will be evaluated using the settings
currently in effect on the Markets tab, which may include a different bar type and/or bar size
than the optimal one found during the build process.
Parameter Ranges
This section allows you to optionally change the minimum and maximum values for
constants used by the program, such as the sizes of the protective stops, multipliers for the
average true range (ATR), and look-back lengths for indicators and price patterns. For
example, if you find that the strategies generated by the program contain fixed stops that are
too large, you can reduce the upper value for the Fixed Stop Size.

46
The range for fixed size stops is given in the currency in which the account is denominated.
For example, for US dollar-denominated accounts, you might choose a range of stop sizes
from 100 to 1000, representing stop sizes from $100 to $1000.
Note that the size of a fixed sized stop is per share or contract, not per trade. A default range
for the fixed sized stops is calculated automatically based on multiples of the average true
range (ATR) for the selected price series. The lower limit is based on a multiple of 0.25 of
the ATR, rounded down to the nearest tick, and the upper limit is based on a multiple of 4.0
of the ATR, rounded down to the nearest tick. If you change from the default values, you can
revert to them by clicking the Use Defaults button. If multiple markets have been selected,
the range is based on the current selection, which is the market last clicked on. To see if the
range changes significantly for other markets, click on a different market in the Market Data
table and click the Use Defaults button.
The range of values for ATR Multiple is used when constructing ATR-based protective
stops, entry orders based on price differences (ATR, true range, or the difference between
two price-based indicators), and trailing stops.
The different types of protective stops are discussed in Chapter 1, Order Types.
The parameter range for Lookback, Indicators applies to all indicators requiring a lookback
length with the exception of price patterns; e.g., the averaging length of a moving average.
The lookback length for price patterns is chosen from the range of values given by
Lookback, Price Patterns. This applies to individual prices; i.e., it’s the “N” in O[N], H[N],
L[N], and C[N].
Whether or not an indicator is shifted depends on the Probability of Applying Indicator
Shift. A shifted indicator returns the value N bars ago, where N is the shift. For example, in
EasyLanguage, XAverage(C, 14)[N] returns the value of the exponential moving average N
bars ago. If the probability is set to 20%, for example, there is a 20% chance that any
indicator that can be shifted will be shifted. The shift value itself is chosen from the indicator
look-back parameter range. Set the probability to 0% to turn indicator shifting off.
Metrics The Metrics tab is shown in Fig. 16 in the previous chapter. This is where you select the
build objectives and conditions that will guide the build process. Strategies are ranked during
the genetic programming process according to the fitness, which is a combination of the
build objectives and conditions selected on this tab. The objectives are metrics that you want
to minimize (e.g., drawdown) or maximize (e.g., net profit). The conditions are expressed as
inequality or equality statements, such as a correlation coefficient greater than or equal to
0.95 or complexity less than or equal to 10. The third list box is for selecting conditions for
filtering the strategies for the Top Strategies results.
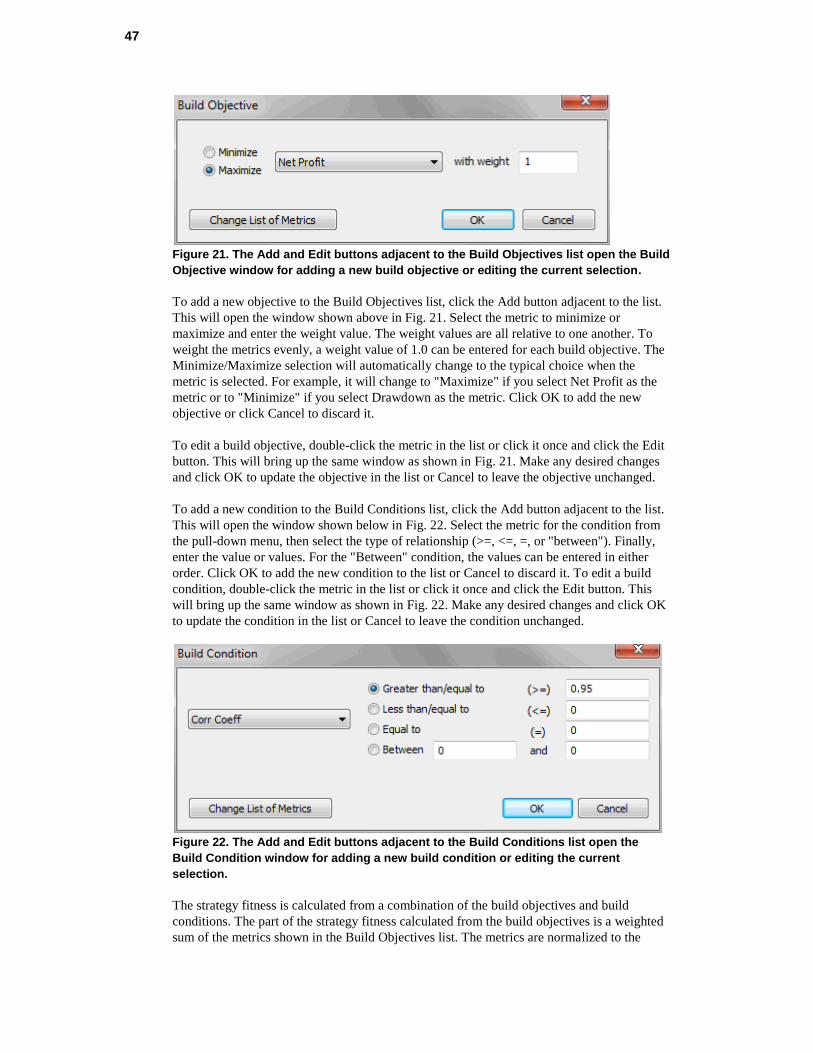
47
Figure 21. The Add and Edit buttons adjacent to the Build Objectives list open the Build
Objective window for adding a new build objective or editing the current selection.
To add a new objective to the Build Objectives list, click the Add button adjacent to the list.
This will open the window shown above in Fig. 21. Select the metric to minimize or
maximize and enter the weight value. The weight values are all relative to one another. To
weight the metrics evenly, a weight value of 1.0 can be entered for each build objective. The
Minimize/Maximize selection will automatically change to the typical choice when the
metric is selected. For example, it will change to "Maximize" if you select Net Profit as the
metric or to "Minimize" if you select Drawdown as the metric. Click OK to add the new
objective or click Cancel to discard it.
To edit a build objective, double-click the metric in the list or click it once and click the Edit
button. This will bring up the same window as shown in Fig. 21. Make any desired changes
and click OK to update the objective in the list or Cancel to leave the objective unchanged.
To add a new condition to the Build Conditions list, click the Add button adjacent to the list.
This will open the window shown below in Fig. 22. Select the metric for the condition from
the pull-down menu, then select the type of relationship (>=, <=, =, or "between"). Finally,
enter the value or values. For the "Between" condition, the values can be entered in either
order. Click OK to add the new condition to the list or Cancel to discard it. To edit a build
condition, double-click the metric in the list or click it once and click the Edit button. This
will bring up the same window as shown in Fig. 22. Make any desired changes and click OK
to update the condition in the list or Cancel to leave the condition unchanged.
Figure 22. The Add and Edit buttons adjacent to the Build Conditions list open the
Build Condition window for adding a new build condition or editing the current
selection.
The strategy fitness is calculated from a combination of the build objectives and build
conditions. The part of the strategy fitness calculated from the build objectives is a weighted
sum of the metrics shown in the Build Objectives list. The metrics are normalized to the

48
interval [0, 1] over all members of the population and weighted according to the entered
weight values. The resulting values are then scaled so that the maximum value over the
population has the value 1.
The build conditions are used to penalize the fitness when the conditions are not met. The
size of the penalty is proportional to the extent to which the condition has not been met. For
example, if the condition is that the drawdown should be less than 5000, and the actual
drawdown is 7800, the penalty will be 2800, which is then scaled so that the maximum
penalty value for that condition over the population members has the value 1. If the condition
has been met, the penalty value is zero. Penalty values are subtracted from the fitness. This
means that the maximum penalty value that can be subtracted from the fitness is -1 for each
build condition. Since the maximum value of the contribution to the fitness from the build
objectives is 1.0, the maximum possible value of the fitness is 1.0, which will happen if all of
the build conditions are met for the strategy with the maximum value of the build objectives.
Negative values of fitness imply one or more build conditions have not been met.
Adding build conditions helps the solution converge to a solution in which the build
conditions are met. However, it does not guarantee that the build conditions will be met; it's
always possible to specify conditions that exceed the maximum performance potential of the
market. It's usually better to select build conditions that represent realistic performance goals.
If the metric values representing realistic performance goals are not apparent, a few trial runs
can be used to better gauge the potential of the market.
Keep in mind that the build metrics are calculated over the in-sample period, which is the
data segment used in building the strategies. The values of the metrics used in the build
objectives and conditions are the same as the ones listed in the Build Results table. By
monitoring the results in the results table, as well as the equity curve, you can get a good idea
of which objectives or conditions may need to be added or changed to improve the results.
It’s usually best to start with a small number of objectives and conditions, such as three or
four. The default selections are often a good starting point. After a few generations, you can
add or remove items, change the weights, and so on based on the reported results. An
incremental approach usually works better than selecting objectives and conditions arbitrarily
and letting the build process run for an extended period of time without intervention.
The list labeled Conditions for Selecting Top Strategies contains conditions used to filter
or select members of the population for the Top Strategies results. If all the conditions in the
list are met, the strategy is added to the Top Strategies table. Each member of the population
is checked against this list as each generation is evolved. The conditions are defined the same
as in the Build Conditions table except that you can specify the data segment over which the
condition will be evaluated.
To add a new condition to the Top Strategies conditions list, click the Add button adjacent to
the list. This will open the window shown below in Fig. 23. Select the metric for the
condition from the pull-down menu, then select the type of relationship (>=, <=, =, or
"between") and enter the value or values. Finally, select the data segment over which the
condition will be evaluated (in-sample, out-of-sample, or all segments). Click OK to add the
new condition to the list or Cancel to discard it. To edit a condition, double-click the metric
in the list or click it once and click the Edit button. This will bring up the same window as
shown in Fig. 23. Make any desired changes and click OK to update the condition in the list
or Cancel to leave the condition unchanged.

49
Figure 23. The Add and Edit buttons adjacent to the Top Strategies conditions list open
the "Top Strategies" Condition window for adding a new condition or editing the
current selection.
See Appendix: Performance Metrics for a description of each available metric.
The list of metrics available for any of the lists on the Metrics tab can be changed by clicking
the "Change List of Metrics" button, which is available on each of the Edit/Add windows
(Figs. 21, 22, 23). This will bring up the Change Performance Metrics window, as shown in
Fig. 24.
Figure 24. The Change Performance Metrics window is used to add or remove
performance metrics available on the Metrics tab and shown in Build Results.
To add a metric, select it from the list of "Available Metrics" then click the Add button. The
metric will be added to the end of the list by default. If you want to add the new metric to a
specific location in the list of selected metrics, select a metric from the right-hand list before
adding the new metric. When you click the add button, the new metric will be placed above

50
the metric you selected in the right-hand list. To remove a metric from the list of selected
metrics, select it from the right-hand list, then click the Remove button. To move a metric up
or down in the list of Selected Metrics, use the Move Up/Dn buttons. The
Add/Remove/Move Up/Move Dn buttons can also be accessed by right-clicking.
Changing the metrics here also changes them in the Build Result table and in the list
displayed on the Build Options tab for resetting the build process based on out-of-sample
performance.
Build Options The Build Options tab is shown in Fig. 17 in the previous chapter. The options that influence
the build process are selected on this tab.
Pause/Resume
The Pause/Resume option determines whether the results from the prior build are used to
initialize the population for the next build. To incorporate the best strategies from the prior
build into the next build, uncheck the Reset on Build box before building. This will cause
Builder to initialize the population with the saved strategies from the prior build. If the
number of saved strategies is at least as large as the population size, this is the same as
resuming the build after pausing it; hence the Pause/Resume label.
It’s not necessary to save as many strategies as the population size. If you have a population
size of, say, 500, you might want to save the top 100 strategies. Stopping the build (or
waiting for it to end) and clicking the build button again with the Reset on Build box
unchecked will then initialize the first 100 members of the population with the saved
strategies from the prior build. The other 400 members will be initialized randomly. In this
case, it’s not a true “pause and resume.” Instead, it includes the best results from the prior
build into the next one while still allowing for new members to influence the results.
If the Reset on Build box is checked, the current population will be discarded, and the
population will be initialized randomly. This is the default setting and is the same as starting
a new build, in which there are no existing population members.
The number of saved strategies is specified using the Save [] best strategies option. This is
the number of members from the population that are stored. Builder selects the strategies to
store based on fitness. For example, if the population size is 200 and you enter a value of 100
for this setting, the top 100 strategies ranked by fitness will be stored. You can only store as
many members as are in the population. If you enter a number larger than the population
size, the entire population will be stored. The stored strategies are from the last completed
generation or from the initial population if the build was cancelled before the first generation
was completed.
Note: The number of stored strategies doesn't affect the build process, which takes place
over the number of members in the population, regardless of how many strategies you elect
to save. However, once the build process is complete, only the saved strategies are available.
The results for the stored strategies are displayed in the Build Results table. Clicking on any
row in the table displays the performance report, build report, equity curve, trade results, and
strategy code for the corresponding strategy.
Genetic Programming Options
The population size is the number of strategies in the genetic programming population.
Strategies are generated by evolving the population. The larger the population, the longer the

51
process will take, but the more diversity will be introduced into the solution. More diversity
generally increases the probability of finding a good strategy. With large intraday price files,
a population as small as 100 members may be necessary to achieve reasonable solution
times, depending on the bar size, time span, and computer hardware specifications. Files of
daily data generally allow for population sizes of 1000 or more.
The number of generations is the number of steps in the evolution of the population of
trading strategies. During one generation, the GP process generates a number of new
population members (strategies) equal to the size of the population. A higher number of
generations generally results in better strategies. However, after a number of generations, the
population members may start to converge so that little additional benefit is achieved by
continuing the build process. When this happens, most of the top strategies will be the same,
indicating that fewer generations can be used. It’s usually better to start with a smaller
number of generations, such as 5 - 10, and continue building if the results are promising and
have not yet converged.
Hint: To explore the variety of strategy logic that can be generated by Builder, try setting the
number of generations to zero. This will stop the build process after the initial population is
generated. Because the initial population is generated randomly and has not been modified
by crossover and mutation, the resulting strategies will display a wide variety of trading
logic.
The crossover percentage (Crossover Pct) is the percentage of members of the population
generated from crossover. Crossover is an operation that takes part of one member and
combines it with part of a different member to create a new member of the population. Most
members should be generated via crossover, such as 60% - 90%. Members not generated via
crossover are generated via mutation. To introduce more randomness into the population, try
decreasing this percentage, which will increase the percentage of members generated from
mutation.
The mutation percentage (Mutation Pct) is the probability that a given element of the
population member being created by mutation will be modified. Mutation operates on an
element-by-element basis. During mutation, each element, such as part of an entry rule or
part of the exit logic, is randomly modified with a probability equal to this value. To
introduce more randomness into the population, try increasing this percentage.
The entry rules in Builder are represented by tree structures, as explained in Chapter 1; see
Fig. 3. The tree depth is the number of levels in the tree. For example, the tree in Fig. 3 has
a depth of five. The default value of tree depth in Builder is 3. To increase the potential
complexity of the entry rules, a higher tree depth can be used. The tree depth will tend to
increase over successive generations as a result of the crossover operations, which may result
in a tree depth greater than the value specified here. To prevent the entry rules from
becoming overly complex, the complexity metric can be included as part of the build
metrics; see Appendix: Performance Metrics for a discussion of the complexity metric.
Setting the tree depth to zero will result in trivial entry conditions that are set to “true”. In
this case, the entry conditions will have no effect on the trading strategy logic. This might be
desirable if you want to generate strategies that have the minimum number of inputs. The
entry logic for strategies of this type will be limited to the entry order logic. For example, a
strategy might be generated with an entry stop order that contains a stop price calculated
from a multiple of the average true range. This would be the only entry logic for that
strategy.
52
As explained in Chapter 1, the parent members for crossover and mutation are chosen by
randomly selecting members of the population and choosing the member with the highest
fitness score. This is known as tournament selection. The tournament size is the number of
population members randomly selected for the tournament. The default value is 2, which
means that two members of the population are randomly selected, and the one with the
highest fitness score is selected as the parent. A so-called negative tournament is used to
select the member of the population to replace by the newly generated population member.
In a negative tournament, the member of the tournament with the lowest fitness score is
replaced. The tournament size selected here governs both types of tournaments.
Reset on Out-of-Sample Performance
You can also choose to have the build process automatically check the out-of-sample results
periodically after each specified number of generations and reinitialize the population if the
selected metric is not met. For example, the selection shown in Fig. 17 will rebuild if the out-
of-sample net profit is less than zero after each five generations. The selected metric that is
evaluated on the OOS data can be selected from the drop-down menu. You can also enter the
value that the metric is compared to. For example, you could rebuild if the OOS profit factor
is less than 2.0 by selecting “Prof Fact” from the pull-down menu and entering 2.0 into the
space. The reset condition only applies to the top strategy in the population; i.e., the one with
the highest fitness. The available performance metrics are the same as those described in the
previous section, which also explains how to change the list of available metrics.
Monte Carlo Analysis/Stress Testing
This group of options allows you to select the settings for stress testing and Monte Carlo
analysis, which are explained in detail in the chapter Usage Topics. Stress testing involves
making multiple sets of small, random changes to the trading strategy and/or market prices
and evaluating the results using Monte Carlo analysis.
Stress testing can either be applied during the build process or after-the-fact when re-
evaluating a strategy using the Evaluate command. To apply stress testing as part of the build
process, select the first option in this group, "Build using Monte Carlo results of stress
testing". If this option is checked, the subsequent options in this group will be applied during
the build process when the strategies are evaluated during back-testing. This option is the
same as the option "Apply stress tests and display Monte Carlo results" on the Evaluation
Options tab.
The number of Monte Carlo iterations is the number of evaluations made for each Monte
Carlo analysis in addition to the analysis for the original data and settings. Each iteration is a
separate stress test, in which the parameters of the test are randomly chosen according to the
settings under Stress Test Methods. The equity curve corresponding to each stress test will be
displayed in the Equity Curve window; for example, if 10 is entered for the number of Monte
Carlo iterations, 11 equity curves will be shown in the Equity Curve window, one for each
stress test plus the original equity curve. The results of all iterations are reported at the
confidence level entered for Confidence Level. For example, if a value of 95 is entered, the
Monte Carlo results of the stress tests will be reported at a confidence level of 95%.
There are three optional stress testing methods: randomizing prices, randomizing strategy
inputs, and randomizing the starting bar. Check the box next to each method to include it as
part of the stress test for each Monte Carlo iteration. At least one box must be checked for a
valid stress test.
To randomize the prices, check the box and enter values for the probability of changing a
price and for the maximum amount by which the price is changed. The probability is applied
to determine whether or not to change each price (open, high, low, close). If a price is

53
changed, it will be changed by a randomly chosen amount not greater than the maximum
amount entered as a percentage (positive or negative) of the average true range.
To randomize the strategy inputs, check the box and enter values for the probability of
changing the inputs and for the maximum amount by which an input is changed. The
probability is applied to determine whether or not to change each input. If an input is
changed, it will be changed by a randomly chosen amount not greater than the maximum
amount entered as a percentage (positive or negative) of the range for that input. The range
for each input is determined from the ranges set under Strategy Options.
To randomize the starting bar, check the box and enter a value for the maximum change in
the starting bar. If the starting bar is changed, it will be changed by a randomly chosen value
not greater than the value entered.

Chapter 4 Build Results
Overview The results generated from running Builder include the strategy code for each of the saved
strategies along with the performance results for each one. The docking windows (panes)
described below display the different types of program output. Chapter 2 discussed working
with windows and panes in Builder.
Output Window The Output window displays messages generated by the program while performing build and
evaluate operations. For example, when building strategies, a message is displayed in this
window several times per second indicating which member of the population has been
recently initialized or created. This window will also display an error message if the price file
cannot be found.
Memory Allocation Errors. The following message will be displayed in the Output window
if the program runs out of memory:
>> Insufficient memory. Try reducing population size, tree depth, or price
file size.
This error occurs when the program’s memory requirements exceed the computer’s available
memory. When this happens, the program is designed to detect the lack of available memory
and stop processing before a program crash occurs. When this happens, it can be resolved by
reducing either the population size or the size (length) of the file of price data. If the tree
depth has been increased beyond the default value, lowering it may also help.
Build Results The Build Results table displays summary results for the saved population members. A pull-
down menu at the top left allows you to select among Population, In-Sample; Population,
OOS; Population, All Segments; Top Strategies, In-Sample; Top Strategies, OOS; and Top
Strategies, All Segments. The first three options list performance results for each of the saved
strategies in the current population. The performance is tabulated separately for the in-
sample and out-of-sample (OOS) periods. "All Segments" refers to the entire period – in-
sample and OOS combined. The performance metrics displayed in the table are defined in
the previous chapter. Click on a row in the results table to display the results for the
corresponding strategy in the Performance Report, Build Report, Equity Curve, Trade List,
and Strategy Code windows. The strategies in the these tables are listed in order of
decreasing fitness. Builder saves and displays the number of strategies you specify on the
Build Options tab up to the population size.
Note that if the in-sample period ends with an open trade that exits in the out-of-sample
period (or vice-versa if the in-sample period follows the out-of-sample period), then the trade
will be included in the metrics for the out-of-sample period.

55
While the build process is ongoing, the program updates the results in Build Results after
each completed generation. If the build is cancelled before the first generation is completed,
the initial population will be displayed. The table results can be sorted by any column by
clicking on the column heading. For example, to sort the results by net profit, click on the
Net Profit column label. The results in related tables are sorted the same way. For example, if
you sort the in-sample results by drawdown, the out-of-sample results will appear in the
same order.
When "Top Strategies…" is selected from the pull-down menu, the table lists performance
results for strategies that meet the filtering criteria specified on the Metrics tab in the list
"Conditions for Selecting Top Strategies". The population of top strategies is updated after
each generation is completed for every build within the project file. Top Strategies may come
from different builds if multiple builds have been run and are saved in the project file, along
with the saved members of the population.
To remove a strategy from the table of Top Strategies, click on the entry then right-click and
select Delete Selected Strategy. The table can be cleared by right-clicking and selecting
Delete All Strategies. Neither delete operation will affect the table of Population results. A
strategy can be copied from the Population table to the Top Strategies table by selecting the
strategy in the Population table then right-clicking and selecting Copy Selection to Top
Strategies. This can be used to save an interesting strategy that wasn't picked up by the
filtering rules before re-building the population.
The entries in the Top Strategies table are listed in the order in which they were added to the
table. Since strategies can come from different builds, two different strategies may have the
same Member number. To see how different strategies in the table compare to one another,
click any strategy in the table then select Evaluate All from the Strategy menu. This will re-
evaluate each of the strategies in the Top Strategies table and re-compute their relative fitness
values. You can then sort by fitness by clicking on the Fitness column heading.
The Build Results table can be copied to a spreadsheet by right-clicking on the table and
selecting Copy. Open a blank spreadsheet page and select Paste to insert the table results into
the spreadsheet. There is also a right-click menu option to Change Metrics, which opens the
Change Performance Metrics window, discussed in the previous chapter under Metrics.
If stress testing has been applied, the results shown in Build Results will be the Monte Carlo
results at the confidence level specified under Build Options. Note: Monte Carlo results of
stress testing are calculated metric-by-metric at the specified confidence level and therefore
are not directly related to one another. For example, the Monte Carlo net profit is not
necessarily the sum of the long Monte Carlo net profit and short Monte Carlo net profit
because the long and short net profit are each calculated at 95% confidence. This applies to
all metrics.
Performance Report Window The Performance Report window displays a detailed performance report for the strategy
selected in Build Results. The performance report can be copied to the clipboard, printed, or
saved to a file in several different formats by right-clicking and selecting from the popup
(context) menu (Copy, Save to File, Print, Help).
An example of part of the performance report is shown in Fig. 25. The performance report
includes results for all trades together, long trades only, and short trades only. The results are
over all data used in the build, both in-sample and out-of-sample combined. The metrics
displayed in the report are described in Appendix: Performance Metrics.

56
The market or markets used in evaluating the strategy are shown at the top of the report
under Markets. If more than one market was selected in the Market Data table, the results
will represent the performance of the selected strategy over the combination of markets (i.e.,
portfolio). To see the results for a different market or markets, change the selections in the
Market Data table, then select Evaluate from the Strategy menu. The strategy will be
evaluated over all markets that have a check mark next to them in Market Data table.
Figure 25. Performance report for selected strategy (population member 379).
If stress testing has been applied, the reported results will be the Monte Carlo results at the
confidence level specified under Build Options, and the report will indicate "Monte Carlo:
Stress Test Results at x% Confidence", where x is the confidence level entered under Build
Options.
Note: Monte Carlo results of stress testing are calculated metric-by-metric at the specified
confidence level and therefore are not directly related to one another. For example, the
Monte Carlo net profit is not necessarily the sum of the long Monte Carlo net profit and
short Monte Carlo net profit because the long and short net profit are each calculated at
95% confidence. This applies to all metrics.
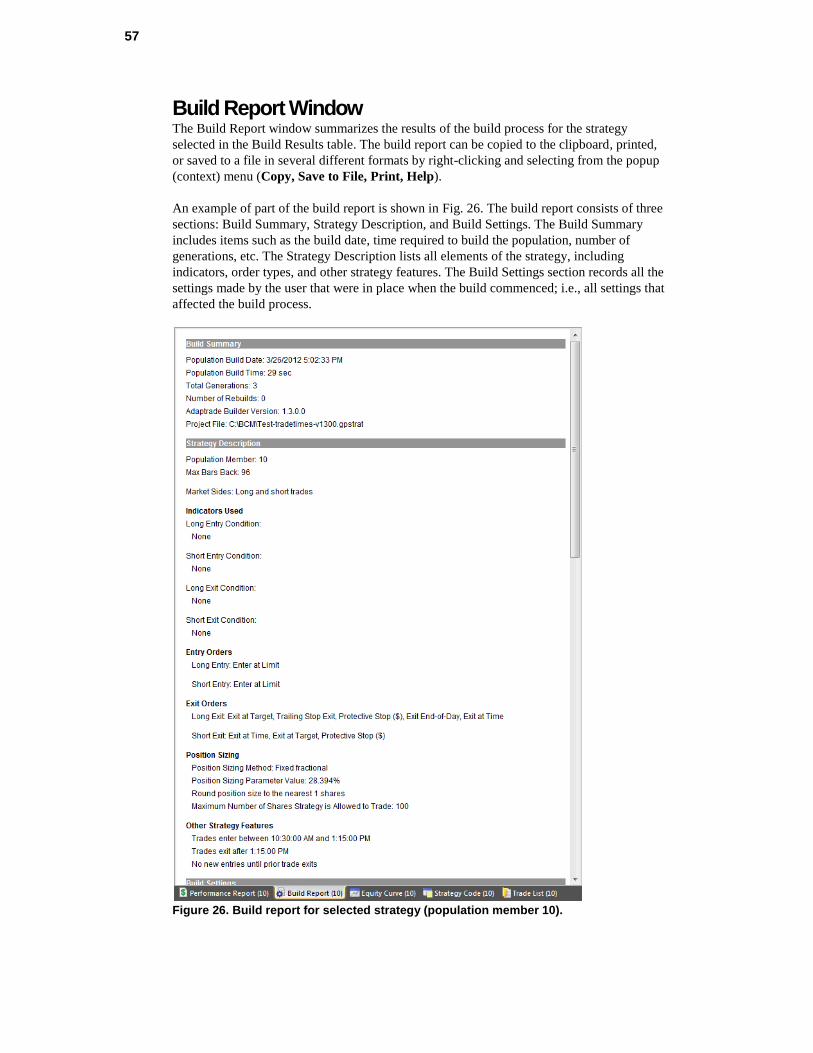
57
Build Report Window The Build Report window summarizes the results of the build process for the strategy
selected in the Build Results table. The build report can be copied to the clipboard, printed,
or saved to a file in several different formats by right-clicking and selecting from the popup
(context) menu (Copy, Save to File, Print, Help).
An example of part of the build report is shown in Fig. 26. The build report consists of three
sections: Build Summary, Strategy Description, and Build Settings. The Build Summary
includes items such as the build date, time required to build the population, number of
generations, etc. The Strategy Description lists all elements of the strategy, including
indicators, order types, and other strategy features. The Build Settings section records all the
settings made by the user that were in place when the build commenced; i.e., all settings that
affected the build process.
Figure 26. Build report for selected strategy (population member 10).

58
Strategy Code Window The code for the selected strategy is displayed in the Strategy Code pane. To view the code
for a different strategy of the population, select the strategy in the Build Results table. The
code in the Strategy Code window can be copied to the clipboard by right-clicking and
selecting Copy Strategy or by selecting Copy Strategy from the Edit menu. To copy only
part of the strategy code, click and drag the mouse over the part you want to copy, then right-
click and select Copy to copy the selected text to the clipboard. MetaTrader 4 code can be
saved directly to a .mq4 file by right-clicking in the code window and selecting "Save MT4
Strategy to File".
Similarly, select "Save NinjaScript Strategy to File" to save the strategy code for NinjaTrader
directly to a file in the required folder for NinjaTrader. Once selected, the folder location for
NinjaTrader strategies is stored in the registry, so it only needs to be selected once. Builder
initially defaults to the folder Documents\NinjaTrader 7\bin\Custom\Strategy\, which is the
customary location for NinjaTrader strategies under NinjaTrader 7. Builder creates a default
strategy name for each NinjaTrader strategy of the form
projectname_member#_#inputs_maxbarsback. For example, for a project with the file name
"MyProject.gpstrat", a typical strategy name might be MyProject_3_7_72, which indicates
the strategy is from population member 3 with 7 inputs and a MaxBarsBack requirement of
72. When saving the file, a new name can be entered, which will become the name for both
the file and the strategy.
The strategy code cannot be edited directly in Builder. To edit the code, copy the code to
your trading platform (e.g., TradeStation or MultiCharts), and use the editor in the trading
platform.
Unless saving the strategy code directly to a file, to transfer the code to your trading
platform, copy the code from the Builder code window and paste it into the strategy editor of
the trading platform. In TradeStation or MultiCharts, open a new strategy window in the
EasyLanguage editor, choose a name, then paste the code into the empty strategy window.
Finally, compile the EasyLanguage code by pressing F3. In MetaTrader 4, open a new
window in the MetaEditor, paste in the code from Builder, and click the compile button. In
AmiBroker, in the Charts pane, right-click on the Systems folder and select "New" and then
"Formula". Enter a name then right-click on the name and select "Edit". Select "Paste" from
the Edit menu to paste the code into the edit window, then click the save icon and, finally,
click the AFL icon to verify the code.
If you're pasting the strategy code over the code for an existing strategy, it will be necessary
to reset the input values before running the back-test. In MetaTrader 4, this can be done by
clicking the Expert properties button on the Tester window and clicking the Reset button on
the Inputs tab. In TradeStation, delete the strategy from the chart and re-insert it to reset the
input values. In AmiBroker, click the Parameters icon on the Analysis window and click
"Reset all".
To test the strategy in TradeStation/MultiCharts, insert it into the corresponding chart, such
as the chart used to generate the price data file for analysis, and set the ”Maximum number of
bars study will reference” (in TradeStation, Format Strategies, Properties for All; in
MultiCharts, Format Signal, Properties) to the MaxBarsBack value listed in the results table.
To test the strategy in NinjaTrader 7, first open the strategy in the NinjaTrader editor by
selecting Edit NinjaScript from the Tools menu, and click the Compile button. The strategy
should then be ready to back-test via the Strategy Analyzer window. Select the strategy on

59
the Backtest tab of the Strategy Analyzer window and set the "Min. bars required" to the
MaxBarsBack value listed in the results table. Click the button "Run Backtest".
To test the strategy in MetaTrader 4, select the strategy (Expert Advisor) on the Tester
window (Settings tab), and select the symbol and date range. For best results in MetaTrader,
select "Every tick" as the Model, then click the Start button to run the back-test.
To test the strategy in AmiBroker, right-click on the strategy in the Systems folder of the
Charts pane and select "Analysis". On the Analysis window, reset the parameter values by
clicking on the Parameters icon, and check the settings by clicking on the Settings icon.
Finally, click the Backtest icon to run the test.
Equity Curve Window The closed-trade equity curve for the strategy selected in the Build Results table is displayed
in the Equity Curve pane. To view the equity curve for a different strategy of the population,
select the strategy in the Build Results table. The equity curve is based on the most recent
evaluation. If you want to see the curve for a different range of dates, change the date range
on the Markets tab, then select Evaluate from the Strategy menu. Similarly, the selected
strategy can be evaluated over a different market or markets by selecting the market(s) in the
Market Data table and re-evaluating the strategy.
If multiple markets are selected in the Market Data table, multiple curves will be plotted. The
portfolio equity curve (i.e., the equity curve for the combination of markets) will be plotted
with a slightly thicker line, which is blue for in-sample data and either green or red for out-
of-sample (OOS) data depending on whether the OOS results are profitable (green) or not
(red). There will also be a separate curve plotted for each individual market, which plots the
equity over only the trades from that market. A color-coded key consisting of the symbol
names for each market is drawn in the lower right part of the plot to help identify which
curve corresponds to which market.
A vertical line is drawn on the chart to divide the OOS part of the equity curve from the in-
sample part. The line is drawn in green if the OOS results are profitable or red if they’re not.
If stress testing is applied, a separate equity curve will be shown for each stress test, and each
curve will be drawn in a different color. The equity curve for the original data will be plotted
with a slightly thicker line. If stress testing is applied to a portfolio, only the portfolio equity
curve will be shown for each stress test.
The equity curve can be copied to the clipboard by right-clicking and selecting Copy Equity
Curve from the popup (context) menu.
Trade List Table The Trade List table displays the trade-by-trade results for the selected strategy. To view the
trade list for a different strategy of the population, select the strategy in the Build Results
table. The trade list table includes the following fields: symbol, entry date, signal price, entry
price, entry signal name, exit date, signal price, exit price, exit signal name, stop price,
direction, quantity, profit/loss, costs, net profit/loss, risk and equity.
Entries and exits have both a signal price and the price at which the simulated trade was
filled (i.e., Entry Price and Exit Price). The signal price is the price calculated by the strategy
and will often be different than the fill price because of where the next bar opened. For
entries using stop or limit orders, the signal prices are given by the code variables EntPrL

60
and EntPrS for long and short trades, respectively. For entries at market, the signal price will
be the close of the bar on which the order was generated. For exits, the signal price may be a
stop price (code variables LStop, SStop), target price (code variables TargPrL, TargPrS), or
market price. For exits at market, the signal price will be the close of the bar on which the
order was generated. The entry and exit signal names are as shown below in the table.
Order Type Signal Name in Trade List Table
Enter at Market Market
Enter on Stop (Breakout) Stop
Enter at Limit Limit
Exit at Target Target
Trailing Stop Exit Trail Stop
Exit at N Bars N Bars
Protective Stop ($) Fixed Stop
Protective Stop (%) Percent Stop
Protective Stop (ATR) ATR Stop
Exit at Time Time
Exit at Market Market
Exit End-of-Day End-of-Day
The stop price field will read “NA” if there was no money management (protective) stop for
that trade. The direction field is either “Short” or “Long”. Quantity is the number of shares or
contracts that were traded. The profit/loss field is the closed trade profit or loss before costs,
which are the total costs for the position. The net profit/loss is the profit/loss amount after
costs. The risk is the potential loss per share or contract based on the protective stop, if any,
and includes costs. The equity field displays the cumulative closed trade equity, as shown in
the equity curve plot. Note that a trade that enters during the in-sample period but exits in the
OOS period will be listed in the OOS section of the list (or vice-versa if the in-sample and
OOS periods are reversed). For any trade that did not exit before the end of the trading
period, the word "open" will be displayed in the Exit Price column. Open trades are not
included in the calculations shown in the Performance Report.
In-sample results in the trade list table are shown against a white background, with profitable
trades written in green text and unprofitable trades in red text. The out-of-sample trades are
written in black text with a colored background. The background is green if the OOS trade is
profitable or red if the OOS trade is unprofitable.
The trade list table can be copied to a spreadsheet by right-clicking on the table and selecting
Copy. Open a blank spreadsheet page and select Paste to insert the table results into the
spreadsheet. To save the table contents to a comma-delimited text file (.csv file), right-click
and select Save to file. This file is formatted so that it can be read by Market System
Analyzer (MSA) position sizing software as a trades file. In MSA, select the WriteTrades
format when selecting the file under Data Source or when importing the file.
To save the trades directly to a MSA (extension .msa) file, right-click and select Save to
MSA file. The program will prompt you to enter a name for the MSA file as well as a name
for the text file to which the trades will be saved. The resulting .msa file can be opened
directly by MSA version 3.3 or higher and will include all current Builder settings that are
applicable to MSA. If more than one market was used in the build process, the point value
and trading costs stored in the MSA file will be the ones for the currently selected market.

Chapter 5 Usage Topics
Overview The basic steps to using Adaptrade Builder were outlined in the Quick Start Steps section in
Chapter 2 (Getting Started). This chapter delves into various topics related to using Builder,
including an explanation of stress testing and Monte Carlo analysis, a discussion of out-of-
sample performance, factors that affect the build time and how to reduce it, considerations
for after you’ve built a strategy, common questions, and various tips and hints for strategy
building.
Stress Testing and Monte Carlo Analysis Testing a trading strategy for robustness is often referred to as sensitivity analysis or stress
testing. The basic idea is to see what happens when small changes are made to the strategy
inputs, price data, or other elements of the strategy or the trading environment. A robust
strategy exhibits a proportional and relatively muted reaction to such changes, whereas a
strategy that is not robust will react disproportionally and sometimes fail outright when small
changes are made to its inputs or environment.
Why is This Important?
Strategy robustness is important because the markets never stay the same. Consider the
strategy inputs, for example. Inputs such as the look-back length for a moving average might
be optimal over the back-test period, but going forward, different values might be optimal.
How will the strategy perform when the inputs are no longer optimal? One way to answer
that is to see how the results change when the input values are changed.
Robustness is related to strategy over-fitting. The strategy should not have been fit so tightly
to the market during the development process that it can't withstand any changes to the
market. Generally speaking, to test for over-fitting, the market can be changed, the strategy
can be changed, or both can be changed. A strategy that does not stand up well to relatively
small changes is not robust and is likely to be over-fit. Such a strategy should not be
expected to do well in the future.
Types of Stress Testing
There are many different ways that a strategy can be stress tested. Changes can be made to
the strategy itself or to the price data on which it's back-tested. The trading costs, such as the
amount of slippage, can be changed or the position sizing can be changed. In principle,
anything that affects the strategy back-testing results can be varied. In Builder, the following
three types of stress testing are available (see Input Data and Settings, Build Options):
1. Changing the strategy inputs.
2. Changing individual prices.
3. Changing the starting bar.
The rationale for changing the strategy inputs was discussed above. Two settings are
available to randomly change the input values. One is the probability of changing an input.
For example, if the probability is 10%, that means there's a 10% chance that an input will be

62
changed. The second setting is the maximum percentage change that will be applied to an
input that is being changed. The actual amount of the change is randomly chosen between -
Max and +Max, where Max is the maximum percentage change and might be on the order of
5% or 10%. This percentage is applied to the range of values for each input. For example, if
the look-back length for an indicator is selected from the range of values from 1 to 100, then
the range would be 100. If the Max value is 10, the randomly chosen change percentage
might be, say, -3%, which means a value of -3 (i.e., -3% of 100) would then be added to the
original input value to obtain the changed input value.
One way that a strategy can be over-fit, and therefore not robust, is if it's fit too closely to
specific prices in the back-test. For example, if the strategy enters long on a stop and several
large, profitable trades enter at the high price of the day, that should raise a red flag. What
would the results look like if the high had been one tick lower on those days? If such a small
change would ruin the results, the strategy is clearly not robust. A stress-testing technique to
detect that kind of over-fitting is to make random changes to individual prices and evaluate
the results.
Two settings are available to randomly change the price data. One is the probability of
changing a price. For example, if the probability is 50%, that means there's a 50% chance
that a price -- open, high, low, close of each bar -- will be changed. The second setting is the
maximum percentage change that will be applied to a price that is being changed. As with
the input values, the actual amount of the change is randomly chosen between -Max and
+Max, where Max is the maximum percentage price change. The value of Max is taken as a
percentage of the average true range over the past 100 bars. For example, if the average true
range is 10 points and the maximum percentage change is 20%, then the change amount is a
randomly chosen number between -2 and +2 points. Let's say the actual number is -1.25
points, and the closing price is 1250.50. The modified close would then be 1249.25. Finally,
it's possible that changing a price will invalidate the normal price ordering, such as reducing
the open so that it's below the low. To prevent that, the prices will be adjusted if necessary
after making the change to keep the open and close within the high/low range.
The last available stress testing method involves changing the starting bar. It's probably
obvious that a good strategy should not fall apart when you start the back-test on a different
bar. It might be less obvious how this can happen. Consider a hypothetical strategy that
enters long on a moving average crossover. It then holds the trade exactly five bars before
exiting at market. Putting aside the suitability of the logic, imagine what the trade history
might look like on a price chart. If the moving average entry condition uses a short-term
average crossing above a long-term average, it's entirely possible that in a sustained up-trend,
the entry condition could be true for a long period of time; i.e., the short-term average might
be higher than the long-term average for many bars in a row.
If the back-test were started during that period, the first trade would enter on the next bar
after the starting bar, and each trade would last five bars, followed immediately by the next
entry, and so on. Now consider what would happen if the starting bar were changed. If the
starting bar were one bar later, for example, the whole series of trades would be shifted one
bar to the right. It's entirely possible that some of those series of five-bar trades would be
much more profitable than others, depending on how the trades aligned with any underlying
five-bar trend cycle that existed. So, depending on the starting bar, the strategy might be
highly profitable or unprofitable because of where the trades started and ended. It might not
be obvious during development that the strategy logic had this type of dependency on the
starting bar, particularly for more complex types of logic.
To test for the effect of the starting bar, the bar on which the strategy back-test is started can
be varied by a random number chosen between 1 and N. For example, if N is chosen to be
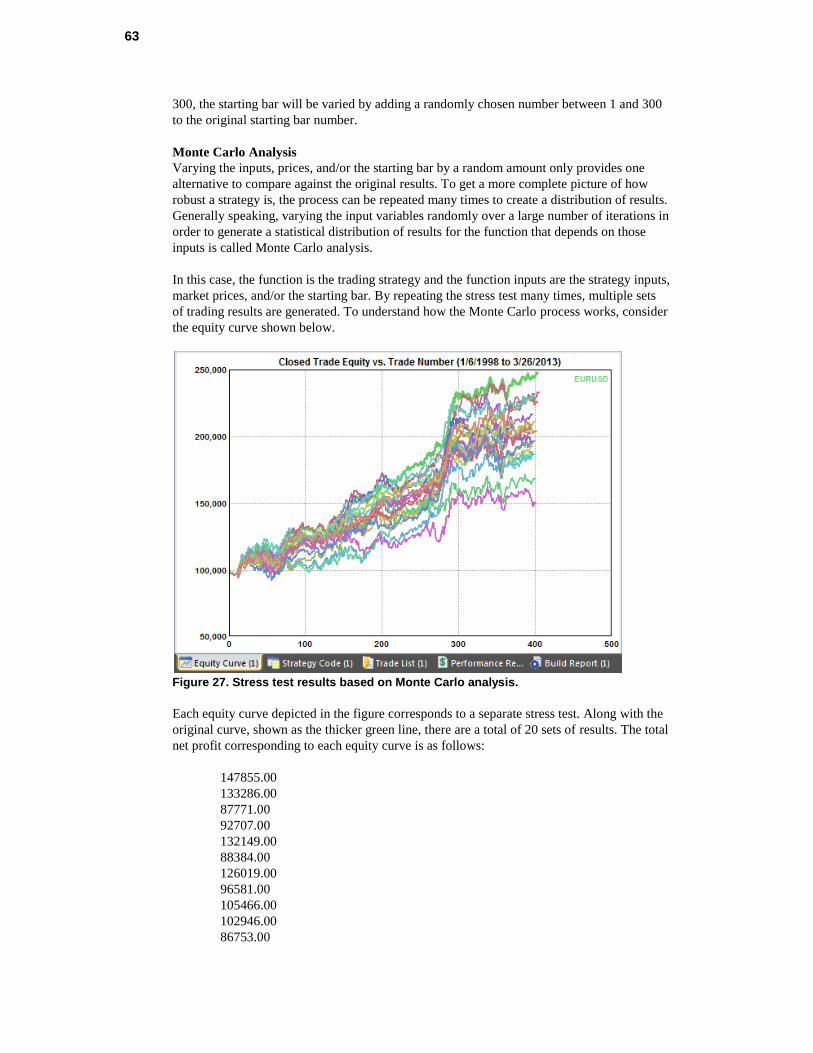
63
300, the starting bar will be varied by adding a randomly chosen number between 1 and 300
to the original starting bar number.
Monte Carlo Analysis
Varying the inputs, prices, and/or the starting bar by a random amount only provides one
alternative to compare against the original results. To get a more complete picture of how
robust a strategy is, the process can be repeated many times to create a distribution of results.
Generally speaking, varying the input variables randomly over a large number of iterations in
order to generate a statistical distribution of results for the function that depends on those
inputs is called Monte Carlo analysis.
In this case, the function is the trading strategy and the function inputs are the strategy inputs,
market prices, and/or the starting bar. By repeating the stress test many times, multiple sets
of trading results are generated. To understand how the Monte Carlo process works, consider
the equity curve shown below.
Figure 27. Stress test results based on Monte Carlo analysis.
Each equity curve depicted in the figure corresponds to a separate stress test. Along with the
original curve, shown as the thicker green line, there are a total of 20 sets of results. The total
net profit corresponding to each equity curve is as follows:
147855.00
133286.00
87771.00
92707.00
132149.00
88384.00
126019.00
96581.00
105466.00
102946.00
86753.00

64
96127.00
116611.00
68459.00
109427.00
96242.00
111020.00
50201.00
130076.00
104181.00
The highest value, $147,855, corresponds to the original file of price data. The lowest value
is $50,201. The Monte Carlo analysis can be used to estimate the likely net profit with a
specified degree of confidence given the variety of results. A confidence level of 95% is
typical, which means there would be a 5% chance of the net profit being lower than the
estimated value. To obtain the value of net profit at 95% confidence, the list above is sorted
from highest to lowest, and the value 95% of the way down the list is selected. Since there
are 20 items in the list, the 19th item in the sorted list is selected, which would be a net profit
of $68,459; i.e., the second lowest value in the list.
This result can be interpreted as follows: if the randomization of the price data is
representative of the kind of random differences expected in the market, then 95% of the
time, the net profit can be expected to be at least $68,459.
Builder applies the same approach to all performance metrics tracked by the program. If the
metric is one where a lower value is better, such as maximum drawdown, the value is
selected 95% of the way up the list.
In summary, stress tests measure how robust a trading strategy is, which is an indication of
whether or not the strategy is over-fit. The stress test results are analyzed using Monte Carlo
analysis, which makes it possible to quantify the results and provides an estimate of
performance that is generally more conservative (i.e., less favorable) than the back-test
results based on the original data.
It's also possible to apply stress testing in Builder as part of the strategy development
process. Instead of using the performance obtained from back-testing the strategies on the
original data, the Monte Carlo results at 95% confidence from the stress tests can be used
when evolving the strategies. The top strategies in the population will be the ones with the
best Monte Carlo results, which will tend to drive the population towards robust strategies.
The downside is that if each Monte Carlo analysis is based on N simulations, the build
process will take N times as long using this approach. See Build Options in Input Data and
Settings.
Along with out-of-sample testing and other methods discussed in this guide, stress testing
provides another tool to help identify robust trading strategies and avoid over-fitting. If
applied as part of the strategy building and/or evaluation process, stress testing may help
weed out strategies that are overly sensitive to changes in the trading environment, which
could help avoid losses and increase the likelihood of success.
Out-of-Sample Performance Genetic Programming (GP) is a type of optimization. Most systematic traders are probably
familiar with parameter optimization, in which the inputs to a strategy are optimized. Unlike
parameter optimization, GP optimizes the strategy’s trading logic. Nonetheless, the risk of
65
over-optimization, or “over-fitting”, is also a concern for GP, just as it is for parameter
optimization.
Typically, optimization is performed over one segment of data, called the optimization or in-
sample segment, and tested on different data, called the test or out-of-sample segment. Over-
fitting refers to the problem of optimizing a strategy so that it fits the in-sample segment well
but doesn’t work well on any other data, including the out-of-sample data.
Poor out-of-sample performance is usually caused by one of several factors. One important
factor is the so-called number of degrees-of-freedom in the in-sample segment. The number
of degrees-of-freedom, which is equal to the number of trades minus the number of rules and
conditions of the strategy, determines how tightly the strategy fits the data. Provided inputs
are added for each parameter in the strategy, the number of strategy inputs can be used as a
proxy for the number of rules and conditions. For example, if a strategy has 100 trades and
10 inputs, it has 90 degrees-of-freedom. The more degrees-of-freedom, the less likely it is
that the strategy will be over-fit to the market and the more likely it is that it will have good
out-of-sample performance.
The number of degrees-of-freedom can be increased during the build process by adjusting
the weights for the number of trades and/or the strategy complexity. All other things being
equal, increasing the performance weighting for the number of trades will result in strategies
with more trades and therefore more degrees-of-freedom. Likewise, increasing the
performance weighting for the complexity metric will result in strategies with fewer inputs,
which will also increase the number of degrees-of-freedom.
Builder also incorporates the degrees-of-freedom into the build process via the significance
performance metric. In Builder, “significance” is based on the Student’s t test applied to the
average trade. It measures the statistical significance of the average trade; that is, the
probability that the average trade will be greater than zero. The t test is based on the number
of degrees-of-freedom but is a more complete measure of whether a strategy is over-fit than
the number of degrees-of-freedom alone. One way, then, to improve out-of-sample
performance is to use the significance metric to generate strategies that have a high statistical
significance.
Another important factor affecting out-of-sample performance is the variety of market
conditions in the in-sample segment. Generally speaking, it’s better to optimize over data
that includes a wide variety of market conditions, such as up trending and down trending
markets, periods of consolidation, high and low volatility, etc. The more variety in the in-
sample segment, the more likely it is that the strategy will perform well on other data,
including out-of-sample data and in real-time trading. While the future never exactly
duplicates the past, provided the future (or out-of-sample data) is similar enough to at least
part of the in-sample segment, the strategy should perform well on new data.
The value of optimizing over a variety of market conditions presumes that good performance
is achieved over each part of the in-sample segment. One way to measure this is with the
correlation coefficient of the equity curve, which measures how closely the equity curve
approximates a straight line. If the equity curve is a straight line, it implies that the
performance is uniform over all segments of the data. Obviously, this is desirable if the goal
is to achieve good performance over as many different types of market conditions as
possible. The correlation coefficient for the strategies generated by Builder can be increased
by increasing the performance weighting for this metric.
Unfortunately, there will be cases where even with a high significance, a correlation
coefficient close to 1, and a wide variety of market conditions in the in-sample segment, the
66
out-of-sample performance will be poor. This can happen for several reasons. First, even a
simple strategy with few parameters can in some cases fit the noise rather than the signal. By
definition, noise is any part of the market data that does not contribute to profitable trading
signals. Secondly, the market dynamics on which the strategy logic is based (i.e., the signal)
may have changed in the out-of-sample segment enough to negatively impact performance.
This is sometimes due to a fundamental change in the market, such as the switch from floor-
based to electronic trading. However, more subtle changes, often related to the trading
patterns of market participants, are also possible, particularly for shorter-term trading.
If this appears to be the problem, the solution may be as simple as rebuilding the strategy
with new trading logic. Another possible solution is to include the most recent data in the
optimization segment and test it out-of-sample by tracking the performance in real-time. In
most cases, a strategy that has a large number of trades, a high significance value and good
performance on the in-sample segment will continue to perform well for some period of time
post-optimization. The more important question is how long it will continue to perform
before requiring re-optimization or rebuilding. This issue is discussed further in the section
“Post-Build Testing and Optimization”.
Build Time The GP algorithm is very computationally intensive. There are several factors that can affect
the time it takes to build and evaluate a strategy:
Length of the price data file. A file of 10 years of daily data for the EURUSD currency
is about 138k in size. One year of 5 min data for the E-mini S&P is ten times as large.
The build time is proportional to the file size, so a file that is 10 times as large will
generally take about 10 times as long to process.
Population size and number of generations. These parameters determine how many
strategy simulations are performed. One simulation is performed for each member of the
population for each generation.
Tree depth. This setting determines in part the complexity of the entry conditions for the
strategies. Strategies that are more complex take longer to evaluate.
Long/short symmetry. If the short side is the mirror image of the long side, Builder can
save time both in building the strategy and evaluating it. Strategies in which the long and
short sides are different are more complex and take longer to build.
Number of trades. Strategies with a large number of trades take longer to evaluate. One
factor that can result in an unusually large number of trades is not specifying adequate
trading costs. With zero or small trading costs, a large number of very short-term trades
with very small or even zero profit/loss values will not negatively impact the fitness. For
example, with zero trading costs, a top strategy could have thousands of trades that enter
and exit at the same price, resulting in zero profit/loss with no impact on the strategy's
fitness. To avoid this, always specify a reasonable value for the trading costs and/or
select the Order Fill Rule, which uses the bid/ask spread, on the Evaluation Options tab.
Hardware and software considerations. Obviously the build process will run faster on a
faster processor. The build algorithm is a parallel processing algorithm that takes
advantage of multi-core processors. The more cores the better. It’s also the case that if
multiple programs are running together on the same computer at the same time as
Builder, fewer processor cycles will be available for Builder, and the build process will
take longer.
Depending on these factors, the build process may take anywhere from several minutes to
several hours or longer. If the build process seems to be taking too long, it can be cancelled
and restarted at a later time. To restart the build process later, make sure to save the current
results before exiting the program by selecting Save Project from the File menu. Upon
opening the file, uncheck the Reset on Build box (Build Options tab). This will instruct the

67
program to initialize the population using the saved strategies from the prior session. Builder
saves the top number of strategies specified by the Save Best Strategies setting on the Build
Options tab. To restart the build process exactly where you left off, the Save Best input
should be set to the population size prior to the initial build. That way, Builder will save the
entire population for the last completed generation. Note that at least one generation must be
completed for the results to be saved.
Post-Build Testing and Optimization As discussed above, genetic programming (GP) is an optimization process. As such, it’s
important to perform out-of-sample testing on any strategy generated by the program that
you intend to trade. Builder was designed to perform these calculations automatically. All
you need to do is decide how much data to use for in-sample and how much for out-of-
sample testing. As mentioned elsewhere, a good ratio of in-sample to out-of-sample data is
often between three and five to one. For example, setting the slider control on the Markets
tab to 80% in-sample is often reasonable.
Also keep in mind that the most unbiased form of out-of-sample testing is real-time tracking,
in which you follow the strategy for some period of time following the optimization and
record the performance as new price data are generated in real time. This could either be
done in Builder by loading new price data, or you could track the strategy directly in the
trading platform.
Another approach that some traders may prefer is to load a different price series into Builder
and test the strategy on that file. This can easily be done by adding another market to the
table on the Markets tab. After adding the new market, select the strategy to evaluate and
select Evaluate from the Strategy menu. For example, you might want to build a strategy for
wheat futures then test it on corn futures. Similarly, you could build a strategy on the SPY
ETF then test the strategy on various large-cap stocks. Keep in mind, however, that this
approach is more demanding of your strategy and may not always produce acceptable results.
The suggestions in the previous section can be used to help generate more robust strategies
that may have a greater likelihood of performing well on multiple markets.
In addition to out-of-sample testing, the strategies generated by Builder can be optimized in
the traditional way; i.e., parameter optimization. As noted above, an input has been added for
each parameter in the strategy. These inputs are assigned values during the GP process and
are modified by the mutation operator, but in some cases, further improvement may result
from optimizing these inputs separately. This can be done in TradeStation using the built-in
genetic optimizer of TS 8.5 or later. To set the range for each input, refer to the settings in
the Strategy Options tab in Builder. For example, if an input represents a multiple of the
average true range, you can use the range of values under ATR Multiple in the Parameter
Ranges section. Likewise, if an input is a lookback length for a price pattern, you can use the
range of values under Lookback, Price Patterns. As with GP, any results generated from
optimizing the strategy inputs should be tested out-of-sample.
The other important issue regarding post-build testing and optimization is monitoring the
strategy during real-time trading and re-optimizing or rebuilding if necessary. As discussed
in the section on out-of-sample performance, market dynamics can change in such a way that
the strategy logic may no longer work. This will tend to happen more frequently for
strategies that are optimized over shorter time periods. However, performance can start to
decline at any time for any strategy, regardless of its back-tested performance or how long it
has been used successfully in real time trading. This is simply one of the risks of trading.

68
To address this risk, the performance can be monitored over the most recent trade history and
compared to the long-term average performance of the strategy. This approach is sometimes
referred to as statistical process control, which is a method used in manufacturing to make
sure the manufacturing processes stay within prescribed error limits. In the context of
trading, you might, for example, calculate the percentage of winning trades for the most
recent 30 trades and compare this to the percentage for the entire trade history. If the
percentage for the most recent period deviates from the long-term average by more than two
or three standard deviations, the strategy can be rebuilt or re-optimized. Any performance
metric could be used for this calculation, including the average trade, profit factor, and so on.
If a strategy starts to show declining performance, it might be possible to re-optimize the
inputs in TradeStation rather than rebuilding in Builder. If that doesn’t work, a new strategy
can always be built in Builder.
Common Questions In some cases, the results displayed by Builder in the Strategy View don’t match the
results I get when I run the strategy in my trading platform. What's wrong?
There are several possible explanations. One possibility is that the date ranges of the price
series are different between Builder and the trading platform. It's also important to set the
"Maximum number of bars study will reference" in TradeStation (Format Strategies,
Properties for All) to the MaxBarsBack value listed in the Build Results table. In
MultiCharts, the value is entered under Format Signal, Properties ("Maximum number of
bars study will reference"). This will insure that the calculations start on the correct bar. This
is not necessary in AmiBroker since the code itself contains the MaxBarsBack setting.
MetaTrader automatically starts the indicator calculations so that the first bar of trading is on
the first day you specify. This means you don't need to enter a "max bars back" value.
However, it also makes it difficult to align the starting date in Builder with that of
MetaTrader. Sometimes, the bar on which the calculations start can make a substantial
difference. For example, if trading starts two bars earlier in MetaTrader than in Builder and
each trade lasts exactly five bars, each trade could be starting and ending two bars earlier in
MetaTrader, which could significantly affect the results.
Trading costs can also be a factor. Note that Builder deducts the trading costs once per trade,
whereas TradeStation deducts costs once "per side". For example, if your trading costs are
set to $25 in Builder, they should be set to $12.50 in TradeStation.
If you're re-using a strategy name in the strategy editor by pasting the strategy code over the
code for an existing strategy, it will be necessary to reset the input values before running the
back-test. Otherwise, the trading platform may be using the prior strategy's input values with
the new strategy. In TradeStation, delete the strategy from the chart and re-insert it to reset
the input values. In MetaTrader 4, reset the input values by clicking the Expert properties
button on the Tester window and clicking the Reset button on the Inputs tab. In AmiBroker,
click the Parameters icon on the Analysis window and click "Reset all".
MetaTrader 4 applies a minimum price distance to determine if an order can be placed. If a
pending order (stop or limit) is too close to the market at the time it's placed, the order will
be rejected. This is based on the idea that there won't be sufficient time to place the order
before the market moves through the order price. Builder doesn't reject such orders, which
can sometimes cause a discrepancy in back-testing between Builder and MetaTrader 4.
Another source of difference in MetaTrader involves the accumulation/distribution indicator.
The values of this indicator depend on the bar on which the calculations start. In MetaTrader,

69
while you can specify the starting and ending dates for the strategy, the indicators are
evaluated starting at the beginning of the available data. This means that the
accumulation/distribution values may be very different in MetaTrader than in Builder.
In TradeStation, another possible source of difference is how Builder and TradeStation use
trading volume on intraday data. If your strategy uses volume in an indicator for either an
entry or exit condition and your price data is intraday data, TradeStation may be using only
the "up volume", rather than the total (up plus down) volume. On the Markets tab in Builder,
there is an option on the Price File Format window (click on the Format button) to "Set the
volume to the sum of up-tick and down-tick volumes." Try changing this option then re-
evaluate the strategy using the Evaluate command on the Build menu.
For forex trading, one source of discrepancy is the so-called "roll over credit", which
TradeStation calculates on foreign exchange trades. This is currently outside the scope of
Builder. In most cases, these credits are small amounts that do not affect the overall results
substantially.
Even with all the settings correct, there may be differences. Oftentimes, these result from
rounding errors and other small differences that are unavoidable. For example, if an
oscillator is compared to a fixed value, such as 80.0, using the less-than-of-equal (<=)
operator, there may be a bar where the value calculates as exactly 80.0 in Builder but as
80.0000001 in TradeStation. This seemingly insignificant difference can result in a trade that
is not taken in TradeStation but is taken in Builder. This could then affect subsequent trades
because the presence or absence of a trade can either prevent or allow another trade to be
taken. This is particularly true when entries are taken at market, especially when the entry
condition is "true". Such strategies rely on the exit logic, so that if one trade is off by a bar,
the next trade will be delayed by one bar, and so on. In this way, a small calculation
difference can lead to entirely different results. One way to handle this possibility is to stress
test strategies after building them. Strategies that do poorly under stress testing may be too
"fragile" for real life trading.
When I tried to run a strategy in TradeStation, I got an error message "Tried to
reference more bars than allowed by current Max bars back setting." In MultiCharts,
the error is "Tried to reference back more bars than allowed by current MaxBarsBack
setting."
The max bars back (MaxBarsBack) setting in TradeStation and MultiCharts refers to the
number of bars required to start the calculations. You need to set this to the value listed in
Builder in the results table under MaxBarsBack. The same value is also listed in the
comment block at the top of the strategy code. In TradeStation, you enter the value under
"Maximum number of bars study will reference" in Format Strategies, Properties for All. In
MultiCharts, the value is entered under Format Signal, Properties ("Maximum number of
bars study will reference"). This will insure that the calculations start on the correct bar.
I selected the exit end-of-day order type, but my trades don't exit at the end of day in
real time trading. What can I do?
First, the exit end-of-day order type is only available in TradeStation and MultiCharts. For
other code types, the "Exit after" option on the Strategy Options tab should be used to exit
intraday strategies at the end of the day or at a specified time. For TradeStation and
MultiCharts, the "Exit end-of-day" order type on the Order Types tab in Builder causes the
program to include the SetExitOnClose command in strategies. This command is mostly for
back-testing purposes. In real time trading, it causes a market order to be generated on the
close of the last bar of the current session. However, by the time the order is sent, the market
has already closed, so the order is not filled. A work-around technique that some traders use
is to define a custom session that ends a few minutes prior to the actual session close. Then

70
the SetExitOnClose command will have time to exit your position prior to the end of the
actual session. You just need to make sure to correctly set the session end time in Builder for
the custom session, and, of course, the chart in TradeStation/MultiCharts has to use the same
custom session as in Builder in order to avoid discrepancies between the results in Builder
and those in TradeStation/MultiCharts.
A simpler approach is to use the "Exit after" option on the Strategy Options tab. Set the time
to at least one bar prior to the end of the session. That will trigger an exit prior to the end of
the session.
I want my strategies to have smaller losses. How do I get tighter stops in Builder?
If the stops are too large, the easiest solution is to reduce the maximum stop size on the
Strategy Options tab. For ATR stops, you would want to reduce the size of the max ATR
Multiple, which controls the range of values used to define the size of ATR stops. You can
also set a target for the Max Loss metric. For example, if you want no more than 9 points
loss on trades in the E-mini S&P, you can set a target for the Max Loss metric of $450 (i.e., 9
points x $50 per point). Alternatively, you can try including the Ave MAE (maximum
adverse excursion) in the build goals. The Ave MAE is a measure of the intra-trade
drawdown. There is also a Max MAE metric (maximum value of the MAE over all trades).
If the problem is that you're not getting protective stops in your strategies, you can include
any selected exit type in all strategies. To include a protective stop, just select the protective
stop in the "Include" column on the Order Types tab.
Why do my trades exit past the time I set in the "Exit after" option?
The exit time option allows you to set an exit time for your trades. If, for example, you set
the time to 3:00 pm, the strategy logic will be modified so that exits take place after this time.
However, it's important to keep in mind that the time stamp on bars is typically the time the
bar closes. For example, if you're using 30 minute bars, a bar time of 3:30 pm means the bar
closes at 3:30. Since it's a 30 minute bar, that means it opens at 3:00 pm. The exit time option
causes a trade to exit on the next bar's open if the time of the current bar is greater than or
equal to the exit time. So if you've specified an exit time of 3:00 pm, the trade will exit on
the open of the 3:30 pm bar (assuming 30 minute bars). The exit time will be listed as 3:30
pm because that's the time stamp on the bar, but the actual time will be a moment after 3:00
pm, which corresponds to the open of the 3:30 pm bar.
Also keep in mind that a trading strategy can only trade the bars of price data it has. If you're
using 60 minute bars that end on even hours (e.g., 2:00 pm, 3:00 pm, 4:00 pm, etc.), and you
specify an exit time of 3:15 pm, your trades will not end at 3:15 pm because there's no bar
with that time. In this case, the trade would exit on the open of the 5:00 pm bar, which would
be a moment after 4:00 pm.
If your data has been exported from MetaTrader 4, the bar time is the time the bar opens.
However, the logic works the same way as described above, and the results should be the
same for the same exit-time value.
I specified no more than three entries per day but get four. Why?
The option to limit the number of entries per day uses the EntriesToday function in
EasyLanguage or the equivalent custom-provided function for MetaTrader 4. The strategy
code checks to make sure the current value is less than the specified limit before placing the
orders. However, it can still place two orders – one long and one short – if both entry
conditions apply, either of which or both may be filled, depending on the market. That means
you could get up to two entries if both are filled, which could result in as many as four
entries for the day.

71
Why does Builder sometimes seem to replace my top population member during the
build process?
The program never replaces the top strategy in the population. However, after new strategies
are added, the top strategy may change, which means the top strategy from a prior generation
may no longer be the stop strategy in the current generation. The strategy to replace at each
step is chosen as the least fit member among a small number of randomly chosen members.
The number of such members is given by the so-called tournament size, which can be
changed on the Build Options tab. To decrease the likelihood that one of the top strategies
might be replaced, you can increase the tournament size. The default size is 2. Increasing it
to a high number is not recommended and may hurt the performance of the program.
Why are most of my final strategies the same?
If many or all of your final strategies are the same or similar, you probably need to reduce
the number of generations. After a number of generations, the results will often tend to
converge, resulting in duplicate strategies. This can also happen if insufficient variety is in
the initial population. To get more variety in the initial population, either increase the
population size or make sure that the build sets (indicator and order) have not been overly
restricted by removing too many items. It may also be possible to increase diversity in the
final set of strategies by increasing the mutation rate and decreasing the crossover rate.
How do you know when a strategy is broken and needs to be rebuilt or re-optimized?
Depending on the market, time frame, and other factors, it's always possible that a trading
strategy will stop working at some point and need to be rebuilt or re-optimized. The user's
guide includes a section on this topic. One approach involves tracking the trailing
performance characteristics of the strategy and rebuilding or re-optimizing when the results
start to differ significantly from the long-term averages. A simpler approach is to track the
equity curve and look for deviations from straight-line performance. If the strategy needs to
be rebuilt, it's just as easy with Builder to create a new strategy as it was to develop the
original one.
One point to keep in mind: if you try to re-optimize a strategy's parameter values before the
strategy starts to underperform, there's no reason to think you'll get different results
(assuming it's already optimized). It's only if the strategy has been underperforming that the
optimization process is likely to find better parameter values than those you already found
from the last optimization.
Does changing the settings in the middle of a build affect the build process?
No. Any changes made to the settings, such as build goals or strategy options, have no affect
on an ongoing build. However, if you stop the build then restart it, any changes you've made
will be picked up and used in the new build.
When I compile my MT4 strategy, I get warning messages about functions that have
been deleted from the file. Is there something wrong?
No. Those messages can safely be ignored. The include file for MetaTrader 4 contains
functions for all the different order types any strategy created by Builder might need. No
single strategy will use all the different order types, so the MT4 compiler removes the
functions for the order types that are not used. The warnings are simply telling you that those
functions have been removed from the compiled strategy code. The functions have not been
removed from the include file itself.
Why are some options on Strategy Options not available when I select "AmiBroker" as
the code type?
The AmiBroker Formula Language (AFL) makes it very easy to write simple strategies,
provided they're consistent with the underlying design of AFL. However, more complex

72
strategies can be very difficult, if not impossible, to construct. The degree of complexity
required by Builder-generated strategies makes it impractical to allow AFL strategies that
include both long and short trades in the same strategy. Of course, you can generate separate
populations for long-only and short-only strategies if you plan to trade both sides of the
market. Because strategies can only be long-only or short-only in AmiBroker-generated
Builder code, the option to "Wait for exit before entering new trades" is always checked.
Unchecking it would only be useful for stop-and-reverse strategies containing both long and
short trades.
Tips and Hints The best way to become proficient at using Adaptrade Builder is to spend some time using it
to build strategies. Don’t expect that each and every build process will result in a strategy
that meets your requirements. It’s more likely that after the first run, you’ll want to adjust
some of the metrics and build again. Nonetheless, you’ll soon find the combination of
settings that generates the performance results you want.
The following tips and hints for building strategies with Adaptrade Builder may help you
come up with better strategies in less time. Some of these suggestions were also mentioned in
previous chapters.
Good strategy results for small intraday time intervals, such as 1 min or tick bars, over
long time periods, such as several years, can be difficult to find and take multiple days to
build. A better approach may be to build over a shorter time period and be prepared to
rebuild the strategy every few months to keep up with changing market dynamics.
The option of removing indicators and/or order types from the build set is intended to
allow users with specific preferences for or against specific strategy elements to restrict the
build set to the desired elements. Removing too many items from the build set may reduce
the likelihood of finding viable strategies.
The complexity weight can be used to “break ties” among strategies that give the same
performance results with different numbers of inputs. Setting this weight to a relatively small
value can help to keep the entry conditions from getting too verbose.
Whether or not you use the metric for statistical significance, a significance value of at least
95% is generally desirable. This implies adequate average trade size, low standard
deviation of the trades, and a sufficient number of trades.
A correlation coefficient of at least 0.9 will help ensure that the performance is fairly
uniform over the price history. Lower values often indicate extended flat or down periods.
If you'll be running the program overnight or while it’s unmonitored for an extended
period of time, consider using the "Rebuild on out-of-sample performance" option so that the
program will keep working if it doesn't find good results initially.
The settings on the Build Options tab for Crossover Pct, Mutation Pct, Tree Depth, and
Tournament Size can be considered advanced settings. The default values usually suffice.
However, don’t hesitate to experiment with other values.
Limiting the number of entries per day can often improve results for intraday strategies
because it reduces the number of different market conditions that must be accommodated by
a single strategy.

73
To get a feel for how difficult it will be to find viable strategies for your market,
consider setting the number of generations to zero, and save the entire population. The GP
process will stop after the initial population is randomly generated. You can then sort the
OOS results by net profit to see how many members of the initial population are profitable.
The more profitable results you see from these randomly-generated members, the more likely
it is that you’ll get good results from the build process.
To maximize the chance of finding viable strategies, it’s usually better to start with the
most general set of strategy options and narrow the options only after finding a good
solution. For example, start with the symmetry option unchecked (off), so that you can get
different entry conditions and order types for long and short trades. Provided that works, try
applying the symmetry option to simplify the logic if desired.
To find the simplest possible strategies, set the tree depth to zero. This will effectively
remove the entry conditions, so that the only entry logic is in the entry orders themselves.
When choosing the build metrics, keep in mind that some metrics are related to each
other. For example, the average trade size is related to the number of trades. If you use an
objective for the average trade, you’ll probably end up with fewer trades. Likewise, both
drawdown and correlation coefficient are related to the straightness of the equity curve.
Similarly, minimizing the average losing trade could tend to bias the results towards
strategies with a small average trade (i.e., both wins and losses are smaller) or towards
strategies with a higher profit factor.
The maximum adverse excursion (MAE) tells you how far trades go against you before
they exit. Minimizing the Ave MAE or Max MAE may result in tighter stops. This can be a
good build goal if you have trouble trading strategies that have large open losses, even if the
trades usually exit profitably.
When setting the build metrics, it’s usually best to start with a small number of metrics,
such as three or four. The default selections are often a good starting point. After a few
generations, review the results and add or remove metrics, change the weights, and add or
remove conditions in order to correct any shortcomings you see in the reported results. An
incremental approach usually works better than setting the build metrics once and letting the
build process run for an extended period of time without intervention.
Chapter 6 Menu Commands
File Menu Commands The File menu of Adaptrade Builder offers the following commands:
New Project Creates a new project file.
Open Project
Close Project
Opens an existing project file.
Closes an open project file.
Save Project Saves an opened project file using the same file
name.
Save Project As Saves an opened project file to a specified file name.
Save NinjaScript Strategy
to File
Save MT4 Strategy to File
Save to MSA File
Saves currently selected NinjaTrader strategy code
to a file.
Saves currently selected MetaTrader 4 strategy code
to a file.
Saves trades and settings for currently selected
strategy to a Market System Analyzer (MSA) file.
Print Not currently active; right-click on Performance
Report and Build Report for printing.
Print Preview
Properties
Not currently active.
Display file properties.
Print Setup Selects a printer and printer connection.
Exit
Exits Builder.
Most of the File menu commands will be inaccessible while the build process is running.
New Project Command
Use this command to create a new project file in Builder. The new project will be blank, and
all input setting will be set to their default values. If a project file is currently open, you will
be prompted to save it if necessary before the new project file is initialized.
You can open an existing project file with the Open Project command.
Open Project Command
Use this command to open an existing project file. These documents have the file extension
.gpstrat; e.g., MyBuilderFile.gpstrat.
You can create new project files with the New Project command.
File Open Window
The following options allow you to specify which file to open:
File Name
Specifies the file you want to open. This field lists files with the extension you select in the
pull-down menu to the right of this field.
Files of Type
75
Specifies the type of file you want to open. Builder creates and opens files of type .gpstrat.
You can also select “All Files” in this box, but only files of type .gpstrat can be opened.
Close Project Command Use this command to close the project file. When you close a project file, Builder prompts you to save
the document if it has any unsaved changes. After a project file is closed, the current project is
initialized, as if the New Project command had been selected.
Save Project Command
Use this command to save the active project to its current file name and directory. When you
save a document for the first time, Builder displays the Save As window so you can name
your project file. If you want to change the name and directory of an existing document before
you save it, choose the Save Project As command.
Save Project As Command
Use this command to save and name the active project. Builder displays the Save As window
so you can name your document.
To save a project with its existing name and directory, use the Save Project command.
File Save As Window
The following options allow you to specify the name and location of the file you are about to
save:
File Name
Specifies a file name to save a document with a different name. Builder adds the extension
you specify under Save As Type.
Save NinjaScript Strategy to File Command
Use this command to save the currently selected NinjaTrader strategy code to a .cs file.
Save MT4 Strategy to File Command
Use this command to save the currently selected MetaTrader 4 strategy code to a .mq4 file.
Save to MSA File Command
Use this command to save the trades and settings for the currently selected strategy code to a
Market System Analyzer (MSA, extension .msa) file. Market System Analyzer (MSA) is
position sizing and money management software for trading. Builder will prompt you to enter
a name for the MSA file as well as a name for the text file to which the trades will be saved.
The resulting .msa file can be opened directly by MSA version 3.3 or higher and will include
all current Builder settings that are applicable to MSA. If more than one market was used in
the build process, the point value and trading costs stored in the MSA file will be the ones for
the currently selected market.
Print Setup Command
Use this command to select a printer and a printer connection. This command opens a Print
Setup window, where you specify the printer and its connection.
Print Setup window
The following options allow you to select the destination printer and its connection.
Printer
Specifies the printer you want to use. Choose the default printer; or choose the Specific
Printer option and select one of the current installed printers shown in the pane. You install
printers and configure ports using Control Panel.

76
Orientation
Specifies Portrait or Landscape.
Paper Size
Specifies the size of paper on which the document is to be printed.
Paper Source
Specifies the tray for the paper source, because some printers offer multiple trays for different
paper sources.
Properties
Displays a window where you can make additional choices about printing, specific to the type
of printer you have selected.
Network
Click this button to connect to a network location, assigning it a new drive letter.
Properties Command
Use this command to display information about the currently open project file, including the
file size and path, created and modified dates, and the list of price files in the Market Data
table with full path names, as shown below. The Builder File Version is the version of Builder
that was last used to save the project file, which can be opened with that version or later of
Adaptrade Builder.
Figure 28. File Properties window.
1, 2, 3, …Command
Use the numbers and filenames listed at the bottom of the File menu to open the last ten
documents you closed. Select the number that corresponds to the document you want to open.
Exit Command
Use this command to end your Builder session. Builder prompts you to save the open
document if it has unsaved changes.
Edit Menu Commands The Edit menu of Adaptrade Builder offers the following commands:
Undo Not currently active.

77
Cut
Copy
Not currently active.
Copies the selected strategy code to the clipboard.
Paste
Copy Strategy
Not currently active.
Copy the entire strategy code to the clipboard.
Copy Command
Use this command to copy the part of the strategy code that is currently selected in the
Strategy Code pane. The selected code will be copied to the clipboard in text format.
Copy Strategy Command
Use this command to copy the entire strategy code shown in the Strategy Code pane to the
clipboard in text format.
View Menu Commands The View menu offers the following commands:
Toolbars and Docking
Windows
Shows or hides the toolbars and docking windows
(panes) and provides customization options.
Status Bar
Caption Bar
Welcome Screen…
Application Look
Shows or hides the status bar.
Shows or hides the caption bar.
Displays the Welcome screen.
Presents optional visual styles for the program.
Toolbars and Docking Windows Command
Use this command to show or hide the toolbar, which includes buttons for some of the most
common commands in Builder, such as File Open, and to show or hide the docking windows
(panes) in Builder. A checkmark appears next to the item when it is displayed.
See Toolbar below for help on using the toolbar.
Toolbar
The toolbar is displayed across the top of the application window, below the menu bar. The
toolbar provides quick mouse access to File menu functions (New, Open, Save) and Help
menu functions (About, Help). Place the mouse cursor over a button (without clicking) to
display a brief description of the button. The small, downward-pointing button at the right
edge of the toolbar provides options for adding or removing toolbar buttons and for opening
the Customize menu (see below).
To hide or display the toolbar, select the Standard item from the Toolbars and Docking
Windows command from the View menu.
Customize..
Use this command to customize the menus, toolbars, and keyboard shortcuts.
Status Bar Command
Use this command to display and hide the status bar, which describes the action to be
executed by the selected menu item or depressed toolbar button. A checkmark appears next to
the menu item when the status bar is displayed.
See Status Bar below for help on using the status bar.

78
Status Bar
The status bar is displayed at the bottom of the main window. To display or hide the status
bar, click Status Bar from the View menu.
The left area of the status bar describes actions of menu items as you use the arrow keys to
navigate through menus. This area similarly shows messages that describe the actions of
toolbar buttons as you select them, before releasing them. If after viewing the description of
the toolbar button command you decide not to execute the command, then release the mouse
button while the pointer is off the toolbar button.
The right areas of the status bar indicate which of the following keys are latched down:
Indicator Description
CAP The Caps Lock key is latched down.
NUM The Num Lock key is latched down.
SCRL The Scroll Lock key is latched down.
To the left of the indicators is a Memory Usage bar, which shows the percentage of the
computer's total available memory that is currently in use.
Caption Bar Command
Use this command to show or hide the caption bar. The caption bar is the area below the
toolbar containing the Build button. After clicking the Build button, the button changes to
“Cancel”. Clicking the Cancel button stops the build or evaluation process and changes the
button back to “Build”.
Welcome Screen Command
Use this command to display the Welcome screen. The Welcome screen is normally displayed
when the program starts up and contains information to help you get started using the
program. Options on the Welcome screen include buttons to open example files, a button to
open the Quick Start Steps help topic, and tips for using the program. To prevent the screen
from being displayed when Builder starts up, click the box "Don't display this screen at
startup".
Clicking any of the three buttons for Example Projects will open the corresponding project
(.gpstrat) file and display accompanying text in the text box. If Builder was installed in a
folder other than the default presented during installation, it will be necessary to select the
location of the example projects. By default, the example projects are stored in the Examples
folder in the installation folder for Builder. The default path is C:\Program Files\Adaptrade
Software\Adaptrade Builder x.x\Examples, where x.x is the version number (e.g., 1.5).
Clicking the View Next Tip button will randomly display one of approximately 35 tips for
using Builder.

79
Figure 29. The Welcome screen displays instructional information.
Application Look Command
Use this command to change the style of the menus, toolbars, and other visual elements of the
user interface of the Builder program. To change the program style, select a style from the
popup menu. Styles are available to emulate various Windows programs, such as Office XP,
Office 2003, Office 2007, Windows 2000, and Windows XP. Once the style has been
changed, it will be stored locally, and the program will continue to use that style until a new
style is selected.
Strategy menu Commands The Strategy menu offers the following commands:
Evaluate Evaluates the selected strategy.
Evaluate All Evaluates all saved strategies.
Build
Options
Starts the build process.
Opens Options window for setting program
options.
Evaluate Command
Use this command to evaluate the strategy currently selected in the Build Results table. The
selected strategy will be evaluated over the market data selected on the Markets tab, and the
results will be displayed in Build Results and in the Performance Report, Build Report, Equity
Curve, Trade List, and Strategy Code panes. Use this command to test a strategy over
different market data than used in the build or after changing settings on the Evaluation
Options tab. This command can also be used to update the performance results when opening
a Builder file from an older version of the program. When this command is selected, the Build
button on the caption bar changes to “Cancel”, and a message is displayed in the Output
window indicating that the selected strategy is being evaluated.
Evaluate All Command
Use this command to evaluate all strategies listed in the Build Results table. The strategies
will be evaluated over the market data selected on the Markets tab, and the results will be
displayed in Build Results and in the Performance Report, Build Report, Equity Curve, Trade

80
List, and Strategy Code panes. Use this command to test the strategies over different market
data than used in the build or after changing settings on the Evaluation Options tab. This
command can also be used to update the performance results when opening a Builder file
from an older version of the program. When this command is selected, the Build button on the
caption bar changes to “Cancel”, and messages are displayed in the Output window to indicate
that the strategies are being evaluated.
Build Command
The Build command is the same as clicking the Build button on the caption bar. Use this
command to start the build process. After selecting this command, the Build button changes to
“Cancel”, and progress messages are displayed in the Output window.
Options Command
The Options command opens the Options window, shown in Fig. 30, which allows the user to
select program options. Options selected on this window are stored in the Windows registry
and affect all project files.
There are currently five available program options. The first available option is the number of
concurrent parallel processes used while building strategies. The default value is the number
of available processor cores recognized by Builder. Set this to a lower number if you want to
free up processing power for other programs running concurrently with Builder. Set this to a
higher number if Builder has not recognized all the available cores on your computer, such as
sometimes occurs with hyperthreaded processors.
The second option allows you to choose the set of performance metrics used with new
projects. As explained in Chapter 3, Input Data & Settings, Metrics, the set of build metrics
can be changed for any open project by right-clicking on the results table. The default set of
build metrics, which is used for new projects, is selected here. Clicking the Change Metrics
button opens the Change Performance Metrics window, as shown in Chapter 3 in Fig. 24.
After modifying the list of selected metrics, click OK on the Options window to save the list
in the Windows registry. The updated list will be used the next time a new project is created
from the File menu.

81
Figure 30. Program options are selected on the Options window.
The third option controls the length of the so-called time-out interval. This is the maximum
length of time the program will spend to evaluate a single strategy before terminating the
process and displaying an error message. The default value is 2.5 minutes. If it takes longer
than this to evaluate a strategy, there may be a problem with the build settings. For example,
there may be too many trades in the strategy. If a strategy has hundreds of thousands of trades,
it can take more than a few minutes to evaluate. This sometimes happens if the trading costs
have been set to zero. In this case, a strategy will not be penalized for a large number of trades
with zero profit/loss. See Usage Topics, Build Time, for more on this topic.
The Auto-Save option, if selected, automatically saves the project (.gpstrat) file at each step
during the build process. The project file is saved following population initialization and after
each generation. The project file name must exist (i.e., the file must have been saved
previously). A message is displayed in the Output window during building to indicate that this
option has been selected.
The Price File Folders option allows you to change where the program looks for price data
files. Whenever a price data file is added to the Markets tab, the path to the selected file is
stored in the list shown here. When Builder reads the price data file, it looks for the price data
file in one of the folders in the list. To view or modify this list, click the button "Add or
Change Price File Folders". This will open the window shown below in Fig. 31.
If Builder cannot find a price data file shown on the Markets tab, either re-select the file on
the Markets tab or select the file here using the Add Folder button. To remove a folder from
the list, select the folder and click the Delete Folder button. When opening a price data file,
Builder looks in the folders in the order they're listed in the Price File Folders window. Use
the Move Up and Move Dn buttons to change the order of the folders if desired to put folders
where your price data files are more commonly stored near the top of the list.
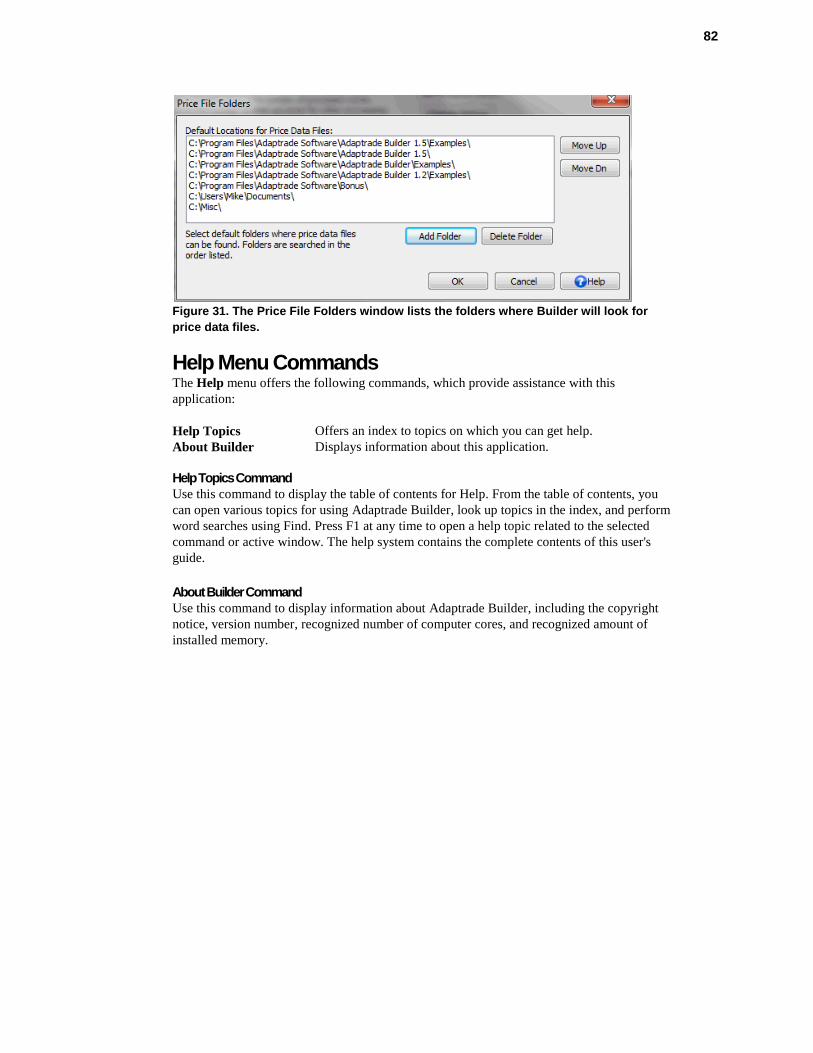
82
Figure 31. The Price File Folders window lists the folders where Builder will look for
price data files.
Help Menu Commands The Help menu offers the following commands, which provide assistance with this
application:
Help Topics Offers an index to topics on which you can get help.
About Builder Displays information about this application.
Help Topics Command
Use this command to display the table of contents for Help. From the table of contents, you
can open various topics for using Adaptrade Builder, look up topics in the index, and perform
word searches using Find. Press F1 at any time to open a help topic related to the selected
command or active window. The help system contains the complete contents of this user's
guide.
About Builder Command
Use this command to display information about Adaptrade Builder, including the copyright
notice, version number, recognized number of computer cores, and recognized amount of
installed memory.
Appendix: Performance Metrics
The different performance metrics calculated by Builder are described below. These metrics
are used on the Metrics tab and are reported in the Build Results table and in the detailed
Performance Report. When used to calculate the fitness function, the metrics are calculated
over the in-sample data segment. The first name shown below for each metric is the label
displayed in the detailed Performance Report, followed by the abbreviation in parentheses,
which is used on the Metrics tab and in the results table. Unless otherwise noted, metrics are
calculated from the closed trades only.
Closed Trade Net Profit (Net Profit). The total net profit is the total profit (gross profit
minus gross loss) for all closed trades, both wins and losses, in the trading period.
Gross Profit. The sum of the winning trades.
Gross Loss. The sum of the losing trades.
Profit Factor (Prof Fact). Gross profit divided by the absolute value of gross loss. Profit
factors of 1.5 or more suggest a strong system.
Ratio L/S Net Profit (Ratio L/S Profit). Ratio of net profit for long trades to net profit for
short trades.
Open Trade Profit/Loss (Open Profit). Net profit or loss for all trades that are open at the
end of the trading period. There can be at most one open trade per market-system.
Total Net Profit (Total Net Profit). The total net profit is the total profit for all trades, both
wins and losses, open and closed, in the trading period. This is the sum of the closed trade
net profit and the open trade profit/loss.
Trading Period. Time span of trading, as selected on the Markets tab.
Starting Account Equity. Value of account equity at the start of trading.
Highest Equity (Equity High). The highest value of account equity on an intra-bar basis over
the trading period.
Lowest Equity (Equity Low). The lowest value of account equity on an intra-bar basis over
the trading period.
Final Account Equity (Final Equity). Value of account equity at the end of the trading
period.
Return on Starting Equity (Account Return). Percentage change in account equity from the
starting account equity to the final account equity.
Total Number of Trades (No. Trades). Total number of trades in the trading period.
Number of Winning Trades (No. Wins). Total number of trades with a profit/loss greater
than zero.
84
Number of Losing Trades (No. Losses). Total number of trades with a profit/loss less than
or equal to zero.
Trades Not Taken (No. Skipped). Total number of trades with a position size of zero.
Percent Profitable (Pct Wins). The number of winning trades expressed as a percentage of
the number of trades with non-zero position size (i.e., excluding trades not taken).
Ratio L/S Number of Trades (Ratio L/S Trades). Ratio of the number of long trades to the
number of short trades, excluding trades not taken.
Trades Per Year. Average number of trades per year, including open trades.
Trades Per Month. Average number of trades per month, including open trades.
Trades Per Week. Average number of trades per week, including open trades.
Trades Per Day. Average number of trades per day, including open trades.
Max Position Size (Max Shares). Largest number of shares or contracts for any one trade.
Minimum Position Size (Min Shares). Smallest number of shares or contracts of any trade,
excluding trades with zero shares or contracts.
Average Position Size (Ave Shares). Average number of shares or contracts per trade,
excluding trades with zero shares or contracts.
Largest Winning Trade (Max Win). Largest winning trade, where the winners are expressed
in currency units (e.g., dollars).
Largest Winning Trade (%) (Max Win (%)). Largest winning trade, where each winner is
expressed as a percentage of account equity at the time the trade was taken.
Average Winning Trade (Ave Win). Average of the winning trades, where the winners are
expressed in currency units (e.g., dollars).
Average Winning Trade (%) (Ave Win (%)). Average of the winning trades, where each
winner is expressed as a percentage of account equity at the time the trade was taken.
Average Bars in Wins (Ave Bars Wins). Average number of bars in winning trades.
Average Length of Wins (Ave Length, Wins). Average duration of winning trades in days,
hours, minutes, seconds.
Max Number Consecutive Wins (Max Consec Wins). Largest number of winning trades in
a row.
Average R-Multiple, Wins (Ave R-Mult, Wins). The R-multiple is the trade profit/loss
divided by the risk of the trade, including trading costs. See Tharp, Van K. “Trade Your Way
to Financial Freedom,” 2nd
ed., McGraw-Hill, New York, 2007. This metric is the average of
the R-multiples for winning trades.
Largest Losing Trade (Max Loss). Largest losing trade, where the losses are expressed in
currency units (e.g. dollars).

85
Largest Losing Trade (%) (Max Loss (%)). Largest losing trade, where each loss is
expressed as a percentage of account equity at the time the trade was taken.
Average Losing Trade (Ave Loss). Average of the losing trades, where the losses are
expressed in currency units (e.g. dollars).
Average Losing Trade (%) (Ave Loss (%)). Average of the losing trades, where each loss is
expressed as a percentage of account equity at the time the trade was taken.
Average Bars in Losses (Ave Bars Loss). Average number of bars in losing trades.
Average Length of Losses (Ave Length, Losses). Average duration of losing trades in days,
hours, minutes, seconds.
Max Number Consecutive Losses (Max Consec Losses). Largest number of losing trades in
a row.
Average R-Multiple, Losses (Ave R-Mult, Losses). The R-multiple is the trade profit/loss
divided by the risk of the trade, including trading costs. See Tharp, Van K. “Trade Your Way
to Financial Freedom,” 2nd
ed., McGraw-Hill, New York, 2007. This metric is the average of
the R-multiples for losing trades.
Average Trade (Expectation, Ave Trade). Sum of all trades, wins and losses, divided by
the total number of trades, excluding trades with zero position size. When choosing the build
metrics, keep in mind that the average trade is related to the number of trades. Setting a
weight value for this metric will tend to result in strategies with a higher average trade and
fewer trades.
Average Trade (%) (Ave Trade (%)). Average of all trades, where each trade is expressed
as a percentage of account equity at the time the trade was taken.
Trade Standard Deviation (Trade Std Dev). Standard deviation of the trades, where the
trades are expressed in currency units (e.g. dollars). The standard deviation is a measure of
variability or dispersion. 68% of normally distributed values are within one standard deviation
of the average. 99.7% are within three standard deviations of the average.
Trade Standard Deviation (%) (Trade Std Dev (%)). Standard deviation of the trades,
where each trade is expressed as a percentage of account equity at the time the trade was
taken.
Average Bars in Trades (Ave Bars). Average number of bars in all trades, both wins and
losses. Consider setting a target and/or weight value for this metric if you want to limit the
length of trades in the generated strategies.
Average MAE (Ave MAE). Average maximum adverse excursion. The maximum adverse
excursion (MAE) is the worst-case intra-trade drawdown; i.e., the largest loss on an open
trade. The Ave MAE is the average of the MAE’s over all trades. Consider setting a target
and/or weight value for this metric if you want to limit intra-trade drawdown in the generated
strategies.
Average MAE (%) (Ave MAE (%)). Average maximum adverse excursion (MAE), where
the adverse excursion is expressed as a percentage of equity. The Ave MAE (%) is the

86
average of the percentage MAE’s over all trades. Consider setting a target and/or weight
value for this metric if you want to limit intra-trade drawdown in the generated strategies.
Maximum MAE (Max MAE). Maximum value of the maximum adverse excursion (MAE).
The Max MAE is the largest of the MAE’s over all trades. Consider setting a target and/or
weight value for this metric if you want to limit intra-trade drawdown in the generated
strategies.
Maximum MAE (%) (Max MAE (%)). Maximum value of the maximum adverse
excursion (MAE) in percent of equity. The Max MAE (%) is the largest of the percentage
MAE’s over all trades. Consider setting a target and/or weight value for this metric if you
want to limit intra-trade drawdown in the generated strategies.
Win/Loss Ratio. Ratio of the average win to the absolute value of the average loss.
Win/Loss Ratio (%). Ratio of average winning trade to average losing trade, where each
trade is expressed as a percentage of account equity at the time the trade was taken.
Return/Drawdown Ratio (Ret/DD Ratio). Ratio of the percentage account return to the
worst-case percentage drawdown.
Sharpe Ratio. Average monthly return minus the risk-free interest rate, all divided by the
standard deviation of the monthly returns. The risk-free interest rate is assumed to be zero.
This is a classic measure of risk-adjusted return. Higher values are better.
Sortino Ratio. Average monthly return minus the target return, all divided by the so-called
downside deviation. The downside deviation is similar to the standard deviation except that
positive deviations are set to zero, whereas in the standard deviation, both positive and
negative deviations are included. The Sortino ratio is an alternative to the Sharpe ratio and is
sometimes preferred because it doesn't penalize positive returns that exceed the target value.
In Builder, the target rate of return is set to zero. The Sortino ratio is generally higher than the
Sharpe ratio.
MAR Ratio. Average annual compounded rate of return divided by the maximum historical
percentage drawdown. The MAR ratio is often used to evaluate and compare hedge funds and
commodity trading advisors (CTAs). MAR ratios between 0.5 and 1.0 over long histories are
generally considered excellent.
Correlation Coefficient (Corr Coeff). Correlation coefficient of the equity curve. The
correlation coefficient varies from -1 to +1, with values close to +1 indicating a straight,
upward sloping curve. Values above 0.9 indicate a fairly straight equity curve and therefore
less variation in returns over different periods. If position sizing is applied such that larger
positions are taken as the account equity grows (antimartingale position sizing), then the
correlation coefficient is applied to the logarithm of the equity curve.
Statistical Significance (Significance). Student's t-test applied to the average trade. This
represents the probability in percent that the average trade is greater than zero, taking into
account the statistical properties of the distribution of trades and the number of degrees-of-
freedom of the trading strategy. The number of degrees-of-freedom is the number of trades
minus the number of inputs to the strategy. The more degrees-of-freedom, the better. A
significance level of 95% or greater is generally desirable.
Complexity. In Builder, strategy complexity is defined as the number of strategy inputs.
Builder includes an input for each adjustable parameter used in an entry rule, entry order, or

87
exit order. The complexity is incremented by 2 to account for position sizing (1 for the
method and 1 for the parameter value). The total number of inputs is a measure of the
complexity of the system. Lower complexity implies a greater number of degrees-of-freedom
and a lower likelihood of over-fitting.
In many cases, after some number of generations, the top results will tend to converge so that
several strategies with different number of inputs will produce the same performance results.
Setting the weight for complexity to a small value can be a way to “break ties” among these
otherwise similar strategies based on the number of inputs. For example, you may find that
the top 10 strategies have the same performance results but several of them have extra inputs.
If the complexity is part of the fitness function, the strategies with the fewest inputs will be
ranked higher.
Average Risk (Ave Risk). Average risk for all trades. The risk is the amount per contract or
share that would be lost if the money management (protective) stop were hit, including trading
costs.
Average Risk (%) (Ave Risk (%)). Average risk where the risk (see Ave Risk, above) is
expressed as a percentage of account equity at the time the trade is taken.
Average R-Multiple (Ave R-Mult, Expectancy). The R-multiple is the trade profit/loss
divided by the risk of the trade, including trading costs. See Tharp, Van K. “Trade Your Way
to Financial Freedom,” 2nd
ed., McGraw-Hill, New York, 2007. This metric is the average of
the R-multiples for all trades, both wins and losses. Tharp refers to this as the expectancy.
R-Mulitple Standard Deviation (R-Mult Std Dev). Standard deviation of R-multiples over
all trades, both wins and losses.
Average Leverage (Ave Leverage). Average value of leverage over all positions. Leverage is
defined as the position value divided by the account equity.
Maximum Leverage (Max Leverage). Largest value of leverage over all positions. Leverage
is defined as the position value divided by the account equity.
Risk of Ruin. Probability of account depletion. See Vince, Ralph. "Portfolio Management
Formulas," John Wiley & Sons, New York, 1990, p. 136, equation R3. The equation for risk
of ruin assumes (1) unequal wins and losses, (2) a fixed number of contracts or shares per
trade, and (3) ruin is defined as 100% account depletion.
Kelly f. The Kelly fraction (f) is typically used to calculate position size. However, here it's
used as a measure of strategy quality. Expressed as a percentage, Kelly fractions greater than
roughly 20% can be considered higher quality strategies.
Average Annual Profit/loss (Ave Annual P/L). Average of all yearly profits (losses),
including partial years.
Ave Annual Compounded Return (Ave Annual Return). Average annual rate of return
assuming annual compounding.
Average Monthly Profit/loss (Ave Monthly P/L). Average of all monthly profits (losses),
including partial months.
Ave Monthly Compounded Return (Ave Monthly Return). Average monthly rate of return
assuming monthly compounding.

88
Average Weekly Profit/loss (Ave Weekly P/L). Average of all weekly profits (losses),
including partial weeks.
Ave Weekly Compounded Return (Ave Weekly Return). Average weekly rate of return
assuming weekly compounding.
Average Daily Profit/loss (Ave Daily P/L). Average of all daily profits (losses).
Ave Daily Compounded Return (Ave Daily Return). Average daily rate of return assuming
daily compounding.
In Builder, drawdown is defined as a decline from the highest prior peak in intra-bar equity.
The drawdown is measured from the highest prior peak to the lowest intra-bar equity value.
Because Builder does not have access to intra-bar price points other than the open, high, low,
and close, the order of the high and low prices is assumed based on the bar shape. This
assumption can affect the intra-bar equity and drawdown calculations, which are therefore
approximate on an intra-bar basis.
Number of Drawdowns (No. Drawdowns). This is the total number of drawdowns over the
trading period.
Average Drawdown (Ave Drawdown). Average value of the drawdowns expressed in
currency units (e.g., dollars).
Average Drawdown (%) (Ave Drawdown (%)). Average value of the drawdowns expressed
as percentage declines from the prior highest peak in equity.
Average Length of Drawdowns (Ave Length, Drawdowns). Average duration of
drawdowns in days, hours, minutes, and/or seconds.
Average Trades in Drawdowns (Ave Trades, Drawdowns). Average number of trades from
the start of a drawdown until the first trade that makes a new equity high.
Worst Case Drawdown (Drawdown). Largest drawdown, where the drawdowns are
expressed in currency units (e.g., dollars).
Date at Trough (Date, Max Drawdown). The date at the lowest equity point during the
worst-case drawdown.
Length of Drawdown (Length, Max Drawdown). Duration of worst-case drawdown, from
the start of the drawdown to the trade that makes a new equity high.
Trades in Drawdown (Trades, Max Drawdown). The number of trades from the start of the
worst-case drawdown until the trade the makes a new equity high.
Worst Case Drawdown (%) (Max Drawdown (%)). Largest value of the drawdowns
expressed as percentage declines from the prior highest peak in equity.
Date at Trough (Date, Max % Drawdown). The date of the trade at the lowest equity point
during the worst-case percentage drawdown.
Length of Drawdown (Length, Max % Drawdown). Duration of worst-case percentage
drawdown, from the start of the drawdown to the trade that makes a new equity high.

89
Trades in Drawdown (Trades, Max % Drawdown). The number of trades from the start of
the worst-case percentage drawdown until the trade that makes a new equity high.
Longest Drawdown. Duration of longest drawdown, from the first trade in the drawdown to
the trade that makes a new equity high.
Start of Drawdown (Start, Longest Drawdown). Date at the start of the longest drawdown.
End of Drawdown (End, Longest Drawdown). Date at the end of the longest drawdown.
Percent of Equity (% of Equity, Longest Drawdown). Depth of longest drawdown,
expressed as a percentage decline from the prior equity peak.
Longest Flat Period (Max Flat Period). Duration of longest period with no change in
equity.
Appendix: Technical Indicators
Adaptrade Builder currently includes the indicators described below, which are also listed in Table 1
in Chapter 1. Subsequent versions of Builder may include other indictors as well. Most indicators
include one or more inputs, such as the averaging length for a moving average. The values of these
inputs are chosen by Builder during the build process from the range of values specified on the
Strategy Options tab.
Simple moving average Simple moving average of price over past the most recent N bars, where N is an input. The simple
moving average adds up the price over the past N bars and divides by N.
Exponential moving average Exponential moving average (XMA) of price. The XMA is an exponentially weighted average of
price. As additional prices are added, their contribution decreases exponentially as (1 - alpha)^N,
where alpha = 2/(1 + N). Because more recent prices are weighted more heavily, the XMA is
considered to be more responsive to price changes than the simple moving average.
Weighted moving average Weighted moving average of price. The weighted average assigns more weight to recent prices. The
weight value decreases by 1 starting with the current bar. Because more recent prices are weighted
more heavily, the weighted average is considered to be more responsive to price changes than the
simple moving average.
Triangular moving average1,2
Triangular moving average of price. The triangular moving average is the simple moving average of
the simple moving average of price, where the length of the simple moving averages is one-half the
specified length of the triangular moving average. Because the triangular moving average is a double-
smoothed simple moving average, it weights the middle portion of the look-back period most heavily.
Adaptive variable moving average (Adapt Variable MA) This is an extension of Tushar Chande VIDYA indicator, which is essentially an exponential moving
average in which the smoothing constant (alpha) adapts to market volatility or trend strength. In
Chande's version, the effective period of the moving average decreases with the trend strength so that
highly trending markets have a short moving average period and sideways or choppy markets have a
long period moving average.
This version adds an extra input, TrendParam, which can be used to change the relationship between
trend and moving average period. Positive values of TrendParam give the same relationship as in
Chande's version, where a TrendParam of 1 is similar to VIDYA. Negative values of TrendParam
reverse the relationship, so that the period increases with the trend strength and decreases with flat or
trendless markets. A TrendParam of zero is a regular exponential moving average with no dependence
on trend. Reasonable values of TrendParam are between roughly -5 and +5.
Zero-lag trend Moving average of price based on John Ehlers' ITrend or InstTrend indicator in Cybernetic Analysis
for Stocks and Futures, John Wiley & Sons, Inc, New Jersey, 2004, pp. 16, 24. According to Dr.
Ehlers, this indicator has essentially zero lag for price frequencies within the range of interest to most
traders.

91
Adaptive zero-lag trend (Adapt Zero-Lag Trend) This is an extension of the zero-lag trend indicator, which is based on John Ehlers' ITrend or
InstTrend indicator in Cybernetic Analysis for Stocks and Futures, John Wiley & Sons, Inc, New
Jersey, 2004, pp. 16, 24.
In this version, the smoothing constant (alpha) adapts to market volatility or trend strength, depending
on the input TrendParam, which defines the relationship between trend and moving average period.
Positive values of TrendParam give a short moving average period during highly trending markets
and a long period moving average during sideways or choppy markets. Negative values of
TrendParam reverse the relationship, so that the period increases with the trend strength and decreases
with flat or trendless markets. A TrendParam of zero gives a period equal to Length (i.e., independent
of trend strength). The efficiency ratio is used as a measure of trend strength. Reasonable values of
TrendParam are between roughly -5 and +5.
Moving average convergence divergence (MACD) Moving average convergence divergence indicator. The MACD is calculated as the difference
between two exponential moving averages of price.
Triple exponential moving average (TRIX)1
The triple exponential moving average (TRIX) indicator starts by taking the natural logarithm of
price, which is then smoothed by applying the exponential moving average three times. The TRIX is
calculated as the difference between successive values of the triply-smoothed result multiplied by a
normalizing factor of 10000. The TRIX acts as an oscillator with values typically ranging from -100
to +100.
Momentum Momentum is an oscillator calculated as the difference between the current price and the price N bars
ago, where N is an input. Positive values indicate that prices are rising, whereas negative values
indicator that prices are falling.
Rate of change (ROC)1
ROC is an oscillator calculated as the ratio of the current price to the price N bars ago, subtracted
from 1 and multiplied by 100. Positive values indicate that prices are rising, whereas negative values
indicator that prices are falling.
Fast K stochastic
1,2
The Fast K stochastic is a price oscillator scaled to the range 0 to 100. It’s calculated as the difference
between the bar’s close and the lowest low, all divided by the difference between the highest high and
the lowest low. High values are generally considered to represent so-called over-bought conditions,
whereas low values are generally considered to represent so-called over-sold conditions.
Fast D stochastic The Fast D stochastic is a price oscillator scaled to the range 0 to 100. It’s calculated as a 3-period
exponential moving average of the Fast K stochastic. High values are generally considered to
represent so-called over-bought conditions, whereas low values are generally considered to represent
so-called over-sold conditions.
Slow D stochastic The Slow D stochastic is a price oscillator scaled to the range 0 to 100. It’s calculated as a 3-period
exponential moving average of the Fast D stochastic, in which the exponential moving average uses a
smoothing factor of 1/N, rather than the value 2/(1 + N) of the normal XMA. High values are
generally considered to represent so-called over-bought conditions, whereas low values are generally
considered to represent so-called over-sold conditions.

92
Relative strength indicator (RSI) The RSI is a momentum oscillator that indicates the strength of the market within a range of 0 to 100.
The calculation is based on the ratio of up price changes to down price changes. High values are
generally considered to represent so-called over-bought conditions, whereas low values are generally
considered to represent so-called over-sold conditions.
Inverse Fisher RSI Inverse Fisher transform of the RSI indicator. The inverse Fisher transform provides sharper turning
points for the RSI. The price values are smoothed with a 4-bar weighted moving average before
applying the RSI. Indicator values lie between -1 and +1.
Inverse Fisher cycle Inverse Fisher transform of John Ehlers' Stochastic Cyber Cycle indicator from Cybernetic Analysis
for Stocks and Futures, John Wiley & Sons, Inc, New Jersey, 2004, p. 75. The Cyber Cycle is an
oscillator derived from the cyclic component of price. After computing the stochastic cyber cycle and
scaling it to -5 to +5, the inverse Fisher transform is taken to provide sharper turning points. Indicator
values lie between -1 and +1.
Adaptive inverse Fisher RSI (Adapt Inv Fisher RSI) This is an extension of the inverse Fisher RSI indicator, which applies the inverse Fisher transform to
the RSI function in order to provide sharper turning points in the RSI. In this version, the smoothing
constant (alpha) adapts to market volatility or trend strength, depending on the input TrendParam,
which defines the relationship between trend and moving average period. Positive values of
TrendParam give a short moving average period during highly trending markets and a long period
moving average during sideways or choppy markets. Negative values of TrendParam reverse the
relationship, so that the period increases with the trend strength and decreases with flat or trendless
markets. A TrendParam of zero gives a period equal to Length (i.e., independent of trend strength).
The efficiency ratio is used as a measure of trend strength. Reasonable values of TrendParam are
between roughly -5 and +5. Indicator values lie between -1 and +1.
Adaptive inverse Fisher cycle (Adapt Inv Fisher Cycle) This is an extension of the inverse Fisher cycle indicator, which is based on John Ehlers' Stochastic
Cyber Cycle indicator from Cybernetic Analysis for Stocks and Futures, John Wiley & Sons, Inc,
New Jersey, 2004, p. 75. The Cyber Cycle is an oscillator derived from the cyclic component of price.
In this version, the smoothing constant (alpha) adapts to market volatility or trend strength, depending
on the input TrendParam, which defines the relationship between trend and moving average period.
Positive values of TrendParam give a short moving average period during highly trending markets
and a long period moving average during sideways or choppy markets. Negative values of
TrendParam reverse the relationship, so that the period increases with the trend strength and decreases
with flat or trendless markets. A TrendParam of zero gives a period equal to Length (i.e., independent
of trend strength). The efficiency ratio is used as a measure of trend strength. Reasonable values of
TrendParam are between roughly -5 and +5. Indicator values lie between -1 and +1.
Commodity channel index (CCI) The commodity channel index (CCI) is an oscillator calculated as the deviation of the average price,
(H+L+C)/3, divided by the average deviation of the average price. The ratio is adjusted by a factor
that helps keep most values within the range -200 to +200.
Directional indicator (DI+/DI-) DI+ is the positive directional indicator, whereas DI- is the negative directional indicator. DI+
indicates the presence of an up trend, whereas DI- indicates the presence of a down trend.
Directional movement index (DMI)1,2
The DMI indicates the strength of the price trend. The DMI is calculated as the absolute value of the
difference between DI+ and DI- divided by the sum of DI+ and DI-, multiplied by 100.

93
Average directional index(ADX) The ADX indicates the strength of the price trend. The ADX is calculated as an exponential moving
average of the DMI.
True range (TR) The TR is the difference between the true high (highest of the current bar’s high and the prior close)
and the true low (lowest of the current bar’s low and the prior close). The TR is intended to more
accurately represent the bar’s range than the high minus the low when the prior close is outside of the
current bar’s range.
Average true range (ATR) The ATR is the simple moving average of the true range over the past N bars, where N is an input.
Standard deviation The standard deviation is the population (as opposed to sample) standard deviation of price over the
past N bars, where N is an input. The standard deviation is a type of price difference and can be
compared to other price differences within Builder.
Bollinger band The Bollinger band is the average price plus a multiple of the standard deviation of price. If the
number of standard deviations is positive, the result is an upper band. If the number of standard
deviations is negative, the result is a lower band. The upper and lower bands are traditionally used to
indicate a range of "normal" price movement.
Keltner channel1
The Keltner channel is the average price plus a multiple of the average true range. As with Bollinger
bands, positive and negative multiples are used to produce upper and lower bands of the Keltner
channel.
Lowest The lowest price over the past N bars, where N is an input. Because the Lowest function returns a
price, it is used in Builder where a price value is required, such as in the calculation of stop and target
prices.
Highest The highest price over the past N bars, where N is an input. Because the Highest function returns a
price, it is used in Builder where a price value is required, such as in the calculation of stop and target
prices.
Volume The volume is the number of shares or contracts traded. For tick data, Builder uses the sum of the up
and down tick volumes. Builder uses volume in several ways: the volume on the current bar, the
volume N bars ago, the moving average or exponential moving average of volume, and the highest or
lowest volume over the past N bars. Any of these volume values may be compared to any other.
Accumulation/distribution The Accumulation/distribution line is a volume oscillator, calculated by accumulating a portion of the
volume of each bar. The amount of volume added at each bar is equal to the difference between the
close and the open divided by the range. The use of this indicator in MetaTrader 4 strategies is not
recommended because its value depends strongly on the starting bar, which cannot be controlled in
MetaTrader. As a result, it's likely that different values for the indicator will be found in Builder than
in MetaTrader 4.
Chaiken oscillator1
The Chaiken oscillator is the difference between two exponential moving averages of the
accumulation distribution line.

94
Crosses Above/Below1
The crosses above indicator returns “true” if the first input is above the second input on the current
bar and below it on the prior bar. If the two inputs are equal on the prior bar, the indicator looks back
up to the maximum look-back length to determine if the first input was below the second. If not, the
indicator returns “false”. The crosses below indicator works analogously to “crosses above” to return
“true” if the first input crosses below the second input on the current bar and returns “false”
otherwise. The crosses above/below indicators can be used anywhere that inequality operators (>, <,
<=, >=) apply, including with moving averages, stochastics, RSI, MACD, momentum, and so on.
Price patterns A price pattern in Builder is defined as the comparison between two prices, where the price can any of
the following: simple price (O, H, L, C), look-back price (O[N], H[N], L[N], C[N]), a day price
(OpenD(0), HighD(0), LowD(0), CloseD(1)), or any other selected indicator that returns price, such
as highest, lowest, and moving averages. The comparison between the two prices may be <, <=, >, or
>=. Builder may construct any number of price patterns, depending on the tree depth and the other
indicators selected as part of the build process.
Day of week The day-of-week indicator returns an integer value from 1 to 7 to represent the day of week.
Time of day The time-of-day indicator returns the time of the price bar N bars ago, where N is an input. Typically,
the time of a price bar is the time at which the bar closes.
Absolute value The absolute value function is used when computing the difference between prices. Normally, when
using the price difference in a stop or target, the absolute value is applied to ensure that the price
difference is a non-negative number. You can exclude this function from the build set to remove this
restriction.
1Indicator not available for MetaTrader 4 code.
2Indicator not available for AmiBroker code.

Appendix: Code Conventions
The strategy code generated by Builder uses various naming conventions for inputs, variables, and
order type labels. Unless otherwise noted, the same naming conventions apply to all code types
available in Builder.
The strategy code naming conventions for input variables are shown below.
N : integer or number, typically an indicator look-back length (e.g., N1, NATR).
X : floating point value (e.g., X1, X2, etc.).
En or Ent : entry (e.g., EntFr, ATRFrEn).
Ex : exit (e.g., TimeEx, NBarEx1).
Fr : fraction or multiple (e.g., EntFr).
Targ : target exit (e.g., TargFr).
MM : money management (protective) stop (e.g., MMFr).
StartEquity: starting equity value for position sizing calculations.
PSParam : position sizing parameter value, such a fixed fraction, delta (fixed ratio), percent of
equity, etc.
RoundPS : true/false variable. True means round position size to nearest RoundTo increment.
RoundTo : value to round position size to if RoundPS is true; ignored if RoundPS is false.
SizeLimit : maximum allowable number of shares or contracts per trade.
As an example, consider the following code from the input section of a generated EasyLanguage
strategy, with comments added to explain each input:
NBarEn1 (60), // Number of bars, entry
NBarEn2 (14), // Number of bars, entry
NBarEn3 (5), // Number of bars, entry
EntFr (2.6909), // Entry fraction of price difference or average true range (ATR)
NATR (30), // Look-back length for ATR
TargFr (1.7681), // Target fraction; fraction/multiple of ATR
MMFr (1.51), // Money management stop fraction; fraction/multiple of ATR
N1 (27), // Indicator look-back length
N2 (59), // Indicator look-back length
N3 (27), // Indicator look-back length
N4 (59), // Indicator look-back length
N5 (61), // Indicator look-back length
X1 (10.0000), // Indicator parameter (floating point) value
NATR (79), // Look-back length of ATR
ATRFrEn (2.8858), // Fraction/multiple of ATR for entry
TimeEx (1015), // Exit time
StartEquity (100000.00), // Starting account equity; for position sizing calculations
PSParam (28.39), // Position sizing parameter value; e.g., percent of equity
RoundPS (true), // Round position size to nearest RoundTo
RoundTo (1), // Round position sizing to nearest 1
SizeLimit (100); // Limit position size to 100 shares or contracts
Strategy code generated by Builder also includes labels for the entry and exit orders. In TradeStation,
these labels are listed in the Trade List and appear on the chart next to each entry and exit. The order
labels added by Builder are shown below.
EnStop-L : Entry stop order
EnLimit-L : Limit entry order

96
EnMark-L : Market entry order
ExMark-L : Market exit order
ExTime-L : Exit-at-time order
ExNBars-L : Exit at N bars from entry order
ExStop-L : Money management (protective) stop exit order
ExTrail-L : Trailing stop exit order
ExTmRnge-L : Exit based on time range option (only for strategies built prior to version 1.3.0.0)
ExTarg-L : Target exit order
The "L" at the end of each label indicates that the order is for a long trade. Order labels for short
trades end in "S".
Variables for Entry and Exit Conditions
The entry and exit conditions in Builder can be quite complex and may consist of multiple variables
and multiple logical condition statements. Variables for numeric quantities, such as indicators, start
with "Var" and end with "L" for long conditions or "S" for short-side conditions, followed by a
number. Examples include VarL1, VarL2, VarS1, VarS2, etc.
Variables for logical conditions, which involve logical or inequality operators, follow the same
convention as numeric variables except that they begin with "Cond". Examples include CondL1,
CondL2, CondS1, CondS2, etc. An example showing how these variables are used is provided in
Chapter 1, Entry and Exit Conditions.
The entry and exit conditions themselves are assigned to variables EntCondL, EntCondS, ExCondL,
and ExCondL for, respectively, long and short entry conditions and long and short exit conditions.

Index
Adaptrade Software web site .............................. 19
AmiBroker ... 1, 2, 7, 11, 20, 29, 30, 39, 58, 59, 68,
71, 94
artificial intelligence ............................................. 2
Average Drawdown ............................................ 88
Average Losing Trade ......................................... 85
Average Number of Shares/Contracts ................. 84
Average Number of Trades in Drawdowns ......... 88
average trade ..................................... 38, 65, 68, 72
Average Trade ..................................................... 85
average true range ............................................... 67
Average Winning Trade ...................................... 84
bar size .......................................................... 23, 36
bar type ......................................................... 23, 36
bid/ask ..................................................... 38, 40, 66
Build button .......................... 14, 22, 29, 78, 79, 80
build goals ..................................... 4, 28, 46, 51, 73
build set ................................... 4, 13, 25, 43, 72, 94
Cancel button ...................................................... 29
complexity............................. 43, 51, 65, 66, 72, 86
correlation coefficient ................................... 65, 72
crossover ................................. 2, 3, 4, 6, 28, 51, 52
Custom Indicators ............................................... 33
Data Window ................................................ 22, 32
degrees-of-freedom ............................. 2, 65, 86, 87
delimiter .................................................. 23, 33, 35
delimiters............................................................. 32
docking windows ..................................... 21, 54, 77
EasyLanguage ................................................. ii, iii
ETFs ...................................................................... 2
Evaluate ...................................... 29, 39, 59, 67, 79
Expert Advisor .............................................. 30, 59
file properties ................................................ 74, 76
Final Account Equity .......................................... 83
fitness ........ 2, 3, 4, 5, 14, 28, 29, 50, 52, 54, 83, 87
fixed ratio ............................................................ 42
floor ....................................................................... 9
forex ...................................................................... 2
futures ................................................................... 2
generations ... 2, 3, 5, 14, 16, 17, 28, 29, 51, 52, 66,
73, 87
genetic programming 2, 3, 4, 13, 25, 28, 43, 50, 67
Gross Loss ........................................................... 83
Gross Profit ......................................................... 83
Highest Closed Trade Equity .............................. 83
hindsight .............................................................. 17
indicators ..... 1, 2, 3, 4, 5, 25, 26, 43, 45, 72, 90, 94
Input Data ............................................................ 54
inputs ............................... 64, 65, 67, 68, 72, 86, 87
in-sample ... 2, 16, 17, 24, 38, 39, 60, 65, 66, 67, 83
installation ........................................................... 19
installation file ..................................................... 19
Largest Losing Trade..................................... 84, 85
Largest Winning Trade ........................................ 84
license ID ............................................................ 19
licensed copy ....................................................... 19
Long/short symmetry .......................................... 66
Lowest Closed Trade Equity ............................... 83
main chart window ........................................ 83, 88
main view window ........................................ 21, 22
main window ................................................. 29, 58
market dynamics ..................................... 66, 67, 72
Market System Analyzer (MSA) ......................... 60
Max Number Consecutive Losses ....................... 85
Max Number Consecutive Wins ......................... 84
Max Number of Shares/Contracts ....................... 84
maximum adverse excursion ................... 73, 85, 86
menu bar .............................................................. 77
MetaTrader 4 1, 2, 7, 20, 22, 23, 29, 30, 33, 36, 38,
39, 40, 44, 58, 68, 70, 74, 75, 93
Minimum Number of Shares/Contracts ............... 84
money management stop ..................................... 42
Monte Carlo .......................... 52, 55, 56, 61, 63, 64
MultiCharts .... 1, 2, 6, 7, 22, 29, 30, 33, 34, 35, 39,
58, 68, 69
mutation ................................................. 2, 6, 51, 72
neural network ........... 1, 2, 5, 11, 12, 13, 20, 44, 45
NinjaScript .................................. 20, 29, 39, 58, 75
NinjaTrader ....... 1, 2, 11, 20, 22, 29, 30, 35, 39, 58
Number of Closed Trade Drawdowns ................. 88
Number of Losing Trades .................................... 84
number of trades ................................ 65, 66, 72, 86
Number of Trades in Drawdown ................... 88, 89
Number of Winning Trades ................................. 83
optimal bar size ............................................. 40, 45

98
optimization ...................................... 64, 65, 66, 67
out-of-sample 2, 3, 5, 15, 16, 17, 24, 28, 29, 38, 39,
52, 54, 60, 61, 65, 66, 67, 72
out-of-sample performance ..................... 65, 66, 67
out-of-sample testing........................................... 67
Output window .................................................... 29
over-fitting ................................................ 2, 65, 87
panes ................................................. 21, 22, 54, 77
parameter optimization ....................................... 64
percentage of winning trades .............................. 68
performance metrics ................ 4, 14, 27, 29, 52, 83
population .. 2, 3, 4, 5, 6, 14, 15, 16, 17, 28, 29, 50,
51, 52, 54, 55, 58, 59, 66, 67, 73
position sizing ............................................... 41, 42
price data ................................................... 3, 31, 66
processor cores .................................................... 80
profit factor ......................................................... 68
range bar........................................................ 36, 37
real-time tracking ................................................ 67
registry .................................................... 21, 22, 80
results table ......................................... 5, 22, 29, 54
Return on Starting Equity ................................... 83
robust strategies ............................................ 38, 67
robust strategy ..................................................... 61
robustness ............................................................ 61
rules ....................................................... 2, 3, 51, 65
saved strategies ............... 22, 28, 29, 50, 54, 67, 79
Semantic rules ....................................................... 7
session times .................................................. 23, 36
settings......................................... 23, 31, 35, 36, 71
Sharpe Ratio ...................................................... 86
statistical inference ............................................... 2
statistical process control .................................... 68
statistical significance.................................... 65, 72
stocks ..................................................................... 2
strategy code .......... 17, 21, 22, 50, 54, 58, 77
stress testing .................... 52, 55, 56, 59, 61, 62, 64
Syntactic rules ....................................................... 7
tabbed windows ....................................... 21, 22, 31
toolbar ........................................................... 77, 78
tournament selection ........................................... 52
trade risk .............................................................. 41
Trade Standard Deviation .................................... 85
TradeStation ............................ ii, iii, 22, 29, 67, 68
trading costs ........................................................ 38
trading logic .............................................. 3, 64, 66
trading orders......................................................... 2
tree structure .................................................... 5, 51
TS 2000i ........................................................ 22, 39
viable strategies ........................... 26, 38, 43, 72, 73
Win/Loss Ratio .................................................... 86
window layout ..................................................... 21
Worst-case Drawdown ........................................ 88