users’ reactions captured by means of an eeg headset on
TRANSCRIPT
1
Users’ Reactions Captured by Means of an
EEG Headset on Viewing the Presentation of
Sustainable Designs Using Verbal Narrative
Marta Royo, Vicente Chulvi and Elena Mulet Department of Mechanical Engineering and Construction, Universitat Jaume I,
Castello de la Plana, Spain, and
Julia Galán Department of Industrial Systems and Design Engineering, Universitat Jaume I,
Marta Royo is the corresponding author and can be contacted at: [email protected]
Abstract
The aim of this paper is to determine whether consumers accept new arguments for
choosing a product that adapts to future needs. It is also seeks to investigate whether the
design of products and their ensuing advertising and promotion through a sustainable
approach by means of verbal narrative ads can generate a more positive emotional
response in the future users of the product than with the application of visual narrative
ads.
To this end, an experiment was conducted consisting in consumers, with and without
experience with the product, watching a promotional video based on verbal narrative,
created using the new usage scenarios approach, in which the advantages of a
sustainable product are shown. The neuronal response of the possible users was then
measured by means of the EEG headset. In order to be able to establish a comparison,
the same response was also measured in the same consumers when they viewed a
commercial video based on visual narrative about a product with similar characteristics.
The results show, among other conclusions, that viewing the verbal narrative ad first
triggers higher emotional values of excitement, both in the short and the long term, as
well as frustration. It is also observed that having no experience with the product causes
higher meditation values.
brought to you by COREView metadata, citation and similar papers at core.ac.uk
provided by Repositori Institucional de la Universitat Jaume I
2
This can be useful to enterprises both in order to design their products in such a way as
to orientate them towards consumer concerns, and to design advertisements in such a
way as to link consumers emotionally with the product.
Keywords – advertising, usage scenarios, measured emotions, sustainable products,
marketing research.
This study has been possible thanks to the research projects 15I336.01/1 “El arte y el
diseño en la nueva sociedad digital” funded by the Universitat Jaume I. The authors
also wish to acknowledge the help of Sara Romero, María Agost, Laura Martínez and
all the participants in the experiment.
1. Introduction
A wide range of products for many different functions are continually being replaced or
surpassed by new products that come into being thanks to advances made in technology
or the appearance of new needs. Sometimes a product is good for a specific use, but not
so much so for a different use. This makes the user feel dissatisfied and left with the
need to purchase more products than expected (Cooper, 2005). Within the context of
sustainability, these patterns are related with eco-efficiency, which seeks to reduce the
consumption of materials and energy, increase recyclability, and extend the life of the
product (Verfaillie and Bidwell, 2000). The need to reduce the consumption of natural
resources is highlighted by the number of products with a high percentage of recyclable
or reusable materials that are currently thrown away (Pérez-Belis et al., 2012). Yet, the
high costs and difficulties involved in recycling may turn out to be insurmountable
obstacles for many countries in the future (World Business Council for Sustainable
Development (WBCSD), 1995, 2000), and thus increasing the intensity of the service
and the useful life of the product is a commitment to the future (Sundin et al., 2009).
In order to encourage the use of this kind of products it is important for the consumer to
know and to be aware of the environmental and economic advantages they offer.

3
Examples of products designed following these guidelines are convertible children’s
furniture or modular mobile phones, which allow components to be exchanged, thereby
avoiding their full disposal.
In promoting these products only their functional (ease-of-use), aesthetic or quality
aspects are normally depicted, with little attention paid to the different possibilities that
can benefit the future consumer in terms of the possibilities of adapting them to
different uses or their economic advantages, as they avoid the need to acquire new
products.
The advertising of products that are respectful with the environment is based on their
differentiation from conventional products, and can also be emotional (Schuhwerk and
Lefkoff-hagius, 1995). Several studies have analysed the causes and consequences of
emotions in consumers’ behaviour (Watson and Spence, 2007), using techniques like
eye-trackers and conductive bracelets (Guerreiro et al., 2015), as well as emotional
recognition through expressions (Tombs et al., 2014). Knowing the consumers'
emotional response can therefore provide data about their possible willingness to
acquire products and their awareness about the advantages they offer.
The aim of this work is to determine whether there is a difference in perception between
watching a commercial video (visual narrative) showing the functionality and use of a
pushchair and an animated video (verbal narrative) that explains the problems and the
advantages of using the new product by measuring the neuronal response of the possible
users by means of an EEG headset. By so doing, the intention is to determine whether
consumers accept new arguments for choosing a novel product based on new usage
scenarios, and also whether the design of products and their ensuing advertising and
promotion through a sustainable approach can generate a more positive emotional
response in the future users of the product than with the application of traditional forms
of promotion (visual narrative commercial ads). This study will take into account
4
whether having previous experience with this kind of product affects how they are
perceived, an important aspect when it comes to baby-care products. Another parameter
that must be controlled for is the order in which the two videos are viewed, in order to
determine whether this factor must be taken into account when it comes to deciding
how the product and its message are to be shown.
2. Theoretical background
2.1. Green advertising
According to Kotler and Keller (2009) promotion involves “sales promotion,
advertising, sales force, public relations and direct marketing”. Advertising is an
element of the marketing communication mix and can be defined as “any paid form of
nonpersonal presentation and promotion of ideas, goods, or services by an identified
sponsor”.
Ann et al. (2012) add that consumers are more concerned about the promotion of
ecological products if they think that the reason for preservation or slowing down
environmental deterioration is worthwhile. Advertising is vital since it attracts the
attention of consumers who are respectful with the environment. It can have an
influence on consumers due to the emotive aspect that surrounds the action.
Consequently, it can help highlight recognition of a product in the shop due to the
characteristics that appeal to them (Morel and Kwakye, 2012).
Furthermore, there are studies that claim that consumers are sceptical about green
advertising and often do not trust the ecological tactic, since they believe that it may be
exaggerated (Chang, 2011; Rahbar and Wahid, 2011). Other authors are more specific,
such as Wanninayake and Randiwela (2008), who consider that half of those surveyed
claim that advertising has an influence on their decision to buy green products. Chase

5
and Smith (1992) found that 70% of respondents may be influenced in order to buy
ecological products “sometimes” but, as Rahbar and Wahid (2011) point out, not
always, since consumers do not pay a great deal of attention to the messages due to their
excessive use.
It may therefore be interesting to consider a new way of showing the environmental
advantages that this kind of products offer by means of more emotive advertising with a
powerful narrative that creates another kind of closer and more direct message.
2.2. Attitudes and purchase behaviour
From the psychological perspective, authors like Eagly and Chaiken (1993) define
attitude as a tendency that is expressed by evaluating a particular entity with a degree of
liking or displeasure. Salomon et al. (2010) analyse it from the perspective of
consumers’ behaviour, defining it as a durable and general evaluation of people
(including themselves), objects or problems. The AMA defines it as the cognitive
process that implies positive and negative valences, feelings or emotions
(marketingpower.com).
According to Morel and Kawkye (2012) purchase intention can be defined as “what
consumers think they are going to buy”. Consumers’ intentions play an important role in
marketing strategy since they allow enterprises to evaluate how many products can be
manufactured according to demand. In order to predict purchase intention and future
behaviours, enterprises can interview consumers about their past behaviours and their
intentions for the near future. With the information obtained they can estimate the
probability of a particular behaviour. As Blackwell et al. (2006) point out, it is easier to
predict intentions tomorrow than in a month, and easier in a month than in five years,
since behaviour changes over time. It can therefore be said that knowing the acceptance
of this type of product before it is launched on the market can be a competitive

6
advantage.
2.3. Evoked emotions and consumers
Knowledge of the emotion process, that is, how emotions are evoked, can improve our
understanding of what makes us enjoy interaction with any kind of product (Desmet,
2003). Users' needs and preferences are primary concerns in the development of
products within a highly competitive market (Hsu et al., 2000). With the aim of
satisfying consumers' needs, designers have to make the connotative and denotative
meanings of their products explicit (Lin et al., 1996). It therefore comes as no surprise
that consumer researchers have found that the emotions evoked by products enhance the
pleasure of purchasing, owning and using them (Hirschman and Holbrook, 1982).
Within this context, several studies have focused on measuring costumers’ emotions (de
Hooge, 2014) and identifying and classifying the possible emotions that costumers can
express with regard to brands (Romani et al., 2012). Among these studies, Pham et al.
(2013) use questionnaires to evaluate the emotional response of costumers when they
watch a TV commercial. The emotions taken into account in this study are included
within the category “cognitive states” and belong to category 7 of the taxonomy
developed by Storm and Storm (1987).
Nevertheless, it is still not clearly understood how consumers perceive a product form
and how the meaning of the product form can be conveyed to them efficiently. This is
due to the fact that users' feelings about the product make up a very complex cognitive
process and many intricate factors contribute to the perception of a product form (Hsu et
al., 2000).
Measuring the emotions experienced by the consumer on viewing an advertisement that
shows the environmental advantages can therefore be a competitive advantage, as it
eliminates the subjectivity of other methods such as questionnaires.
7
2.4. Usage scenarios in the conceptualisation of products
The conceptualisation of products that have a prolonged useful life often uses the
storytelling tool to obtain different usage scenarios, which are defined as explicit
descriptions of hypothetical events related to a product during a specific phase of its life
cycle (Anggreeni and van der Voort, 2007). The creation of scenarios is a technique for
developing stories related to the use of the product and interaction with the consumer, in
both present and future situations.
Suri and Marsh (2000) highlight the fact that the construction of scenarios gives the
chance to explore and communicate qualitative aspects of the experience of the
consumer at the beginning of the design process. Scenarios work as explicit descriptions
of the hypothetical future of products and services (van der Bijl-Brouwer and van der
Voort, 2013).
A great number of enterprises have become aware of the emotional value of stories
(Lundqvist et al., 2013) and marketers use stories – either real or invented – in order to
create an atmosphere with which to improve the uniqueness of a brand and its services
(Mossberg and Nissen Johansen, 2006); consequently, they have increased the use of
storytelling in marketing. They claim that stories are stored in memory in multiple
forms: objectively, visually and emotionally. This therefore makes it very likely that
consumers will remember it. Advertisements generated from stories increase the
positive emotions, like optimistic or warm feelings (Escalas, 2004). The use of the
stories/scenarios generated during the conception of the material for
promoting/advertising these products can thus be a competitive advantage.
According to Lien and Chen (2013), by telling stories, narrative advertisements can
communicate effectively by capturing consumers’ attention to promote the advertised
products, demonstrate the appeal of the products, and persuade consumers to consider

8
those products (Escalas, 1998). Narrative ads represent one of the regular methods that
advertisers use to explain the gains consumers can achieve by using their products
(Woodside et al., 2008).
Some studies have already shown that narrative advertisements have a greater
persuasive effect than non-narrative ones (Chang, 2008; Escalas, 2004; Mattila, 2000;
Polyorat et al., 2007). Deighton et al. (1989) also note that the participants in this study
respond to narrative advertisements with fewer counterarguments, which implies that
the attitude towards the product increases in narrative advertisements to a greater extent
than in those that are not narrative. According to Green and Brock (2002) narrative
helps consumers to become immersed in the advertisements, thereby reducing negative
responses and creating strong feelings about the characters. Moreover, when consumers
find themselves before a visual narrative that uses vivid images to describe a story, they
do not need to draw on their ability to create images and it therefore becomes easier to
understand than in the case of verbal narrative (Lien and Chen, 2013).
Consumers construct a link between their own concepts and the products in the
advertisement, and the use of narrative in the ad makes it easier for them to string the
information together (Lien and Chen, 2013). So, the first hypothesis is:
H1. An ad with verbal narrative that shows new usage scenarios of a product that
prolong its useful life generates a more positive emotional response than an ad with a
visual narrative that only contains functional aspects of the use of the product
(manoeuvrability, assembly, etc.) in the same consumer profile.
2.5. The consumer's previous experience
Little attention is usually paid to previous experience and its influence upon the
consumer's perception. According to Van Der Wagen (1994) “individual customers have
many different perceptions which are influenced by their education, upbringing,

9
experience and many other factors”.
Blythe (1997) defines this process as a cognitive mapping or construct of the
imagination, where consumers analyse their behaviour before and after the purchase
based on their previous experiences in order to generate an evaluation from them. Not
all this information, however, comes from the world around them but instead from a
series of factors such as subjectivity, categorisation, selection, expectations and previous
learning or past experience.
O'Neill and Palmer (2003) analysed the related literature and found that consumers
rarely make the decision to purchase without taking into account their beliefs,
experiences or knowledge (Arora, 1982; Bloch and Richins, 1983; Sheth et al., 1991;
Solomon, 1999). The use of previous knowledge and their experience help them to
obtain a criterion when faced with a multitude of stimuli (Chisnall, 1975).
Previous knowledge is defined as the amount of experience and familiarity one has with
a product (good or service) that helps to improve decision-making skills, thereby
reducing the cognitive effort (Alba and Hutchinson, 1987). Familiarity is understood in
the experiential sense and is defined as “the number of product-related experiences
accumulated by the consumer”.
Assael (1992) stated that consumers evaluate products and/or services through their past
experiences, expectations and associations.
According to Kara et al. (2009) “the purchase and use of a product may evoke feeling,
emotions, or provide a mean for a person’s self-expression and identity formation
(Aaker, 1998; Richins, 1994)”.
Accordingly, evaluations will be conducted to determine whether the consumer’s having
had previous experiences with the use of products or in situations similar to those in the
advertisement affects the emotions that are generated. Consequently, the second
hypothesis is:

10
H2. Consumers' previous experience in the acquisition and use of the product triggers
an emotional response on viewing ads which show new usage scenarios that convey a
message related to their experience which differs from that of users without such
experience.
3. Method
To test the above hypothesis, an experiment was performed in order to determine the
emotive signals of the consumers, regarding their previous experience with the problem
that the selected product seeks to solve (experienced vs. non-experienced consumers),
and how the information is delivered to them (verbal vs. visual narrative).
3.1. Consumer profile and sample
As stated earlier, the product selected as a case study was a babies' pushchair that can be
adapted to different usage scenarios. Initially the pushchair will allow just one baby to
be carried, although, if the parents have had a second child within a short space of time,
it can also hold two babies of different ages simultaneously.
In this experiment, two different population groups answered the survey:
• Group 1: made up of mothers and fathers who had a single child aged below 18
months (non-experienced consumers).
• Group 2: with mothers and fathers who had two children, with an age difference
between them of less than 2 years, the elder one being no more than 5 or 6 years
old, to avoid recruiting parents who are totally unaware of current trends in
baby-care products (experienced consumers).
The reason why a variety of profiles were chosen was to determine whether the message
shown in the videos is received in the same way by the two different groups: parents
who have never had to deal with the problem of having to carry two young children,
11
although it could still happen, and those who have had such an experience. This
classification into experienced and non-experienced consumers was performed based on
the difference between expectation and experience postulated by Ricoeur (1988) and
previous studies highlighting the differences in the attitudes of consumers regarding
their experience of using a product (Wogalter et al., 1991). The subjects were recruited
from among the research and administration staff at the university where the experiment
was conducted, by means of announcements posted in two nursery schools near the
university. The sample consisted of 28 people for the population with just one child
(group 1) and 26 people for the population with two children (group 2). Survey,
interview and emotional data were collected between May and July 2014. The
information from the survey and the interview was used to discern relevant data such as
whether the costumers were aware of the latest baby-care products on the market and
their knowledge and perceptions on the Bugaboo brand. This experiment was conducted
in collaboration with the enterprise Baby Essentials, which is interested in knowing the
emotions generated in the promotion of a new product before launching it on the
market. In this case, the product selected was a pushchair.
3.2. Promotional videos used
The aim of the experiment was to measure the users' emotional response (cognitive
state) while watching two videos, one of them created for the experiment using
animation (video M) and the other being a commercial video (video Y). Video M
presents verbal narrative, while video Y has visual narrative. With the first video (M)
the aim was to show future users how a pushchair could be used for a longer time and
how it could be adapted to different situations both in the present and in the future. The
concept shown in the video is the result of a joint project carried out with the company
Baby Essentials (https://vimeo.com/129596346). The video was created exclusively for
12
the experiment to show the usage scenarios obtained from the design process. The
second video (Y) is a video advertising a product that is already on the market – the
extensible pushchair Bugaboo Donkey (www.youtube.com/watch?v=hXUo1dCJH2A).
Both videos show concepts sharing similar characteristics. However, whereas the
commercial video shows a final product with real people and settings, video M shows
an animation while an off-screen voice establishes direct communication with the
viewer.
3.3. Emotiv EPOC EEG headset
This study focused on neuronal response, since, according to Choppin (2000), Bos
(2006) and Nie et al. (2011) EEG signals can be used in the recognition of emotions.
Indeed, EEG has been used in the research and medical fields for about 80 years
(Hondrou and Caridakis, 2012). The use of EEG devices to detect the electrical activity
of the brain, however, is becoming increasingly popular in other areas of research, as it
does not require any kind of physical effort by the user (Harrison, 2013). One of the
most interesting recent devices in this field is the Emotiv EPOC headset
((https://emotiv.com/epoc.php), which stands out for being lightweight and easy to fit
while also offering the user a great deal of freedom of movement. The Emotiv EPOC
device is placed on the user's head and allows the intensity of his or her brain waves to
be measured via 14 s electrodes located over 10-20 international system positions AF3,
F7, F3, FC5, T7, P7, O1, O2, P8, T8, FC6, F4, F8 and AF4 using two reference
electrodes, as shown in Figure 1a. The sampling rate is 128Hz, the bandwidth is 0.2-
45Hz, and the digital notch filters are at 50Hz and 60Hz. The signals captured by the
headset are decoded by means of the company's private proprietary algorithms, which
classify them into five different emotions and show the degree of intensity for each of
them: Long- and short-term excitement, frustration, engagement/interest and meditation,

13
which are called “cognitive states” and are included in the seventh category of the
taxonomy developed by Storm and Storm (1987). These parameters are recorded in real
time by means of the Affective suite, as shown in Figure 1b.
Figure 1. Positioning of the electrodes upon the scalp (Emotiv Epoc) (a). View
of Afective Suite (b)
Emotiv has not publicly disclosed its classification algorithms, preferring to keep them
as a trade secret. The model of emotion used in the EPOC device was constructed from
data collected from over one hundred volunteers (Inventado et al., 2011). The validity of
the data has been proved by studies conducted by Cernea et al. (2011), who presented a
comparison between subjective emotions (questionnaires) and the measurements
obtained using Emotiv EPOC headsets. The results of this study suggested that wireless
EEG technology is capable of measuring subjectivity in the assessment of product and
service satisfaction. Ekanayake (2010) confirmed the capacity of the Emotiv EPOC
headset to pick up ‘true’ or ‘real’ EEG in an empirical study that evaluated the device on
the basis of its capability to reflect the P300 component in an experimental study called
the oddball paradigm. According to Duvinage et al. (2013), Emotiv EPOC headsets are
undoubtedly an interesting option. Moreover, there is considerably more recent research
that uses the Emotiv EPOC (Campbell et al., 2010, Khushaba et al., 2013, McMahan et
al., 2015), and particularly its affective suit (Inventado et al., 2011; Pham and Tran,
2012; Ramirez and Vamvakousis, 2012; Fattouh et al., 2013; Chulvi and González-

14
Cruz, 2016).
Nevertheless, previous studies have also found that the EPOC headsets have some
shortcomings. One of the most important limitations involves the effect of accuracy in
their measurements, which is reflected in false positives and negatives (Cernea, 2015).
To solve this problem, Cernea (2015) proposed the introduction of prior training
sessions. This training increases the rate of correct identification of facial and cognitive
expressions by 12%. Consequently, in this experiment a previous training phase by
means of Cognitive Suite was included.
In our research, the intention is to capture direct information that is free of judgements
about the subjects' reactions to the videos they are shown. The scope of the following
research is not intended to be an exhaustive analysis of EEG signals processing, but to
use the EEG tool and the software application elaborated by experts in order to obtain a
wide collection of objective information for its subsequent analysis.
3.4. Phases of the experiment
The experiment was divided into phases, the first being reception of the subjects.
Subjects were divided into groups of two individuals. This phase was performed outside
the room where they were to watch the videos. The aim was to establish an atmosphere
of trust and to relax anyone who came to the experiment in a stressed or worried state,
so that the experiment would start under a set of calm (neutral) conditions. They were
then introduced to the work team, the aims of the experiment were explained to them,
they were offered food and drink (no stimulants) and lastly they were shown the Emotiv
EPOC headsets that they were going to wear on their heads. In this same phase, the
code of ethics for the experiment was explained to them and they were asked to sign a
consent form. The duration of this phase was approximately 20 minutes.

15
In the second phase, an EEG headset was placed on each subject's head and the sensors
were checked to ensure all of them were showing the green light. Then, training was
carried out by means of the Cognitive Suite in order to calibrate the equipment. Training
lasted about ten minutes.
Lastly, the cognitive state was measured while viewing the videos (Figure 2). In this
phase, the subjects watched the two videos, the commercial or visual one (Y) and the
animated or verbal narrative one (M). At the end of each visualisation, subjects had to
answer a brief perception test to provide them with some time to rest and “disconnect”
between one video and the other (10 minutes approximately). Half the participants were
asked to watch the commercial video first (YM order), while the other half viewed the
animated one first (MY order). The videos were viewed on a 24" Led full-HD HDM
screen at a distance of approximately 80cms in an isolated room lit with artificial light
in order to prevent glare.
Figure 2. Measurement of perception while the animated video (M)
3.5. Data treatment
The outputs of the levels of intensity of the emotions were recorded in the range 0 to 1
to allow them to be processed statistically. Before performing the statistical analyses,
the data obtained were filtered to test their validity. The conditions needed to detect the
output values for the cases of signal loss or signal noise were reproduced
experimentally. Within the set of data recorded for each user, the isolated measurements
16
coinciding with these cases were counted and removed, the whole measurement being
considered non-valid if the set of "non-valid" points reached a value of 15% of the total.
4. Results
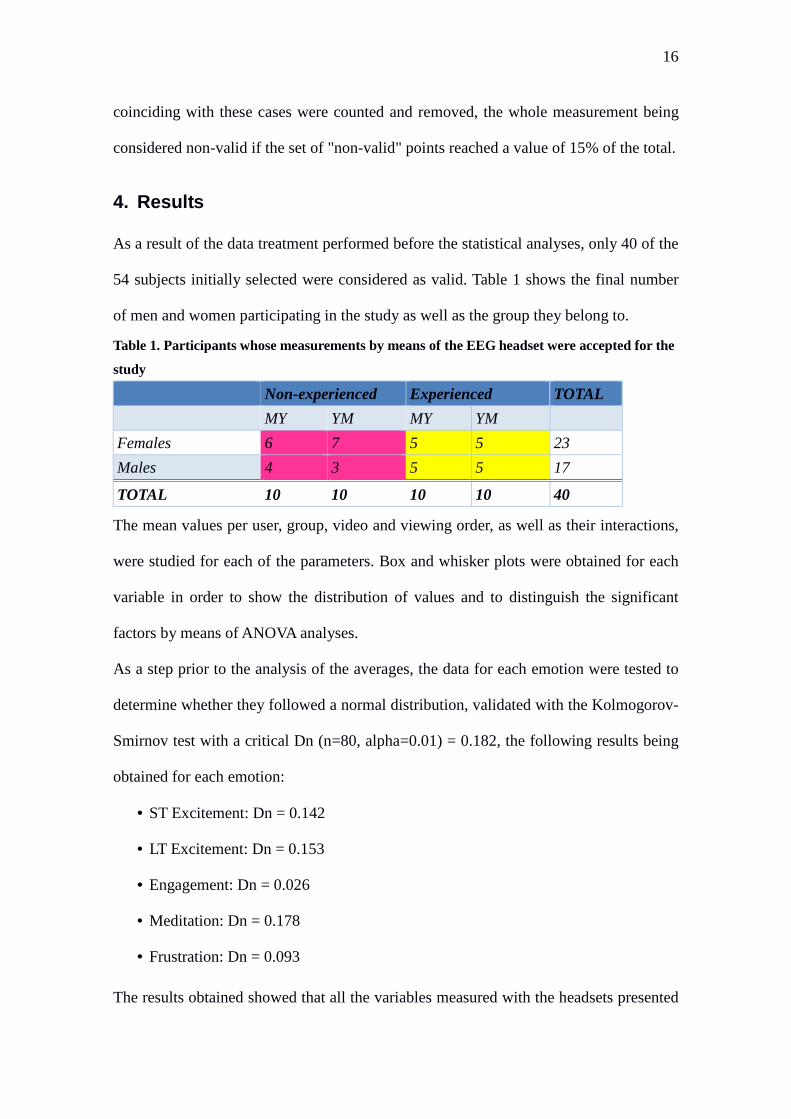
As a result of the data treatment performed before the statistical analyses, only 40 of the
54 subjects initially selected were considered as valid. Table 1 shows the final number
of men and women participating in the study as well as the group they belong to.
Table 1. Participants whose measurements by means of the EEG headset were accepted for the
study
Non-experienced Experienced TOTAL
MY YM MY YM
Females 6 7 5 5 23
Males 4 3 5 5 17
TOTAL 10 10 10 10 40
The mean values per user, group, video and viewing order, as well as their interactions,
were studied for each of the parameters. Box and whisker plots were obtained for each
variable in order to show the distribution of values and to distinguish the significant
factors by means of ANOVA analyses.
As a step prior to the analysis of the averages, the data for each emotion were tested to
determine whether they followed a normal distribution, validated with the Kolmogorov-
Smirnov test with a critical Dn (n=80, alpha=0.01) = 0.182, the following results being
obtained for each emotion:
• ST Excitement: Dn = 0.142
• LT Excitement: Dn = 0.153
• Engagement: Dn = 0.026
• Meditation: Dn = 0.178
• Frustration: Dn = 0.093
The results obtained showed that all the variables measured with the headsets presented

17
a normal distribution. Table 2 shows the average values of each video, group and
viewing order as a whole, while in Table 2 they are shown separately according to the
subgroups of possible combinations.
Table 2. Average of the intensity of each emotion per video, group and viewing order
Emotions Video M Video Y Group 1 Group 2 YM MY
ST Excitement 0.2120 0.2248 0.1934 0.2434 0.1676 0.2691
LT Excitement 0.2408 0.2845 0.2497 0.2756 0.2306 0.2947
Engagement 0.6631 0.6614 0.6757 0.6489 0.6693 0.6552
Meditation 0.3526 0.3578 0.3740 0.3364 0.3682 0.3422
Frustration 0.4359 0.4611 0.4296 0.4674 0.4089 0.4881
Table 3. Average intensity of each population subgroup
VIDEO Y VIDEO M
GROUP 1 GROUP 2 GROUP 1 GROUP 2
Emotions YM MY YM MY YM MY YM MY
ST Excitement 0.1370 0.2661 0.1767 0.3192 0.1689 0.2016 0.1878 0.2897
LT Excitement 0.2619 0.2954 0.2243 0.3564 0.2363 0.2053 0.2000 0.3218
Engagement 0.6980 0.6524 0.6660 0.6291 0.6784 0.6738 0.6348 0.6655
Meditation 0.4010 0.3529 0.3522 0.3250 0.3817 0.3605 0.3379 0.3303
Frustration 0.3893 0.4983 0.4076 0.5490 0.4163 0.4144 0.4222 0.4908
Figure 3 displays the distribution of the average values for subjects' short-term
excitement in box and whisker plots. This figure shows the separation by group
(experienced or non-experienced users) and by video viewed (visual narrative or verbal
narrative). The variable “viewing order” was added to the analysis, alternating the order
in which the ads were viewed during the experiment being included in case this factor
affects the results that are obtained. Moreover, separation by subgroup combining these
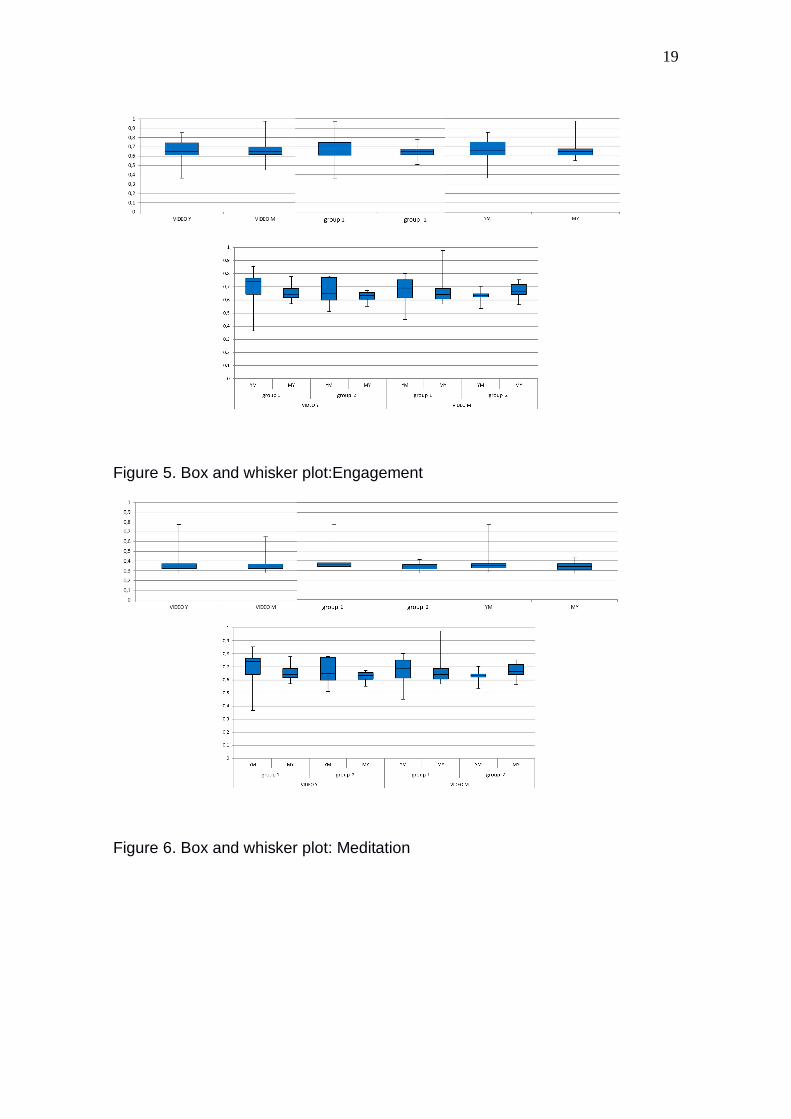
three factors was considered. In the same way, Figure 4 shows the box and whisker
plots for long-term excitement, and Figures 5, 6 and 7 the plots for engagement,
meditation and frustration, respectively.

18
Figure 3. Box and whisker plot. Short-term excitement
Figure 4. Box and whisker plot: Long-term excitement
19
Figure 5. Box and whisker plot:Engagement
Figure 6. Box and whisker plot: Meditation
20
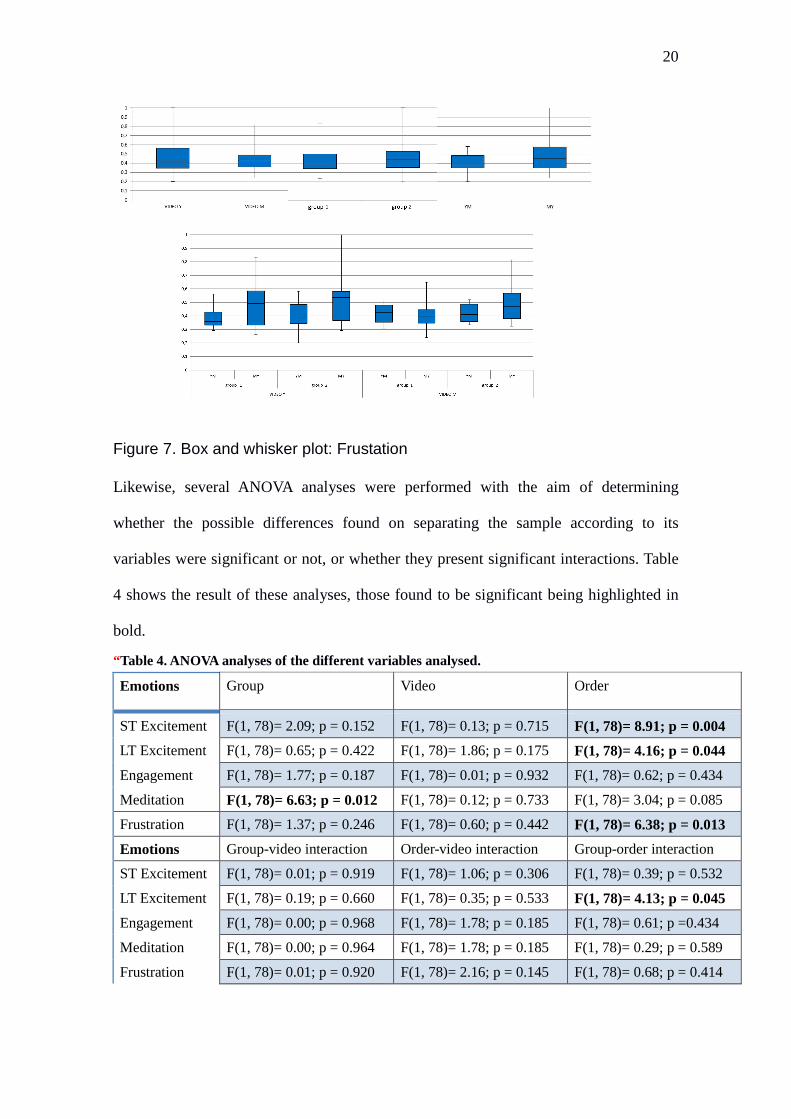
Figure 7. Box and whisker plot: Frustation
Likewise, several ANOVA analyses were performed with the aim of determining
whether the possible differences found on separating the sample according to its
variables were significant or not, or whether they present significant interactions. Table
4 shows the result of these analyses, those found to be significant being highlighted in
bold.
“ Table 4. ANOVA analyses of the different variables analysed.
Emotions Group Video Order
ST Excitement F(1, 78)= 2.09; p = 0.152 F(1, 78)= 0.13; p = 0.715 F(1, 78)= 8.91; p = 0.004
LT Excitement F(1, 78)= 0.65; p = 0.422 F(1, 78)= 1.86; p = 0.175 F(1, 78)= 4.16; p = 0.044
Engagement F(1, 78)= 1.77; p = 0.187 F(1, 78)= 0.01; p = 0.932 F(1, 78)= 0.62; p = 0.434
Meditation F(1, 78)= 6.63; p = 0.012 F(1, 78)= 0.12; p = 0.733 F(1, 78)= 3.04; p = 0.085
Frustration F(1, 78)= 1.37; p = 0.246 F(1, 78)= 0.60; p = 0.442 F(1, 78)= 6.38; p = 0.013
Emotions Group-video interaction Order-video interaction Group-order interaction
ST Excitement F(1, 78)= 0.01; p = 0.919 F(1, 78)= 1.06; p = 0.306 F(1, 78)= 0.39; p = 0.532
LT Excitement F(1, 78)= 0.19; p = 0.660 F(1, 78)= 0.35; p = 0.533 F(1, 78)= 4.13; p = 0.045
Engagement F(1, 78)= 0.00; p = 0.968 F(1, 78)= 1.78; p = 0.185 F(1, 78)= 0.61; p =0.434
Meditation F(1, 78)= 0.00; p = 0.964 F(1, 78)= 1.78; p = 0.185 F(1, 78)= 0.29; p = 0.589
Frustration F(1, 78)= 0.01; p = 0.920 F(1, 78)= 2.16; p = 0.145 F(1, 78)= 0.68; p = 0.414

21
5. Discussion
5.1. Short-Term Excitement (STE)
If we compare ST excitement in the videos that were viewed, in Figure 3 it can be seen
that the median is slightly higher for the verbal narrative video, but the ANOVA
analysis, however, shows that these differences are not significant. Neither were any
significant differences found when comparing the variable of the population group,
although in Figure 3 the median is seen to be slightly higher for group 2.
Nevertheless, the ANOVA analysis indicates that the differences in short-term
excitement depending on the order in which the videos are viewed are significant. In
this case we can see that the value of the median is higher when the verbal narrative
video is watched first (MY), although it presents a higher dispersion of values.
Therefore, we could claim that viewing the videos in the MY order triggers greater STE.
This suggests that promoting these products by offering this kind of information in this
order can have a greater impact on the user.
Regarding the different interactions among the variables, none of them has been seen to
be significant.
5.2. Long-Term Excitement (LTE)
The graph in Figure 4, which corresponds to LT excitement, shows that the median is
slightly higher for video Y, but the ANOVA analysis reveals that this small variation is
not significant. The same happens on comparing the variable “group”, where the median
is slightly higher for the experienced group, but is not significant either. Nonetheless, as
occurred in the case of ST excitement, the ANOVA analysis showed that the variations
in LT excitement measures in the viewing order are significant. In this case, as can be
seen in Figure 4, the median of the values is higher when the narrative video is watched
22
first (MY order). This viewing order also displays a higher dispersion of values in
positive values. These results therefore indicate that it might be worth considering
combining the two types of narrative, by including a first part consisting in a verbal
narrative ad when it comes to promoting the product, with the aim of intensifying the
consumer’s level of excitement.
If we compare the interactions among the different variables, viewing order, group and
video watched, the ANOVA analysis confirms that the interaction between the group
and the viewing order is also a significant value, and the other two interactions are not.
Hence, besides causing higher values of excitement when the verbal narrative video is
watched first (MY), these values are reinforced if the viewer has some experience with
the problem. This could be due to the fact that, with the verbal narrative at the beginning
of the ad, the situation might be described better and this could cause customers who
have experienced a similar situation to see themselves reflected in this situation, which
is manifested in higher LT excitement values.
5.3. Engagement
If we compare the values obtained for the emotional parameter engagement in the
videos, in Figure 5 it can be seen that the median is similar in both videos; the ANOVA
analysis corroborates this similarity by indicating that the differences are not significant.
With regard to the group, the median is slightly higher for group 1, the non-experienced
subjects, but the ANOVA analysis shows that this difference is not significant. In the
case of engagement, the viewing order has no significant influence on the levels that
were measured, in accordance with the ANOVA analysis. In fact, the median values for
viewing order are very similar in both cases. Moreover, the analysis of the interactions
among the three variables shows that none of them present any significant differences.
Consequently, we could claim that the engagement shown by consumers when watching

23
an ad does not depend on the variables considered in this study.
5.4. Meditation
On comparing the values obtained with regard to the emotional parameter meditation in
the videos that were watched (Figure 6), it can be observed that the median is similar in
both videos. The ANOVA analysis confirms the similarity between the medians by
indicating that there are no significant differences. Depending on the group, it can be
confirmed that the median is higher for group 1. In this case, the ANOVA analysis
shows that this data is significant. This therefore indicates that having no experience
with the product/situation makes people think more deeply about what they are seeing.
With regard to the influence of the order of visualisation of the videos on the users'
meditation, similar median values were obtained. The ANOVA analysis confirms the
similarity of the medians, since the difference is non-significant.
When the different interactions among the variables are compared, none of them were
seen to be significant.
5.5. Frustration
If we compare the values obtained for frustration in the videos, in Figure 7 it can be
seen that the median is slightly higher when viewing video M. According to the
ANOVA analysis, however, this difference in the median is not sufficient for it to be
considered significant. Neither was the difference found on analysing the data according
to the group considered to be significant in the ANOVA analysis. In this case, the
median for group 2 was perceived as slightly higher.
In contrast, the ANOVA analysis shows that there is a significant relation between
frustration and the order in which the videos are watched. The highest median is
obtained in this case when video M is viewed first. That is, the MY viewing order

24
generates a higher values of frustration than the YM order. Analysing the repercussions
of this result may be more complex because the same viewing order stimulates two
different cognitive states at the same time: excitement and frustration. The consumer
therefore presents a combination of emotions that must be interpreted. On the one hand,
there is the increase in excitement, which is considered to be positive, and, on the other,
the increase in frustration, which is considered negative. The authors think that, in fact,
the emotion presented by the consumer can be another of those represented in the
taxonomy of Storm and Storm (1987). This emotion results from the combination of the
previous two but could not be measured directly due to the limitations of the equipment
chosen to capture the EEG data, which only convert five predefined emotions.
Therefore, taking into account the full taxonomy of emotions of Storm and Storm (see
Figure 1 in their work), the authors suggest that the emotion resulting from the
combination of frustration and excitement belongs to the category that contains the
terms agitation, anxiety, nervousness and tension. A more comprehensive study will
need to be conducted in order to test whether this new hypothesis is true, and to
determine the causes that make viewing first the verbal part and then the visual part
generate this supposed agitation or tension in the costumer.
Lastly, we performed a joint analysis of the three variables to be taken into
consideration and their interactions: videos viewed, viewing order and population
group. The study of the interactions among the three variables does not show any
significant differences.
6. Conclusions
Regarding the main objective posited in this study, namely, to determine whether there
is a difference in perception between watching a visual narrative ad showing the
functionality and use of a pushchair and a verbal narrative ad that explains the problems

25
and the advantages of using the new product, collecting EEG signals interpreted as
emotional parameters included within those considered as cognitive states in the
taxonomy of Storm and Storm (1987) shows that:
Hypothesis 1, “A verbal narrative ad that shows new usage scenarios of a product that
prolong its useful life generates a more positive emotional response than an ad with a
visual narrative that only contains functional aspects of the use of the product
(manoeuvrability, assembly, etc.) in the same consumer profile", cannot be
demonstrated, since there are no significant data to indicate that viewing a verbal
narrative advertisement centred on showing the environmental advantages of a product
by using emotional elements generates a more positive emotional response than a visual
narrative ad in the same consumer profile.
Regarding Hypothesis 2, “Consumers' previous experience in the acquisition and use of
the product triggers an emotional response on viewing adverts which show new usage
scenarios that convey a message related to their experience which differ from that of
users without such experience”, it has been shown that the parents in group 1 obtained
higher values for meditation than the parents in group 2 in both videos. This could be
due to the fact that their lack of experience causes them to think more deeply about what
they are seeing.
As a parallel conclusion observed due to the authors’ intention to avoid a non-controlled
variable (viewing order), it was observed that when the consumer is shown two types of
advertisement, one with a verbal narrative that uses new arguments, such as
environmental aspects, prolonged usage life and the savings it implies, and a visual
narrative advertisement that shows only the product functionality, the emotional
reaction depends on the viewing order. Results indicate that viewing the verbal narrative
video first (order MY) triggers a higher level of short- and long-term excitement in both
videos. This conclusion is useful from the point of view of making it possible to create
26
promotional material that has a greater impact on the user. But the viewing order MY
also triggers higher levels of frustration. The fact that the same factor affects different
emotional parameters, apparently opposed in their positive-negative perception, gives
rise to more questions than answers. The authors therefore consider it a limitation of the
study caused by the tool selected for EEG data registration and conversion, and propose
new hypotheses to be tested in future research: whether the combination of two
measured emotions really results in a new non-measured emotion (excitement and
frustration equal to agitation or tension), and why viewing first a verbal narrative ad and
after that a visual narrative ad increases this supposed agitation or tension.
Future research could also be aimed at comparing whether the advertisements of “less
emotive” products (not associated to a baby, such as childcare products) have a similar
influence on the results. Moreover, this kind of studies can be implemented with other
factors such as age, gender, social stratum, etc., identifying groups of consumers that are
conditioned by diverse stimuli in different ways.
Another issue to be studied is the length of the two videos: in future research it would
be interesting to compare videos of the same length in order to test whether this factor
affects the emotions that are generated.
During the experiment a video produced by the enterprise Baby Essentials, which is a
small Spanish company in the childcare sector, was also tested. The aim was to find out
the acceptance of a product that extended its useful life before it was launched on the
market. Results show a higher level of effectiveness for the combined advertisements,
which show the green properties that recall the emotional link with the consumer in the
first part, and the functional use of the real product in a second part. The use of the
initial advertisement in the experiment in order to test the acceptation of the product by
consumers through storytelling and new usage scenarios was useful for the enterprise in

27
order to know whether the product was going to meet good acceptance on the market or
whether, conversely, the product must be redesigned before being launched.

28
References
Aaker, D.A. (1998), Strategic Marketing Management, New York, NY: John Wiley.
Alba, J.W., and Hutchinson, J. (1987), “Dimensions of consumer expertise”, Journal of
consumer research, Vol. 13 No. 4, pp. 411-454.
Anggreeni, I. and van der Voort, M.C. (2007), “Tracing the Scenarios in Scenario-Based
Product Design: a study to support scenario generation”, Design Principles and
Practices: An International Journal, Vol. 2 No. 4, pp. 123-136.
Ann, K., Amir, G. and Luc, W. (2012), “Go Green! Should Environmental Messages Be
So Assertive?”, Journal of Marketing, Vol. 46, pp. 95-102.
Arora, R. (1982), “Validation of an SOR model for situation, enduring, and response
components of involvement”, Journal of Marketing Research, pp. 505-516.
Assael, H. (1992), Consumer behavior and marketing action, 4TH ED., wes-Kent
Publishing, Boston, MA.
Blackwell, R.D., Miniard, P.W. and Engel J.F. (2006), Consumer Behavior, 10th edition.
Mason: Thomson Higher Education.
Bloch, P.H. and Richins, M.L. (1983), “A theoretical model for the study of product
importance perceptions”, The Journal of Marketing, pp. 69-81.
Blythe, J. (1997), The essence of consumer behaviour, Prentice-Hall: London.
Bos, D.O. (2006), “EEG-based emotion recognition”, The Influence of Visual and
Auditory Stimuli, [Online]. Available: http://hmi.ewi.utwente.nl/verslagen/capita-
selecta/CS-Oude BosDanny.pdf, pp. 1-17.
Campbell, A., Choudhury, T., Hu, S., Lu, H., Mukerjee, M.K., Rabbi, M. and Raizada,
R.D.S.S. (2010), “NeuroPhone: Brain-Mobile Phone Interface using a Wireless

29
EEG Headset”, in Proceedings of the second ACM SIGCOMM workshop on
Networking, systems, and applications on mobile handhelds - MobiHeld ’10, New
Delhi, India, pp. 3-8.
Cernea, D., Olech, P.S., Ebert, A. and Kerren, A. (2011), “EEG-based Measurement of
Subjective Parameters in Evaluations”, in International Conference on Human-
Computer Interaction, Springer Berlin Heidelberg, pp. 279-283.
Cernea, D. (2015), User-Centered Collaborative Visualization, PhD Thesis, University
of Kaiserslautern, Germany.
Chang, C. (2008), “Increasing mental health literacy via narrative advertising”, Journal
of Health Communication, Vol. 13, pp. 37-55.
Chang, C. (2011), “Feeling ambivalent about going green–Implication for Green
Advertising Processing”, Journal of Advertising, Vol. 40 No. 4, pp. 19-31.
Chase, D. and Smith, T.K. (1992), “Consumers keen on green but marketers don't
deliver”, Advertising Age, Vol. 63 No. 29, pp. 2-4.
Chisnall, P. M. (1975), Marketing: a behavioural analysis, New York: McGraw Hill.
Choppin, A. (2000), “EEG-based human interface for disabled individuals: Emotion
expression with neural networks”, Master’s thesis, Tokyo Institute of Technology,
Yokohama, Japan.
Chulvi, V. and González-Cruz, M.C. (2016), “The influence of design methodology on a
designer's emotional parameters and on design results”, in Dyna Colombia, Vol. 83
No. 196, pp. 106-112.
Cooper, T. (2005), “Slower Consumption: Reflection on Product Life Spans and the
“Throwaway Society””, Journal of Industrial Ecology, Vol. 9 No. 1-2, pp. 51-67.
30
de Hooge, I.E. (2014), “Predicting consumer behaviour with two emotion appraisal
dimensions: Emotion valence and agency in gift giving”, International Journal of
Research in Marketing, Vol. 31, pp. 380-391.
Deighton, J., Romer, D. and McQueen, J. (1989), “Using drama to persuade”, Journal
of Consumer research, Vol. 16 No. 3, pp. 335-343.
Desmet, P. (2003), Measuring emotion: Development and application of an instrument
to measure emotional responses to products, in Funology, Springer Netherlands.
Duvinage, M., Castermans, T., Petieau, M., Hoellinger, T., Cheron, G. and Dutoit, T.
(2013), “Performance of the Emotiv Epoc headset for P300-based applications in
BioMedical Engineering OnLine, Vol. 12 No. 1, pp. 1-13.
Eagly, A.H. and Chaiken, S. (1993), The Psychology of Attitudes, Fort Worth, TX:
Harcourt Brace Jovanovich.
Ekanayake, H. (2010), “P300 and Emotiv EPOC: Does Emotiv EPOC capture real
EEG?”, available at: http://neurofeedback.visaduma.info/emotivresearch.htm
(accessed 12 May 2017).
Emotive EPOC (2017), “Emotive EPOC”, available at: https://emotiv.com/epoc.php
(accessed 12 May 2017).
Escalas, J.E. (1998), “Advertising Narratives: What Are They and How Do They
Work?" in Representing Consumers: Voices, Views, and Visions, Barbara Stern, ed.,
London: Routledge, pp. 267-289.
Escalas, J.E. (2004), “Imagine yourself in the product: Mental simulation, narrative
transportation, and persuasion”, Journal of Advertising, Vol. 33 No. 2, pp. 37-48.
Fattouh, A., Horn, O. and Bourhis, G. (2013), “Emotional BCI Control of a Smart
Wheelchair”, International Journal of Computer Science Issues, Vol. 10 No. 3, pp.
31
32-36.
Green, M.C. and Brock, T.C. (2002), “In the mind's eye: Transportation-imagery model
of narrative persuasion”, Narrative impact: Social and Cognitive Foundations.
New York: Lawrence Erlbaum, pp. 315-341.
Guerreiro, J., Rita, P. and Trigueiros, D. (2015), “Attention, emotions and cause-related
marketing effectiveness”, European Journal of Marketing, Vol. 49 No. 11-12, pp.
1728-1750.
Harrison, T. (2013), “The Emotiv mind: Investigating the accuracy of the Emotiv EPOC
in identifying emotions and its use in an Intelligent Tutoring System”, PhD Thesis,
Department of Computer Science and Software Engineering, University of
Canterbury.
Hirschman, E.C. and Holbrook, M.B. (1982), “Hedonic consumption: Emerging
concepts, methods and propositions”, Journal of Marketing, Vol. 46, pp. 92–101.
Hondrou, C. and Caridakis, G. (2012), “Affective, Natural Interaction Using EEG:
Sensors, Application and Future Directions”, in Artificial Intelligence: Theories
and Applications. Springer Berlin Heidelberg, Vol. 7297, pp. 331–338.
Hsu, S.H., Chuang, M.C. and Chang, C.C. (2000), “A semantic differential study of
designers’ and users' product form perception”, International Journal of Industrial
Ergonomics, Vol. 25, pp. 375–391.
Inventado, P.S., Legaspi, R., Suarez, M. and Numao, M. (2011), “Predicting student
emotions resulting from appraisal of its feedback”, in Research and Practice in
Technology Enhanced Learning, Vol. 6 No.2, pp. 107-133.
Kara, A., Rojas-Méndez, J.I., Kucukemiroglu, O., and Harcar, T. (2009), “Consumer
preferences of store brands: Role of prior experiences and value consciousness.

32
Journal of Targeting”, Measurement and Analysis for Marketing, Vol. 17 No. 2, pp.
127-137.
Kotler, P. and Keller, K.L. (2009), Marketing Management, 13th edition, New Jersey:
Pearson/Prentice-Hall.
Khushaba, R.N., Wise, C., Kodagoda, S., Louviere, J., Kahn, B.E., and Townsend, C.
(2013), “Consumer neuroscience: Assessing the brain response to marketing
stimuli using electroencephalogram (EEG) and eye tracking”, Expert Systems with
Applications, Vol. 40 No. 9, pp. 3803-3812.
Lien, N.H. and Chen, Y.L. (2013), “Narrative ads: The effect of argument strength and
story format”, Journal of Business Research, Vol. 66 No. 4, pp. 516-522.
Lin, R., Lin, C.Y., and Wong, J. (1996), “An application of multidimensional scaling in
product semantics”, International Journal of Industrial Ergonomics, Vol. 18, pp.
193–204.
Lundqvist, A., Liljander, V., Gummerus, J. and Van Riel, A. (2013), “The impact of
storytelling on the consumer brand experience: The case of a firm-originated
story”, Journal of Brand Management, Vol. 20 No. 4, pp. 283-297.
Mattila, A.S. (2000), “The roe of narratives in the advertising of experiential services”,
Journal of Service Research, Vol. 3 No. 1, pp. 35-45.
McMahan, T., Parberry, I. and Parsons. T.D. (2015),"Evaluating player task engagement
and arousal using electroencephalography”, Procedia Manufacturing, Vol. 3, pp.
2303-2310.
Morel, M. and Kwakye, F. (2012), “Green marketing: Consumers´ Attitude towards
Eco-friendly Products and Purchase Intention in the Fast Moving Consumer Goods
(FMCG) sector”, PhD Thesis, Umeå School of Business, Sweden.

33
Mossberg, L. and Nissen Johansen, E. (2006), Storytelling: Marknadsf ö ring i
upplevelseindustrin, [Storytelling: Marketing in the Experience Industry].
Göteborg, Sweden: Studentlitteratur.
Nie, D., Wang, X.W., Shi, L.C. and Lu, B.L. (2011), “EEG-based Emotion Recognition
during Watching Movies”, in The 5th International IEEE EMBS Conference on
Neural Engineering, Cancun, Mexico, pp. 667-670.
O’Neill, M. and Palmer, A. (2003), “An exploratory study of the effects of experience
on consumer perceptions of the service quality construct”, Managing Service
Quality: An International Journal, Vol. 13 No. 3, pp. 187-196.
Pham, T.D. and Tran, D. (2012), “Emotion Recognition Using the Emotiv EPOC
Device”, in International Conference on Neural Information Processing, Springer
Berlin Heidelberg, pp. 394-399.
Pham, T.M., Geuens, M. and Pelsmacker, D.P. (2013), “The influence of ad-evoked
feelings on brand evaluations: Empirical generalizations from consumer responses
to more than 1000 TV commercials”, International Journal of Research in
Marketing, Vol. 30 No. 4, pp. 383-394.
Pérez-Belis, V., Bovea, M.D., Gómez, A. and Ruiz, A. (2012), “Caracterización de
residuos de aparatos eléctricos y electrónicos en su categoría 7 (juguetes)”, in XVI
International Congress On Project Management and Engineering, Valencia, Spain,
pp. 973-984.
Polyorat, K., Alden, D.L. and Kim, E.S. (2007), “Impact of narrative versus factual print
ad copy on product evaluation: The mediating role of ad message involvement”,
Psychology & Marketing, Vol. 24 No. 6, pp. 539-554.
Ramirez, R. and Vamvakousis, Z. (2012), “Detecting emotion from EEG signals using
34
the emotive epoc device”, in International Conference on Brain Informatics,
Springer Berlin Heidelberg, pp. 175-184.
Rahbar E. and Wahid N.A. (2011), "Investigation of green marketing tools' effect on
consumers' purchase behavior", Business Strategy Series, Vol. 12 No. 2, pp. 73–83.
Richins, M.L. (1994), “Valuing things: The public and private meanings of
possessions”, Journal of consumer research, Vol. 21 No. 3, pp. 504-521.
Ricoeur, P. (1988), Time and narrative, Vol. 3. University of Chicago P. (University.).
Chicago, IL.
Romani, S., Grappi, S. and Dalli, D. (2012), “Emotions that drive consumers away from
brands: Measuring negative emotions toward brands and their behavioural effects”,
International Journal of Research in Marketing, Vol. 29 No. 1, pp. 55-67.
Sheth, J.N., Newman, B.I. and Gross, B.L. (1991), “Why we buy what we buy: A theory
of consumption values”, Journal of business research, Vol. 22 No. 2, pp. 159-170.
Schuhwerk, M.E. and Lefkoff-Hagius, R. (1995), “Green or Non-Green? Does Type of
Appeal Matter when Advertising a Green Product?”, Journal of Advertising, Vol.
24 No. 2, pp. 45-54.
Solomon, M.R. (1999), Consumer behaviour, 4th ed., Prentice-Hall, Englewood Cliffs,
NJ.
Solomon, M.R., Bamossy, G., Askegaard, S. and Hogg, M.K. (2010), Consumer
Behaviour: A European Perspective, 4th edition. New York: Prentice Hall.
Storm, C. and Storm, T. (1987), “A taxonomic study of the vocabulary of emotions”,
Journal of personality and social psychology, Vol. 53 No. 4, pp. 805-816.
Sundin, E., Lindahl, M. and Ijomah, W. (2009), “Product design for product/service

35
systems: Design experiences from Swedish industry”, Journal of Manufacturing
Technology Management, Vol. 20 No. 5, pp. 723–753.
Suri, J.F. and Marsh, M. (2000), “Scenario building as an ergonomics method in
consumer product design”, Applied Ergonomics, Vol. 31 No. 2, pp. 151–157.
Tombs, A.G., Russell-Bennett, R. and Ashkanasy, M.N. (2014), “Recognising emotional
expressions of complaining customers: A cross-cultural study”, European Journal
of Marketing, Vol. 48 No. 7-8, pp. 1354-1374.
van der Bijl-Brouwer, M., and van der Voort, M.C. (2013), “Exploring future use:
scenario based design”, in de Bont, C., Smulders, F.E., van der Voort, M.C.,
Schifferstein, R., and den Ouden, E. (eds.), Advanced design methods for
successful innovation - Recent methods from design research and design
consultancy in the Netherlands , Delft: Design United, pp. 57-77.
Van Der Wagen, L. (1994), Building quality service with competency based human
resource management, Oxford: Butterworth Heinemann.
Verfaillie, H.A. and Bidwell, R. (2000), Eco-efficiency: a Guide To Reporting Company
Performance, in World Business Council for Sustainable Development: Geneva.
Wannimayake, W.M.C.B. and Randiwela, P. (2008), “Consumer attractiveness towards
Green Products of FMCG sector: An empirical study”, Oxford Business and
Economics Conference Program, pp. 1-19.
Watson, L. and Spence, M.T. (2007), “Causes and consequences of emotions on
consumer behaviour: A review and integrative cognitive appraisal theory”,
European Journal of Marketing, Vol. 41 No. 5-6, pp. 487-511.
WBCSD (1995), “Eco-efficient leadership for improved economic and environmental
performance”, World Business Council for Sustainable Development, Geneva.

36
WBCSD (2000), “Eco-efficiency: creating more value with less impact”, World
Business Council for Sustainable Development, Geneva.
Wogalter, M.S., Brelsford, J.W., Desaulniers, D.R. and Laughery, K.R. (1991),
“Consumer product warnings the role of hazard perception”, Journal of Safety
Research, Vol. 22, pp. 71–82.
Woodside, A.G., Sood, S. and Miller, K.E. (2008), “When consumers and brands talk:
Storytelling theory and research in psychology and marketing”, Psychology &
Marketing, Vol. 25 No. 2, pp. 97-145.