user’s manual, 1 st ed., nov. 2009 ivf smartquench® , ver. 3
TRANSCRIPT

User’s Manual, 1 st ed., Nov. 2009 ivf SmartQuench® , ver. 3.1
L:\UPPDRAGSPROJEKT\SMARTQUENCH\ADMINISTRATION\MANUALER\SMARTQUENCH\ENGLISH\VER 2.3, ED 1 SQ2MAN-ENG-VER2-3_ED 1 100111 FÖR TRYCK.DOC-01/JB
2009-11-05
1
© 2003-2014 Swerea IVF AB
ivf SmartQuench is a trademark of Swerea IVF AB and registered in Sweden and other countries.
Microsoft and Windows are trademarks of Microsoft Corporation in the USA and other countries.
All other product names mentioned herein may be trademarks of their respective companies.
Swerea IVF shall not be liable for technical or editorial errors or omissions contained herein. The information in this document is provided “as is” without warranty of any kind and is subject to change without notice. The warranty for ivf SmartQuench is set forth in the warranty statement expressed in the sales conditions announced by Swerea IVF in connection with the sale of the product.

User’s Manual, 1 st ed., Nov. 2009 ivf SmartQuench® , ver. 3.1
L:\UPPDRAGSPROJEKT\SMARTQUENCH\ADMINISTRATION\MANUALER\SMARTQUENCH\ENGLISH\VER 2.3, ED 1 SQ2MAN-ENG-VER2-3_ED 1 100111 FÖR TRYCK.DOC-01/JB
2009-11-05
2
Contents Safety precautions 4
Compliance with legal requirements 5
Limitation of liability – interpretation of test results 5
0 Operating principle 6
Standards for testing of quenching media 6
1 System overview 7
2 Description of components included in the equipment 9 2.1 Hand-held data acquisition device (“hand unit”) 9 2.1.1 General description 9 2.1.2 Function 10 2.1.3 Functions of the buttons 11 2.1.4 Settings 11 2.1.5 Service Layer Settings 12 2.1.6 Battery saving function 13 2.1.7 Battery indicator 13 2.2 Test Probe 14 2.2.1 Hardware 14 2.2.2 Routine checking of probes 14 2.2.3 Reconditioning 15 2.2.4 Probe life 15 2.2.5 Initial calibration of test probe 16 2.2.6 Recalibration of the test probe 16 2.2.7 Checking for open circuit 17 2.3 Heating furnace 18 2.3.1 Hardware 18 2.3.2 Calibration and routine checking 20 2.3.2.1 Changing the furnace temperature 20 2.3.2.2 Checking the heating element and furnace thermocouple 20 2.4 Arrangement for laboratory work 21
3 The ivf SmartQuench software 22 3.1 Computer requirements 22 3.2 Functions of the software 22 3.3 Installing the software 22 3.4 Starting the software 23 3.5 Database 23 3.5.1 Curve data 23 3.5.2 Control limit data 26 3.5.3 Probe data 27 3.5.4 Formula data 27 3.6 Evaluation 28 3.6.1 Selecting cooling curves to evaluate 29 3.6.2 Selecting curve properties 30 3.6.3 Sorting the selected curves 31 3.6.4 Query for optimised selection of curves 31 3.6.5 Selecting characteristic for evaluation 32 3.6.6 Selecting control limits for evaluation 33 3.6.7 Evaluation 34

User’s Manual, 1 st ed., Nov. 2009 ivf SmartQuench® , ver. 3.1
L:\UPPDRAGSPROJEKT\SMARTQUENCH\ADMINISTRATION\MANUALER\SMARTQUENCH\ENGLISH\VER 2.3, ED 1 SQ2MAN-ENG-VER2-3_ED 1 100111 FÖR TRYCK.DOC-01/JB
2009-11-05
3
3.7 Copying diagrams and printing reports 34 3.7.1 Diagram set-up 34 3.7.2 Copying diagrams 35 3.7.3 Print set-up 37 3.7.4 Saving a report 38 3.7.5 Printed reports 38
4 Test procedure 42 4.1 Preparations 42 4.1.1 Heating the furnace 42 4.1.2 Preparing the test probe 42 4.1.3 Preparing the quenchant sample to be tested 42 4.1.4 Preparing the hand unit 42 4.2 Measurement 43 4.2.1 Preparations 43 4.2.2 Start measurement 43 4.2.3 Heating the test probe 43 4.2.4 Saving a measurement 45 4.3 Cleaning the test probe after measurement 46 4.4 Removing the cable from test probe and from the hand unit 46
5 Data transmission 47 5.1 Preparations 47 5.2 Data transmission alternatives 48 5.2.1 Bluetooth data transmission 48 5.2.2 Data transmission by wire 49 5.3 Measurement file 51 5.4 Importing cooling curves to the ivf SmartQuench software 52 5.5 Exporting cooling curves from the ivf SmartQuench software 53
6 Option: Agitation device 55 6.1 Introduction 55 6.2 Characteristics 55 6.2.1 Design 55 6.2.2 Impeller speed 56 6.2.3 Fluid temperature 56 6.2.4 Fluid types 56 6.2.5 Handling 56 6.3 Preparations before testing 57 6.3.1 Removal of air 57 6.3.2 Fluid level 57 6.3.3 Positioning the test probe in the test chamber 57 6.4 Cleaning the test chamber after testing 57 6.5 Calibration and routine checking 58 6.5.1 Calibration of the impeller speed 58 6.5.2 Checking the flow direction 58
7 ivf SmartQuench Technical Support 59
8 Appendix 1 60

User’s Manual, 1 st ed., Nov. 2009 ivf SmartQuench® , ver. 3.1
L:\UPPDRAGSPROJEKT\SMARTQUENCH\ADMINISTRATION\MANUALER\SMARTQUENCH\ENGLISH\VER 2.3, ED 1 SQ2MAN-ENG-VER2-3_ED 1 100111 FÖR TRYCK.DOC-01/JB
2009-11-05
4
Safety precautions
Furnace
The furnace must be used only for heating test probes to be used in connection with the supplied data acquisition device.
When hot, the furnace must be moved only by the handle. The surface is fairly hot – about 60–70 °C (140–160 °F). DO NOT TOUCH !
The electrical supply to the furnace must be grounded. If an extension cord or adapter is used, make sure that it is correctly grounded.
Test probe
When transferring the heated test probe from the furnace to the testing position, make sure that nobody is at risk of being burnt by it. The probe temperature is very high, about 850oC (1 562oF). It is the responsibility of the operator to ensure safety.
Computer (optional)
The computer must be used only in accordance with the handling and safety instructions provided by the manufacturer of the computer.
Agitation device (optional)
The electrical supply to the motor controller must be grounded. If an extension cord or adapter is used, make sure that it is correctly grounded.

User’s Manual, 1 st ed., Nov. 2009 ivf SmartQuench® , ver. 3.1
L:\UPPDRAGSPROJEKT\SMARTQUENCH\ADMINISTRATION\MANUALER\SMARTQUENCH\ENGLISH\VER 2.3, ED 1 SQ2MAN-ENG-VER2-3_ED 1 100111 FÖR TRYCK.DOC-01/JB
2009-11-05
5
Compliance with legal requirements Products and components marked with the CE marking comply with the Radio Equipment and Telecommunications Terminal Directive – R&TTE (99/5/EC), the EMC Directive (2004/108/EG) and the Low Voltage Directive (2006/95/EG).
Components marked with the FCC marking also comply with the radio emission rules in FCC Part 15 B.
FCC RF Radiation Exposure Statement: This product complies with FCC radiation exposure limits set forth for an uncontrolled environment. “Contains Transmitter Module FCC ID: QOQWT12” WT12-A FCC ID: QOQWT12
Limitation of liability – interpretation of test re sults Evaluation of the test results, and conclusions drawn from them, is the responsibility of the user. Swerea IVF accepts no responsibility for any damage, injury, loss of profit, loss of goodwill or any other adverse, hazardous or undesired effect etc. whatsoever resulting from actions taken as a result of measurements made using the ivf SmartQuench equipment, irrespective of whether such measurements have been made in accordance with the instructions supplied by Swerea IVF for use of the equipment or not.
If results from measurements are not as expected, they should be repeated and explanations for any discrepancy be determined.

User’s Manual, 1 st ed., Nov. 2009 ivf SmartQuench® , ver. 3.1
L:\UPPDRAGSPROJEKT\SMARTQUENCH\ADMINISTRATION\MANUALER\SMARTQUENCH\ENGLISH\VER 2.3, ED 1 SQ2MAN-ENG-VER2-3_ED 1 100111 FÖR TRYCK.DOC-01/JB
2009-11-05
6
0 Operating principle The operating principle of the equipment involves immersing a test probe, having standardised dimensions and consisting of standardised material, and which has previously been heated in a furnace to a standardised starting temperature for testing, in the quenchant to be tested. The probe contains a built-in thermocouple, connected to the recording equipment, which records the temperature-time process. Data are stored digitally and can be plotted graphically or printed out in tabular form on paper for subsequent presentation of results.
This system offers a number of different functions, such as:
• Recording, displaying and printing of temperature vs. time curves
• Calculation of cooling rate vs. temperature, and displaying and printing as diagrams
• Displaying and printing in tabular form of associated temperatures, times and cooling rates
• Evaluation of measurement data in many different respects.
Up to twenty measurements can be stored in the hand unit for subsequent transmission to a computer. Data stored in the hand unit remain in memory even when the hand unit is turned off.
Stored data are transmitted by Bluetooth or by USB-cable to a computer for ultimate storage, evaluation and presentation of cooling curves, bar chart diagrams and tables.
Standards for testing of quenching media The ivf SmartQuench is designed to be able to be used in accordance with the following standards for determining cooling characteristics of quenching media for heat treatment:
• ISO 9950:1995, “Industrial quenching oils – Determination of cooling characteristics – Nickel-alloy probe test method”
• ASTM D 6200-01, “Standard Test Method for Determination of Cooling Characteristics of Quenching Oils by Cooling Curve Analysis”
• ASTM D 6482-06, “Standard Test Method for Determination of Cooling Characteristics of Aqueous Polymer Quenchants by Cooling Curve Analysis with Agitation (Tensi Method)”
The latter requires the optional agitation device be used.
Employing a 16 mm dia. x 48 mm silver test probe (instead of the standard 12.5 mm dia. x 60 mm Inconel 600 test probe), enables the system to be used for testing in accordance with the French standard NFT 60 178, “Drasticité des huiles de trempe. Essai au capteur d’argent”. NB. The latter requires an optional design of the furnace with a larger diameter of the heating zone that can also be provided by Swerea IVF.

User’s Manual, 1 st ed., Nov. 2009 ivf SmartQuench® , ver. 3.1
L:\UPPDRAGSPROJEKT\SMARTQUENCH\ADMINISTRATION\MANUALER\SMARTQUENCH\ENGLISH\VER 2.3, ED 1 SQ2MAN-ENG-VER2-3_ED 1 100111 FÖR TRYCK.DOC-01/JB
2009-11-05
7
1 System overview The ivf SmartQuench standard system consists of the following components:
• One hand-held data acquisition unit (“hand unit”) with cable for probe connection
• One CD with the ivf SmartQuench software
• One USB hardware key for protecting the software from unauthorized use
• One Standard test probe with handle and test certificate
• One Reference test probe with test certificate
• One USB cable for curve transmission
• One Bluetooth USB Adapter
• One furnace for heating the test probe
• One 2-litre (or 1-litre) beaker with holder to facilitate testing in the laboratory
• Two 1-litre tins of reference oil, with test certificate
• One carrying case for the hand unit, test probes, , hardware key, batteries and cables
• One user’s manual.
Computer (optional) with software
Furnace
Test probe Beaker (with holder for the test probe) Hand unit
Fig. 1.1 System overview, ivf SmartQuench

User’s Manual, 1 st ed., Nov. 2009 ivf SmartQuench® , ver. 3.1
L:\UPPDRAGSPROJEKT\SMARTQUENCH\ADMINISTRATION\MANUALER\SMARTQUENCH\ENGLISH\VER 2.3, ED 1 SQ2MAN-ENG-VER2-3_ED 1 100111 FÖR TRYCK.DOC-01/JB
2009-11-05
8
Stop ring for vertical positioning of the test probe Cone for centring the test probe in the beaker Holder Beaker
Fig. 1.2 Beaker with holder to facilitate laboratory testing.
Fig. 1.3 Reference oil to ensure consistent test results
Software installation disc Hardware key
Manual
Hand unit
Test probes with handle
Cables
Fig. 1.4 Contents of the carrying case.
The following items are optional:
• Agitation device for testing polymer quenchants
• Hand-held temperature measuring device with calibrated thermocouple (for calibrating the temperature measurement system)
• Hand-held digital tachometer with reflecting tape (for controlling the agitation device’s impeller speed)
• Portable computer
User’s Manual, 1 st ed., Nov. 2009 ivf SmartQuench® , ver. 3.1
L:\UPPDRAGSPROJEKT\SMARTQUENCH\ADMINISTRATION\MANUALER\SMARTQUENCH\ENGLISH\VER 2.3, ED 1 SQ2MAN-ENG-VER2-3_ED 1 100111 FÖR TRYCK.DOC-01/JB
2009-11-05
9
2 Description of components included in the equipment
2.1 Hand-held data acquisition device (“hand unit”)
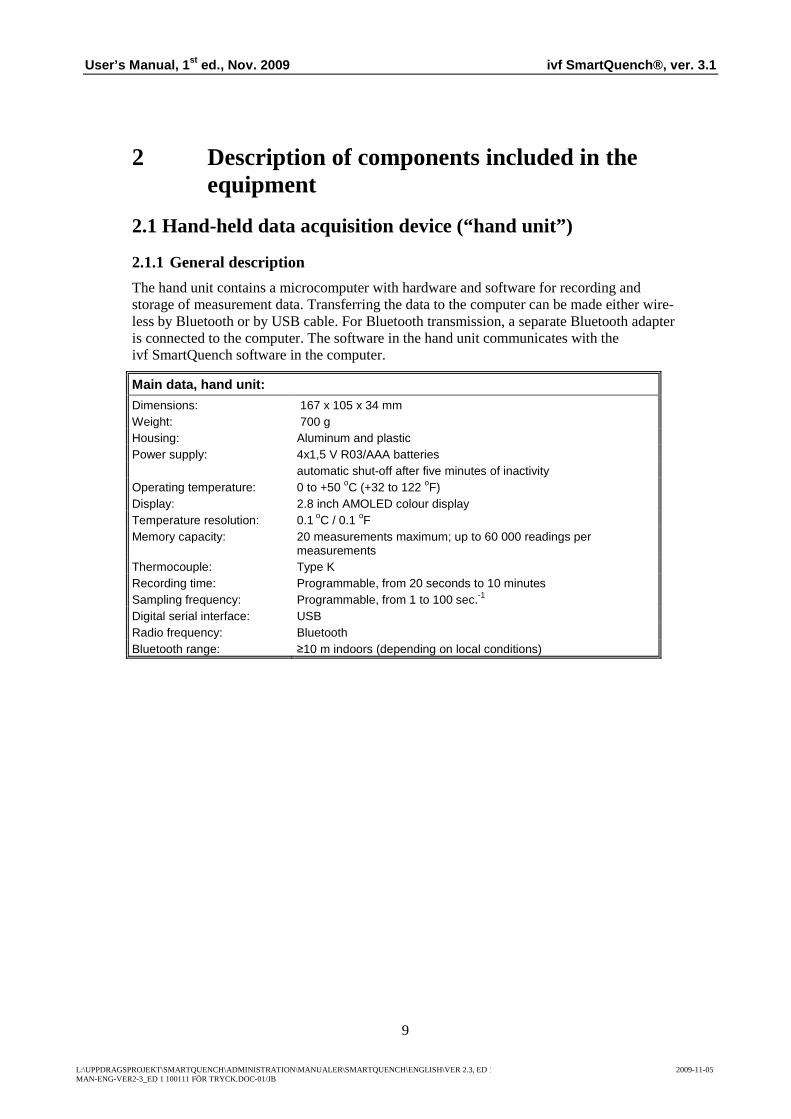
2.1.1 General description The hand unit contains a microcomputer with hardware and software for recording and storage of measurement data. Transferring the data to the computer can be made either wire-less by Bluetooth or by USB cable. For Bluetooth transmission, a separate Bluetooth adapter is connected to the computer. The software in the hand unit communicates with the ivf SmartQuench software in the computer.
Main data, hand unit:
Dimensions: 167 x 105 x 34 mm Weight: 700 g Housing: Aluminum and plastic Power supply: 4x1,5 V R03/AAA batteries automatic shut-off after five minutes of inactivity Operating temperature: 0 to +50 oC (+32 to 122 oF) Display: 2.8 inch AMOLED colour display Temperature resolution: 0.1 oC / 0.1 oF Memory capacity: 20 measurements maximum; up to 60 000 readings per
measurements Thermocouple: Type K Recording time: Programmable, from 20 seconds to 10 minutes Sampling frequency: Programmable, from 1 to 100 sec.-1
Digital serial interface: USB Radio frequency: Bluetooth Bluetooth range: ≥10 m indoors (depending on local conditions)

User’s Manual, 1 st ed., Nov. 2009 ivf SmartQuench® , ver. 3.1
L:\UPPDRAGSPROJEKT\SMARTQUENCH\ADMINISTRATION\MANUALER\SMARTQUENCH\ENGLISH\VER 2.3, ED 1 SQ2MAN-ENG-VER2-3_ED 1 100111 FÖR TRYCK.DOC-01/JB
2009-11-05
10
2.1.2 Function
Fig. 2.1 Hand unit front layout.
There are three main views shown at the display.
• Files • Settings • View
In Files you can see a list of the saved measurements in your hand unit. You can open one curve at the time to see the graph in the View window, rename or delete the curve. In Settings parameters for your measurements are chosen. From Settings you also access the Service Layer. Here you find settings that only authorized personnel shall adjust. The Service Layer is for calibration and initial settings. In View you see curve graphs. You can switch curve to be shown by pressing Enter when the file name is marked. Arrows pointing up and down will appear over the file name to show that you now can change between curves to be shown in the graph. By pressing Enter again the arrows up and down disappears and you can highlight the View headline again to move left or right to either Settings or Files.
NOTE that only trained service personnel should use the Service Layer Settings.
Settings Start Mode
Time Start Temperature
Probe Number Sampling rate
Service Layer Settings
ENTER
Display
Connection for test probe
Buttons for moving in menus. Enter in the middle to confirm choices
Connection to computer for data transmission by USB cable
User’s Manual, 1 st ed., Nov. 2009 ivf SmartQuench® , ver. 3.1
L:\UPPDRAGSPROJEKT\SMARTQUENCH\ADMINISTRATION\MANUALER\SMARTQUENCH\ENGLISH\VER 2.3, ED 1 SQ2MAN-ENG-VER2-3_ED 1 100111 FÖR TRYCK.DOC-01/JB
2009-11-05
11
NOTE The hand unit has a reset button on the backside. It is located just above the battery compartment. The aluminium plate has a mark that gets visible when removing the battery lid. If you for some reason get a strange phenomena you can try to use this button. Hold it down for about one second. Stored curves WILL BE LOST. You must save them in your computer before resetting.
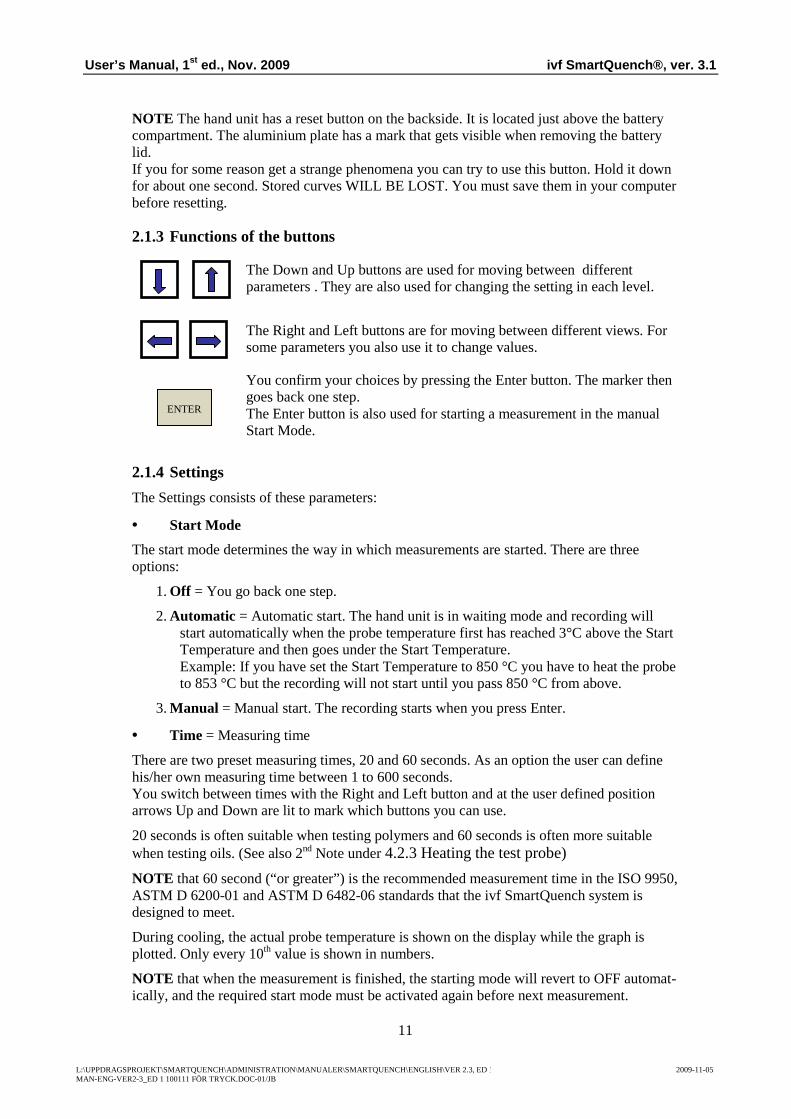
2.1.3 Functions of the buttons
The Down and Up buttons are used for moving between different parameters . They are also used for changing the setting in each level.
The Right and Left buttons are for moving between different views. For some parameters you also use it to change values.
You confirm your choices by pressing the Enter button. The marker then goes back one step. The Enter button is also used for starting a measurement in the manual Start Mode.
2.1.4 Settings
The Settings consists of these parameters:
• Start Mode
The start mode determines the way in which measurements are started. There are three options:
1. Off = You go back one step.
2. Automatic = Automatic start. The hand unit is in waiting mode and recording will start automatically when the probe temperature first has reached 3°C above the Start Temperature and then goes under the Start Temperature. Example: If you have set the Start Temperature to 850 °C you have to heat the probe to 853 °C but the recording will not start until you pass 850 °C from above.
3. Manual = Manual start. The recording starts when you press Enter.
• Time = Measuring time
There are two preset measuring times, 20 and 60 seconds. As an option the user can define his/her own measuring time between 1 to 600 seconds. You switch between times with the Right and Left button and at the user defined position arrows Up and Down are lit to mark which buttons you can use.
20 seconds is often suitable when testing polymers and 60 seconds is often more suitable when testing oils. (See also 2nd Note under 4.2.3 Heating the test probe)
NOTE that 60 second (“or greater”) is the recommended measurement time in the ISO 9950, ASTM D 6200-01 and ASTM D 6482-06 standards that the ivf SmartQuench system is designed to meet.
During cooling, the actual probe temperature is shown on the display while the graph is plotted. Only every 10th value is shown in numbers.
NOTE that when the measurement is finished, the starting mode will revert to OFF automat-ically, and the required start mode must be activated again before next measurement.
ENTER

User’s Manual, 1 st ed., Nov. 2009 ivf SmartQuench® , ver. 3.1
L:\UPPDRAGSPROJEKT\SMARTQUENCH\ADMINISTRATION\MANUALER\SMARTQUENCH\ENGLISH\VER 2.3, ED 1 SQ2MAN-ENG-VER2-3_ED 1 100111 FÖR TRYCK.DOC-01/JB
2009-11-05
12
• Start Temperature
Start Temperature is a preset temperature at which recording starts automatically. This parameter is intended to ensure consistency in testing and to facilitate comparisons between measurements, see Figure 4.3.
Adjust the Start Temperature with the button Up or Down. Press Enter to confirm.
Note that 850 °C is the recommended starting temperature for measurements.
• Probe Number
Enter the test probe number for the probe used for a certain measurement. By using this function you can keep track on which probe you used for all your measurements. Use the arrow Up or Down to set your probe number. Confirm with Enter.
• Sample Rate
Sample rate is the number of recordings per seconds. It can be set to 1, 2, 4, 5, 10, 20, 50 or 100 Hz. For some occasions some sample rates are blocked. This is due to the formula used in the filter function. The filter function gets unstable at some settings and those are:
Sample rate Filter value 0.1 1 2 4 5 Filter value 0.2 1 2 Filter value 0.3 1 Filter value 0.4 1 Filter value 0.5 1
• Service Layer Settings
See chapter 2.1.5
2.1.5 Service Layer Settings
• Calibration Room Temp
Measured Value shows the temperature read by the sensor close to the probe connection inside the hand unit. If adjusting the measured value, set it according to you readings from a calibrated instrument. Press Enter when the marker is at the Correction Value to light the arrows above and below the value. Adjust in steps by 0.5 °C until you can read the correct value under Measured Value. Press Enter to confirm.
NOTE that it is very important that the hand unit itself has the same temperature as the room and thermocouple you calibrate against. Make sure it has got enough time to adjust its temperature to the room temperature where you are located. The built in sensor must get time to stabilize at the same temperature as the equipment you calibrate against and the room where you are located.
• Calibration Hot Temp
Measured value shows the temperature that the connected probe or thermocouple has. See Calibration Room Temp for adjustment.
NOTE that your hand unit is calibrated before delivery.

User’s Manual, 1 st ed., Nov. 2009 ivf SmartQuench® , ver. 3.1
L:\UPPDRAGSPROJEKT\SMARTQUENCH\ADMINISTRATION\MANUALER\SMARTQUENCH\ENGLISH\VER 2.3, ED 1 SQ2MAN-ENG-VER2-3_ED 1 100111 FÖR TRYCK.DOC-01/JB
2009-11-05
13
• Enable Password / Set password / Disable Password
With this function you can set a password to prevent unauthorized or unexpected changes in the Service Layer Settings.
Make sure to remember your password if you use this option!
By choosing Enable Password an alphabet window appears. Type your password and press Done. Next time you try to access the Service Layer Settings you are asked to enter your password. You need to type the password before you can disable the function.
• Filter
This is a filter function for the temperature, intended to decrease the scatter (noise) in the measurement data. Normally it should be set to 0.1.
• Celsius or Fahrenheit
Mark your choice and press Enter.
• Brightness
The brightness of the display can be adjusted in two levels. The high level will consume more battery power than the low.
• Set Time and Date
The hand unit has a back up battery. The measurement file (raw data) contains time and date from when the measurement was recorded. See Fig 5.9.
If you need to set your time or date, go to the position you want to adjust, press Enter to light the arrows and adjust by pressing Up or Down. Confirm with Enter. After all adjustments are made, go to Done and you will get back to the Service Layer Settings main menu.
2.1.6 Battery saving function
The hand unit will automatically turn itself off after five minutes, to save battery power, if no button is pressed during this period. After pressing any button, the hand unit will stay active for another five minutes. You can not turn it of manually. You will return to the same menu as you were in before the unit turned itself off. Exceptions:
• If the hand unit is in the start mode (either “Start Manual” or “Start Automatic”), then it stays active waiting to start the measurement.
• If the hand unit shows Save or Delete after a measurement.
2.1.7 Battery indicator In the top right corner of the display you can find a battery indicator. When it turns red we recommend replacing the batteries to avoid scatter (noise) in the measured data.

User’s Manual, 1 st ed., Nov. 2009 ivf SmartQuench® , ver. 3.1
L:\UPPDRAGSPROJEKT\SMARTQUENCH\ADMINISTRATION\MANUALER\SMARTQUENCH\ENGLISH\VER 2.3, ED 1 SQ2MAN-ENG-VER2-3_ED 1 100111 FÖR TRYCK.DOC-01/JB
2009-11-05
14
2.2 Test probe
2.2.1 Hardware
The test probe is designed as follows:
Fig. 2.5 Test probe design.
Main data, test probe:
Weight: 240 g Length: 400 ±5 mm (standard)
Material: Inconel 600
Thermocouple: Type K, 1.5 mm dia.
The test probe complies with the international standard ISO 9950 and the American standards ASTM D 6200-01 and ASTM D 6482-06.
The 1.5 mm diameter thermocouple is a type K thermocouple (NiCr/NiAl), with the hot junction insulated.
The probe design facilitates:
• easily changing to other test probes, having the same plug connection
• using a separate thermocouple, type K, with the hot junction insulated from the sheath
2.2.2 Routine checking of probes
IMPORTANT. Test probe performance is largely dependent on the condition of the probe surface. It may change with time as a result of deposits on or oxidation of the surface, although this is a slow process on Inconel 600. The condition of the probe should therefore be checked at regular intervals, normally after 25 tests, or before every new series of tests.
Routine checking of the test probes is most easily performed using the reference oil supplied by Swerea IVF, and comparing the test result with the test certificate delivered with each test probe.

User’s Manual, 1 st ed., Nov. 2009 ivf SmartQuench® , ver. 3.1
L:\UPPDRAGSPROJEKT\SMARTQUENCH\ADMINISTRATION\MANUALER\SMARTQUENCH\ENGLISH\VER 2.3, ED 1 SQ2MAN-ENG-VER2-3_ED 1 100111 FÖR TRYCK.DOC-01/JB
2009-11-05
15
NOTE that any other quenching oil that is known to be stable over a longer period may also be used. This can be ensured by taking a sufficient quantity of clean oil and saving it in an airtight container, for use only for checking probe performance. When first taking the oil sample, a test should be carried out on it with a reference probe, for use only for checking the reference quenchant, or a newly checked and calibrated probe to provide a reference cooling curve, against which subsequent cooling curves from the regular checks can be compared.
The extent of deviation from normal performance that can be accepted before the test probe needs reconditioning depends on the requirements in each situation. However, as a guide, maximum cooling rate should not deviate from the reference curve by more than ± 3 %, or the temperature/time curve by more than ±1 s at 600 °C, ±2 s at 400 °C and ±3 s at 200 °C.
IMPORTANT. The test probe is one of the most important components in the whole measurement system. Insufficient care and insufficient observation of the probe condition may lead to significant deviations in the test results.
2.2.3 Reconditioning
When checks of the test probe, either as carried out in the reference oil or in some other way, produce results that differ excessively from those given by a new test probe, or if considerable deposits or oxidation have built up on the probe surface, the probe must be reconditioned.
Start by cleaning the surface as described in Section 4.3. Continue by cleaning the surface with an abrasive paper; suitable grain size is 180 or 220 mesh for initial grinding and 320 mesh for finishing. The probe may then be stabilised by performing a number (3–5) of blind tests, i.e. using the probe in the normal way (preferably in oil), but without recording, before it can be regarded as performing normally in terms of reproducibility of results.
NOTE. The procedure with blind testing is specified as the prime procedure in the standards referred to, ISO 9950, ASTM D 6200 and ASTM D 6482. However, it has shown in many cases, and it is Swerea IVF’s own experience from more than 20 years of testing, that consistent results can be achieved without blind testing.
2.2.4 Probe life
The probe life depends primarily on the quenching intensity of the quenchant in which the probe is used. Rapid quenching shortens its life. The following guide values provide an indication of probable life to be expected:
Quenchant type Approx. number of tests
Polymer quenchants 100 - 150
Quenching oils 200 - 300
Any crack in the weld between the probe body and the support tube, the most sensitive part, will allow quenchant to enter into the tube. This will be indicated by a sputtering sound while the probe is being heated and the upper part of the probe normally gets warm. If the probe is then taken out of service, it can normally be repaired by re-welding.

User’s Manual, 1 st ed., Nov. 2009 ivf SmartQuench® , ver. 3.1
L:\UPPDRAGSPROJEKT\SMARTQUENCH\ADMINISTRATION\MANUALER\SMARTQUENCH\ENGLISH\VER 2.3, ED 1 SQ2MAN-ENG-VER2-3_ED 1 100111 FÖR TRYCK.DOC-01/JB
2009-11-05
16
The test probe is intended to be used for measuring the quenching characteristics of quenchants starting from 855 oC maximum, normally, in any case not higher than 870 oC. Using higher temperatures will shorten its life considerably.
2.2.5 Initial calibration of test probe
Before delivery, each probe is tested individually and compared with Swerea IVF’s master probe. A test certificate is issued and a green label is fixed to the probe to show the calibration status. A factor of calibration “k” is determined (marked on the green label and on the certificate). This is to ensure traceability and that all probes delivered will perform with a minimum of variation.
NB. The K-factor is a multiplication factor that influences only the cooling rate. New test probes always have k=1.00, although there may be a slight variation (within 1-2 %) in the recorded maximum cooling rate in the probe certificates.
2.2.6 Recalibration of the test probe
To ensure consistent test results, the test probe must be calibrated periodically by testing in a reference fluid and comparing with results from the initial calibration. The properties of test probes in use may show a slow drift in thermal response with time, e.g. due to reconditioning by grinding, which reduces the probe diameter. This will have an influence on – mainly – the (maximum) cooling rate. Usually, the (maximum) cooling rate will increase a little and this can be compensated for by multiplying the recorded cooling rate with the “k”-factor.
The K-factor is determined by making a standard test in Swerea IVF’s reference oil with the reference probe and the probe to be calibrated, carefully prepared. The maximum cooling rate is determined for both. The K-factor is defined as the ratio between the maximum cooling rate of the actual probe and the reference probe:
K = CRmaxref/CRmaxprobe
Example:
The maximum cooling rate for the actual probe was determined to 82 °C/s (curve B in the figure to the right), while it was 78 °C/s in the initial condition (curve A). The new “k” factor (k1) can be determined as follows: k1 = 78/82 x k0, where k0 is the initial ”k” factor (delivery condition). Assuming k0 = 1.00 will give k1 = 0.95.
NOTE that when new “k” factor has been determined for a probe, a new probe has to be defined in the Probe database having the new "k" factor, see Section 3.5.3.
Fig. 2.6 k-factor explanation
NOTE that the ”k” factor only influences the cooling rate, and so, the cooling rate vs. temperature curve. The temperature vs. time curve is not influenced.
NOTE Swerea IVF recommends you to use only probes with K-factors in the range 0.90-1.10. Probes with K-factors outside this range should no longer be used.

User’s Manual, 1 st ed., Nov. 2009 ivf SmartQuench® , ver. 3.1
L:\UPPDRAGSPROJEKT\SMARTQUENCH\ADMINISTRATION\MANUALER\SMARTQUENCH\ENGLISH\VER 2.3, ED 1 SQ2MAN-ENG-VER2-3_ED 1 100111 FÖR TRYCK.DOC-01/JB
2009-11-05
17
2.2.7 Checking for open circuit
If there is no signal from the probe thermocouple, one of its wires may be broken. Measure the resistance of the thermocouple to check for open circuit or other faults. The resistance of the thermocouple should normally be about 10 ohms, with a resistance of several mega ohms (MΩ) (i.e. essentially infinite) between the thermocouple and the body of the test probe.

User’s Manual, 1 st ed., Nov. 2009 ivf SmartQuench® , ver. 3.1
L:\UPPDRAGSPROJEKT\SMARTQUENCH\ADMINISTRATION\MANUALER\SMARTQUENCH\ENGLISH\VER 2.3, ED 1 SQ2MAN-ENG-VER2-3_ED 1 100111 FÖR TRYCK.DOC-01/JB
2009-11-05
18
2.3 Heating furnace
2.3.1 Hardware
The heating furnace consists of:
Fig. 2.7 Furnace design.
Main data, furnace:
Dimensions: 215 x 295 x 305 mm Weight: 6.9 kg Power supply: I: 220/240 V, max. 6.3 A, 50/60 Hz II: 110/120 V, max. 6.3 A, 50/60 Hz Power consumption: max. 600 W Fuse: 6.3 A (ceramic)
The furnace thermostat controls the power supplied to the furnace through diode rectification.
When heating up the furnace from cold, the temperature will first pass the normal operating temperature and then stabilise at about 870 oC, see Figure 2.8. This temperature has been chosen as the normal operating temperature for the furnace in order to heat the test probe quickly. Actual testing, however, should start when the temperature of the test probe has reached about 855 oC. See Section 4.1.4.
WARNING: The furnace temperature will reach around 900 °C before stabilizing at the preset operating temperature. DO NOT HEAT TEST PROBES TO THIS TEMPERATURE! It would reduce their life and affect their cooling characteristics.

User’s Manual, 1 st ed., Nov. 2009 ivf SmartQuench® , ver. 3.1
L:\UPPDRAGSPROJEKT\SMARTQUENCH\ADMINISTRATION\MANUALER\SMARTQUENCH\ENGLISH\VER 2.3, ED 1 SQ2MAN-ENG-VER2-3_ED 1 100111 FÖR TRYCK.DOC-01/JB
2009-11-05
19
Fig. 2.8 Furnace temperature during start-up.
The power system is designed to work on either 220/240 V or 110/120 V. It is important to know the correct setting on the furnace control unit, for example in case the fuses have to be exchanged, in order to avoid mistakes, see Figure 2.8.
Fig. 2.9 Setting the furnace voltage on the furnace control unit.
WARNING: For safety reasons make sure the furnace is grounded correctly. Failure of, or insufficient, grounding may be dangerous.
220/240 V
Fuse
No fuse
110/120 V
Fuse
Fuse

User’s Manual, 1 st ed., Nov. 2009 ivf SmartQuench® , ver. 3.1
L:\UPPDRAGSPROJEKT\SMARTQUENCH\ADMINISTRATION\MANUALER\SMARTQUENCH\ENGLISH\VER 2.3, ED 1 SQ2MAN-ENG-VER2-3_ED 1 100111 FÖR TRYCK.DOC-01/JB
2009-11-05
20
2.3.2 Calibration and routine checking
2.3.2.1 Changing the furnace temperature
Furnace temperature can be changed or adjusted by means of the rotary potentiometer in the temperature control unit, as in Figure 2.9.
Increasing temperature: 1 potentiometer turn clockwise = +60 °C
Fig. 2.10 Adjustment of the temperature reading on the furnace display.
2.3.2.2 Checking the heating element and furnace thermocouple
Measure the resistance of the furnace heating element to check for an open circuit or fault. Remove the cover of the temperature control unit and disconnect the heating element leads. Measure the resistance between them, which should be about 35–40 ohms. The resistance between the heating element and the furnace casing or thermocouple sheath should be several megohms (i.e. essentially infinite) in the cold state.
The furnace thermocouple element can be checked in a similar manner. Its resistance should be about 8–10 ohms, with several mega ohms (MΩ) between the thermocouple and sheath in the cold state.

User’s Manual, 1 st ed., Nov. 2009 ivf SmartQuench® , ver. 3.1
L:\UPPDRAGSPROJEKT\SMARTQUENCH\ADMINISTRATION\MANUALER\SMARTQUENCH\ENGLISH\VER 2.3, ED 1 SQ2MAN-ENG-VER2-3_ED 1 100111 FÖR TRYCK.DOC-01/JB
2009-11-05
21
2.4 Arrangement for laboratory work This facility with beaker and holder enhances testing in the laboratory. Even if most testing is carried out in the heat treatment shop, calibration of test probes and equipment has to be done in the laboratory at intervals. Figure 2.10 shows the intended arrangement. The volume of the beaker can be either 1 litre or 2 litres.
*Will be equal to 1.8 litre fluid
*Will be equal to 0.9 litre fluid
Fig. 2.11 Left: Arrangement to enhance laboratory testing. Middle and right: Important dimensions when filling the beaker and fixing the stop ring.
IMPORTANT! The stop ring must be mounted on the probe support tube at such a level that the test probe body (see Figure 2.5) is positioned in the middle of the oil sample when it is lowered into the beaker.
IMPORTANT! The ISO 9950 standard specifies that the oil sample volume must be two litres. Comprehensive testing at Swerea IVF over a period of more than ten years has shown that there is very little and insignificant difference in the test results, if any, between tests using one-litre and tests using two-litre samples. Other laboratories have confirmed these observations.
Considering the advantages of handling oil samples of only one litre instead of two litres, including the disposal problem for used samples, Swerea IVF therefore offer also 1-litre beakers.
Should you prefer to follow ISO 9950 strictly, you must use a 2-litre beaker.
30 mm*
155 mm
Test probe
Stop ring
2 litre beaker 1 litre beaker
120 mm
30 mm*

User’s Manual, 1 st ed., Nov. 2009 ivf SmartQuench® , ver. 3.1
L:\UPPDRAGSPROJEKT\SMARTQUENCH\ADMINISTRATION\MANUALER\SMARTQUENCH\ENGLISH\VER 2.3, ED 1 SQ2MAN-ENG-VER2-3_ED 1 100111 FÖR TRYCK.DOC-01/JB
2009-11-05
22
3 The ivf SmartQuench software
3.1 Computer requirements • 64 MB RAM minimum
• 20 MB minimum free hard disk space
• Operating system: Windows 9x/NT/ME/2000/XP/Vista/Windows 7. 32-Bits
• USB port for communication between PC and hand unit (USB cable or Bluetooth adapter). (PC´s equipped with built in Bluetooth may also be used instead of the Bluetooth adapter but such solutions has to be supported by each user themselves.
• USB port for the hardware key. NOTE that the USB hardware key cannot be used on computers having Windows NT. NOTE The hardware key and software cannot be used over a network. The user has to have the hardware key in the computer where the software is installed.
3.2 Functions of the software The ivf SmartQuench software has two main functions:
• Communicating with the hand unit, including: - reading (or presetting (not available yet)) parameters in the hand unit, - importing data (cooling curves) from the hand unit to a folder in the computer
• Handling and evaluating measurement data, including: - importing data to the ivf SmartQuench program, - displaying general and calculated data, - evaluating and comparing different characteristics, also user-defined by employing the formula editor, - setting ‘control limits’ for selected characteristics, - displaying cooling curves and bar charts for selected characteristics, - selecting measurements from the database meeting certain criteria, - printing reports.
3.3 Installing the software 1 Start MS Windows, and close any other Windows-based programs that are running.
2 Insert the installation disc in the CD drive.
3 Go to Windows Explorer (in 2000 or NT) or My Computer (in XP).
4 Go to the “D:\ComboInstaller” folder and double-click it, run “setup.exe” and enter info where requested, click “Next”, “Install” and “Finish”.
5 Go to the “D:\SmartQuench install” folder and double-click it, run “setup.exe” and enter info where requested, click “Next” and “Finish”.
6 Re-start the computer. The ivf SmartQuench icon can now be seen on the Windows desktop.
User’s Manual, 1 st ed., Nov. 2009 ivf SmartQuench® , ver. 3.1
L:\UPPDRAGSPROJEKT\SMARTQUENCH\ADMINISTRATION\MANUALER\SMARTQUENCH\ENGLISH\VER 2.3, ED 1 SQ2MAN-ENG-VER2-3_ED 1 100111 FÖR TRYCK.DOC-01/JB
2009-11-05
23
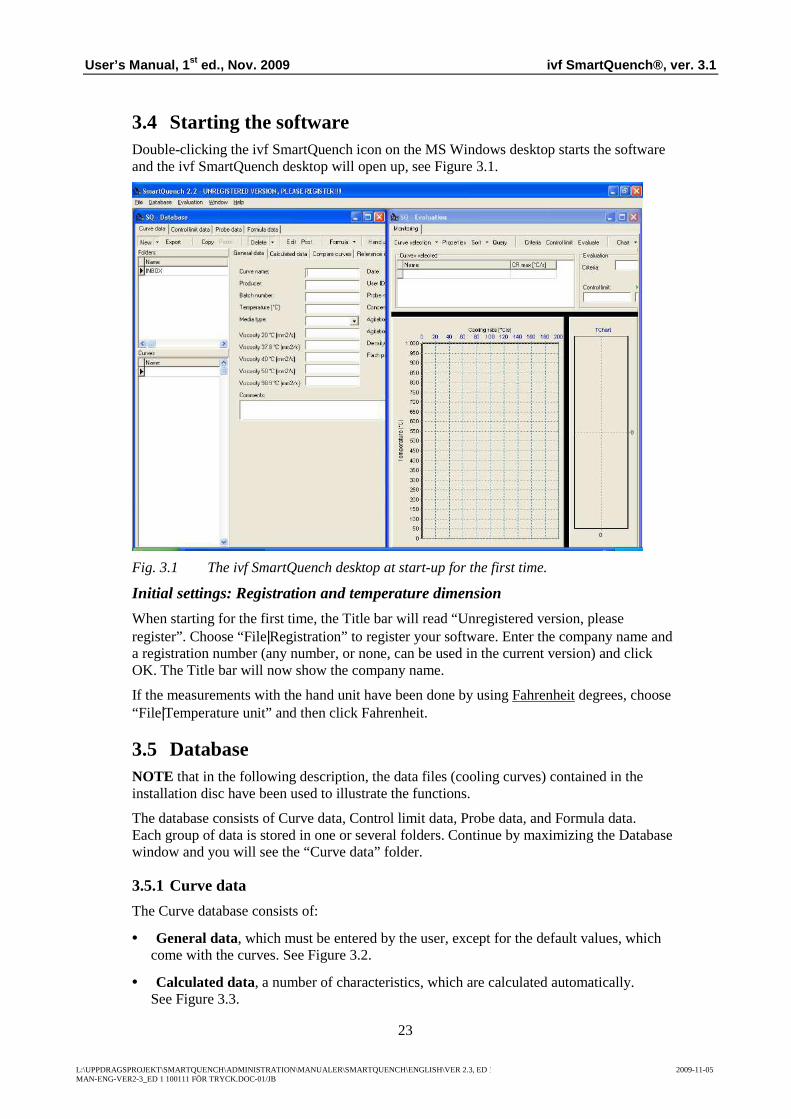
3.4 Starting the software Double-clicking the ivf SmartQuench icon on the MS Windows desktop starts the software and the ivf SmartQuench desktop will open up, see Figure 3.1.
Fig. 3.1 The ivf SmartQuench desktop at start-up for the first time.
Initial settings: Registration and temperature dimension
When starting for the first time, the Title bar will read “Unregistered version, please register”. Choose “File|Registration” to register your software. Enter the company name and a registration number (any number, or none, can be used in the current version) and click OK. The Title bar will now show the company name.
If the measurements with the hand unit have been done by using Fahrenheit degrees, choose “File|Temperature unit” and then click Fahrenheit.
3.5 Database NOTE that in the following description, the data files (cooling curves) contained in the installation disc have been used to illustrate the functions.
The database consists of Curve data, Control limit data, Probe data, and Formula data. Each group of data is stored in one or several folders. Continue by maximizing the Database window and you will see the “Curve data” folder.
3.5.1 Curve data
The Curve database consists of:
• General data, which must be entered by the user, except for the default values, which come with the curves. See Figure 3.2.
• Calculated data, a number of characteristics, which are calculated automatically. See Figure 3.3.

User’s Manual, 1 st ed., Nov. 2009 ivf SmartQuench® , ver. 3.1
L:\UPPDRAGSPROJEKT\SMARTQUENCH\ADMINISTRATION\MANUALER\SMARTQUENCH\ENGLISH\VER 2.3, ED 1 SQ2MAN-ENG-VER2-3_ED 1 100111 FÖR TRYCK.DOC-01/JB
2009-11-05
24
• Compare curves, which is a window where some selected characteristics are compared in table form. See Figure 3.4.
• Reference data, which are intended for reference media, such as Swerea IVF’s reference oil or other references the user may wish to employ. See Figure 3.5.
Fig. 3.2 General data that can be entered by the user for each cooling curve.
Fig. 3.3 Characteristic data that are calculated automatically for each curve.

User’s Manual, 1 st ed., Nov. 2009 ivf SmartQuench® , ver. 3.1
L:\UPPDRAGSPROJEKT\SMARTQUENCH\ADMINISTRATION\MANUALER\SMARTQUENCH\ENGLISH\VER 2.3, ED 1 SQ2MAN-ENG-VER2-3_ED 1 100111 FÖR TRYCK.DOC-01/JB
2009-11-05
25
Fig. 3.4 Comparing the calculated data for the curves in one folder in the “Compare
curves” window.
Fig. 3.5 Data that can be entered for a reference medium related to each quenchant.
The calculated data are as follows:
CRmax: Maximum cooling rate
T(CRmax): The temperature at which the maximum cooling rate occurs
t(CRmax): The time to reach the maximum cooling rate
Tvp: The temperature for transition from vapour phase to boiling phase
Tcp: The temperature for transition from boiling phase to convection phase
Theta 1: The temperature for transition from vapour phase to boiling phase, as determined by the procedure stated in the French standard NFT 60178
Theta 2: The temperature for transition from boiling phase to convection phase, as determined by the procedure stated in the French standard NFT 60178
CR300: Cooling rate at 300 °C
CR550: Cooling rate at 550 °C
Time600: Time to reach 600 °C
Time400: Time to reach 400 °C

User’s Manual, 1 st ed., Nov. 2009 ivf SmartQuench® , ver. 3.1
L:\UPPDRAGSPROJEKT\SMARTQUENCH\ADMINISTRATION\MANUALER\SMARTQUENCH\ENGLISH\VER 2.3, ED 1 SQ2MAN-ENG-VER2-3_ED 1 100111 FÖR TRYCK.DOC-01/JB
2009-11-05
26
Time200: Time to reach 200 °C
HP-IVF (oils): 91.5 + 1.34 · Tvp + 10.88 · CR550a – 3.85 · Tcp (intended for unalloyed steels) a550 °C is the assumed temperature for the ferrite/perlite nose in the CCT diagram, which must be prevented during the cooling
HP-IVF (polymers): 3.54 · CR550 + 12.3 · CR325b – 168 (intended for unalloyed steels) b325 °C is the assumed temperature for starting the phase transformation to martensite during hardening
NOTE that the HP values (Hardening Power) are characteristics developed by Swerea IVF in its research work1. They are intended to enhance the evaluation of cooling media’s ability to harden certain steel types. The HP values are calculated from some selected characteristics under “calculated data”, and the cooling rate at 325 °C. This can also be calculated by the Formula editor, see Section 3.5.4.
NOTE that both HP values are calculated automatically for any type of quenchant: oils, polymers or any other type. Also note that the HP-IVF (oils) values are relevant for oils only and the HP-IVF (polymers) values are relevant for polymers only.
3.5.2 Control limit data
The intention of this option is to enhance quality control by specifying certain limits regarding different cooling characteristics that should not be passed in order to safeguard the process and produce products within specifications.
NOTE that it is up to the user to define the control limits, which should be based on his/her own experience and applicable to his applications.
For heat treaters, characteristics such as component type and size, steel grade, furnace and quench tank may vary and may require different levels. Suppliers of quenching media have certain allowed limits for certain cooling characteristics of their products etc.
The software has the ability to store several, individual control limits for each characteristic; for example, the maximum cooling rate for a certain type of component processed in a certain furnace/quench tank. Figure 3.6 illustrates the definition of maximum and minimum limits for one such characteristic, the maximum cooling rate.
1 Segerberg, S: Classification of quench oils: a method of comparison. Heat Treating, XX(12): 30-33 (1988).

User’s Manual, 1 st ed., Nov. 2009 ivf SmartQuench® , ver. 3.1
L:\UPPDRAGSPROJEKT\SMARTQUENCH\ADMINISTRATION\MANUALER\SMARTQUENCH\ENGLISH\VER 2.3, ED 1 SQ2MAN-ENG-VER2-3_ED 1 100111 FÖR TRYCK.DOC-01/JB
2009-11-05
27
Fig. 3.6 Defining minimum and maximum levels for the chosen characteristic.
3.5.3 Probe data
Data regarding the test probes, such as dimensions, material surface condition and k-factor, and a comment, such as date of last calibration and any observation, can be entered in the Probe database. See Figure 3.7.
Fig. 3.7 Data that can be entered for test probes.
3.5.4 Formula data
The formula editor allows evaluation of cooling characteristics from many viewpoints. This option is primarily intended to enable the user to apply his/her own experience and to find correlations between cooling characteristics and the results of hardening. One example is the Hardening Power as described on the previous page (see Figure 3.8).
NOTE that Swerea IVF is interested in an exchange with companies interested in applying and developing this option. A User Group may be created to promote exchange between interested parties.

User’s Manual, 1 st ed., Nov. 2009 ivf SmartQuench® , ver. 3.1
L:\UPPDRAGSPROJEKT\SMARTQUENCH\ADMINISTRATION\MANUALER\SMARTQUENCH\ENGLISH\VER 2.3, ED 1 SQ2MAN-ENG-VER2-3_ED 1 100111 FÖR TRYCK.DOC-01/JB
2009-11-05
28
Fig. 3.8 Example of employing the formula data function: in this case the HP value
(Hardening Power) for oils.
3.6 Evaluation Choose “Evaluation|Monitoring” to open the evaluation window, see Figure 3.9.
Fig 3.9 When opening the evaluation-monitoring window, it is empty until the curves to
be evaluated have been selected.

User’s Manual, 1 st ed., Nov. 2009 ivf SmartQuench® , ver. 3.1
L:\UPPDRAGSPROJEKT\SMARTQUENCH\ADMINISTRATION\MANUALER\SMARTQUENCH\ENGLISH\VER 2.3, ED 1 SQ2MAN-ENG-VER2-3_ED 1 100111 FÖR TRYCK.DOC-01/JB
2009-11-05
29
3.6.1 Selecting cooling curves to evaluate
Choose “Curve selection” to open the window in Figure 3.10. Click the folder where the curve to be evaluated has been stored. Click the curve and press “OK”. Repeat until all curves to be selected have been chosen. If all curves in the folder are to be evaluated, simply choose “Select all” and click “OK”.
Fig. 3.10 Window for curve selection.
After having selected all curves in the dialogue in Figure 3.10, a window as in Figure 3.11 will appear.
Fig. 3.11 Window after having selected the curves to evaluate.
The curve colours are chosen automatically but can be changed as desired, as can the line style. This is done by clicking “Properties”, see next Section.

User’s Manual, 1 st ed., Nov. 2009 ivf SmartQuench® , ver. 3.1
L:\UPPDRAGSPROJEKT\SMARTQUENCH\ADMINISTRATION\MANUALER\SMARTQUENCH\ENGLISH\VER 2.3, ED 1 SQ2MAN-ENG-VER2-3_ED 1 100111 FÖR TRYCK.DOC-01/JB
2009-11-05
30
Zooming the cooling curve
There is a zooming function in the cooling curve diagram by which you can enlarge parts of the diagram for a more detailed analysis. Position the pointer at the upper left of the area you want to enlarge. Press the left mouse button and move the pointer downwards to the right and let the button go. See example in Figure 3.12.
Fig. 3.12 Enlarged part of the cooling curve diagram.
Return to the original diagram size by reversing the movement with the pointer or by choosing “Chart|Zoom out”.
3.6.2 Selecting curve properties
Click the curve, where the curve properties are to be changed and then click “Properties”. A window as in Figure 3.13 opens up. Click the “Curve color” box to open up a window for selecting colours. Choose colour and click “OK” to go back. Repeat for any other curve that should be changed.
If the line style for the selected curve is to be changed, click the drop-down arrow and select style. There are four line styles to choose from: solid, dotted (‘dot’), dashed (‘dash’) and dashed-dotted (‘dash-dot’).
You can also choose (under “Visible”) if both the time vs. temperature, T(t), and the cooling rate vs. temperature, CR(T), curves are to be displayed, or only one of them. Click “OK” to go back.
Fig. 3.13 Window for selecting curve colour and line style.

User’s Manual, 1 st ed., Nov. 2009 ivf SmartQuench® , ver. 3.1
L:\UPPDRAGSPROJEKT\SMARTQUENCH\ADMINISTRATION\MANUALER\SMARTQUENCH\ENGLISH\VER 2.3, ED 1 SQ2MAN-ENG-VER2-3_ED 1 100111 FÖR TRYCK.DOC-01/JB
2009-11-05
31
3.6.3 Sorting the selected curves
There is an option to sort the selected curves in the “Curves selected” list. Click “Sort” and choose the category: name, date or the chosen property. Figure 3.14 shows selection of the cooling rate.
Fig. 3.14 The curves can be sorted by name or by date or by the characteristic displayed:
in this case, the cooling rate.
3.6.4 Query for optimised selection of curves
This option is intended to be used for selecting cooling curves from the whole database (all folders) that fulfil certain criteria. You can choose from all “General” and “Calculated” data” and from data calculated by user-defined formulae, see Figure 3.15.
Fig. 3.15 Window for selecting character-istics and their minimum and maximum values in the query dialogue.

User’s Manual, 1 st ed., Nov. 2009 ivf SmartQuench® , ver. 3.1
L:\UPPDRAGSPROJEKT\SMARTQUENCH\ADMINISTRATION\MANUALER\SMARTQUENCH\ENGLISH\VER 2.3, ED 1 SQ2MAN-ENG-VER2-3_ED 1 100111 FÖR TRYCK.DOC-01/JB
2009-11-05
32
After having made such a query, you can go back and make a new query, for example if there were no (or too many) curves that fulfilled the requirements. By clicking “Previously selected”, you will transfer the curves that were selected in the previous query to the new query.
3.6.5 Selecting characteristic for evaluation
For evaluation, you must choose one, and only one, characteristic from the databases. This can be either from the “General” or “Calculated” data, or from the “Formula”: see Figures 3.16 to 3.18. Click one of these three categories and choose one characteristic. Finish by clicking “OK”.
Fig. 3.16 Window for selecting “general data”.
Fig. 3.17 Window for selecting “calculated data”.

User’s Manual, 1 st ed., Nov. 2009 ivf SmartQuench® , ver. 3.1
L:\UPPDRAGSPROJEKT\SMARTQUENCH\ADMINISTRATION\MANUALER\SMARTQUENCH\ENGLISH\VER 2.3, ED 1 SQ2MAN-ENG-VER2-3_ED 1 100111 FÖR TRYCK.DOC-01/JB
2009-11-05
33
Fig. 3.18 Window for selecting “formula data”.
3.6.6 Selecting control limits for evaluation
When the characteristic for evaluation has been chosen as above, the control limits for this characteristic must be selected, see Figure 3.19. Only one of the previously defined control limits can be chosen. Click “OK”.
Fig. 3.19 Window for selecting control limits.

User’s Manual, 1 st ed., Nov. 2009 ivf SmartQuench® , ver. 3.1
L:\UPPDRAGSPROJEKT\SMARTQUENCH\ADMINISTRATION\MANUALER\SMARTQUENCH\ENGLISH\VER 2.3, ED 1 SQ2MAN-ENG-VER2-3_ED 1 100111 FÖR TRYCK.DOC-01/JB
2009-11-05
34
3.6.7 Evaluation
When the characteristic to be evaluated and its control limits have been chosen, click “Evaluate” and the bar chart diagram to the right in Figure 3.20 will appear.
Fig. 3.20 Evaluation diagram (right) showing the cooling rate and the minimum and
maximum levels chosen.
3.7 Copying diagrams and printing reports
3.7.1 Diagram set-up
Before copying diagrams and printing reports, diagram axis, curve colours and legend position are chosen in the diagram set-up dialogue.
Click “Chart” and choose “Calibrate” to open the window in Figure 3.21. Then, for the axis, choose either from the predefined values or enter an exact range. You can also choose the “automatic” scaling option. Fig. 3.21 Window for selecting the diagram axis.

User’s Manual, 1 st ed., Nov. 2009 ivf SmartQuench® , ver. 3.1
L:\UPPDRAGSPROJEKT\SMARTQUENCH\ADMINISTRATION\MANUALER\SMARTQUENCH\ENGLISH\VER 2.3, ED 1 SQ2MAN-ENG-VER2-3_ED 1 100111 FÖR TRYCK.DOC-01/JB
2009-11-05
35
Click the “Style” folder to open the window in Figure 3.22. Click “Background|Colour” to change the background colour.
Under “Legend style”, choose “Visible” to make the curve legend visible in the cooling curve diagram.
By choosing “Resize chart”, the legend will be positioned outside the diagram. (If the “Visible” box is not marked, the diagram will always have the same size, regard-less of the length of the file names.)
Under “Alignment, choose “Top”, “Below”, “Right” or “Left” to position the legend above, below, to the right or to the left of the diagram.
Click “Background colour” to change the background colour.
Fig. 3.22. Window for selecting the diagram style.
3.7.2 Copying diagrams
Click “Copy” and choose either “Curve diagram” or “Evaluation diagram” (see Figure 3.23) to copy the diagram(s) to MS Windows clipboard. From this, the diagram(s) can be pasted into reports in, for example, Word format, see Figures 3.24 and 3.25.
Fig. 3.23 Window for selecting the type of diagram to copy.
Type of diagram

User’s Manual, 1 st ed., Nov. 2009 ivf SmartQuench® , ver. 3.1
L:\UPPDRAGSPROJEKT\SMARTQUENCH\ADMINISTRATION\MANUALER\SMARTQUENCH\ENGLISH\VER 2.3, ED 1 SQ2MAN-ENG-VER2-3_ED 1 100111 FÖR TRYCK.DOC-01/JB
2009-11-05
36
Fig. 3.24 Diagram copied to the Windows clipboard and pasted into this manual.
Fig. 3.25 Evaluation diagram copied to the Windows clipboard and pasted into this manual.

User’s Manual, 1 st ed., Nov. 2009 ivf SmartQuench® , ver. 3.1
L:\UPPDRAGSPROJEKT\SMARTQUENCH\ADMINISTRATION\MANUALER\SMARTQUENCH\ENGLISH\VER 2.3, ED 1 SQ2MAN-ENG-VER2-3_ED 1 100111 FÖR TRYCK.DOC-01/JB
2009-11-05
37
3.7.3 Print set-up
Click “Print” to open the print set-up window, see Figure 3.26. Enter information to be included in the report. Choose report type: either “Compare and evaluate” report or “Standard” report. If “Compare and evaluate” has been chosen, choose either “Compare report” or “Evaluation report”, or both. Click “OK” to print the report.
Fig. 3.26 Window for entering report data and selecting type of report.
If “Standard report” is selected, you must first choose the “Reference curve”, click “OK” and then the “Product curve” and click “OK”, see Figure 3.27. Click “OK” to print the report. This report type is intended e.g. for calibration of test probes where it is important to keep traceability to a reference.
Step 1: Choosing the “Reference curve”.
Step 2: Choosing the “Product curve”.
Figure 3.27 Selecting curves for the “Standard report”.

User’s Manual, 1 st ed., Nov. 2009 ivf SmartQuench® , ver. 3.1
L:\UPPDRAGSPROJEKT\SMARTQUENCH\ADMINISTRATION\MANUALER\SMARTQUENCH\ENGLISH\VER 2.3, ED 1 SQ2MAN-ENG-VER2-3_ED 1 100111 FÖR TRYCK.DOC-01/JB
2009-11-05
38
NOTE that the cooling curve diagram and the evaluation diagram will be printed on two different pages.
NOTE that only six curves can be printed in one curve diagram. If more than six curves have been chosen, they will be printed on two or more pages.
3.7.4 Saving a report
The reports are normally not saved after printing. If there is a need to save the reports, this can be done by means of the software ‘Acrobat PDFWriter’ from Adobe Systems, Inc. or e.g. the free ‘PrimoPDF’ from active PDF, Inc. Then, when choosing this option in the “Print” window, the report is saved as a pdf-file, see Figure 3.28.
Fig. 3.28 Choosing Acrobat PDFWriter as a printer in the Print dialogue saves the report in pdf-format.
3.7.5 Printed reports
The “Compare report” and the “Standard report” for the selected cooling curves and characteristics are shown in the following three pages.

User’s Manual, 1 ed., Nov. 2009 ivf SmartQuench® , ver. 3.1
L:\UPPDRAGSPROJEKT\SMARTQUENCH\ADMINISTRATION\MANUALER\SMARTQUENCH\ENGLISH\VER 2.3, ED 1 SQ2MAN-ENG-VER2-3_ED 1 100111 FÖR TRYCK.DOC-01/JB
2009-11-05
39

User’s Manual, 1 ed., Nov. 2009 ivf SmartQuench® , ver. 3.1
L:\UPPDRAGSPROJEKT\SMARTQUENCH\ADMINISTRATION\MANUALER\SMARTQUENCH\ENGLISH\VER 2.3, ED 1 SQ2MAN-ENG-VER2-3_ED 1 100111 FÖR TRYCK.DOC-01/JB
2009-11-05
40

User’s Manual, 1 ed., Nov. 2009 ivf SmartQuench® , ver. 3.1
L:\UPPDRAGSPROJEKT\SMARTQUENCH\ADMINISTRATION\MANUALER\SMARTQUENCH\ENGLISH\VER 2.3, ED 1 SQ2MAN-ENG-VER2-3_ED 1 100111 FÖR TRYCK.DOC-01/JB
2009-11-05
41

User’s Manual, 1 ed., Nov. 2009 ivf SmartQuench® , ver. 3.1
L:\UPPDRAGSPROJEKT\SMARTQUENCH\ADMINISTRATION\MANUALER\SMARTQUENCH\ENGLISH\VER 2.3, ED 1 SQ2MAN-ENG-VER2-3_ED 1 100111 FÖR TRYCK.DOC-01/JB
2009-11-05
42
4 Test procedure
4.1 Preparations
4.1.1 Heating the furnace
• Connect the furnace to the main power supply.
WARNING: For safety reasons make sure that the furnace is grounded correctly. Failure of, or insufficient, grounding may be dangerous.
• Turn on the furnace by means of the switch on it, which should cause the red indicating lamp to light.
The green lamp indicates when heating is on. Heating time of the empty furnace is about 15 minutes. However, when heating up the furnace from cold, the temperature will first pass the normal operating temperature and reach about 900 oC before the temperature stabilises at around 870 oC, see Section 2.3.1 and Figure 2.7. This will take about one hour.
NB. Do not heat the test probe until the furnace has reached its normal operating temperature.
4.1.2 Preparing the test probe
Probe preparation can either be done by cleaning the probe surface with emery paper before each test or by conditioning the probe by making at least six dummy tests, see Section 2.2.3. If conditioning is used, make sure that probe surface is free from residual traces of quenchant and that its oxide coating is uniform and free from loose scale. If not, clean the probe as described in Section 4.3.
4.1.3 Preparing the quenchant sample to be tested
The sample container (beaker) must be clean and dry. Make sure that the test sample is representative of the fluid to be tested. Pour the sample into the beaker, see Figure 2.10 for the fluid level, and bring it up to the test temperature. Agitate the sample during heating and remove the stirrer prior to start of test.
4.1.4 Preparing the hand unit
Make sure that your batteries are charged sufficiently. Connect the hand unit to the test probe with the cable that came with your equipment. The hand unit itself is too heavy to mount direct on the probe *. Press the Enter button to activate the hand unit. You will return to the menu were it was when deactivated.
(*warranty for hand unit and probes is only valid if the cable between hand unit and probe is used as instructed)

User’s Manual, 1 ed., Nov. 2009 ivf SmartQuench® , ver. 3.1
L:\UPPDRAGSPROJEKT\SMARTQUENCH\ADMINISTRATION\MANUALER\SMARTQUENCH\ENGLISH\VER 2.3, ED 1 SQ2MAN-ENG-VER2-3_ED 1 100111 FÖR TRYCK.DOC-01/JB
2009-11-05
43
4.2 Measurement
4.2.1 Preparations
Highlight the headline and use the Right or Left button to access the Settings view.
If you want to start a new measurement with the same settings as before just move down one step to Start Mode with the button Down. The line Start Mode now gets highlighted. Press Enter once. Now Off gets highlighted. If you press Enter again you confirm Off and the marker gets back and highlights Start Mode. If you instead press Up or Down you get to Start Mode Automatic or Start Mode Manual. Confirm your choice of start mode with Enter.
4.2.2 Start measurement
When choosing either Manual or Automatic Start Mode the measurement window appears.
Manual Start Automatic Start
For Start Mode Manual you press Enter at the time you want to start the measurement.
For Start Mode Automatic you have to heat the probe to at least three degrees Celsius over the Start Temperature setting, and then pass it from above to start the measurement. If you press Enter you cancel the measurement.
Fig. 4.1 Hand unit display when ready for measurement start
NOTE (for customers familiar with the previous ivf SmartQuench hand unit model) The SQ2 version of the hand unit does not at this time support the functions, “Start measurement” (from PC) and “Store in unit”. It has to be done from the hand unit.
4.2.3 Heating the test probe
Lower the probe into the furnace so that it rests on the bottom. Heating time to raise the probe to 855 oC is about 7 minutes, if the furnace is already at the normal operating temperature (~870 °C). The probe temperature is indicated on the hand unit while the probe is heating up.

User’s Manual, 1 ed., Nov. 2009 ivf SmartQuench® , ver. 3.1
L:\UPPDRAGSPROJEKT\SMARTQUENCH\ADMINISTRATION\MANUALER\SMARTQUENCH\ENGLISH\VER 2.3, ED 1 SQ2MAN-ENG-VER2-3_ED 1 100111 FÖR TRYCK.DOC-01/JB
2009-11-05
44
NOTE that it is recommended to heat the probe to about 855 °C when the starting temperature (set point) is 850 °C.
NOTE When testing oils, international standards specify a measuring time of 60 seconds. For polymers, 20 seconds can also be used, although 60 seconds is common as well.
When testing fast polymers, such as PAG in concentrations used in induction quenching, 20 seconds is recommended. However the following notes should also be considered.
1. If fast polymers have been tested earlier with a measuring time of 60 seconds this measuring should be kept for allowing direct comparison with earlier measurements.
2. Some fast polymers have a tendency of a double nose appearance for the CRmax, see fig 4.2. If the preprogrammed parameter TCRmax is used as an evaluation criteria it is important to also study the appearance of the CR-curve if the TCRmax is deviating from normal values.
3. It is important to always be consequent for the same type of quenchants when setting the measuring time if good comparison from earlier measurements are to be made.
Fig 4.2 Picture showing double noses
When the probe has reached the heating temperature, about 855 oC, if the Start Temperature is set to 850 °C, start the measurement by pressing Enter and move the probe from the furnace and immerse it into the quenchant to be tested (Start Mode Manual). If Start Mode Automatic is used just move the probe from the furnace and immerse it into the quenchant. This must be done as a fast movement without letting the probe cool down more than absolutely necessary.
NOTE that the reason for selecting a heating temperature higher than 850 oC, which is standardised internationally, is that the probe must be moved from the furnace to the quenchant sample to be tested. The excess temperature is to guarantee that the test probe will be at 850 oC at least, when it is immersed into the quenchant.
NOTE that the instrument does not start to record the temperature/time process until the temperature of the test probe has dropped to the set Start Temperature, normally 850 oC, as shown in curve A in Figure 4.3 (if set in the Automatic start mode). This is to ensure that all temperature/time curves start at the same temperature, even though the initial temperature of the test probe may vary a little. This facilitates comparison between different temperature/time curves. If recording starts at the time the Enter button is pressed (as in the Manual mode), the
User’s Manual, 1 ed., Nov. 2009 ivf SmartQuench® , ver. 3.1
L:\UPPDRAGSPROJEKT\SMARTQUENCH\ADMINISTRATION\MANUALER\SMARTQUENCH\ENGLISH\VER 2.3, ED 1 SQ2MAN-ENG-VER2-3_ED 1 100111 FÖR TRYCK.DOC-01/JB
2009-11-05
45
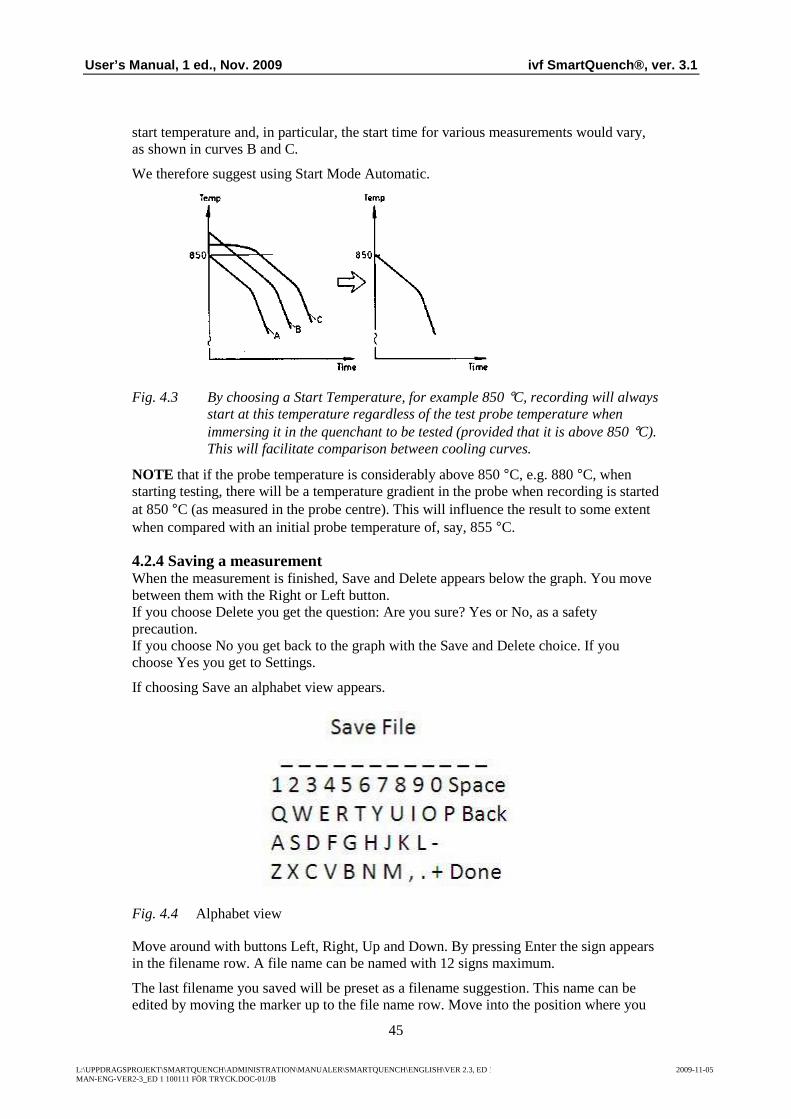
start temperature and, in particular, the start time for various measurements would vary, as shown in curves B and C.
We therefore suggest using Start Mode Automatic.
Fig. 4.3 By choosing a Start Temperature, for example 850 °C, recording will always start at this temperature regardless of the test probe temperature when immersing it in the quenchant to be tested (provided that it is above 850 °C). This will facilitate comparison between cooling curves.
NOTE that if the probe temperature is considerably above 850 °C, e.g. 880 °C, when starting testing, there will be a temperature gradient in the probe when recording is started at 850 °C (as measured in the probe centre). This will influence the result to some extent when compared with an initial probe temperature of, say, 855 °C.
4.2.4 Saving a measurement When the measurement is finished, Save and Delete appears below the graph. You move between them with the Right or Left button. If you choose Delete you get the question: Are you sure? Yes or No, as a safety precaution. If you choose No you get back to the graph with the Save and Delete choice. If you choose Yes you get to Settings.
If choosing Save an alphabet view appears.
Fig. 4.4 Alphabet view
Move around with buttons Left, Right, Up and Down. By pressing Enter the sign appears in the filename row. A file name can be named with 12 signs maximum.
The last filename you saved will be preset as a filename suggestion. This name can be edited by moving the marker up to the file name row. Move into the position where you

User’s Manual, 1 ed., Nov. 2009 ivf SmartQuench® , ver. 3.1
L:\UPPDRAGSPROJEKT\SMARTQUENCH\ADMINISTRATION\MANUALER\SMARTQUENCH\ENGLISH\VER 2.3, ED 1 SQ2MAN-ENG-VER2-3_ED 1 100111 FÖR TRYCK.DOC-01/JB
2009-11-05
46
want to add/remove signs, go down again to the signs and confirm your choices with Enter.
NOTE A filename can have 12 signs maximum. If editing a name the marker needs one of the 12 available spaces. This gives that if the name already has 12 signs you first need to remove the last sign by pressing Back before you can edit the name.
4.3 Cleaning the test probe after measurement In order to ensure reliable and consistently reproducible results, and to ensure correct operation of the test probe over a longer period of use, it must be carefully cleaned after each test.
After use in quenching oils, clean the probe in white spirit and dry it with a clean cloth. After use in polymer quenchants, the probe may be washed in water.
4.4 Removing the cable from test probe and from the hand unit Remove the cable from test probe or hand unit by pulling the outer, movable sleeve of the socket downwards. Separate hand unit from cable, or test probe from cable simultaneously, see Figure 4.5.
Fig. 4.5 Removing the test probe from the cable is done as follows: 1. Pull the outer, movable sleeve of the probe socket downwards with your left hand and keep it there. 2. Remove the cable with your right hand.
Fig. 4.6 Removing the cable from the hand unit is done as follows: 1. Pull the outer, movable sleeve of the cable socket away from the hand unit with your right hand. Then pull the cable by its connection until it disconnects from the hand unit.
1
2
1-2

User’s Manual, 1 ed., Nov. 2009 ivf SmartQuench® , ver. 3.1
L:\UPPDRAGSPROJEKT\SMARTQUENCH\ADMINISTRATION\MANUALER\SMARTQUENCH\ENGLISH\VER 2.3, ED 1 SQ2MAN-ENG-VER2-3_ED 1 100111 FÖR TRYCK.DOC-01/JB
2009-11-05
47
5 Data transmission NOTE that the following pictures are made when using Windows XP. If using a different operative system pictures may vary.
5.1 Preparations NOTE that you must have your hand unit turned on for data transmission. If not, this message will appear.
Fig. 5.1 First window that opens up when pressing hand unit in the ivf SmartQuench software.
Followed by an empty communication window.
Fig. 5.2 Hand unit communication window
Make sure you have connected the needed parts before you press Hand unit in the ivf SmartQuench software. Use either the USB cable or the Bluetooth adapter and make sure that you have established connection between your hand unit and the Bluetooth adapter if using this option.
No transmission type available.

User’s Manual, 1 ed., Nov. 2009 ivf SmartQuench® , ver. 3.1
L:\UPPDRAGSPROJEKT\SMARTQUENCH\ADMINISTRATION\MANUALER\SMARTQUENCH\ENGLISH\VER 2.3, ED 1 SQ2MAN-ENG-VER2-3_ED 1 100111 FÖR TRYCK.DOC-01/JB
2009-11-05
48
5.2 Data transmission alternatives
5.2.1 Bluetooth data transmission
Install the software for the Bluetooth adapter that came with your equipment.
See Appendix 1 for instructions.
Activate your hand unit by pressing Enter.
Press Hand Unit in your ivf SmartQuench software to open the hand unit communication window. If only using Bluetooth you get this message.
Fig. 5.3 First window that opens up when pressing hand unit in the ivf SmartQuench software
After confirming with OK this communication window opens:
Fig. 5.4 Hand unit communication window
Up to the right you can see that you are connected with Bluetooth. Press Get file names to see which curves the hand unit has stored. This information appears in the left window.

User’s Manual, 1 ed., Nov. 2009 ivf SmartQuench® , ver. 3.1
L:\UPPDRAGSPROJEKT\SMARTQUENCH\ADMINISTRATION\MANUALER\SMARTQUENCH\ENGLISH\VER 2.3, ED 1 SQ2MAN-ENG-VER2-3_ED 1 100111 FÖR TRYCK.DOC-01/JB
2009-11-05
49
Fig. 5.5 Hand unit communication window
Now choose Target folder with the Browse button. Then choose Add all if you want to save all curves into the chosen Target folder or mark any specific curve and press Add if you only want to save some curves on your PC. Not until you press Save files to PC the files are actually saved in the computer.
The curves are still available in the hand unit. If you which to delete them you have to do it manually in the Files view in the hand unit.
While the curves are transferred to the PC the hand unit display shows
Transferring files, Please wait.
5.2.2 Data transmission by wire
Connect your hand unit to the PC with the USB cable that came with your equipment. When pressing the Hand unit button in the ivf SmartQuench software you get this message if you only have USB connection:
Fig. 5.6 First window that opens up when pressing hand unit in the ivf SmartQuench software
After confirming with OK this communication window opens:

User’s Manual, 1 ed., Nov. 2009 ivf SmartQuench® , ver. 3.1
L:\UPPDRAGSPROJEKT\SMARTQUENCH\ADMINISTRATION\MANUALER\SMARTQUENCH\ENGLISH\VER 2.3, ED 1 SQ2MAN-ENG-VER2-3_ED 1 100111 FÖR TRYCK.DOC-01/JB
2009-11-05
50
Fig. 5.7 Hand unit communication window
Up to the right you can see that you are connected with USB.
Press Get file names to see which curves the hand unit has stored. This information appears in the left window.
Fig. 5.8 Hand unit communication window
Now choose Target folder with the Browse button.
Then choose Add all if you want to save all curves into the chosen target folder or mark any specific curve and press Add if you only want to save some curves on your PC. Not until you press Save files to PC the files are actually saved in the computer.
The curves are still available in the hand unit. If you which to delete them you have to do it in the Files view in the hand unit.
User’s Manual, 1 ed., Nov. 2009 ivf SmartQuench® , ver. 3.1
L:\UPPDRAGSPROJEKT\SMARTQUENCH\ADMINISTRATION\MANUALER\SMARTQUENCH\ENGLISH\VER 2.3, ED 1 SQ2MAN-ENG-VER2-3_ED 1 100111 FÖR TRYCK.DOC-01/JB
2009-11-05
51
While the curves are transferred to the PC the hand unit display shows Transferring files, Please wait.
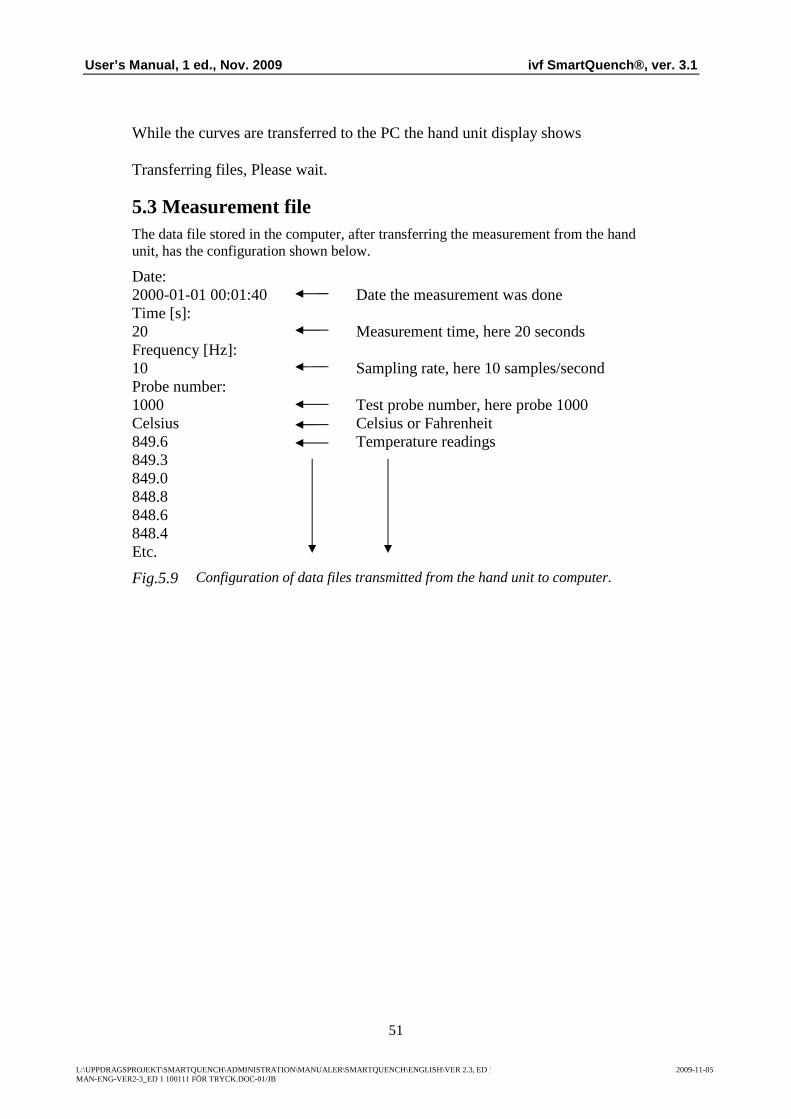
5.3 Measurement file The data file stored in the computer, after transferring the measurement from the hand unit, has the configuration shown below.
Date: 2000-01-01 00:01:40 Date the measurement was done Time [s]: 20 Measurement time, here 20 seconds Frequency [Hz]: 10 Sampling rate, here 10 samples/second Probe number: 1000 Test probe number, here probe 1000 Celsius Celsius or Fahrenheit 849.6 Temperature readings 849.3 849.0 848.8 848.6 848.4 Etc.
Fig.5.9 Configuration of data files transmitted from the hand unit to computer.
User’s Manual, 1 ed., Nov. 2009 ivf SmartQuench® , ver. 3.1
L:\UPPDRAGSPROJEKT\SMARTQUENCH\ADMINISTRATION\MANUALER\SMARTQUENCH\ENGLISH\VER 2.3, ED 1 SQ2MAN-ENG-VER2-3_ED 1 100111 FÖR TRYCK.DOC-01/JB
2009-11-05
52
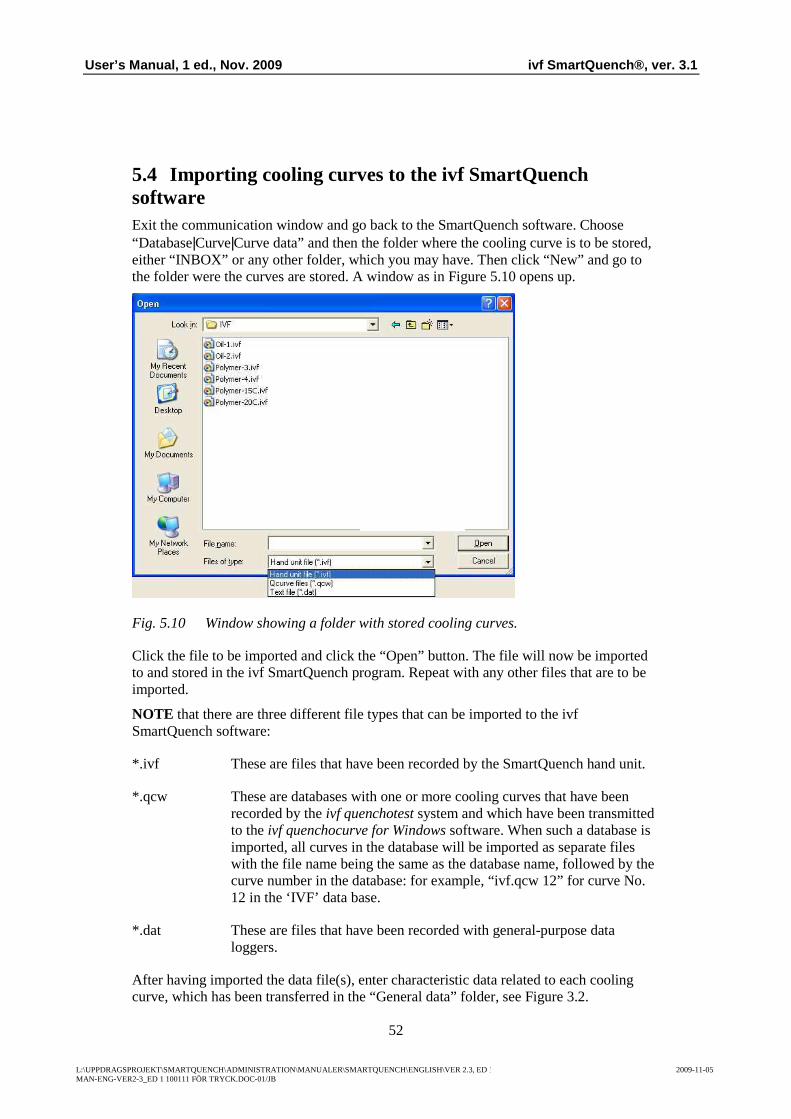
5.4 Importing cooling curves to the ivf SmartQuench software Exit the communication window and go back to the SmartQuench software. Choose “Database|Curve|Curve data” and then the folder where the cooling curve is to be stored, either “INBOX” or any other folder, which you may have. Then click “New” and go to the folder were the curves are stored. A window as in Figure 5.10 opens up.
Fig. 5.10 Window showing a folder with stored cooling curves.
Click the file to be imported and click the “Open” button. The file will now be imported to and stored in the ivf SmartQuench program. Repeat with any other files that are to be imported.
NOTE that there are three different file types that can be imported to the ivf SmartQuench software:
*.ivf These are files that have been recorded by the SmartQuench hand unit.
*.qcw These are databases with one or more cooling curves that have been recorded by the ivf quenchotest system and which have been transmitted to the ivf quenchocurve for Windows software. When such a database is imported, all curves in the database will be imported as separate files with the file name being the same as the database name, followed by the curve number in the database: for example, “ivf.qcw 12” for curve No. 12 in the ‘IVF’ data base.
*.dat These are files that have been recorded with general-purpose data loggers.
After having imported the data file(s), enter characteristic data related to each cooling curve, which has been transferred in the “General data” folder, see Figure 3.2.

User’s Manual, 1 ed., Nov. 2009 ivf SmartQuench® , ver. 3.1
L:\UPPDRAGSPROJEKT\SMARTQUENCH\ADMINISTRATION\MANUALER\SMARTQUENCH\ENGLISH\VER 2.3, ED 1 SQ2MAN-ENG-VER2-3_ED 1 100111 FÖR TRYCK.DOC-01/JB
2009-11-05
53
5.5 Exporting cooling curves from the ivf SmartQuench software Cooling curves that have been imported to the ivf SmartQuench software (and thereby have been transformed to a mathematical expression by Fourier transformation) can also be re-transformed (exported) to a data file for handling by other software, e.g. Excel. Go to “Curve data” and choose the curve to be exported. Click the “Export” button. A window as in Figure 5.11 opens up.
Fig.5.11 Window that opens up when ‘Export’ is clicked.
Choose for exportation either the selected curve only or all curves in the folder.
Choose the time step in the Output frequency according to your measurement. 10 Hz gives 0.1 seconds, 20 Hz gives 0.05 seconds etc, and then click “OK”. A window as in Figure 5.12 now opens up.
Fig. 5.12 Window for defining the file name and the folder for the exported data file.
Enter the file name and choose the folder where the data file is to be stored. Finish by clicking “Save”. The exported data file is now saved in the format ‘*.dat’ in the folder chosen.
NOTE that the exported data files will not be exactly the same as the initial data files, which were recorded by the hand unit. This is due to the fact that the initial data have been processed by Fourier transformation when the data file was imported to the ivf SmartQuench software. The difference will depend on the character of Fourier transformation and to some extent on the character of the cooling curves.

User’s Manual, 1 ed., Nov. 2009 ivf SmartQuench® , ver. 3.1
L:\UPPDRAGSPROJEKT\SMARTQUENCH\ADMINISTRATION\MANUALER\SMARTQUENCH\ENGLISH\VER 2.3, ED 1 SQ2MAN-ENG-VER2-3_ED 1 100111 FÖR TRYCK.DOC-01/JB
2009-11-05
54
6 Option: Agitation device
6.1 Introduction When testing water-based polymer quenchants, it is essential that the quenchant is agitated during testing in order to obtain consistent results and to make it possible to compare test results from different laboratories. The agitation device is designed in accordance with the American standard ASTM D 6482-06, and also in accordance with a draft specification for testing polymers, which is being prepared for the International Organization for Standards (ISO).
6.2 Characteristics
6.2.1 Design
The design and main dimensions are shown in Figure 6.1.
Fig. 6.1 Left: Dimensions (in accordance with the ASTM D 6482-06 standard). Right: Agitation device with motor controller.
NOTE that the centre of the test probe body shall be positioned at half the height of the test chamber. (30 mm above the probe tip)
The agitation device consists of:
• Transparent test chamber with a tubular opening (where the heated test probe is to be inserted)
• Electric motor with speed controller to maintain 1000 r/min as specified
• Standardised impeller (50 mm dia., 3 blades, 42 mm pitch setting)
Stop ring
=
=
Direction of flow
Impeller
Test probe
Ele
ctric
mot
or
User’s Manual, 1 ed., Nov. 2009 ivf SmartQuench® , ver. 3.1
L:\UPPDRAGSPROJEKT\SMARTQUENCH\ADMINISTRATION\MANUALER\SMARTQUENCH\ENGLISH\VER 2.3, ED 1 SQ2MAN-ENG-VER2-3_ED 1 100111 FÖR TRYCK.DOC-01/JB
2009-11-05
55
Main data, agitation device:
Dimensions*: 125 x 60 mm wide, 205 mm height Volume of fluid: 1.5 litres Max. temp. of fluid: 50 °C (120 °F) Weight: Material:
7.6 kg, including motor controller PVC
Power supply: I: 220/240 V, max. 5 A, 50/60 Hz II: 110/120 V, max. 5 A, 50/60 Hz Fuse: 5 A (ceramic)
*) Plastic material chamber
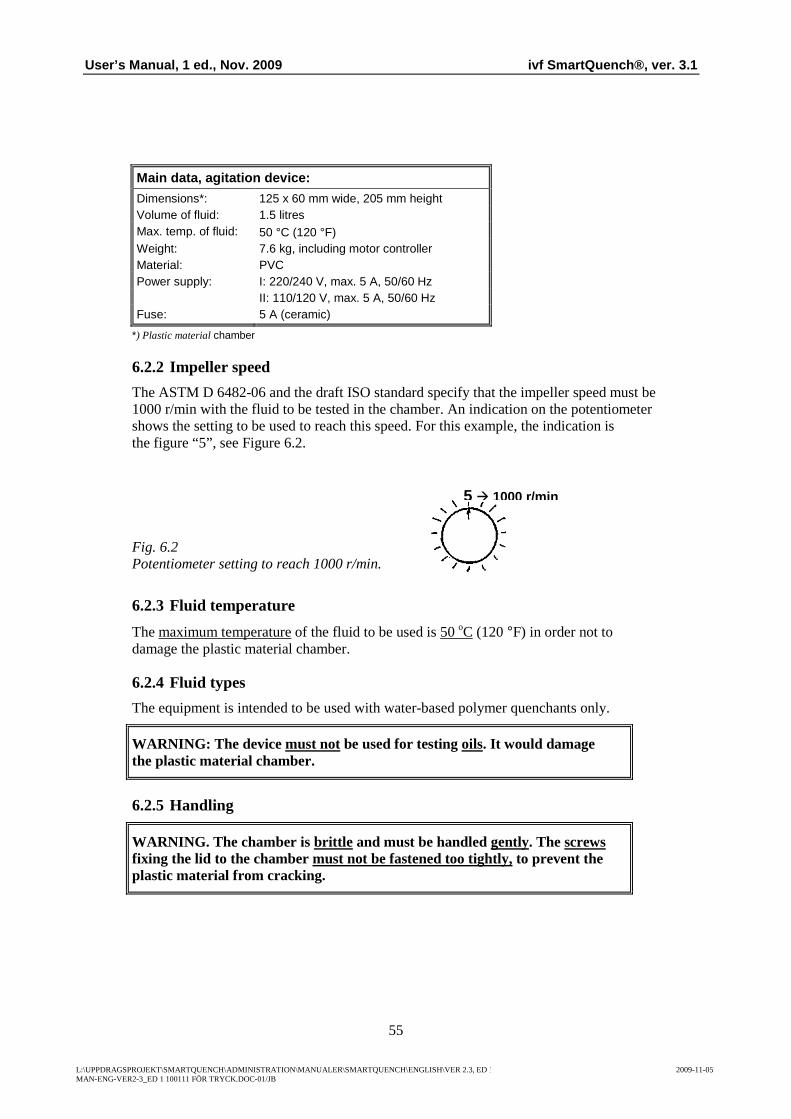
6.2.2 Impeller speed
The ASTM D 6482-06 and the draft ISO standard specify that the impeller speed must be 1000 r/min with the fluid to be tested in the chamber. An indication on the potentiometer shows the setting to be used to reach this speed. For this example, the indication is the figure “5”, see Figure 6.2.
Fig. 6.2 Potentiometer setting to reach 1000 r/min.
6.2.3 Fluid temperature
The maximum temperature of the fluid to be used is 50 oC (120 °F) in order not to damage the plastic material chamber.
6.2.4 Fluid types
The equipment is intended to be used with water-based polymer quenchants only.
WARNING: The device must not be used for testing oils. It would damage the plastic material chamber.
6.2.5 Handling
WARNING. The chamber is brittle and must be handled gently. The screws fixing the lid to the chamber must not be fastened too tightly, to prevent the plastic material from cracking.
5 1000 r/min 5 1000 r/min

User’s Manual, 1 ed., Nov. 2009 ivf SmartQuench® , ver. 3.1
L:\UPPDRAGSPROJEKT\SMARTQUENCH\ADMINISTRATION\MANUALER\SMARTQUENCH\ENGLISH\VER 2.3, ED 1 SQ2MAN-ENG-VER2-3_ED 1 100111 FÖR TRYCK.DOC-01/JB
2009-11-05
56
6.3 Preparations before testing
6.3.1 Removal of air
After having filled the chamber with the fluid to be tested, tilt to both sides to release any air, which may be trapped at the shaft packing box. If air is mixed with the fluid, the test result may be influenced.
6.3.2 Fluid level
The fluid should be level with the lower distance ring in the insert for positioning the test probe in the test chamber, see Figure 6.3.
Fig. 6.3 Fill the test chamber to the indicated level.
6.3.3 Positioning the test probe in the test chamber
Position the test probe body, see Figure 2.5, vertically as indicated in Figure 6.1 (left), i.e. at half the height of the test chamber. Use the stop ring to secure it.
6.4 Cleaning the test chamber after testing The quenching characteristics of polymer quenchants can be very sensitive as regards the polymer content and contaminants. The test chamber must therefore be cleaned from residual polymer after each series of tests in order to prevent any polymer residues from mixing with other polymers to be tested in the chamber.
Wash the container with clean water as follows. Fill it with water to the prescribed fluid level and run the motor with the impeller for one minute. Repeat this twice, i.e. three volumes of water.
If the container is not fully clean after this procedure, remove (unscrew) the upper part and clean the container with water and a cloth. After cleaning, refit the upper part.
WARNING: Make sure that the screws are not fastened too tightly, in order not to break the PVC threads.
Stop ring

User’s Manual, 1 ed., Nov. 2009 ivf SmartQuench® , ver. 3.1
L:\UPPDRAGSPROJEKT\SMARTQUENCH\ADMINISTRATION\MANUALER\SMARTQUENCH\ENGLISH\VER 2.3, ED 1 SQ2MAN-ENG-VER2-3_ED 1 100111 FÖR TRYCK.DOC-01/JB
2009-11-05
57
6.5 Calibration and routine checking There are two factors, which need to be considered: the impeller speed and the direction of flow of the quenching medium to be tested.
6.5.1 Calibration of the impeller speed
The speed (rpm) can be checked by means of an optical tachometer, illuminating and receiving light to and from a reflector fastened to the propeller shaft, see Figure 6.4. The equipment is supplied with the reflector. Tachometer instruments can be purchased from Swerea IVF or bought locally.
Fig. 6.4 Checking the impeller speed by means of an optical tachometer.
NOTE that the velocity of the fluid will depend to some extent on its viscosity if the impeller speed is kept constant. (This is also the case in industrial quench tanks.) However, the variation is very little. Swerea IVF has tested with fluids having a wide range of viscosities, from water and up to a polymer at 30 % concentration. The variation in speed is within 20 r/min at 1000 r/min. Although this is a very small variation, it can easily be adjusted by means of the tachometer measurement.
6.5.2 Checking the flow direction
The flow direction must be as shown in the left-hand figure in Figure 6.1. It is pre-set to be correct from the manufacturer. Due to local conditions, and if the plugs on the electric cable have to be changed to suit local standards, it is possible that the flow direction will be opposite to the specified direction. The direction can be checked visually when the agitation device is operating. There is no need for any specific device for testing this since the flow direction will be seen clearly.
IMPORTANT: If the flow direction is incorrect, it m ust be changed. This is done by changing the two wires to the electric motor.

User’s Manual, 1 ed., Nov. 2009 ivf SmartQuench® , ver. 3.1
L:\UPPDRAGSPROJEKT\SMARTQUENCH\ADMINISTRATION\MANUALER\SMARTQUENCH\ENGLISH\VER 2.3, ED 1 SQ2MAN-ENG-VER2-3_ED 1 100111 FÖR TRYCK.DOC-01/JB
2009-11-05
58
7 ivf SmartQuench Technical Support Technical support is available from Swerea IVF on weekdays during business hours (Central European Time) to answer any technical questions you may have about ivf SmartQuench.
SWEREA IVF AB PO Box 104, SE-431 22 MÖLNDAL
Visiting address: Argongatan 30, SE-431 53 MÖLNDAL SWEDEN
Tel: +46-31-706 60 00 Fax: +46-31-27 61 30
E-mail: [email protected] Website: http://www.ivfsmartquench.com
Contact person: Magnus Lövgren:
Tel: +46-31-706 61 98 (direct)
Help desk
By choosing Help | About in the menu bar, a window with contact information is opened, see below:

User’s Manual, 1 ed., Nov. 2009 ivf SmartQuench® , ver. 3.1
L:\UPPDRAGSPROJEKT\SMARTQUENCH\ADMINISTRATION\MANUALER\SMARTQUENCH\ENGLISH\VER 2.3, ED 1 SQ2MAN-ENG-VER2-3_ED 1 100111 FÖR TRYCK.DOC-01/JB
2009-11-05
59
8 Appendix 1 Bluetooth installation and start up procedure.
NOTE that pictures may vary due to different operative systems.
Complement to 5.2.1 Bluetooth data transmission
Install the software for the Bluetooth adapter that came with your equipment. Follow instructions given during installation. Activate your hand unit by pressing Enter. Insert your Bluetooth adapter into USB port when the installation requires so. Establish connection between your hand unit and your Bluetooth adapter.
Step-by-step: Right click on your Bluetooth symbol down to the right on your screen. Go to Bluetooth settings
1 2
Configurate your Bluetooth connection with the software guide.
The Bluetooth adapter searches for the hand unit.
Click Next.

User’s Manual, 1 ed., Nov. 2009 ivf SmartQuench® , ver. 3.1
L:\UPPDRAGSPROJEKT\SMARTQUENCH\ADMINISTRATION\MANUALER\SMARTQUENCH\ENGLISH\VER 2.3, ED 1 SQ2MAN-ENG-VER2-3_ED 1 100111 FÖR TRYCK.DOC-01/JB
2009-11-05
60
3 4
Mark the SQ The Bluetooth password is 0000 (zero * 4)
and click next
5 6
Configuration has been done Right click
Click Next
7 8
Choose Connect Now the hand unit and Bluetooth adapter is paired and connected. The equipment is ready for transferring files wireless.
0000