user’s guide for the fragile families and child wellbeing
TRANSCRIPT

1 | P a g e
User’s Guide for the Fragile Families and
Child Wellbeing Study Public Data, Year 5
Updated September 2019
Bendheim-Thoman
Center for Research on Child Wellbeing
Wallace Hall
Princeton University
Princeton, NJ 08544
https://crcw.princeton.edu/
Columbia Population Research Center
1255 Amsterdam Avenue, Room 715
Columbia University
New York, NY 10027
http://cupop.columbia.edu/
Prepared by the staff at the Bendheim-Thoman Center for Research on Child Wellbeing
(CRCW), Princeton University. For more information about FFCWS, please visit our
website at https://fragilefamilies.princeton.edu/ or email [email protected].
2 | P a g e
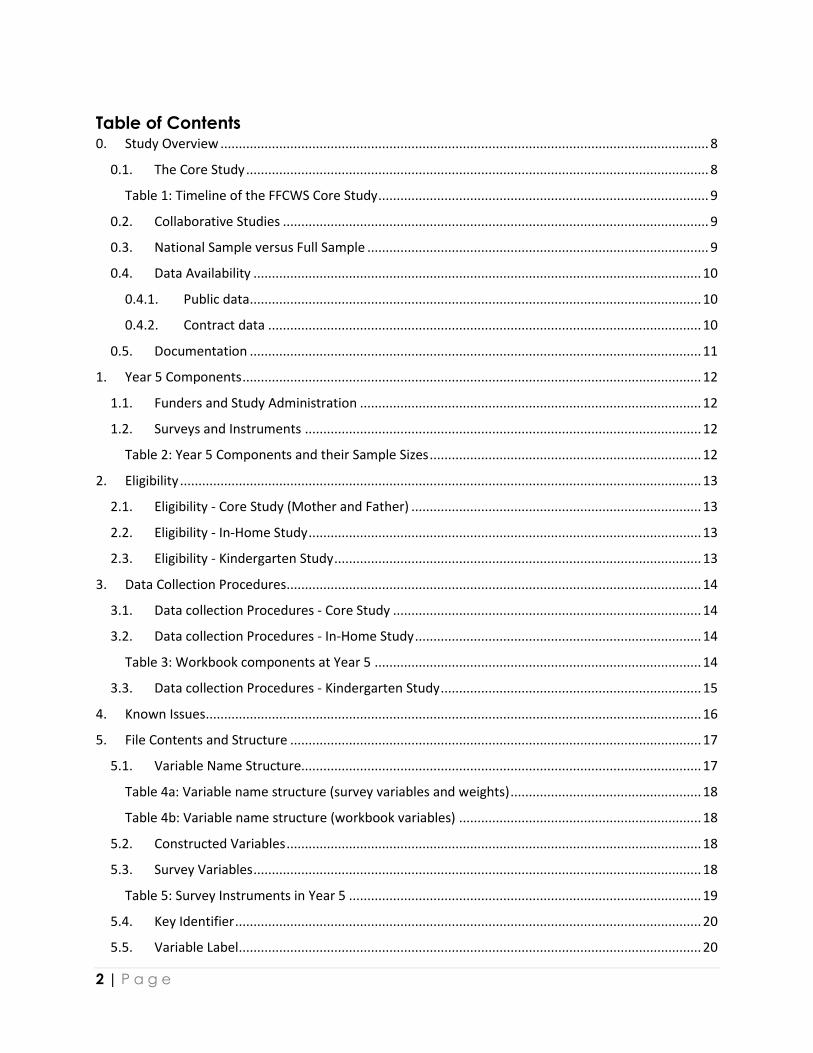
Table of Contents 0. Study Overview ..................................................................................................................................... 8
0.1. The Core Study .............................................................................................................................. 8
Table 1: Timeline of the FFCWS Core Study .......................................................................................... 9
0.2. Collaborative Studies .................................................................................................................... 9
0.3. National Sample versus Full Sample ............................................................................................. 9
0.4. Data Availability .......................................................................................................................... 10
0.4.1. Public data ........................................................................................................................... 10
0.4.2. Contract data ...................................................................................................................... 10
0.5. Documentation ........................................................................................................................... 11
1. Year 5 Components ............................................................................................................................. 12
1.1. Funders and Study Administration ............................................................................................. 12
1.2. Surveys and Instruments ............................................................................................................ 12
Table 2: Year 5 Components and their Sample Sizes .......................................................................... 12
2. Eligibility .............................................................................................................................................. 13
2.1. Eligibility - Core Study (Mother and Father) ............................................................................... 13
2.2. Eligibility - In-Home Study ........................................................................................................... 13
2.3. Eligibility - Kindergarten Study .................................................................................................... 13
3. Data Collection Procedures ................................................................................................................. 14
3.1. Data collection Procedures - Core Study .................................................................................... 14
3.2. Data collection Procedures - In-Home Study .............................................................................. 14
Table 3: Workbook components at Year 5 ......................................................................................... 14
3.3. Data collection Procedures - Kindergarten Study ....................................................................... 15
4. Known Issues ....................................................................................................................................... 16
5. File Contents and Structure ................................................................................................................ 17
5.1. Variable Name Structure............................................................................................................. 17
Table 4a: Variable name structure (survey variables and weights) .................................................... 18
Table 4b: Variable name structure (workbook variables) .................................................................. 18
5.2. Constructed Variables ................................................................................................................. 18
5.3. Survey Variables .......................................................................................................................... 18
Table 5: Survey Instruments in Year 5 ................................................................................................ 19
5.4. Key Identifier ............................................................................................................................... 20
5.5. Variable Label .............................................................................................................................. 20

3 | P a g e
5.6. Variable Response and Missing Data Code ................................................................................. 20
Table 6: Missing Data Codes ............................................................................................................... 20
5.7. Open-Ended Response Codes ..................................................................................................... 20
6. Data Cleaning ...................................................................................................................................... 21
7. Weights ............................................................................................................................................... 22
8. Introduction to Topics from the Data ................................................................................................. 23
Table 7: Major topics in Year 5 by survey instrument ............................................................................ 23
9. Paradata .............................................................................................................................................. 24
9.1. Constructed Variables - Age ........................................................................................................ 24
9.2. Constructed Variables - Sample Flags ......................................................................................... 24
9.2.1. Interview completion flags ................................................................................................. 24
9.2.2. Status flags .......................................................................................................................... 25
9.3. Constructed Variables - Status of survey completion ................................................................. 25
Table 8: ch4inttype_mod distribution ................................................................................................ 26
Table 9: Constructed variables with administrative information: ...................................................... 26
10. Finances .......................................................................................................................................... 28
Table 10: Subtopics in Finances in Year 5 by survey instrument ............................................................ 28
10.1. Constructed Variables - Household Income ........................................................................... 28
10.2. Constructed Variables - Household Income Imputation Flags................................................ 29
10.3. Constructed Variables - Poverty Measures ............................................................................. 29
10.4. Constructed Variables - Food Expenditure ............................................................................. 29
10.5. Scale – Household Food Security ............................................................................................ 31
10.5.1. Sample Response Rates to Food Security Questions .......................................................... 32
Table 11: Sample Response Rates to Food Security Questions .......................................................... 32
10.6. Scale – Material Hardship ....................................................................................................... 33
10.6.1. Variables .............................................................................................................................. 33
10.6.2. Modifications ...................................................................................................................... 33
10.6.3. Scoring ................................................................................................................................. 34
Table 12: Variables on Material Hardship ........................................................................................... 34
11. Health and Health Behavior ............................................................................................................ 35
Table 13: Subtopics in Health and Health Behavior in Year 5 ................................................................. 36
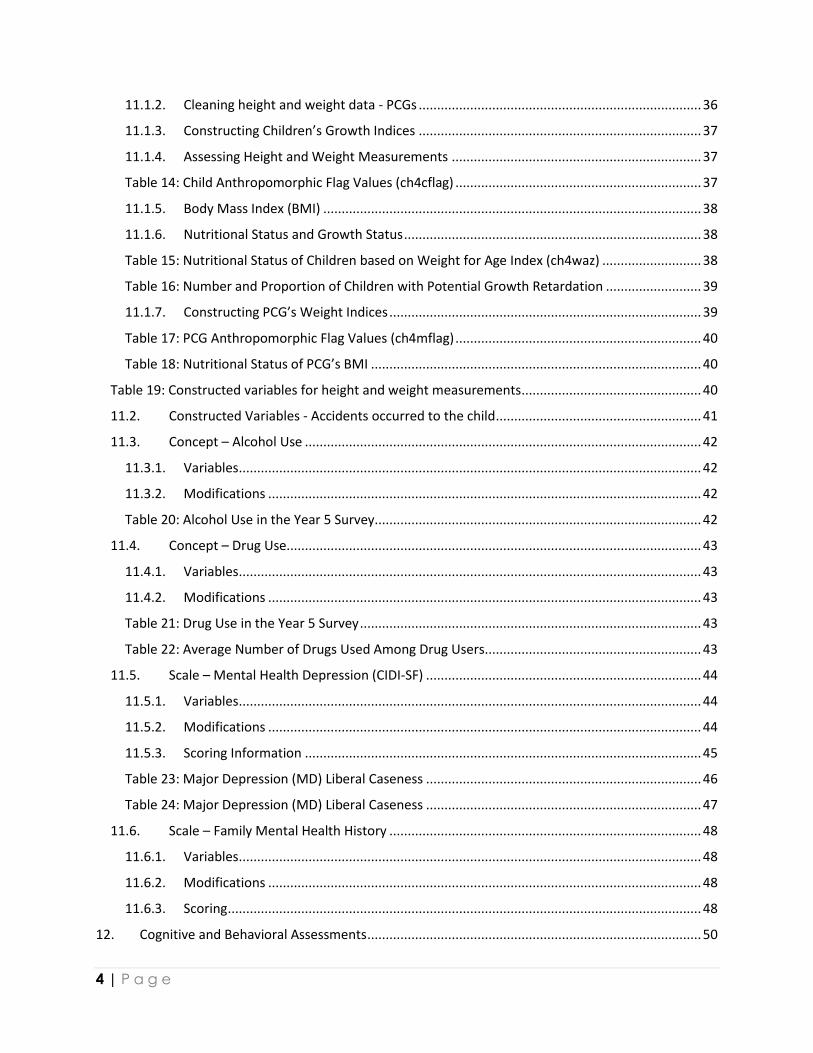
11.1. Constructed Variables - Height and Weight Measurements .................................................. 36
11.1.1. Cleaning height and weight data - Children ........................................................................ 36
4 | P a g e
11.1.2. Cleaning height and weight data - PCGs ............................................................................. 36
11.1.3. Constructing Children’s Growth Indices ............................................................................. 37
11.1.4. Assessing Height and Weight Measurements .................................................................... 37
Table 14: Child Anthropomorphic Flag Values (ch4cflag) ................................................................... 37
11.1.5. Body Mass Index (BMI) ....................................................................................................... 38
11.1.6. Nutritional Status and Growth Status ................................................................................. 38
Table 15: Nutritional Status of Children based on Weight for Age Index (ch4waz) ........................... 38
Table 16: Number and Proportion of Children with Potential Growth Retardation .......................... 39
11.1.7. Constructing PCG’s Weight Indices ..................................................................................... 39
Table 17: PCG Anthropomorphic Flag Values (ch4mflag) ................................................................... 40
Table 18: Nutritional Status of PCG’s BMI .......................................................................................... 40
Table 19: Constructed variables for height and weight measurements ................................................. 40
11.2. Constructed Variables - Accidents occurred to the child ........................................................ 41
11.3. Concept – Alcohol Use ............................................................................................................ 42
11.3.1. Variables .............................................................................................................................. 42
11.3.2. Modifications ...................................................................................................................... 42
Table 20: Alcohol Use in the Year 5 Survey......................................................................................... 42
11.4. Concept – Drug Use................................................................................................................. 43
11.4.1. Variables .............................................................................................................................. 43
11.4.2. Modifications ...................................................................................................................... 43
Table 21: Drug Use in the Year 5 Survey ............................................................................................. 43
Table 22: Average Number of Drugs Used Among Drug Users........................................................... 43
11.5. Scale – Mental Health Depression (CIDI-SF) ........................................................................... 44
11.5.1. Variables .............................................................................................................................. 44
11.5.2. Modifications ...................................................................................................................... 44
11.5.3. Scoring Information ............................................................................................................ 45
Table 23: Major Depression (MD) Liberal Caseness ........................................................................... 46
Table 24: Major Depression (MD) Liberal Caseness ........................................................................... 47
11.6. Scale – Family Mental Health History ..................................................................................... 48
11.6.1. Variables .............................................................................................................................. 48
11.6.2. Modifications ...................................................................................................................... 48
11.6.3. Scoring ................................................................................................................................. 48
12. Cognitive and Behavioral Assessments ........................................................................................... 50
5 | P a g e
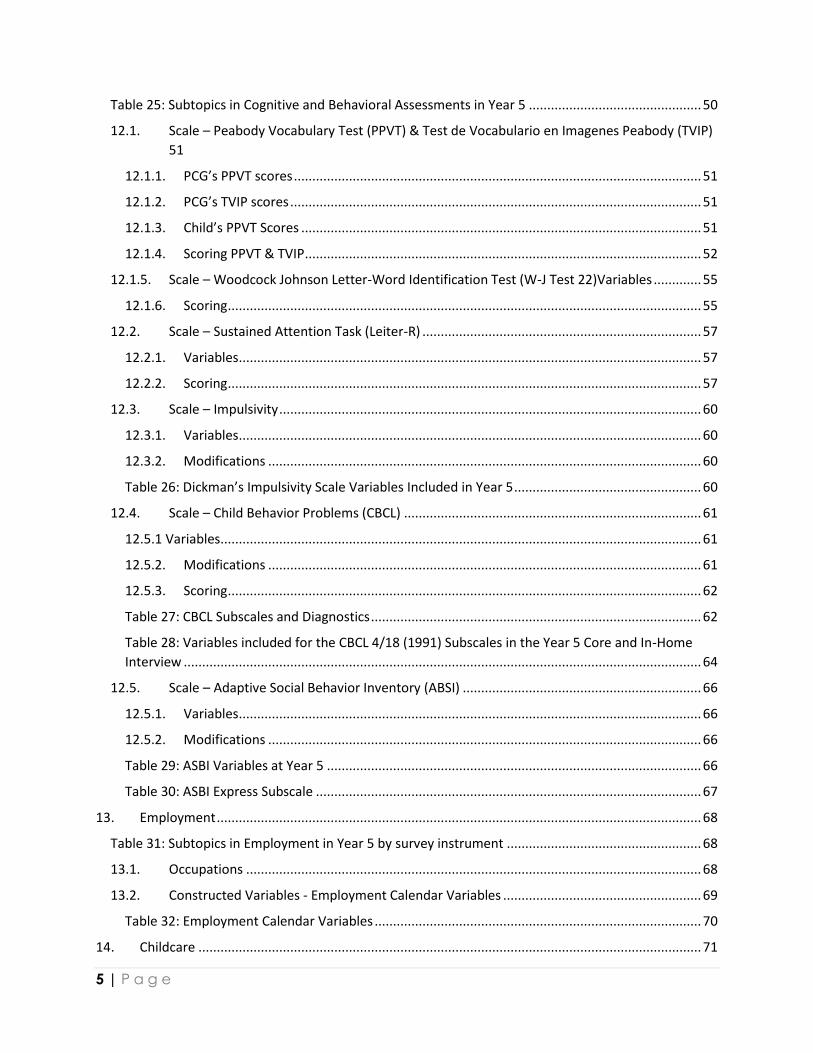
Table 25: Subtopics in Cognitive and Behavioral Assessments in Year 5 ............................................... 50
12.1. Scale – Peabody Vocabulary Test (PPVT) & Test de Vocabulario en Imagenes Peabody (TVIP)
51
12.1.1. PCG’s PPVT scores ............................................................................................................... 51
12.1.2. PCG’s TVIP scores ................................................................................................................ 51
12.1.3. Child’s PPVT Scores ............................................................................................................. 51
12.1.4. Scoring PPVT & TVIP ............................................................................................................ 52
12.1.5. Scale – Woodcock Johnson Letter-Word Identification Test (W-J Test 22)Variables ............. 55
12.1.6. Scoring ................................................................................................................................. 55
12.2. Scale – Sustained Attention Task (Leiter-R) ............................................................................ 57
12.2.1. Variables .............................................................................................................................. 57
12.2.2. Scoring ................................................................................................................................. 57
12.3. Scale – Impulsivity ................................................................................................................... 60
12.3.1. Variables .............................................................................................................................. 60
12.3.2. Modifications ...................................................................................................................... 60
Table 26: Dickman’s Impulsivity Scale Variables Included in Year 5 ................................................... 60
12.4. Scale – Child Behavior Problems (CBCL) ................................................................................. 61
12.5.1 Variables ................................................................................................................................... 61
12.5.2. Modifications ...................................................................................................................... 61
12.5.3. Scoring ................................................................................................................................. 62
Table 27: CBCL Subscales and Diagnostics .......................................................................................... 62
Table 28: Variables included for the CBCL 4/18 (1991) Subscales in the Year 5 Core and In-Home
Interview ............................................................................................................................................. 64
12.5. Scale – Adaptive Social Behavior Inventory (ABSI) ................................................................. 66
12.5.1. Variables .............................................................................................................................. 66
12.5.2. Modifications ...................................................................................................................... 66
Table 29: ASBI Variables at Year 5 ...................................................................................................... 66
Table 30: ASBI Express Subscale ......................................................................................................... 67
13. Employment .................................................................................................................................... 68
Table 31: Subtopics in Employment in Year 5 by survey instrument ..................................................... 68
13.1. Occupations ............................................................................................................................ 68
13.2. Constructed Variables - Employment Calendar Variables ...................................................... 69
Table 32: Employment Calendar Variables ......................................................................................... 70
14. Childcare ......................................................................................................................................... 71

6 | P a g e
Table 33: Subtopics in Childcare in Year 5 by survey instrument ........................................................... 71
14.1. Constructed Variables - Child Care Calendar Variables .......................................................... 71
Table 34: Child Care Calendar Variables ............................................................................................. 72
15. Romantic Relationships ................................................................................................................... 73
Table 35: Subtopics in Romantic Relationships in Year 5 by survey instrument .................................... 73
15.1. Constructed Variables - Mother’s relationship with child’s father ......................................... 73
Table 36: Constructed variables about parents’ romantic relationships ............................................ 74
15.2. Concept – Couple Relationship Quality .................................................................................. 75
15.2.1. Variables .............................................................................................................................. 75
15.2.1. Modifications .......................................................................................................................... 75
16. Parenting ......................................................................................................................................... 76
Table 37: Subtopics in Parenting in Year 5 by survey instrument .......................................................... 76
16.1. Constructed Variables - PCG’s relationship with child ............................................................ 76
Table 38: Distribution of PCG’s Relationship with Child at Year 5 ...................................................... 76
16.2. Scale – Maternal Description of Child (MDoc) ........................................................................ 77
16.2.1. Administration .................................................................................................................... 77
16.2.2. Coding ................................................................................................................................. 77
Table 39. MDoc Variables ................................................................................................................... 81
16.2.3. General Problems ................................................................................................................ 81
Table 40. Administrative Flags ............................................................................................................ 81
Table 41. Additional Variables describing Administration .................................................................. 82
16.3. Scale – Aggravation in Parenting ............................................................................................ 83
16.3.1. Variables .............................................................................................................................. 83
16.3.2. Modifications ...................................................................................................................... 83
16.3.3. Scoring Information ............................................................................................................ 83
Table 42: Aggravation in Parenting Variables ..................................................................................... 84
16.4. Scale – Conflict Tactics ............................................................................................................ 85
16.4.1. Variables .............................................................................................................................. 85
16.4.2. Modifications ...................................................................................................................... 85
Table 43: Conflict Tactics Scales Variables .......................................................................................... 86
16.4.3. Scoring Information ............................................................................................................ 86
17. Legal System.................................................................................................................................... 89
Table 44: Subtopics in Legal System in Year 5 by survey instrument ..................................................... 89

7 | P a g e
17.1. Constructed Variables - Father in Jail ..................................................................................... 89
18. Housing and Neighborhood ............................................................................................................ 90
Table 45: Subtopics in Housing and Neighborhood in Year 5 by survey instrument.............................. 90
Table 46: Constructed variables for household composition ................................................................. 90
18.1. Scale – Home Observation for Measurement of the Environment (HOME) ......................... 91
Table 47: HOME Observational Scales ................................................................................................ 91
Table 48: HOME Parental Report Scales ............................................................................................. 92
18.2. Concept – Exposure to Violence ............................................................................................. 93
18.3. Scale – Neighborhood Collective Efficacy ............................................................................... 94
18.3.1. Variables .............................................................................................................................. 94
19. Education ........................................................................................................................................ 95
Table 49: Subtopics in Education in Year 5 by survey instrument .......................................................... 95
19.1. Constructed Variables - Parent’s Education ........................................................................... 95
20. Other Topics in Year 5 ..................................................................................................................... 96
Table 50: Other topics and subtopics in Year 5 by survey instrument ................................................... 96
Appendix: Additional Information on the Year 5 In-Home Survey ............................................................. 97
0. Study Background and Administration ............................................................................................... 97
0.1. Research Team ............................................................................................................................ 97
0.2. Components of the Study ........................................................................................................... 97
0.3. Conducting the In-Home Survey ................................................................................................. 97
Figure 1.1 Process of Administering the Fragile Families Core Study and the In-Home Study .......... 99
Figure 1.2.a Conducting Year 5 In-Home Survey in Pilot Cities......................................................... 100
Figure 1.2.b. Conducting Year 5 In-Home Study in 18 cities ............................................................. 101
Figure 1.2.c. Conducting Year 5 In-Home Study in 18 cities ............................................................. 102
1. Questionnaire Changes between Pilot Survey and the Revised Survey ............................................... 103
1.1. Minor change to response option ................................................................................................. 103
1.2. Integration of Child Care and Parental Employment (CCPE) questionnaire .................................. 103
1.3. Activity Workbook timing .............................................................................................................. 103
2. Sample Counts and Attrition Overtime ................................................................................................. 105
2.1. Response Rate ................................................................................................................................ 105
Table A1: Crude Response Rate by Race of Mother ......................................................................... 105
Table A2: Crude Responses by Relationship of Mother and Father at Year 5 .................................. 106
8 | P a g e
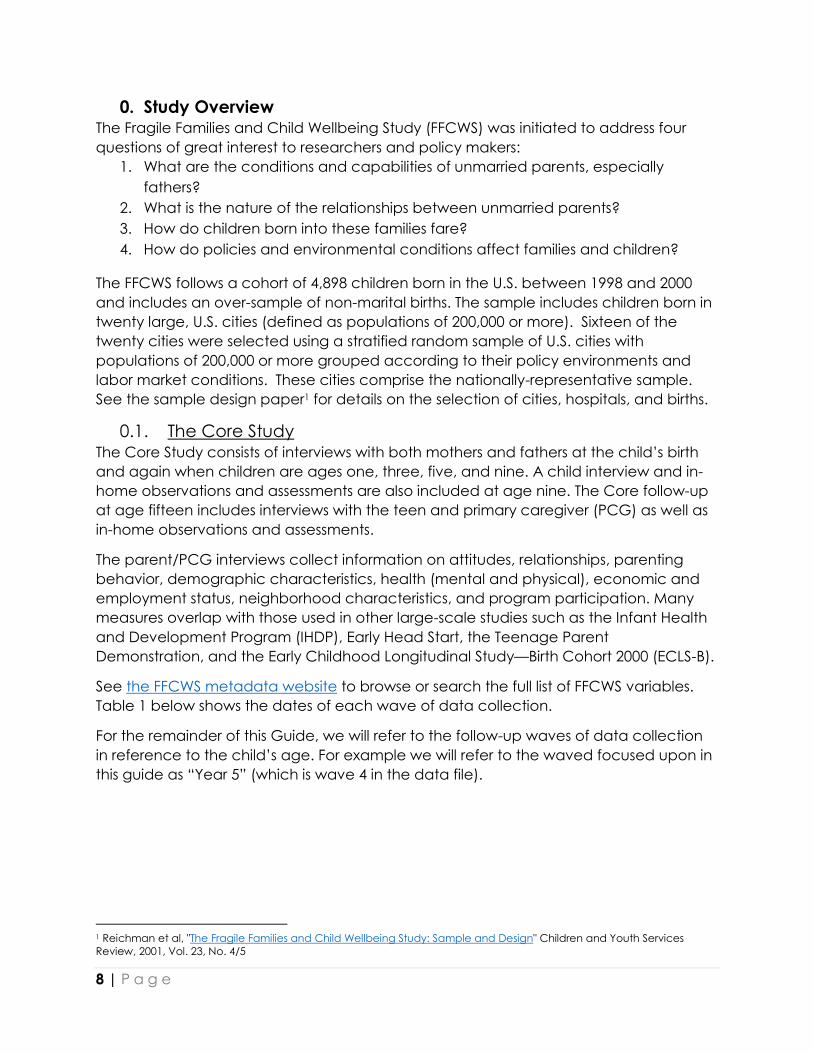
0. Study Overview The Fragile Families and Child Wellbeing Study (FFCWS) was initiated to address four
questions of great interest to researchers and policy makers:
1. What are the conditions and capabilities of unmarried parents, especially
fathers?
2. What is the nature of the relationships between unmarried parents?
3. How do children born into these families fare?
4. How do policies and environmental conditions affect families and children?
The FFCWS follows a cohort of 4,898 children born in the U.S. between 1998 and 2000
and includes an over-sample of non-marital births. The sample includes children born in
twenty large, U.S. cities (defined as populations of 200,000 or more). Sixteen of the
twenty cities were selected using a stratified random sample of U.S. cities with
populations of 200,000 or more grouped according to their policy environments and
labor market conditions. These cities comprise the nationally-representative sample.
See the sample design paper1 for details on the selection of cities, hospitals, and births.
0.1. The Core Study The Core Study consists of interviews with both mothers and fathers at the child’s birth
and again when children are ages one, three, five, and nine. A child interview and in-
home observations and assessments are also included at age nine. The Core follow-up
at age fifteen includes interviews with the teen and primary caregiver (PCG) as well as
in-home observations and assessments.
The parent/PCG interviews collect information on attitudes, relationships, parenting
behavior, demographic characteristics, health (mental and physical), economic and
employment status, neighborhood characteristics, and program participation. Many
measures overlap with those used in other large-scale studies such as the Infant Health
and Development Program (IHDP), Early Head Start, the Teenage Parent
Demonstration, and the Early Childhood Longitudinal Study—Birth Cohort 2000 (ECLS-B).
See the FFCWS metadata website to browse or search the full list of FFCWS variables.
Table 1 below shows the dates of each wave of data collection.
For the remainder of this Guide, we will refer to the follow-up waves of data collection
in reference to the child’s age. For example we will refer to the waved focused upon in
this guide as “Year 5” (which is wave 4 in the data file).
1 Reichman et al, "The Fragile Families and Child Wellbeing Study: Sample and Design" Children and Youth Services
Review, 2001, Vol. 23, No. 4/5

9 | P a g e
Table 1: Timeline of the FFCWS Core Study
Wave Age Years
1 - Baseline Birth 1998 - 2000
2 Age 1 1999 - 2001
3 Age 3 2001 - 2003
4 Age 5 2003 - 2006
5 Age 9 2007 - 2010
6 Age 15 2014 - 2017
0.2. Collaborative Studies The In-Home Longitudinal Study of Pre-School Aged Children (In-Home Study) was a
collaborative work of the researchers at the Princeton University Center for Health and
Wellbeing (CHW), Columbia University, and Teachers College. The study placed
particular emphasis on how parental resources in the form of parental presence or
absence, time, and money influence children under the age of five. The In-Home Study
collected information on a variety of domains of the child’s environment, including: (1)
physical environment: through quality of housing, nutrition and food security, health
care, adequacy of clothing and supervision and (2) parenting: through parental
discipline, parental attachment, and cognitive stimulation.
The In-Home Study included all of the following components at Years 3 and 5: Primary
Caregiver interview, interviewer observations, and activity workbook. Note that the In-
Home components at Years 9 and 15 were collected as part of the Core Study.
For further details on the collaborative studies at each wave, see that wave’s User
Guide or find a list of all current and completed collaborative studies on our website.
0.3. National Sample versus Full Sample There are 20 cities in the full FFCWS sample. Sixteen of these cities were selected via a
stratified random sample and comprise the “national” sample. For each wave of data
and for each unit of analysis (mother, father, couple), users can weight the data up to
two different populations – the national level2 or the city level. Applying the national
weights makes the data from the 16 randomly selected cities representative of births
occurring in large U.S. cities (the 77 U.S. cities with populations over 200,000 in 1994)
between 1998 and 2000. Applying the city-level weights makes the data from all 20
cities in the sample3 representative of births in their particular city in 1998, 1999, or 2000,
depending on the year in which the baseline data collection took place for that city.
2 In this memo, the term national refers to all 77 U.S. cities with 1994 populations of 200,000 or more 3 There are 109 cases in the data file that were not randomly selected for the core sample (some were randomly
selected to be part of a separate study – the TLC3 study) and do not have national sample or city sample weights. Data
users can identify and remove these cases using the weights sample flags (cm1citsm=0 for Baseline and cm2citsm=0 for
Year 1). Data users can identify and remove these cases using the weights sample flags (cm1citsm = 0 or cm1citysm =
0).

10 | P a g e
The public use data do not contain the geographic identifiers needed to construct the
stratum and primary sampling unit (PSU) variables necessary for using a Taylor Series
methodology to estimate variances (except through a restricted use contract)4.
Therefore, the public use data files contain a basic weight and a set of replicate
weights. The replicate weights are used in place of the stratum and PSU variables. The
replicate weights mask the locations of respondents, while still allowing for estimation of
variance. If you are using the public use datasets, you will need to use the replicate
weights to get estimates of variance for the sample. Applying the basic weight without
the replicate weights will give you comparable point estimates, but will yield incorrect
variance estimates. A brief introduction to the weights available for the public data
files is available in the documentation memo “Fragile Families & Child Wellbeing Study:
A Brief Guide to Using the Weights for Waves 1-6.” For detailed information on the
construction of the weights, see “Fragile Families & Child Wellbeing Study: Methodology
for Constructing Mother, Father, and Couple Weights for Core Telephone Surveys”.
0.4. Data Availability There are two types of data available to data users.
0.4.1. Public data Currently, Baseline, Year 1, Year 3, Year 5, Year 9, and Year 15 public data are available
through the Princeton University Office of Population Research (OPR) data archive. To
access these data, researchers must complete a brief application and a 25-word
abstract about their research project. These files are available in Stata, SPSS, or SAS
format and can be downloaded as one combined file (ff_allwaves_2018) or in six
separate files by wave, such as “ff_wave4_2018” for Year 5.
0.4.2. Contract data Contract data require a more formal application due to the sensitive nature of the
variables available. Contract data available include files, such as a geographic file with
variables for the focal child's birth city, mother's and father's state of residence at each
interview, and stratum and PSU (note: replicate weights are available on the public file
in lieu of these), a set of contextual characteristics of the census tract at each wave,
medical records data for mothers and children from the birth hospitalization record, a
school characteristics file based on National Center for Educational Statistics data, a
labor market and macroeconomic file with data on local employment and national
consumer confidence at each wave, and a genetic data file with candidate genes
and telomere length.
For further detail regarding the content of the contract data and the application
process for its access, please visit our website.
4 Please note that data users who have access to the geographic identifiers may still want to use the replicate weights
for their estimates. Using the replicate weights will likely yield similar standard errors (at least for cross-sectional estimates)
as the alternative method.

11 | P a g e
0.5. Documentation The remainder of this guide will provide a detailed overview of the Year 5 Wave of the
public FFCWS data.
For User Guides for other waves of the FFCWS and further documentation including
questionnaires and codebooks for each interview or weights documentation, see the
Documentation page on our website.
12 | P a g e
1. Year 5 Components The Year 5 wave of the FFCWS contains components from three sub-studies:
1. The FFCWS Core Study [a.k.a. “Core Study”] (includes mother and father
interview)
2. The In-Home Longitudinal Study of Pre-School Aged Children [a.k.a. “In-Home
Study”]
3. The Kindergarten Study Teacher Survey [a.k.a. “Kindergarten Study”]
The Year 5 public data file (ff_wave4_2018) includes data from all three sub-studies.
1.1. Funders and Study Administration Funding for all three sub-studies at Year 5 was provided through grants from the Eunice
Kennedy Shriver National Institute of Child Health and Human Development (NICHD).5
Since the Fragile Families and Child Wellbeing Study began in 1998, a consortium of
private foundations, non-profit organizations, and government agencies has provided
additional support. Since the Fragile Families and Child Wellbeing Study began in 1998,
a consortium of private foundations, non-profit organizations, and government
agencies has provided additional support. Please see our website for the full list of
these partners. Data collection for these studies was administered by Mathematica
Policy Research, Inc. (MPR) in Princeton, NJ.
The FFCWS Core Study was a joint effort by Princeton University’s Center for Research on
Child Wellbeing (CRCW) and Center for Health and Wellbeing (CHW), the Columbia
Population Research Center (CPRC) and the National Center for Children and Families
(NCCF) at Columbia University. The In-Home Longitudinal Study of Pre-School Aged
Children was a collaboration of the researchers at the CHW of Princeton University,
Columbia University, and Teachers College.
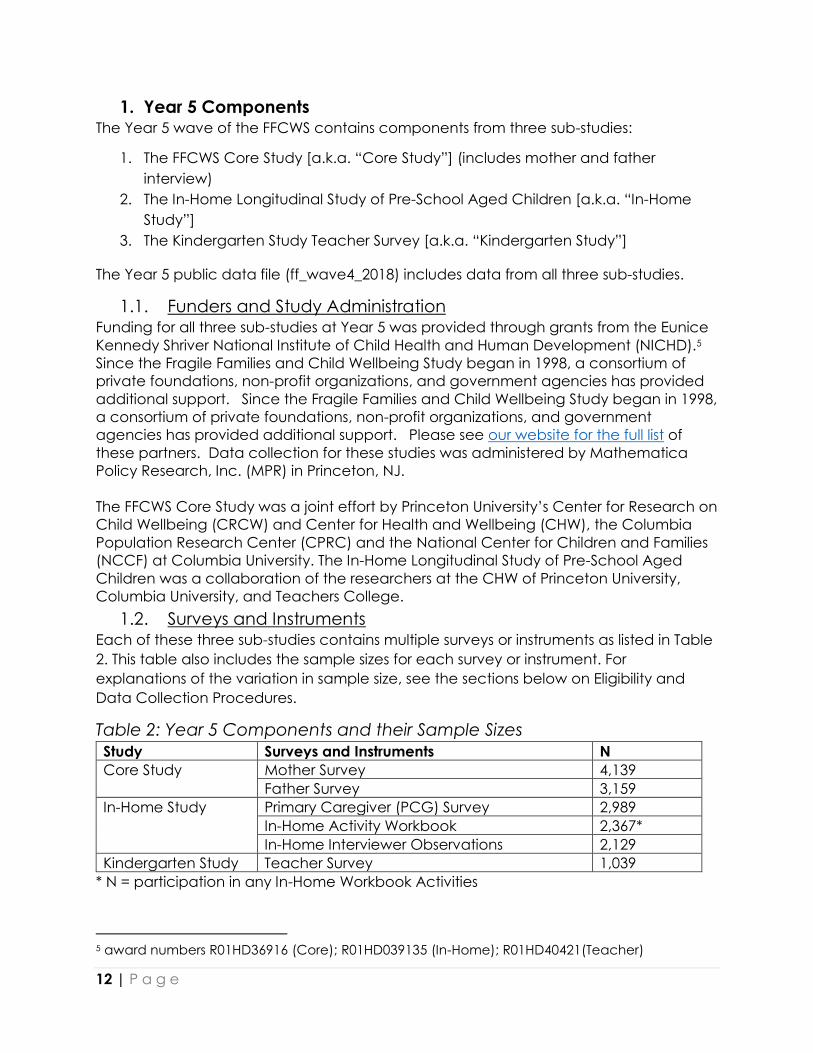
1.2. Surveys and Instruments Each of these three sub-studies contains multiple surveys or instruments as listed in Table
2. This table also includes the sample sizes for each survey or instrument. For
explanations of the variation in sample size, see the sections below on Eligibility and
Data Collection Procedures.
Table 2: Year 5 Components and their Sample Sizes
Study Surveys and Instruments N
Core Study Mother Survey 4,139
Father Survey 3,159
In-Home Study Primary Caregiver (PCG) Survey 2,989
In-Home Activity Workbook 2,367*
In-Home Interviewer Observations 2,129
Kindergarten Study Teacher Survey 1,039
* N = participation in any In-Home Workbook Activities
5 award numbers R01HD36916 (Core); R01HD039135 (In-Home); R01HD40421(Teacher)
13 | P a g e
2. Eligibility
2.1. Eligibility - Core Study (Mother and Father) All respondents who completed a baseline interview were contacted for the Year 5
Core Study, as were non-respondent at baseline fathers whose partner (mother) had
completed a baseline interview. A small portion of the original respondents were found
to be ineligible at the time of the follow-up interviews. See the sample flags (c*4samp)
for counts at Year 5. Reasons for considering a family ineligible for further interview
include: child deceased, child adopted. Reasons for considering a parent ineligible
include: a parent deceased and for fathers DNA confirmation that the original
respondent is not the child’s father.
2.2. Eligibility - In-Home Study Respondents of the Year 5 Core Study were invited to participate in the Year 5 In-Home
Study. The primary caregiver questionnaire was conducted by phone with the
biological mother in situations where she or she and the biological father had custody
of the “focal child” for half or more of the time. If the biological mother did not have
primary custody of the child, the primary caregiver interview was conducted with the
father, relative, or friend who had custody of the child half or more of the time. An
additional set of questions were administered to non-parental caregiver at the
beginning of the primary caregiver interview in situations where both biological parents
were not the primary caregiver.
2.3. Eligibility - Kindergarten Study In Section E of the primary caregiver survey, respondents were asked whether their child
was either currently enrolled in Kindergarten, had been enrolled the previous year, or
was going to be enrolled the following year – if any of these responses was affirmed,
the respondent was deemed eligible for the Kindergarten Study. Keep in mind that the
group eligible for the Kindergarten study were concurrently eligible for the In-Home
Study and had opted to participate in the In-Home Study, as consent for the
Kindergarten Study was asked during primary caregiver survey.

14 | P a g e
3. Data Collection Procedures
3.1. Data collection Procedures - Core Study The Year 5 wave of Core data collection took place from 2003 to 2006. These interviews
were designed to be conducted by telephone using a Computer Assisted Telephone
Instrument (CATI). All mothers who remained eligible were contacted for the Year 5
interview. All Year 5 mother interviews were first attempted by telephone using CATI. In
cases in which we could not contact the mother by telephone, local field interviewers
were assigned cases requiring field locating. The field interviewers were encouraged to
have respondents call a 24-hour toll-free number at the Mathematica Policy Research
(MPR) survey operations center to complete the interview on the CATI system. Field
interviewers were also trained in administration of the survey instrument. Respondents
completing the Year 5 interviews by telephone were provided with $30 incentive
payment. Those requiring a field visit to complete the core survey were provided with
$50 incentive payment.
Father follow-up interviews followed the same protocols and incentives as mothers.
Some fathers were incarcerated at the time of data collection in their location. In
these cases, MPR staff worked to obtain special clearance, including permission from
the Federal Bureau of Prisons, to conduct interviews with incarcerated respondents.
When possible for cost containment purposes, interviews with incarcerated respondents
were attempted by telephone. However, some prisons do not permit telephone
interviews. In those cases MPR field interviewers arranged for in-person visits.
3.2. Data collection Procedures - In-Home Study The Year 5 In-Home Study included a (1) survey administered to the focal child’s Primary
Caregiver (PCG), (2) observations of the home, the child’s interactions with the
caregiver, and surrounding environment, and (3) a workbook of activities for
anthropometric and cognitive measures of the PCG and child – all to be completed in
the family’s home. Table 3 shows a complete list of the components included in the
Year 5 In-Home Study workbook.
Table 3: Workbook components at Year 5
Component PCG Child
Height and weight measurements X X
Peabody Picture Vocabulary Test/Test de Vocabulario en Imagenes
Peabody (PPVT/TVIP) X X
Woodcock-Johnson Letter-Word Recognition Test X
Attention Sustained Task (Leiter) X
Five Minute Speech Sample (MDoc) X
Child Care and Employment Calendars X
Flow charts detailing the sequence of In-Home Study component administration are
available in the Appendix. Changes made to the In-Home questionnaires during data
collection are also included in the Appendix.

15 | P a g e
3.3. Data collection Procedures - Kindergarten Study During the In-Home Study, the decision was made to switch from child care
observations (completed at Year 3) to kindergarten surveys, given that children were
aging out of child care. In the cities in which the In-Home Study had already been
completed, parents were called to get contact info on the kindergarten teacher and
verbal permission to contact that person. In the cities in which the In-Home had not yet
begun, this process was incorporated into the In-Home and written parental permission
was obtained in person.
Letters were sent to the primary school district in each city, requesting permission from
the district to contact teachers. Only a minimal number of the school districts that were
contacted refused to allow their teachers to participate. In cases of consent,
kindergarten teachers were then contacted, and they themselves could either
participate or not. In the case of children who fell outside the primary school district in
their city, the kindergarten teacher was contacted directly.
16 | P a g e
4. Known Issues This section highlights known issues and errors in the Year 5 data that could not be
cleaned or where data could not be recovered. Users should review this information to
plan their analysis accordingly.
Kindergarten: The questions that ask if schools are on summer break (m4b7/f4b7) and if
child is currently enrolled in kindergarten (m4b7a/f4b7a) are not reliable indicators.
Interviewers were instructed to code these questions without asking. The results in m4b7
and f4b7 do not line up consistently with the interview date, and a large number of
cases in m4b7a and f4b7a are coded as skip without any skip instruction. Only
respondents in two cities have valid data on kindergarten enrollment (m4b8a/f4b8a).
We recommend that users not use questions m4b7 and f4b7 for determining if child is
currently enrolled in kindergarten.
Unlikely responses in Primary Caregiver Survey: Variable p4a28, associated with item
A28 (how many dental fillings has <child> ever had?), contains a value 27 (dental
fillings) which may seem too high for a five-year-old.
Variables p4b1, p4b2, associated with item B1, B2, which asked about number of hours
watching TV by child per day, contain a handful records with value as 24.
17 | P a g e
5. File Contents and Structure
5.1. Variable Name Structure In the Year 5 data, each variable name is unique and uses certain characters, as well
as a specific order that will help identify to whom and in which survey the question was
asked. All variable names from Year 5 begin with an alphabetic character. If the
variable name begins with the letter “c”, the variable is constructed (see section 5.2 for
more on constructed variables). If not, the variable corresponds to a question asked in
a Year 5 survey and the first character in the variable name indicates to which
instrument the variable corresponds. See Table 5 for a full list of Year 5 survey instruments
and their prefix letters.
In Year 5 variable names, what follows the instrument is the number “4” to indicate the
wave of data collection. Furthermore, when the variable is directly associated with the
questionnaire (is not constructed), the leaf (the end of the variable) will indicate the
section letter and the question number to which to variable corresponds. See Table 4a
for a list of Year 5 survey instruments and their prefix letters. Table 4b shows the variable
name structure for the In-Home Activity Workbook components.
18 | P a g e
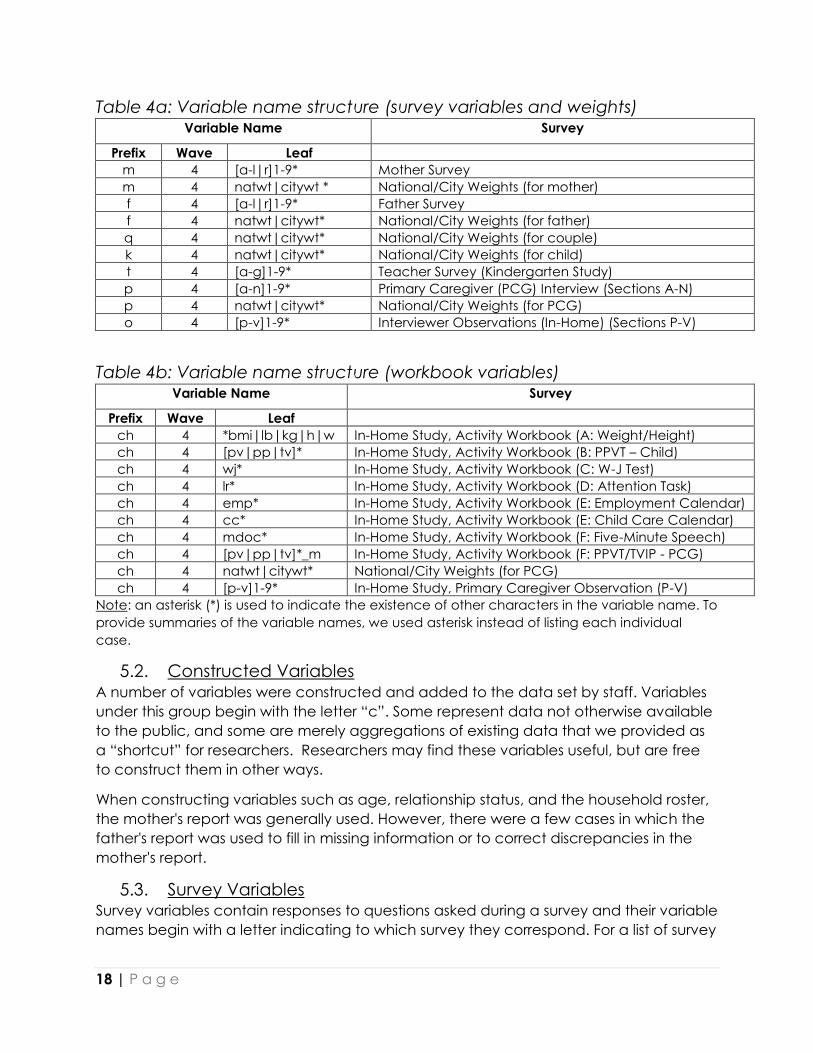
Table 4a: Variable name structure (survey variables and weights) Variable Name Survey
Prefix Wave Leaf
m 4 [a-l|r]1-9* Mother Survey
m 4 natwt|citywt * National/City Weights (for mother)
f 4 [a-l|r]1-9* Father Survey
f 4 natwt|citywt* National/City Weights (for father)
q 4 natwt|citywt* National/City Weights (for couple)
k 4 natwt|citywt* National/City Weights (for child)
t 4 [a-g]1-9* Teacher Survey (Kindergarten Study)
p 4 [a-n]1-9* Primary Caregiver (PCG) Interview (Sections A-N)
p 4 natwt|citywt* National/City Weights (for PCG)
o 4 [p-v]1-9* Interviewer Observations (In-Home) (Sections P-V)
Table 4b: Variable name structure (workbook variables) Variable Name Survey
Prefix Wave Leaf
ch 4 *bmi|lb|kg|h|w In-Home Study, Activity Workbook (A: Weight/Height)
ch 4 [pv|pp|tv]* In-Home Study, Activity Workbook (B: PPVT – Child)
ch 4 wj* In-Home Study, Activity Workbook (C: W-J Test)
ch 4 lr* In-Home Study, Activity Workbook (D: Attention Task)
ch 4 emp* In-Home Study, Activity Workbook (E: Employment Calendar)
ch 4 cc* In-Home Study, Activity Workbook (E: Child Care Calendar)
ch 4 mdoc* In-Home Study, Activity Workbook (F: Five-Minute Speech)
ch 4 [pv|pp|tv]*_m In-Home Study, Activity Workbook (F: PPVT/TVIP - PCG)
ch 4 natwt|citywt* National/City Weights (for PCG)
ch 4 [p-v]1-9* In-Home Study, Primary Caregiver Observation (P-V)
Note: an asterisk (*) is used to indicate the existence of other characters in the variable name. To
provide summaries of the variable names, we used asterisk instead of listing each individual
case.
5.2. Constructed Variables
A number of variables were constructed and added to the data set by staff. Variables
under this group begin with the letter “c”. Some represent data not otherwise available
to the public, and some are merely aggregations of existing data that we provided as
a “shortcut” for researchers. Researchers may find these variables useful, but are free
to construct them in other ways.
When constructing variables such as age, relationship status, and the household roster,
the mother's report was generally used. However, there were a few cases in which the
father's report was used to fill in missing information or to correct discrepancies in the
mother's report.
5.3. Survey Variables Survey variables contain responses to questions asked during a survey and their variable
names begin with a letter indicating to which survey they correspond. For a list of survey

19 | P a g e
instruments and their corresponding prefixes in Year 5, please refer to Table 5. The
survey instrument is named for either the person answering questions or the place being
surveyed. Following the prefix and wave, survey variables were named as the item in
the instrument. For example, variable p4a1 in the data set contains responses provided
to item A1 (In general, would you say child’s health is …) in the PCG survey.
Table 5: Survey Instruments in Year 5
instrument instrument description
m Mother Survey
f Father Survey
p Primary Caregiver (PCG) Survey
h In-Home Activity Workbook
o Interviewer Observations (In-Home)
t Teacher Survey
q Couple (used only as weights)
k Child (used only as weights)
Survey variables were processed as follows:
a. Most categorical variables, which were created from survey questions with pre-
coded response categories, have values corresponding to the codes presented
in the instrument. Occasionally, we recoded one or two pre-coded values of a
few categorical variables to make such codes consistent with those used for
many other variables. For example, many items in the In-Home Study instruments
had the responses pre-coded as 1 for “yes” and 0 for “no”, but a few items, such
as item o4r4 (does the housing unit contain holes in floor) or o4r5 (does the
housing unit contain broken plaster or peeling paint over 1 square foot or more?)
had the response pre-coded as “1” for “yes” or “affirmative situation” and “2” for
“No” or “negative situation”. Value “2” recorded for variables such as o4r4 and
o4r5 was recoded to “0”.
b. A few survey questions allowed multiple pre-coded responses. Each possible
response was coded into an indicator variable whose value was assigned as 1
for affirmative situation and 0, otherwise. For example, all possible responses
provided for In-Home Observations item S1 (how would you best describe the
child’s clothing?) were coded into a series of 10 indicator variables: o4s1_1 to
o4s1_10, where variable o3s1_1 represents if “dirty, unkempt” clothing condition,
variable o4s1_2 represents if “dirty due to playing/eating” and so on. In addition,
the responses provided for category “Other (Specify)” for the same item were
examined; and if any could be reasonably coded into an existing category,
such response(s) was recoded accordingly. For example, “oversized shirt”
recorded as “Other”; item S1 was coded as “1” in the variable o4s1_8 (for
clothing is too large).
20 | P a g e
5.4. Key Identifier The Family ID (idnum) is the key identifier on the file for merging and sorting. idnum is the
random family case ID that links the biological parents of the child at baseline, and in
each subsequent wave, links all survey components for each family sampled at
baseline. idnum is a string variable consisting of 4 characters. Because, the idnum
identifier remains fixed throughout the waves, it can be used to merge data from any
wave of the study.
5.5. Variable Label Variable labels in the data and codebook correspond as closely as possible to the
questions in the questionnaire; however, for formatting reasons some of the questions
have been modified or abbreviated in the labels. Please see the questionnaire for
official question wording and response categories.
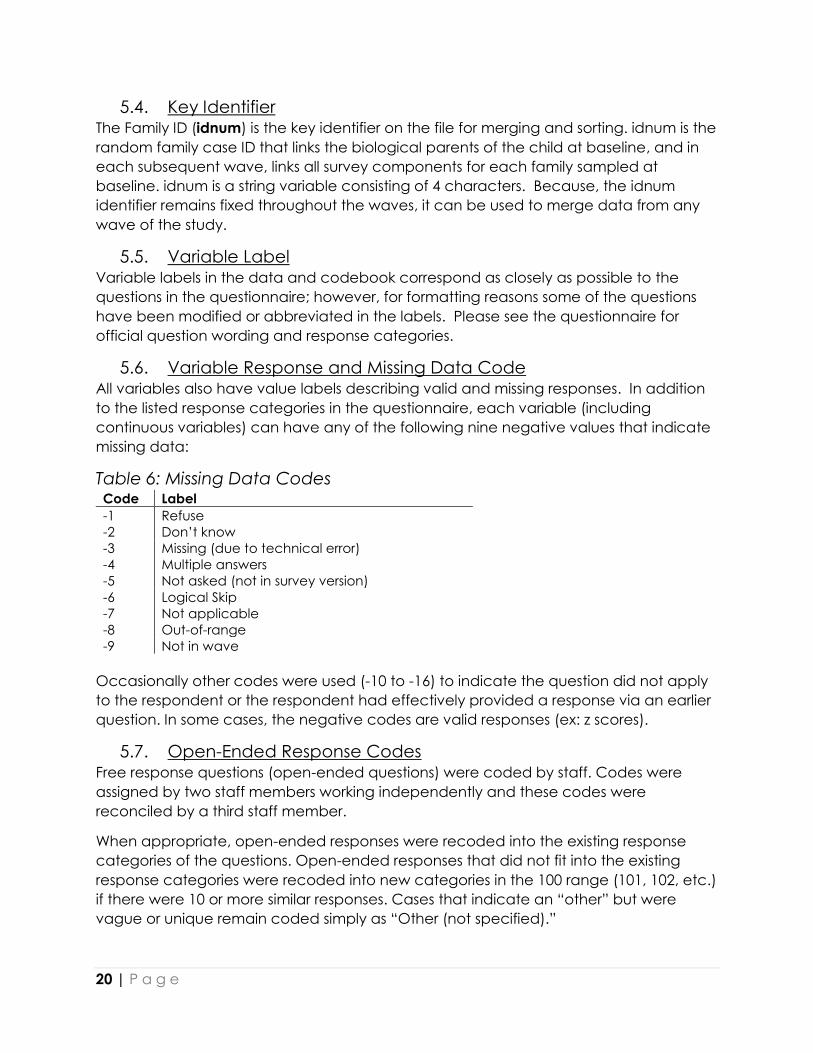
5.6. Variable Response and Missing Data Code All variables also have value labels describing valid and missing responses. In addition
to the listed response categories in the questionnaire, each variable (including
continuous variables) can have any of the following nine negative values that indicate
missing data:
Table 6: Missing Data Codes Code Label
-1 Refuse
-2 Don’t know
-3 Missing (due to technical error)
-4 Multiple answers
-5 Not asked (not in survey version)
-6 Logical Skip
-7 Not applicable
-8 Out-of-range
-9 Not in wave
Occasionally other codes were used (-10 to -16) to indicate the question did not apply
to the respondent or the respondent had effectively provided a response via an earlier
question. In some cases, the negative codes are valid responses (ex: z scores).
5.7. Open-Ended Response Codes Free response questions (open-ended questions) were coded by staff. Codes were
assigned by two staff members working independently and these codes were
reconciled by a third staff member.
When appropriate, open-ended responses were recoded into the existing response
categories of the questions. Open-ended responses that did not fit into the existing
response categories were recoded into new categories in the 100 range (101, 102, etc.)
if there were 10 or more similar responses. Cases that indicate an “other” but were
vague or unique remain coded simply as “Other (not specified).”

21 | P a g e
6. Data Cleaning For data derived from phone surveys, limited data cleaning was performed on the files.
Some values were recoded to “–8 out of range” and minor changes were made to
earnings, income, household roster, ages, etc. if the decision was clear cut. If not, data
was left for the user to decide how to code. Known inconsistencies across variables
remain in the data for users to consider in their analysis.
In general for the data derived from the In-Home Study, we followed the following steps
to clean the data:
First, the identifiers were checked for uniqueness. Records having duplicate identifiers
were marked for verification against records in the database of the survey firm. To verify
linkage status, records with unique identifiers were matched to records in most related
data sets such as the FFCWS Core data, the activity workbook data (which was
provided in batches of separate data sets), and the disposition data. Unmatched
records were separated for further verification, and eventually were either dropped, if
invalid, or retained, after correction(s).
Second, frequency distributions of categorical variables were examined to verify
whether or not the codes appeared in the data were consistent with the corresponding
codes listed in the instruments. In the process, any irregular responses or responses not
within the permissible data value ranges were marked for checking. Series of multi-level
crosstabulations of related variables were generated to verify response consistencies.
Obviously inconsistent data values, if could be reasonably edited, were either edited
logically or replaced by value imputed from a “more reliable” response provided to
one or some other related variables.
Third, inconsistent or irregular data values that could not be edited logically were
marked and sent to the survey firm for cross-verifying against responses recorded in the
original data collection forms or raw files in the computer assisted telephone interview
(CATI) system. Resolved data value, if different from the value in the earlier release(s)
from the survey firm and also assessed as more reliable, was corrected accordingly.
Fourth, data collected from the pilot cities were combined with data collected from
the other eighteen cities. To combine data, items not exactly the same in two versions
of the questionnaires were identified and processed as follows: if the question asked is
the same in two versions but the codes used for the responses are not identical: values
used for the pilot cities were recoded to match the codes used for the eighteen cities.

22 | P a g e
7. Weights The FFCWS sample was selected using a complex sample design, where the sample
members were not selected independently and were not selected with equal
probabilities. For instance, non-marital births were oversampled. Therefore,
Mathematica Policy Research has created a Year 5 set of weights to adjust for the
sample design (probability of selection), non-response at baseline, and attrition based
on observed characteristics over the waves.
Public users, who do not have access to the stratum and PSU variables, can use a set of
replicate weights to properly estimate variance for the sample. Contract data users
can employ the replicate weights or Taylor Series method which incorporates strata
and PSU.
A brief introduction to the weights available for the public data files is available in the
documentation memo “Fragile Families & Child Wellbeing Study: A Brief Guide to Using
the Weights for Waves 1-6” For detailed information on the construction of the sample
weights, please read “Fragile Families & Child Wellbeing Study: Methodology for
Constructing Mother, Father, and Couple Weights for Core Telephone Surveys” as well
as “Methodology for Constructing Primary Caregiver Weights for Wave 3-5 Fragile
Families and Child Wellbeing Study” and “Methodology for Constructing Child Weights
for Wave 3-5 Fragile Families and Child Wellbeing Study.”

23 | P a g e
8. Introduction to Topics from the Data Year 5 data covers a range of topics throughout surveys administered to the focal
child’s biological mother, biological father, primary caregiver, and/or kindergarten
teacher, as well as through home activities and observations. Table 7 provides an
overview of some of the topics covered in Year 5 by survey instrument (for a full list of
survey instruments, please refer to Table 5).
Table 7: Major topics in Year 5 by survey instrument
Topics m f p h o t
Attitudes and Expectations X X X X
Childcare X X X
Cognitive and Behavioral Development X X X X X X
Demographics X X X X X
Education and School X X X
Employment X X X
Family and Social Ties X X
Finances X X X X
Health and Health Behavior X X X X X X
Housing and Neighborhood X X X X X X
Legal System X X X
Paradata and Weights X X X X X X
Parenting X X X X X
Romantic Relationships X X Note: There are also weights for the couple (q) and child (k).
The next sections of this User Guide are organized by these topic categories. Within
each section, we will list constructed variables (created by staff to add shortcuts for
data users), followed by scales and concepts that relate to each topic. We define a
scale as a composite measure that is composed of variables within the same construct.
By constructing a scale, researchers can indicate the degree or intensity to which
respondents adhere to the given construct. Scales are typically derived from an
established source or existing study. Information on scoring a scale can be found within
each section. Concepts are also aggregations of similar variables; however, we do not
provide information on scoring, nor do we treat concepts as validated scales.
Researchers are also encouraged to interrogate the data further and to refer to the
questionnaires provided in the Documentation for more information on the survey
content.
24 | P a g e
9. Paradata Every survey at Year 5 includes variables with information about the interview, also
known as paradata. Within the available Year 5 paradata is the date (month and year)
the interview was administered, the language it was administered in (English or
Spanish), and the way in which it was delivered to the respondent (in person or by
phone). Sample flag variables were also constructed by staff to help users sort the data
by (1) respondent participation in a given survey and, if applicable, their reason for
non-response, or (2) whether the respondent belongs to the nationally-representative or
city-representative sample. The rest of this chapter will highlight specific constructed
paradata variables which are provided in the Year 5 data. For a full list of constructed
variables see Table 9.
9.1. Constructed Variables - Age Ages of the child, parents and primary caregiver are recorded across several different
surveys. Age is recorded in the Core Surveys for mother, father and child through the
constructed variables: cm4age (mother’s age at the interview), cf4age (father’s age at
the interview), cm4b_age and cf4b_age (for the child’s age at the mother and father
interview, respectively).
Below are the constructed variables for age of child and their primary caregiver at the
time of each of the In-Home Activities.
• ch4agemos age of child at time of height and weight measurements, in months
• ch4ppvtage age of child at time of PPVT administration, in months
• ch4ppvtage_m age of PCG at time of PPVT administration, in months
9.2. Constructed Variables - Sample Flags There are two types of sample flags – interview flags and status flags. Interview flags
denote whether a person was interviewed in a particular wave. Status flags provide
other important information about a case at a particular period (non-response reason,
in a particular subsample, etc).
9.2.1. Interview completion flags • cm4mint/cm4fint indicates whether mother/father was interviewed, respectively,
using the mother’s report.
• cf4mint/cf4fint indicates whether mother/father was interviewed, respectively,
using the father’s report.
Cases in which one or more respondents in a family were not interviewed in the current
wave are included in the data file, but are coded “Not in wave” (-9) for all variables
from the survey(s) that were not completed. Therefore, you will need to use these
interview flags to subset out appropriate samples.

25 | P a g e
9.2.2. Status flags • cm4samp and cf4samp provide information on the mother or father’s disposition
status (whether eligible and reasons for non-response, such as
mother/father/child died since previous wave).
• c*4natsm and c*4citsm indicate whether the respondent is in the national
sample and/or the 20-cities sample and was interviewed in the wave.
• cm1innatsm and cm1citsm (from the baseline file) indicate whether the
respondent was part of the national/city sample at baseline (regardless of
whether they were interviewed at any given wave).
Note: There are a small number of cases that do not have weights but have valid
survey data) and there are a small number of cases that have positive weights, but no
survey data because the parent/child was deceased or the child was adopted (see
Appendix B of “Using the Fragile Families Weights” for more information).
• ch4ff5 indicates whether the family participated in the Core Study at Year 5.
• ch4act5 indicates whether the family participated in any activity component in
the In-Home Survey at Year 5.
A handful of mothers provided conflicting information over the waves about who is the
biological father of the child.
• cm4fdiff specifies cases where mother indicated that the biological father of
focal child was a different man than had been indicated at earlier waves and
for whom we had no reason to doubt this information. However, we cannot
determine the accuracy of these reports
At the time of the follow-up interviews, we attempted to interview the mother first. This
was based on the assumption that, if the parents are not living together, the mother
would be easier to locate and would have updated locating information about the
father. There were, however, cases in which the mother was interviewed after the
father. Before comparing mothers’ and fathers’ reports of time sensitive measures (i.e.
relationship status, income), data users should check the time gap between parent
interviews using the cm4tdiff constructed variable.
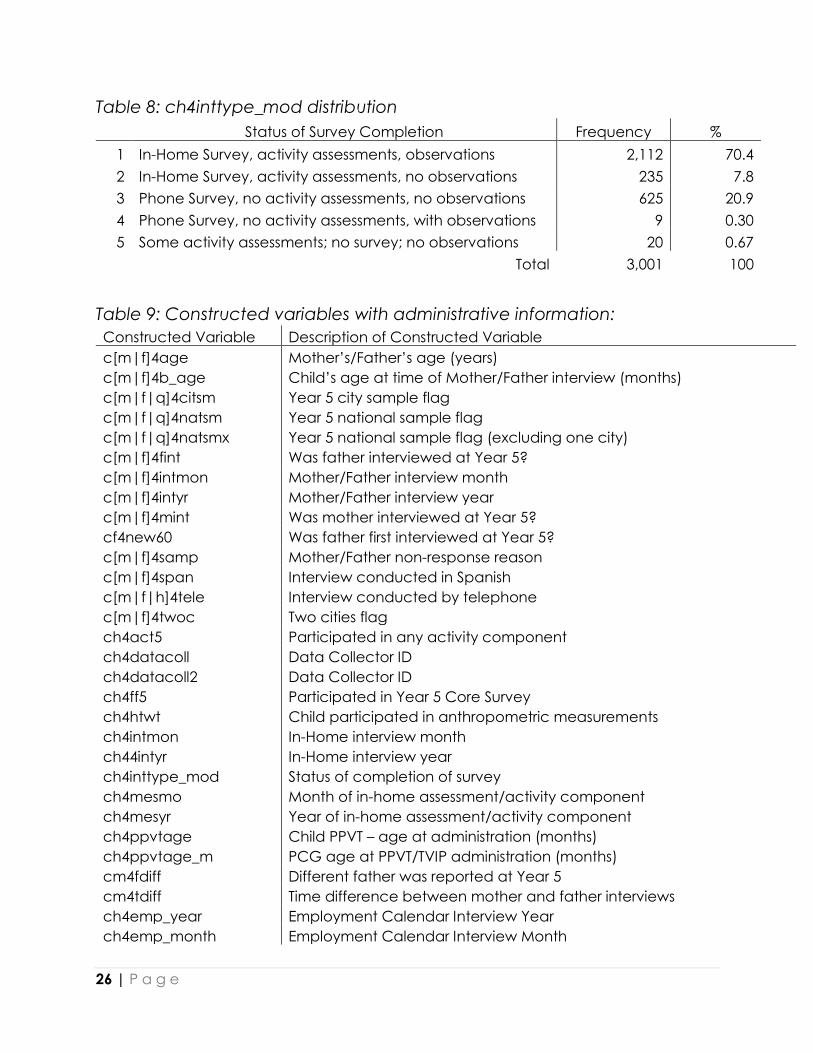
9.3. Constructed Variables - Status of survey completion • ch4inttype_mod was constructed to identify the specific component(s) of the In-
Home Study that a respondent was able to complete.
The variable ch4inttype_mod was created based on the final disposition status, as well
as:
- Information provided to questions in the parent survey,
- Observations of the interviewer,
- Anthropometric measurements, and
- PPVT/TVIP or Woodcock-Johnson test scores in the Activity workbook.
26 | P a g e
Table 8: ch4inttype_mod distribution
Status of Survey Completion Frequency %
1 In-Home Survey, activity assessments, observations 2,112 70.4
2 In-Home Survey, activity assessments, no observations 235 7.8
3 Phone Survey, no activity assessments, no observations 625 20.9
4 Phone Survey, no activity assessments, with observations 9 0.30
5 Some activity assessments; no survey; no observations 20 0.67
Total 3,001 100
Table 9: Constructed variables with administrative information:
Constructed Variable Description of Constructed Variable
c[m|f]4age Mother’s/Father’s age (years)
c[m|f]4b_age Child’s age at time of Mother/Father interview (months)
c[m|f|q]4citsm Year 5 city sample flag
c[m|f|q]4natsm Year 5 national sample flag
c[m|f|q]4natsmx Year 5 national sample flag (excluding one city)
c[m|f]4fint Was father interviewed at Year 5?
c[m|f]4intmon Mother/Father interview month
c[m|f]4intyr Mother/Father interview year
c[m|f]4mint Was mother interviewed at Year 5?
cf4new60 Was father first interviewed at Year 5?
c[m|f]4samp Mother/Father non-response reason
c[m|f]4span Interview conducted in Spanish
c[m|f|h]4tele Interview conducted by telephone
c[m|f]4twoc Two cities flag
ch4act5 Participated in any activity component
ch4datacoll Data Collector ID
ch4datacoll2 Data Collector ID
ch4ff5 Participated in Year 5 Core Survey
ch4htwt Child participated in anthropometric measurements
ch4intmon In-Home interview month
ch44intyr In-Home interview year
ch4inttype_mod Status of completion of survey
ch4mesmo Month of in-home assessment/activity component
ch4mesyr Year of in-home assessment/activity component
ch4ppvtage Child PPVT – age at administration (months)
ch4ppvtage_m PCG age at PPVT/TVIP administration (months)
cm4fdiff Different father was reported at Year 5
cm4tdiff Time difference between mother and father interviews
ch4emp_year Employment Calendar Interview Year
ch4emp_month Employment Calendar Interview Month

27 | P a g e
Constructed Variable Description of Constructed Variable
ch4cc_year Child Care Interview Year
ch4cc_month Child Care Interview Month
ct4data Child’s teacher participated in Kindergarten Survey
ct4kyear Kindergarten Year
ct4teacherage Teacher age at time of survey

28 | P a g e
10. Finances At Year 5, mother, father and PCG, when applicable, were asked questions regarding
their household finances. Table 10 details subtopics within “finances” and in which
surveys they are included. Child support questions include questions regarding the
amount of money the respondent receives or pays in child support, as well as the
frequency of the transaction. The respondent’s earnings (cash, housing, meals, clothes)
are derived from traditional employment, non-traditional employment (includes illegal
activity). Expenses are based on the respondent’s expenses on food and housing. For
questions related to the respondent’s financial assets, the interviewer asks the
respondent about home and vehicle ownership, and savings accounts. The
respondent’s household income is their total household income from all sources in the
last year. Material hardship is the extent to which the respondent experienced hunger,
homelessness, utility shut-off and forgone medical care due to a lack of financial
resources. Private transfers involve financial help the respondent receives from or
provides to family and friends, whereas public transfers/social services relate to financial
help the respondent receives that is government-issued.
Table 10: Subtopics in Finances in Year 5 by survey instrument
Subtopics m f p h o t
Child support X X
Earnings X X
Expenses X X X X
Financial assets X X
Household income/poverty X X
Material hardship X X X
Private transfers X X
Public transfers and social services X X X
10.1. Constructed Variables - Household Income Household income measures were constructed for mothers and fathers, but users
should review the following information regarding the imputation and construction
process carefully before deciding how and whether to use these variables.
• cm4hhinc and cf4hhinc are mother and father’s household income at Year 5,
respectively
• cf4hhincb, an additional father variable, uses mother reports of household
income for married and cohabiting couples
Respondents were asked to provide an exact dollar amount of their household income.
If they could not, they were asked to provide a range. This strategy was effective in
reducing missing data to about 10 percent, although a portion of parents reported a
range rather than an exact dollar amount. In constructing household income
(c*4hhinc), we first imputed dollar amounts for those who reported a range of income
29 | P a g e
(using others who provided income in the same range but provided a detailed amount
of income). Next, we imputed dollar amounts for those with no reported income. Both
imputations included the following covariates: relationship status (mother report), age,
race/ethnicity, nativity, whether employed last year, earnings, total adults in the
household, and whether welfare was received. Imputations for those who reported a
range were based on parent’s own characteristics. Imputations for missing income
were based on both parent’s characteristics for married and cohabiting couples;
otherwise, they were based on parent’s own characteristics.
10.2. Constructed Variables - Household Income Imputation Flags • cm4hhimp, cf4hhimp and cf4hhimpb indicate which parent reported income and
which parents have imputed income (in reference to cm4hhinc, cf4hhinc, and
cf4hhincb, respectively).
Please note that if parents reported a range of income in brackets, they are not
flagged as having imputed data in these flags. Users can examine the raw variables to
determine who had detailed/bracketed data.
10.3. Constructed Variables - Poverty Measures • cm4povco and cf4povco indicate the poverty ratio. The poverty ratio is the ratio of
total household income, as defined in c*4hhinc, to the official poverty thresholds,
designated by the U.S. Census Bureau.
• cm4povca and cf4povca indicate poverty categories by transforming the poverty
ratios into categorical variables.
The thresholds in c*4povca vary by family composition and year. At each wave, we
used the poverty thresholds for the year preceding the interview. We calculated
separate thresholds based on mother and father reports of household size and
composition. However, calculations for married/cohabiting mothers and fathers rely on
mother reports of household size and composition. A small number of missing values
(don’t know, refused) were treated as 0 in household membership counts.
• cf4povcob and cf4povcab are the poverty ratio and categories household income
for married and cohabiting couples (based on cf4hhincb and cf4hhimpb).
The imputation flags created for the household income variables also refer to the
poverty variables.
Please visit https://www.census.gov/topics/income-poverty/poverty/guidance/poverty-
measures.html for detailed information about poverty thresholds.
10.4. Constructed Variables - Food Expenditure • cp4k2_expen is the amount of money (in dollars) families spend for food used at
home per month.
Variable cp4k2_expen was created based on variables p4k2, p4k2_per and p4k2a. The
monthly value was generated by adjusting the amount provided (p4k2) in the time
period given (p4k2_per) to obtain the expense for the whole month. If only a data

30 | P a g e
range was provided (p4k2a), the midpoint value of that range was used in combination
with the corresponding time period in the adjustment. For the computation, a few
missing values of p4k2_per were imputed logically for cases with only data for p4k2.
Missing value of p4k2_per was often replaced by a common time period given for both
p4k4 and p4k5; or the period available only for either p4k4 or p4k5 provided that such
period appeared reasonable for the amount (p4k2) taking into consideration the
number of persons living in the household. Values of p4k2_expen computed based on
an imputed value of p4k2_per were flagged.
• cp4k4_expen is the amount of money (in dollars) families spend for food taken out
or food delivered per month.
Variable cp4k4_expen was created based on variables p4k4, p4k4_per and p4k4a. The
monthly value was generated by adjusting the amount provided (p4k4) in the time
period given for (p4k4_per) to obtain the expense for the whole month. If only a data
range was provided (p4k4a), the midpoint value of that range was used in combination
with the corresponding time period in the adjustment. For the computation, a few
missing values of p4k4_per were imputed logically for cases with only data for p4k4.
Missing value of p4k4_per was often replaced by a common time period given for both
p4k5 and p4k2; or the only period available for either p4k5 or p4k2 provided that such
period appeared as reasonable for the amount (p4k4) taking into consideration the
number of persons living in the household. All values of cp4k4_expen computed based
on imputed value of p4k4_per were flagged.
• cp4k5_expen is amount of money (in dollars) families spend eating out per month.
Variable cp4k5_expen was created based on variables p4k5, p4k5_per and p4k5a. The
monthly value was generated by adjusting the amount provided (p4k5) in the time
period given for (p4k5_per) to obtain the expense for the whole month. If only a data
range was provided (p4k5a), the midpoint value of that range was used in combination
with the corresponding time period in the adjustment. For the computation, a few
missing values of p4k5_per were imputed logically for cases having only data for p4k5.
Missing value of p4k5_per was often replaced by a common time period given for both
p4k4 and p4k2; or the period available only for either p4k4 or p4k2 provided that such
period appeared as reasonable for the amount (p4k5) taking into consideration the
number of persons living in the household. All values of cp4k5_expen computed based
on imputed value of p4k5_per were flagged.
• cp4food_exp is the total amount of money (in dollars) families spend on food per
month.
The value of cp4food_exp is the sum of cp4k2_expen, cp4k4_expen, and cp4k5_expen.
Data users may consider creating a composite variable to also include the value of the
food stamps received (variable p4k1a1 for 18 cities, and m4i8c2/f4i8c2 for the pilot
cities).

31 | P a g e
10.5. Scale – Household Food Security The household food security scale can be constructed based on the data on nutrition
gathered in Section D of the PCG questionnaire. This scale may be interpreted using a
continuous measure or a categorical measure, as seen below:
Source: http://www.ers.usda.gov/briefing/foodsecurity/measurment/index.htm
On occasion “food insecure with hunger” is further divided into: a) food insecure with
hunger – moderate (hunger among adults but not children), and b) food insecure with
hunger – severe (hunger among children and more severe hunger among adults).
Some researchers have established a separate set of three categories to measure
children’s hunger using the eight variables on the scale dealing specifically with
children. The categories used by these researchers are: a) child hunger, b) reduced-
quality diet for children, and c) no child hunger or reduced-quality diet. Specific
response rates corresponding with these three categories are not readily available.

32 | P a g e
10.5.1. Sample Response Rates to Food Security Questions In Table 11, existing studies are compared to FFCWS data at Year 5 (the frequency is
calculated based on those of whom answered or were skipped from these series of
PCG questions at Year 5). In the first column offers nationwide estimates, while the last
column shows data representing poor families with children in four large urban counties.
Table 11: Sample Response Rates to Food Security Questions
1998
ERS/USDA Year 5 PDUC
Variable Question
Andrews
et al. 20006
PCG
Survey
Polit &
Martinez
20007
p4d1a Worried food would run out 12.8 23.1 65.3
p4d1b Food bought didn't last 10.8 16.0 56.2
p4d1c Couldn't afford to eat balanced meals 9.1 9.4 34.8
p4d1d Relied on few kinds of low-cost food to feed children 13.6 15.4 47.9
p4d1e Couldn't feed child(ren) balanced meals 8.4 7.4 29.7
p4d3 Child(ren) were not eating enough 4.4 4.2 17.5
p4d4 Adult(s) cut size of meals or skipped meals 6 7.5 21.4
p4d4a Adult(s) cut size or skipped meals, 3+ months 4.2 4.3 16.7
p4d5 Adult(s) ate less than felt he/she should 5.7 8.2 25.2
p4d6 Adult(s) hungry but didn't eat because couldn't afford 2.6 4.4 14.1
p4d7 Respondent lost weight 1.6 2.1 8.5
p4d9 Adult did not eat for whole day 1.3 1.8 8.7
p4d9a Adult did not eat for whole day, 3+ months 0.9 1.2 6.6
p4d10 Cut size of child(ren)'s meals 1.6 1.8 8.2
p4d11 Child(ren) skipped meal 0.8 0.7 5
p4d11a Child(ren) skipped meals, 3+ months 0.5 0.3 4
p4d12 Child(ren) hungry but couldn't afford more food 1.1 1.2 5.6
p4d13 Child(ren) did not eat food whole day 0.2 0.1 1.6
6 Andrews, Nord, Bickel, and Carlson. “Household Food Security in the United States, 1999.” `] Food Assistance and
Nutrition Research Report No. 8. September 2000.
7 Polit, London, and Martinez. “Food Security and Hunger in Poor, Mother-Headed
Families in Four U.S. Cities.” Source: http://www.mdrc.org/Reports2000/UrbanChange/FoodSecurityHunger.htm May,
2000.

33 | P a g e
10.6. Scale – Material Hardship At Year 5, 13 questions were asked to both mother and father to determine material
hardship. These questions are derived from the “Basic Needs – Ability to Meet
Expenses” section of the Survey on Income and Program Participation (SIPP) 1996 Panel
Wave 8 Adult Well-Being Topical Module Questionnaire8, the 1997 & 1999 New York City
Social Indicators Survey (SIS) (Social Indicators Survey Center, 1997 & 1999), and the
1999 Study of Work, Welfare, and Family Well-Being of Iowa families on FIP (IOWA)
(Iowa’s assistance program).
10.6.1. Variables Mother questions: m4i23a - m4i23m (13 variables)
Father questions: f4i23a - f4i23m (13 variables)
The FFCWS Year 5 Survey includes several material hardship measures that are taken
from the Survey of Income and Program Participation.9 These questions are also similar
to Mayer and Jencks Chicago study of hardship and poverty.10,11
Some of the hardship questions are also derived from the 1997 and 1999 SIS. This study
looks at families and individuals in New York City and monitors changes over time.
Some of the material hardship questions found in the SIS are similar to those found in the
SIPP, such as items referring to not paying bills on time and loss of utilities. Other
questions concern the respondent’s ([m|f]4i23c/p4d6) or his/her child’s
([m|f]4i23b/p4d12) hunger, access to free food ([m|f]4i23a), and the places he/she
has lived ([m|f]4i23i-j), all within the past 12 months and all due to financial difficulties.12
Two additional questions are derived from the IOWA study and ask whether the
respondent has cut back on buying clothes ([m|f]4i23l), and whether the respondent
has worked overtime or taken a second job ([m|f]4i23m). These questions were only
asked in 18-cities. The IOWA study looks at the well-being and financial status of families
who were on FIP assistance in 1999 (and who had at least one parent unemployed for
the previous three months and received unsubsidized employment within the following
three months).
10.6.2. Modifications These “YES/NO” questions are similar to the original questions taken from other surveys,
with a few exceptions. In the SIPP, respondents are asked whether “you/anyone in your
household” had encountered the specified hardship. In the SIS, questions refer to “you
8 Survey on Income and Program Participation: 1996 Panel Wave 8 Adult Well-Being Topical Module Questionnaire.
(1998). Retrieved March 27, 2003, from http://www.sipp.census.gov/sipp/top_mod/1996/quests/wave8/awbook.html 9 Bauman, K. (1998). Direct measures of poverty as indicators of economic need: Evidence from the survey income and
program participation. U.S. Census Bureau Poverty Measurement Papers. Retrieved March 27, 2003, from
http://www.census.gov/population/www/documentation/twps0030/twps0030.html 10 Bauman, K. J. (1999). "Shifting family definitions: The effect of cohabitation and other nonfamily household relationships
on measures of poverty." Demography 36(3):315-325. 11 Mayer, S.E., & Jencks, C. (1989). Poverty and the Distribution of Material Hardship. Journal of Human Resources, 24 (1),
88-114. 12 Social Indicators Survey Center, Columbia University School of Social Work. (1999). 1999 New York City Social Indicators
Survey: Documentation and Codebook, Revised Version.

34 | P a g e
[or your partner].” In W164 of the 1997 SIS, the questions is asked of “you [or your
spouse/partner] [or your child] [or your children].” The corresponding FFCWS Survey
questions refer only to the respondent and not to his/her partner or children.
Note: The FFCWS Year 5 Surveys include only a subset of the hardship questions used in
the SIPP, SIS and IOWA studies.
10.6.3. Scoring There is no established scoring for the material hardship questions included in the Year 5
surveys.
Table 12: Variables on Material Hardship
SIPP
SIS
1997
SIS
1999 IOWA Variable Source item
AW35_NEED1
m4i23d
f4i23d
Was there any time in the past 12 months when you did
not pay the full amount of the rent or mortgage?
AW38_NEED2
m4i23e
f4i23e
In the past 12 months were you evicted from your home
or apartment for not paying the rent or mortgage?
AW41_NEED3
m4i23f
f4i23f
In the past 12 months, did you not pay the full amount of
the gas, oil, or electricity bill?
AW50_NEED6
m4i23k
f4i23k
In the past 12 months was anyone in your household who
needed to see a doctor or go to the hospital but couldn’t
go because cost?
W164
m4i23a
f4i23a In the past 12 months, did you receive free food or meals?
HAR10
m4i23i
f4i23i
In the past 12 months, did you move in with other people
even for a little while because of financial problems?
HAR12 m4i23j
f4i23j
In the past 12 months, did you ever stay at a shelter, in an
abandoned building, an automobile or any other place
not meant for regular housing even for one night?
m4i23h
f4i23h
In the past 12 months, did you borrow money from friends
to help pay bills?
IOWA m4i23l
f4i23l
In the past 12 months have you cut back on buying
clothes for yourself?
IOWA m4i23m
f4i23m
In the past 12 months have you worked overtime or taken
a second job?
m4i23b
f4i23b
p4d6
In the past 12 months, was (child/were the children) ever
hungry, but you couldn’t afford more food?
m4i23c
f4i23c
p4d12
In the past 12 months, were you ever hungry but didn’t
eat because you couldn’t afford enough food?
m4i23g
f4i23b
Was your gas or electric service ever turned off or the
heating oil company did not deliver oil because there
wasn’t enough money to pay the bills?
35 | P a g e
11. Health and Health Behavior At Year 5, questions on health and health behavior were asked to the mother, father,
PCG, and teacher. Within the subtopic of accidents and injuries are questions to the
PCG about the child’s accidents and injuries, why, when and how many times it
occurred. Within disabilities, PCG were asked whether and which kind of disability the
child has (ex: speech problems, Down’s syndrome, cerebral palsy) and the mother and
father are asked whether they take medication for attention deficit disorder. In the
fertility history subtopic, respondents were asked whether they’ve had other children,
how many, with whom and their children’s ages. The health behavior topic covers
observations of the child’s hygiene and clothing as well as the child’s eating and
sleeping habits. Respondents were asked whether and how frequently they smoke
cigarettes. The subtopic health care access and insurance include questions to the
respondent about the frequency and type of health care visits (if they seek counseling,
what type) and the type of insurance they are covered by and through whom they
obtained insurance. Height and weight measurements of the respondent are asked
within the Core Surveys and collected within the activity workbook of the In-Home
Study. Respondents were asked whether they take medication and what they take it
for (ex: asthma, diabetes, anxiety, pain). Mental health questions ask the respondent
about their condition (ex: depression, anxiety) and how pervasive it is (ex: trouble
concentrating, sleeping, weight loss, thoughts of death). Physical health questions
relate to the respondent and the child – in terms of general health, frequency of
hospital visits and limitations that have arisen because of their health condition.
Substance use and abuse questions indicate the extent of the respondent’s drug or
alcohol dependence. Respondents were asked to indicate, if applicable, which drugs
they were taking (ex: sedatives, marijuana, cocaine, hallucinogens) and how many
times their substance use interfered with child care.

36 | P a g e
Table 13: Subtopics in Health and Health Behavior in Year 5
Subtopics m f p h o t
Accidents and injuries X
Disabilities X X X
Fertility history X X X X
Health behavior X X X X
Health care access and insurance X X X
Height and weight X X X X
Medication X X
Mental health X X X X
Physical health X X X X
Sexual health and behavior
Substance use and abuse X X X X
11.1. Constructed Variables - Height and Weight Measurements In the Year 5 Core Survey, both mother and father self-reported their height and weight.
Measurements were also recorded for height and weight of the child and PCG during
the In-Home Survey, within the activity workbook.
11.1.1. Cleaning height and weight data - Children Height and weight measurements in the raw data were examined to assess plausibility
and to identify potential irregularities. About thirty implausible values of height (< 55 cm
or >145 cm) and weight (< 8 kg or > 50 kg) were cross- verified with the survey firm. More
than half of these height values were results of data entry mistakes and were replaced
by the correct value. Records with value changed are: the height of seven children
(initial value = 40 – 43 cm) were actually measured and recorded in inches; the height
of one child (value = 11 cm) was entered without the last digit, which is a zero; and the
weight of three children (400 pounds or more, initially) were entered without a decimal
point to separate the last digit from the first two. Unresolved irregular measurements are
associated with thirteen children with height ranges from 158 to 175.5 centimeters and
a handful of children with weight recorded as slightly below 30 pounds or greater than
115 pounds. These irregular values remained in the data file. In addition, weight values
recorded in pounds were converted to kilograms.
11.1.2. Cleaning height and weight data - PCGs Initial weight and height of the PCG were combined from responses and/or
measurements to the following items in the Activity Workbook:
a3: Interviewer: Is the mother (respondent) currently pregnant? If not pregnant, skip a4
and ask question a5.
a4: Please tell me how much you weighed before you became pregnant (this time).

37 | P a g e
a5: I’d like to weigh you first, and then weigh (child). (If shoes are not off yet). Could you
please take off your shoes? Please step on this scale. If refused or weight exceeded
scale limit then ask question a5a.
a5a. Please tell me your weight (your best estimate is fine).
The initial weight was assigned either as (a) the actual measurement obtained for the
non-pregnant PCG during the survey; or (b) the self-reported weight of the non-
pregnant PCG who refused to be measured or the weight exceeded scale limit; or (c)
the reported weight before pregnancy for pregnant women. Weight values in pounds
were converted to kilograms. A handful of non-pregnant women had both measured
and reported weights. For this situation, if the two numbers were not identical, the
measured weight was retained.
The height of the PCG was the actual measurement obtained during the In-Home
activities or, if not measured, the self-reported height. Height values reported in feet
and inches were converted into centimeters. Obvious implausible height (very short <
100 centimeters or very tall > 200 centimeters) and/or weight values (very large > 180
kilograms or very light < 25 kilograms) were verified with the survey firm. A few of these
values were results of data entry mistakes and were replaced with the correct values. In
addition, a few implausible height measurements (extremely tall or short) were
replaced by the more reasonable height obtained for the first wave of the survey. It
should be noted that a handful of respondents with anthropometric measurements are
not biological mothers of the child.
11.1.3. Constructing Children’s Growth Indices Popular growth indices such as weight for age, height for age, and weight for height
were constructed based on the Center for Disease Control (CDC) 2000 growth curve
using the distributed SAS programs. More details about the growth indices as well as the
SAS programs used can be obtained from the presentation about the growth chart at:
https://www.cdc.gov/nccdphp/dnpao/growthcharts13
11.1.4. Assessing Height and Weight Measurements The three growth indices: height for age, weight for age and weight for height were
used to identify records with implausible measurements. Table 14 presents the number
and proportion of children with plausible measurements as well as children with
implausible or missing measurements.
Table 14: Child Anthropomorphic Flag Values (ch4cflag)
Child Flag Values N %
0 Measures plausible 2.174 92.3
1 Missing weight or height 37 1.6
13 Data included in the CDC Growth charts came from the following surveys: National Health Examination Survey (NHES),
Cycles II and III, National Health and Nutrition Examination Survey (NHANES) I, II, and III, U.S. Vital Statistics, Wisconsin Vital
Statistics, Missouri Vital Statistics, Fels Longitudinal Study, Pediatric Nutrition Surveillance System.

38 | P a g e
2 Missing date of measurement 10 0.4
5 Height implausible (haz < -5 or > 3) 37 1.6
7 Weight for height implausible (whz < -4 or > 5) 7 0.3
8 Weight for height missing based on CDC’s program 89 3.8
2,354 100
11.1.5. Body Mass Index (BMI) The body mass index (variable: ch4cbmi) was computed as the weight in kilograms
divided by the square of the height in meters (kg/m2). The BMI index (variable
ch4cbmi_z) is the BMI index for age, which is gender specific, and was derived based
on the CDC’s growth chart. This index can be used to measure underweight or obesity,
as well as, to assess nutritional deficiency or chronic energy deficiency.
For children with one or more problems listed in Table 14, all related growth indices such
as ch4cbmi, ch4cbmi_z, ch4bmi_p, ch4hap, ch4haz, ch4wap, ch4waz, ch4whp, and
ch4whz were set to missing. It should be noted that the height and weight of the
children with one of more measurement problems, however, remained in the data.
Data users may consider using the indicator variable ch4cflag (problem in child’s
measurements) to exclude records with implausible height (in ch4chtcm) and/or weight
(in ch4cwtkg or ch4cwtlb) from their analyses.
11.1.6. Nutritional Status and Growth Status The National Center for Health Statistics (NCHS) criteria, recommended by the World
Health Organization, were adopted to classify the nutritional status of children based on
their growth indices. Children with a weight for age index (ch4waz) below -2.00 were
considered as malnourished, between - 2.00 and +2.00 as eutrophic, and over +2.00 as
obese as shown in Table 15.
Table 15: Nutritional Status of Children based on Weight for Age Index
(ch4waz)
Status Boy Girl
N % N %
Malnourished 15 1.4 6 0.6
Eutrophic 1,024 92.4 964 91
Obese 70 6.3 95 8.9
Total 1,109 100 1,065 100
In addition, the number and proportion of children with potential growth retardation
are presented in Table 16.
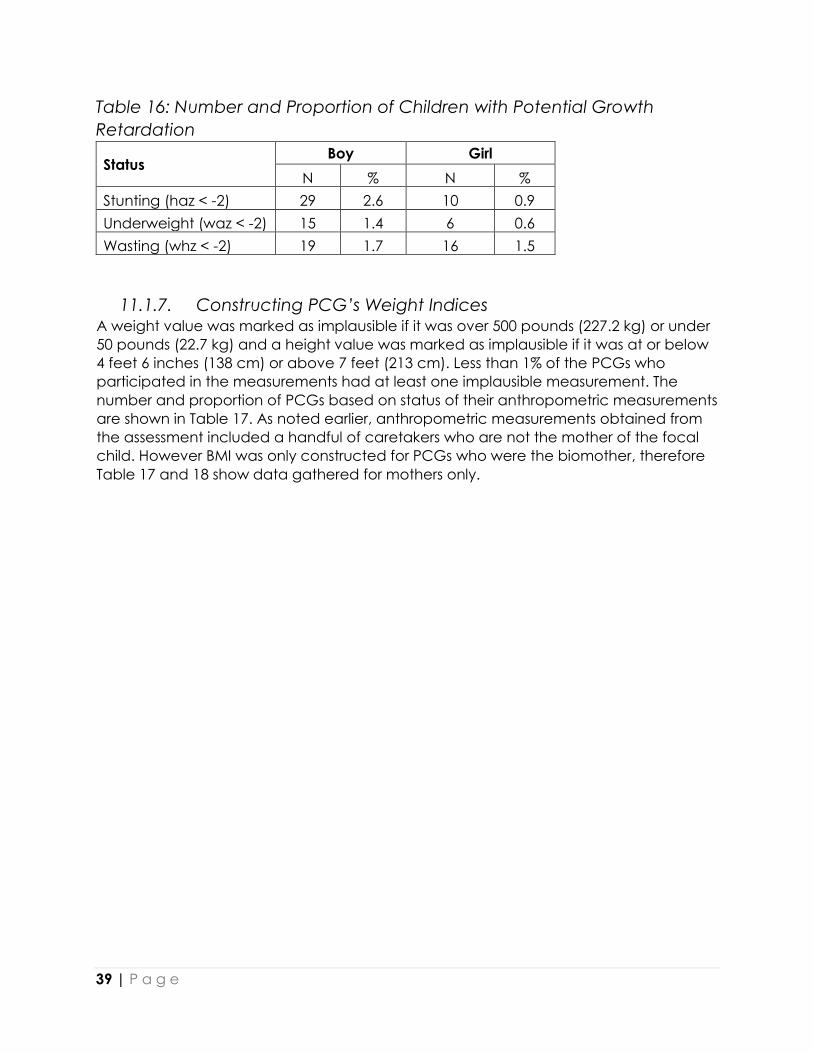
39 | P a g e
Table 16: Number and Proportion of Children with Potential Growth
Retardation
Status Boy Girl
N % N %
Stunting (haz < -2) 29 2.6 10 0.9
Underweight (waz < -2) 15 1.4 6 0.6
Wasting (whz < -2) 19 1.7 16 1.5
11.1.7. Constructing PCG’s Weight Indices A weight value was marked as implausible if it was over 500 pounds (227.2 kg) or under
50 pounds (22.7 kg) and a height value was marked as implausible if it was at or below
4 feet 6 inches (138 cm) or above 7 feet (213 cm). Less than 1% of the PCGs who
participated in the measurements had at least one implausible measurement. The
number and proportion of PCGs based on status of their anthropometric measurements
are shown in Table 17. As noted earlier, anthropometric measurements obtained from
the assessment included a handful of caretakers who are not the mother of the focal
child. However BMI was only constructed for PCGs who were the biomother, therefore
Table 17 and 18 show data gathered for mothers only.

40 | P a g e
Table 17: PCG Anthropomorphic Flag Values (ch4mflag)
PCG Flag Values N %
0 No indices flagged, measures plausible 2,206 94.8
1 Missing weight or height 109 4.7
5 Height implausible (too tall or too short) 12 0.52
6 Weight implausible (too heavy or too light) 1 0.04
2,328 100
The BMI or Quetelet index of the mother was computed as the weight in kilograms
divided by the square value of the height in meters (kg/m2). BMI has been used as a
universal measure of obesity. Value of BMI was set to missing if either height or weight
was determined as implausible. The implausible height or weight values, however,
remained in the data. Data users may consider using the indicator variable ch4mflag to
exclude records having implausible height or weight in the analyses.
The Food and Agriculture Organization (FAO) criteria were used to assess the nutritional
status of the mothers based on the BMI index. Index with value up to 18.69 was
considered as malnourished, between 18.70 and 23.89 as eutrophic, between 23.90
and 28.59 as overweight, and above 28.59 as obese. Table 18 presents the nutritional
status of the mothers based on the body mass index.
Table 18: Nutritional Status of PCG’s BMI
Status N %
Malnourished 58 2.6
Eutrophic 420 19.1
Overweight 605 27.4
Obese 1,122 50.8
Total 2,205 100
Table 19: Constructed variables for height and weight measurements
Constructed Variable Description of Constructed Variable
ch4agemos Age of child (months)
ch4cwtkg Child weight (kilograms)
ch4cwtlb Child weight (pounds)
ch4chtcm Child height (centimeters)
ch4cbmi Child’s Body Mass Index
ch4cbmi_z Z-score of Child’s BMI or Child’s BMI Index
ch4cbmi_p Child’s BMI percentile
ch4mombmi PCG’s Body Mass Index
ch4mombmi_z Z-score of PCG’s BMI
ch4mompreg Indicates whether PCG was pregnant during survey
ch4waz Child’s weight for age standardized (z-score)

41 | P a g e
Constructed Variable Description of Constructed Variable
ch4wap Child’s weight for age percentile
ch4whp Child’s weight for height percentile
ch4haz Child’s height for age standardized (z-score)
ch4hap Child’s height for weight percentile
ch4whp PCG’s weight for height percentile
ch4whz PCG’s weight for height standardized (z-score)
ch4cflag Indicator flag for issues in child’s measurements
ch4mflag Indicator flag for issues in PCG’s measurements
ch4selfwt PCG reported weight (not measured)
ch4selfht PCG reported height (not measured)
ch4mwtkg PCG’s weight (kilograms)
ch4mwtlb PCG’s weight (pounds)
ch4mhtcm PCG’s height (centimeters)
11.2. Constructed Variables - Accidents occurred to the child • cp4accdt number of accidents occurred to the child
cp4accdt is based on the recollection of the PCG when being asked about the three
most-recent accidents happened to the child. This was created by totaling the
affirmative responses provided for a series of questions about the accidents listed under
item a21 in the instrument used for the PCG survey.
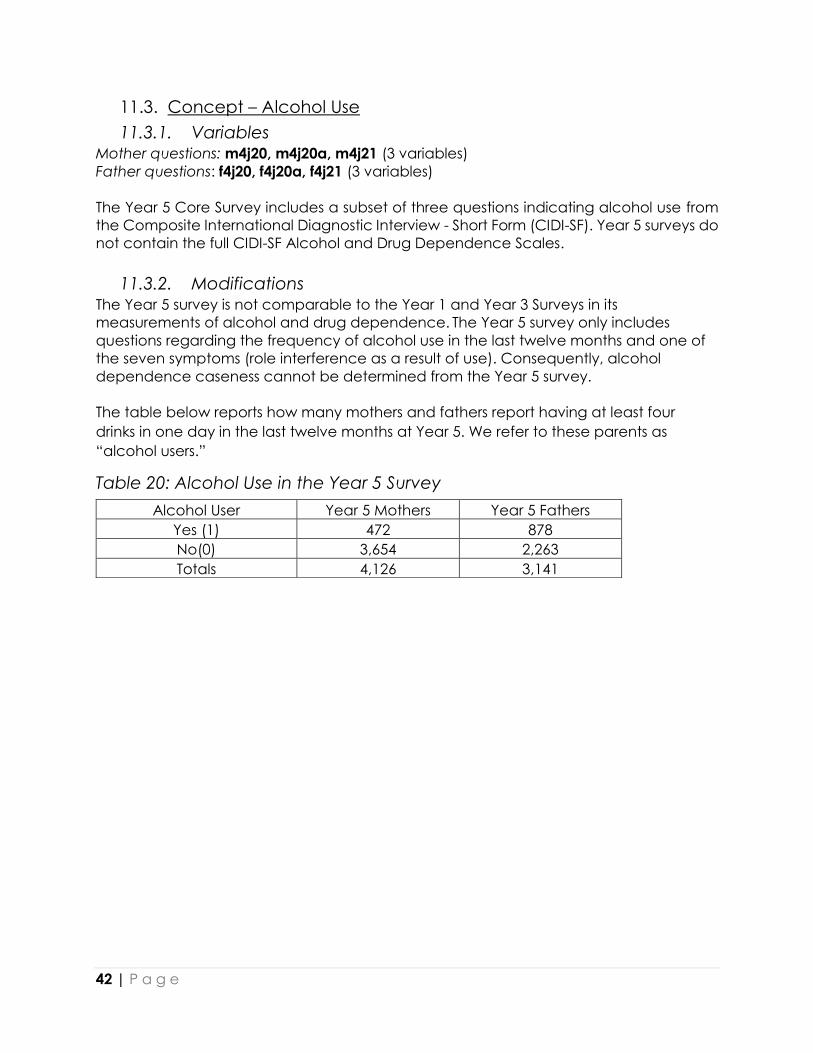
42 | P a g e
11.3. Concept – Alcohol Use
11.3.1. Variables Mother questions: m4j20, m4j20a, m4j21 (3 variables)
Father questions: f4j20, f4j20a, f4j21 (3 variables)
The Year 5 Core Survey includes a subset of three questions indicating alcohol use from
the Composite International Diagnostic Interview - Short Form (CIDI-SF). Year 5 surveys do
not contain the full CIDI-SF Alcohol and Drug Dependence Scales.
11.3.2. Modifications The Year 5 survey is not comparable to the Year 1 and Year 3 Surveys in its
measurements of alcohol and drug dependence. The Year 5 survey only includes
questions regarding the frequency of alcohol use in the last twelve months and one of
the seven symptoms (role interference as a result of use). Consequently, alcohol
dependence caseness cannot be determined from the Year 5 survey.
The table below reports how many mothers and fathers report having at least four
drinks in one day in the last twelve months at Year 5. We refer to these parents as
“alcohol users.”
Table 20: Alcohol Use in the Year 5 Survey
Alcohol User Year 5 Mothers Year 5 Fathers
Yes (1) 472 878
No(0) 3,654 2,263
Totals 4,126 3,141

43 | P a g e
11.4. Concept – Drug Use
11.4.1. Variables Mother questions: m4j22a, m4j22b, m4j22c, m4j22d, m4j22e, m4j22f, m4j22g, m4f22h,
m4f22i, m4f22j, m4j22k, m4j23
Father questions: f4j22a-f4j22k; f4j23
The Year 5 Core Survey includes a subset of 11 questions indicating drug use from the
Composite International Diagnostic Interview - Short Form (CIDI-SF). Year 5 Core surveys
do not contain the full CIDI-SF Alcohol and Drug Dependence Scales.
11.4.2. Modifications The Year 5 Core surveys only include questions regarding the use of the 9 drugs and 1 of
the 7 symptoms (role interference as a result of use). Consequently, drug dependence
caseness cannot be determined. The surveys include an additional question regarding
how often each parent used any of the drugs in the past 12 months. Table 21 reports
how many mothers and fathers report using any drugs in the last twelve months at Year
5. Table 22 reports the average number of drugs used by parents who reported drug
use.
Table 21: Drug Use in the Year 5 Survey
Table 22: Average Number of Drugs Used Among Drug Users
Drug User Year 5 Mothers Year 5 Fathers
Yes (1) 224 369
No(0) 3,915 2,790
Totals 4,139 3,159
Year 5 Mothers Year 5 Fathers
# of Drugs Used (average) 1.37 1.38
(standard deviation) (0.85) (0.85)
Total Users 224 369
44 | P a g e
11.5. Scale – Mental Health Depression (CIDI-SF)
11.5.1. Variables Mother questions: m4j5-m4j12; m4j13-m3j13a; m4j14-m4j14a; m4j15-m4j17 (15
variables)
Father questions: f4j5-f4j12; f4j13-f3j13a; f4j14-f4j14a; f4j15-f4j17 (15 variables)
Constructed: cm4md_case_lib/cf4md_case_lib mother/father meets depression criteria
(liberal); cm4md_case_con and cf4md_case_con mother/father meets depression
criteria (conservative)
The Major Depressive Episode questions from the Year 5 Core Survey are derived from
the Composite International Diagnostic Interview - Short Form (CIDI-SF), Section A.14 The
short form of the CIDI interview takes a portion of the full set of CIDI questions and
generates from the responses the probability that the respondent would be a “case,”
(i.e., a positively diagnosed respondent), if given a full CIDI interview.
The CIDI questions are consistent with the Diagnostic and Statistical Manual of Mental
Disorders – Fourth Edition (DSM-IV).15 The CIDI is a standardized instrument for assessment
of mental disorders intended for use in epidemiological, cross-cultural, and other
research studies.
Respondents are asked whether they have had feelings of dysphoria (depression) or
anhedonia (inability to enjoy what is usually pleasurable) in the past year that lasted for
two weeks or more, and if so, whether the symptoms lasted most of the day and
occurred every day of the two week period. If so, they were asked more specific
questions about: 1) losing interest, 2) feeling tired, 3) change in weight, 4) trouble
sleeping, 5) trouble concentrating, 6) feeling worthless, and 7) thinking about death.
11.5.2. Modifications All of the essential CIDI-SF questions to score a major depressive episode are included in
the Year 5 survey. A few questions are omitted. These omitted questions deal with
persistence, recency, and impairments associated with major depression and the
subject's contact with a health care provider or other professional. The omitted
questions play no part in generating predicted probabilities for the presence of
disorders.16
14 Kessler, R.C., Andrews, G., Mroczek, D., Ustun, T.B., & Wittchen, H.U. (1998). The World Health Organization Composite
International Diagnostic Interview Short-Form (CIDI-SF). International Journal of Methods in Psychiatric Research, 7, 171-
185. 15 American Psychiatric Association (1994). Diagnostic and statistical manual of mental disorders, Fourth Edition.
Washington, DC: American Psychiatric Association. 16 Walters, E.E., Kessler, R.C., Nelson, R.C., & Mroczek, D. (2002). Scoring the World Health Organization's Composite
International Diagnostic Interview Short Form (CIDI-SF; Dec 2002). For a copy of this memo please contact
45 | P a g e
11.5.3. Scoring Information Note: The scoring procedures described below rely primarily on memos issued by Kessler
and Mroczek in 1994 and 199717. In 2002, Walters et al. issued “Scoring the World Health
Organization’s Composite International Diagnostic Interview Short Form" which
recommends scoring procedures that differ in two respects. In the following, we note
where the procedures used to identify major depression in the FFCWS respondents
deviate from the 2002 version. When procedures are consistent, language is taken
directly from the 2002 scoring guide.
Section A of the CIDI-SF is used to classify respondents according to the criteria for a
DSM-IV major depressive episode. No distinction is made between respondents with
major depressive disorder, major depressive episodes that occur as part of a bipolar
disorder, or major depressive episodes that occur in the course of psychotic disorders.
There are two ways to meet the diagnostic stem requirement for Major Depression (MD)
either:
1) to endorse all questions about having two weeks of dysphoric mood (J5-J6-J7) or
2) to endorse all questions about having two weeks of anhedonia (J9-J10-J11)
Consistent with the procedures described by Kessler and Mroczek, each series requires
the respondent to report two weeks of symptoms lasting at least about half of the day
(J6, J10) and almost every day (J7, J11).
Either denying the existence of the symptom or denying persistence leads to a skip, and
the respondent receives a probability of caseness equal to zero. If respondents
endorsed the dysphoric stem, they were not asked the anhedonia stem questions.
Note that the scoring instructions issued by Walters et al. creates more stringent
conditions for endorsing the stem; respondents must report the two weeks of symptoms
last at least “most of the day” in questions J6 and J10. As a consequence, the
approach used here results in more respondents endorsing the stem than would
endorse if the 2002 revisions were employed.
If the respondent endorses the diagnostic stem series, an additional seven symptom
questions are asked:
1) losing interest (J8=1, only if the stem involves dysphoria; the anhedonia stem
question J9=1 should be counted when the anhedonia stem is endorsed),
2) feeling tired (J12=1),
3) change in weight greater than or equal to 10 pounds (J13=1, 2, or 3 and
J13A>=10),
4) trouble with sleep (J14=1 and J14A=1 or 2),
5) trouble concentrating (J15=1),
6) feeling down (J16=1), and
17 Personal communications from Ron Kessler and Dan Mroczek, “Scoring the UM-CIDI Short Forms,” revised 2/22/94, and
“UM-CIDI Short Form 03.20/97, Kessler and Mroczek – DSM-IV Version.”
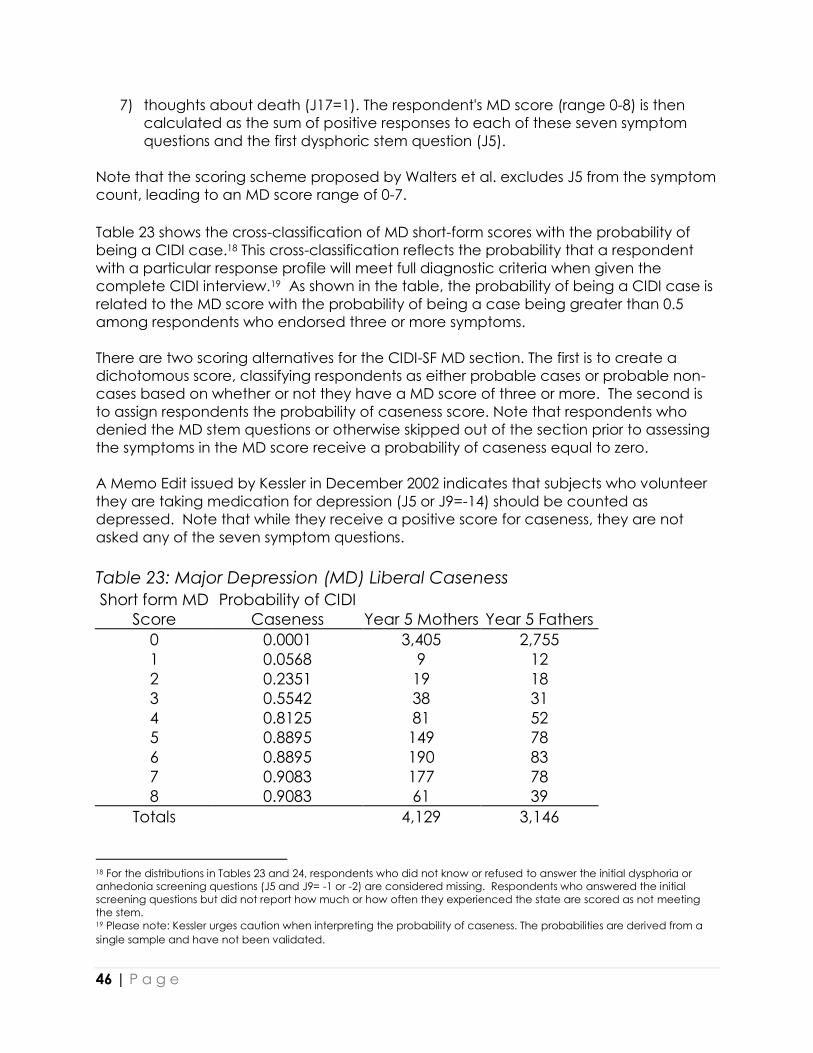
46 | P a g e
7) thoughts about death (J17=1). The respondent's MD score (range 0-8) is then
calculated as the sum of positive responses to each of these seven symptom
questions and the first dysphoric stem question (J5).
Note that the scoring scheme proposed by Walters et al. excludes J5 from the symptom
count, leading to an MD score range of 0-7.
Table 23 shows the cross-classification of MD short-form scores with the probability of
being a CIDI case.18 This cross-classification reflects the probability that a respondent
with a particular response profile will meet full diagnostic criteria when given the
complete CIDI interview.19 As shown in the table, the probability of being a CIDI case is
related to the MD score with the probability of being a case being greater than 0.5
among respondents who endorsed three or more symptoms.
There are two scoring alternatives for the CIDI-SF MD section. The first is to create a
dichotomous score, classifying respondents as either probable cases or probable non-
cases based on whether or not they have a MD score of three or more. The second is
to assign respondents the probability of caseness score. Note that respondents who
denied the MD stem questions or otherwise skipped out of the section prior to assessing
the symptoms in the MD score receive a probability of caseness equal to zero.
A Memo Edit issued by Kessler in December 2002 indicates that subjects who volunteer
they are taking medication for depression (J5 or J9=-14) should be counted as
depressed. Note that while they receive a positive score for caseness, they are not
asked any of the seven symptom questions.
Table 23: Major Depression (MD) Liberal Caseness
Short form MD
Score
Probability of CIDI
Caseness Year 5 Mothers Year 5 Fathers
0 0.0001 3,405 2,755
1 0.0568 9 12
2 0.2351 19 18
3 0.5542 38 31
4 0.8125 81 52
5 0.8895 149 78
6 0.8895 190 83
7 0.9083 177 78
8 0.9083 61 39
Totals 4,129 3,146
18 For the distributions in Tables 23 and 24, respondents who did not know or refused to answer the initial dysphoria or
anhedonia screening questions (J5 and J9= -1 or -2) are considered missing. Respondents who answered the initial
screening questions but did not report how much or how often they experienced the state are scored as not meeting
the stem. 19 Please note: Kessler urges caution when interpreting the probability of caseness. The probabilities are derived from a
single sample and have not been validated.
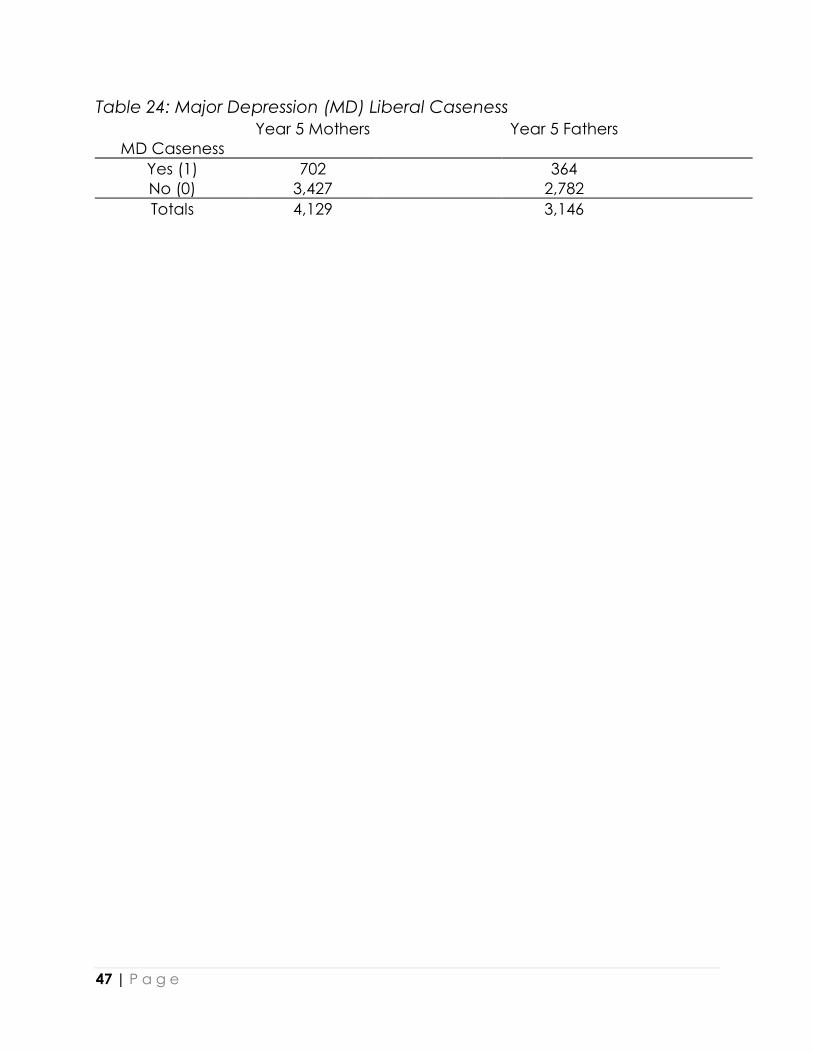
47 | P a g e
Table 24: Major Depression (MD) Liberal Caseness
MD Caseness
Year 5 Mothers
Year 5 Fathers
Yes (1) 702 364
No (0) 3,427 2,782
Totals 4,129 3,146

48 | P a g e
11.6. Scale – Family Mental Health History
11.6.1. Variables Mother questions:
- About mother’s biological father: m4j26, m4j26a, m4j26b, m4j27, m4j27a,
m4j27b, m4j28, m4j28a, m4j28b, m4j29, m4j29a, m4j29b
- About mother’s biological mother: m4j31, m4j31a, m4j31b, m4j32, m4j32a,
m4j32b, m4j33, m4j33a, m4j33b, m4j34, m4j34a, m4j34b
Father questions:
- About father’s biological father: f4j26, f4j26a, f4j26b, f4j27, f4j27a, f4j27b, f4j28,
f4j28a, f4j28b, f4j29, f4j29a, f4j29b
- About father’s biological mother: f4j31, f4j31a, f4j31b, f4j32, f4j32a, f4j32b, f4j33,
f4j33a, f4j33b, f4j34, f4j34a, f4j34b
The questions on family mental health history (addressing the mental health of the
FFCWS respondents’ mothers and fathers) are derived from the National Comorbidity
Survey (NCS). The NCS is a collaborative epidemiological investigation designed to
study the prevalence and correlates of DSM III-R disorders and patterns and correlates
of service utilization for these disorders. The NCS was the first survey to administer a
structured psychiatric interview to a nationally representative sample.
A two-phase sample design was used in the NCS. The questions in the FFCWS Surveys
derive from Part II of the NCS survey.20 The Part II interview contained a section
evaluating the history of five psychiatric disorders in respondents’ natural mothers and
fathers. The five disorders are: major depression (MD), generalized anxiety disorder
(GAD), antisocial personality disorder (ASP), alcohol abuse/dependence (AAD), and
drug abuse/dependence (DAD).21 The FFCWS survey does not incorporate the
questions on ASP. Like the NCS, FFCWS also addresses attempted suicide.
11.6.2. Modifications Aspects of the Family History questions that are part of the NCS have been altered in
the FFCWS Survey. Specifically, the FFCWS survey asks the preliminary questions
regarding the respondent’s family history but does not include subsequent questions
which evaluate the symptoms and social problems associated with the disorders (X3,
X6, X8, X11, X16, X19, X20-25, X29, X32, X34, X37, X42, X45 and X46-51).
11.6.3. Scoring Those questions which were omitted are critical to the scoring of the NCS, and therefore
exclude the possibility of a comparable scoring procedure for the FFCWS study.22 One
20 The NCS survey instrument is available at http://www.hcp.med.harvard.edu/ncs/Baseline_NCS.php . Section X
contains family history questions used in Fragile Families. 21 Kendler, K.S., Davis, C.G., Kessler, R.C. (1997). The familial aggregation of common psychiatric and substance use
disorders in the National Comorbidity Survey: a family history study. British Journal of Psychiatry 170:541- 548 22 For a description of procedures used to score MD, AAD, ASP and DAD in the NCS, see Endicott J., Andreasen, N. and
Spitzer, R. L. (1978) Family History Research Diagnostic Criteria. New York: Biometrics Research Department, New York
State Psychiatric Institute. For a description of procedures used to score GAD, see Kendler, K.S., Neale, M. C. Kessler, R.
C., et. Al. (1992)

49 | P a g e
potential approach is to treat responses as symptom counts and simply sum them,
however we make no official recommendations on how to score these items.

50 | P a g e
12. Cognitive and Behavioral Assessments In Year 5 assessments were administered to the primary caregiver (PPVT or TVIP) and/or
child (PPVT/TVIP and Woodcock-Johnson) in order to describe their cognitive ability.
Survey questions regarding cognitive and behavioral development were also asked of
the mother, father, PCG, and teacher and included questions about impulsivity,
internalizing behavior, externalizing behavior, delinquency and time-use. The following
table displays in which survey one might find variables related to cognitive and
behavioral development.
Table 25: Subtopics in Cognitive and Behavioral Assessments in Year 5
Subtopics m f p h o t
Behavior X X X X X X
Cognitive Skills X
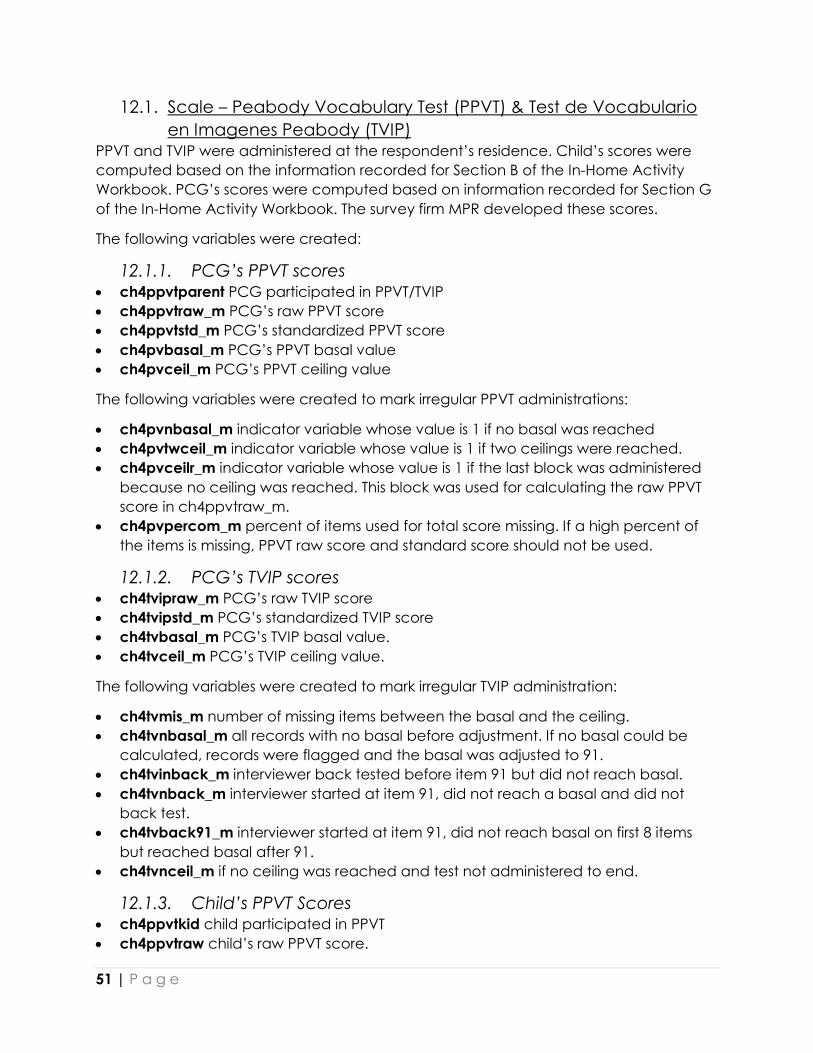
51 | P a g e
12.1. Scale – Peabody Vocabulary Test (PPVT) & Test de Vocabulario
en Imagenes Peabody (TVIP) PPVT and TVIP were administered at the respondent’s residence. Child’s scores were
computed based on the information recorded for Section B of the In-Home Activity
Workbook. PCG’s scores were computed based on information recorded for Section G
of the In-Home Activity Workbook. The survey firm MPR developed these scores.
The following variables were created:
12.1.1. PCG’s PPVT scores • ch4ppvtparent PCG participated in PPVT/TVIP
• ch4ppvtraw_m PCG’s raw PPVT score
• ch4ppvtstd_m PCG’s standardized PPVT score
• ch4pvbasal_m PCG’s PPVT basal value
• ch4pvceil_m PCG’s PPVT ceiling value
The following variables were created to mark irregular PPVT administrations:
• ch4pvnbasal_m indicator variable whose value is 1 if no basal was reached
• ch4pvtwceil_m indicator variable whose value is 1 if two ceilings were reached.
• ch4pvceilr_m indicator variable whose value is 1 if the last block was administered
because no ceiling was reached. This block was used for calculating the raw PPVT
score in ch4ppvtraw_m.
• ch4pvpercom_m percent of items used for total score missing. If a high percent of
the items is missing, PPVT raw score and standard score should not be used.
12.1.2. PCG’s TVIP scores • ch4tvipraw_m PCG’s raw TVIP score
• ch4tvipstd_m PCG’s standardized TVIP score
• ch4tvbasal_m PCG’s TVIP basal value.
• ch4tvceil_m PCG’s TVIP ceiling value.
The following variables were created to mark irregular TVIP administration:
• ch4tvmis_m number of missing items between the basal and the ceiling.
• ch4tvnbasal_m all records with no basal before adjustment. If no basal could be
calculated, records were flagged and the basal was adjusted to 91.
• ch4tvinback_m interviewer back tested before item 91 but did not reach basal.
• ch4tvnback_m interviewer started at item 91, did not reach a basal and did not
back test.
• ch4tvback91_m interviewer started at item 91, did not reach basal on first 8 items
but reached basal after 91.
• ch4tvnceil_m if no ceiling was reached and test not administered to end.
12.1.3. Child’s PPVT Scores • ch4ppvtkid child participated in PPVT
• ch4ppvtraw child’s raw PPVT score.

52 | P a g e
• ch4ppvtstd child’s standardized PPVT score.
• ch4pvbasal child’s PPVT basal value
• ch4pvceil child’s PPVT ceiling value
The following variables were created to mark irregular administrations:
• ch4pvtwceil indicator to identify if two ceilings were reached.
• ch4pvnceil no ceiling was reached.
• ch4pvceilr last block administered if no ceiling was reached. This block was used for
calculating ch3ppvtraw.
• ch4pvpercom percent of items for total score missing. If a high percent of the items
is missing, total raw and standard score should not be used.
12.1.4. Scoring PPVT & TVIP The following section provides information on how PPVT/TVIP scores (basal, ceiling, raw
and standardized) were constructed. The raw data used to construct these variables is
not released in public FFCWS data
This explanation focuses on scoring and assumes some familiarity with the PPVT test
materials and basic administration. Technical information (test construction and
standardization, norm development, reliability and measurement error, and validity) is
covered at length in Part 3 of the Examiner's Manual.23 It will be helpful to refer to the
"Practice Exercises Worksheet" on page 27.
Part 1: Calculating a raw score
There are two parts of this process, a) establishing a Basal and b) calculating a Ceiling.
Establishing a Basal - The Basal is the lowest set of items administered containing fewer
than two errors. For the Year 5 In-Home Survey, respondents fell into two categories: the
children, who were in the "age 2.6 - 3" category and therefore started with item one
(the first set is always their basal); and the PCGs, who were in the "ages 17 - adult"
category and therefore began with item 145 on set 13. This set did not necessarily set
the adult's Basal; if she/he made more than one error in the set (items 145-156) the
examiner administered lower sets (set 12, set 11, etc.) until the respondent completed a
set with no more than one error – this set was then the respondent's Basal (set 13 was an
adult's Basal if she completed the set with no errors or one error).
Calculating the Ceiling – Once a Basal was established, the examiner administered
higher sets of items until the respondent (child or adult) made eight or more errors in a
set. The examiner always completed administering a set of items, even if the
respondent made eight errors before all items in the set have been administered. The
highest set administered containing eight or more errors was the Ceiling Set; the last
item in this set was the "Ceiling Item." N.B. This can be confusing – for example, if an
adult began with set 13, made eight errors (no Basal) and was therefore given set 12,
where he also made eight errors, then he moved to set 11, at which point the adult
23 Dunn, L.M. and L.M. Dunn (1997). Examiner's Manual for the Peabody Picture Vocabulary Test, Third Edition. American
Guidance Services, Inc.
53 | P a g e
completed this set without making any errors (establishing a Basal), his Ceiling Set was
13, not 12, and the Ceiling Item was 156.
Once Basal and Ceiling Sets are established, calculating the raw score is a
straightforward process: add up all errors in every set that was administered and then
subtract the total from the ceiling item. There are several practice exercises in the
examiner's manual that illustrate both simple and more complex scoring scenarios.
Part 2: I have a raw score. Now what?
A Norms Booklet included with the PPVT Test Kit includes a set of tables for easy
conversion from raw scores to standard score equivalents by age, percentile ranks,
normal curve equivalents, stanines, and age equivalents. The Examiner's Manual also
provides directions for how to obtain reliability confidence bands for most of these
measures. As noted earlier, the Examiner's Manual, Part 2, Section D (pp. 26-35) provides
a set of exercises that can help curious minds learn how to determine Basal and Ceiling
Sets, calculate raw scores, locate and record normative scores, and estimate reliability
confidence bands.
There are two parallel PPVT-III forms, IIIA and IIIB. For the pilot, we used only IIIA.
Part 3: Great. So what about the TVIP?
Test de Vocabulario en Imagenes Peabody (TVIP) is a measure of receptive vocabulary
for Spanish-speaking children and adolescents. It was developed from parallel forms of
a past edition of the PPVT using the most appropriate items for the Spanish population.
You cannot directly correlate the PPVT and TVIP because they were normed on
separate populations in different languages.
In contrast to the PPVT's 408 items (204 on form IIIA and 204 on form IIIB), the TVIP offers a
single form with 125 items. It is appropriate for ages 2.5-18, while the PPVT includes
national norms for ages 2.5-90+.
Scoring for the TVIP differs from scoring for the PPVT in several important ways. The most
important are the following: a) a Basal for the TVIP is the highest eight consecutive
correct responses; and b) the Ceiling is the lowest eight consecutive responses
containing six errors. To help understand these basic rules, several illustrative examples
are included on pp. 15-23 of the TVIP Examiner's Manual – English Edition.24
There will be several sources of confusion as a result of these differences for those
familiar with only the rules for scoring the PPVT. For one, in the TVIP only errors made
after the Basal are included in the error count used in determining the raw score
(contrast with the PPVT rules that you must use the lowest Basal Set and include errors in
every set that has been administered). The rule governing Ceilings is also a bit awkward
in that without "sets" per se the examiner must constantly look at the current question as
well as the preceding seven items to determine when the respondent has answered six
of eight items incorrectly. Also, without pre-established "sets," as soon as a respondent
24 Dunn, L.M., E.R. Padilla, D.E. Lugo, and L.M. Dunn (1986). Examiner's Manual for the Test de Vocabulario en Imagenes
Peabody: Adaptacion Hispanoamericana (English-Language Edition). American Guidance Services, Inc.

54 | P a g e
gets one of the first eight items wrong, the interviewer must backtrack question by
question until the respondent puts together a string of eight correct responses to
establish a Basal. Thankfully, with the Basal and Ceiling established, the raw score is
calculated as with the PPVT: Ceiling Item minus errors (remember, the TVIP only uses
errors above the Basal) equals raw score.
More technical information for the PPVT-III is and TVIP is available online.

55 | P a g e
12.1.5. Scale – Woodcock Johnson Letter-Word Identification Test (W-
J Test 22)Variables • ch4wjraw22 Total items correctly answered (item c1 to c57 under Activity C in
the workbook).
• ch4wjsc22 W-J total score which is a conversion from the total raw score
(ch4wjraw22) in order to derive other scores or measures.
• ch4wjrmi22 Relative mastery index or the proportion that the child can do
(based on the W-J test) relative to 90% of the children of his or her age.
• ch4wjss22 W-J standard score which is an important and most useful number. It is
a statistically derived number that describes an individual’s performance relative
to peers of the same age.
• ch4wjpr22 W-J percentile rank. Value of this variable provides the same
information as standard score expressed in a percentage. This is used to rank an
individual relative to his/her age peers.
The Woodcock-Johnson Letter-Word Identification Test or Test 22 (W-J Test 22)25 was
administered to the focal child during the In-Home Activities. Scores were derived on
the raw score recorded for each item c1-c57 included for Activity C in the activity
workbook.
The first 5 items of this subtest include symbolic learning, or the ability to match
a pictorial representation of a word with an actual picture of the object. The
remaining 52 items (total = 57) assess the child's reading skills in identifying
isolated letters and words that are presented in large type on the subject's side
of the test book. The items are arranged in order of difficulty, with the easiest
items presented first and the most difficult items last.
12.1.6. Scoring This section describes how the constructed variables listed above were constructed.
Only the constructed scores, not raw data points, are included in the Year 5 file for the
W-J Test 22.
W-J Test 22 has standardized scoring protocols. It was designed to provide a normative
score that shows the child’s ability to recognize letters and words, as well as, the match
skills in comparison to the national average performance of children of similar ages. The
normed scores are constructed based on the focal child’s raw score on the test (the
number of correct items completed) and the child’s age, to the nearest month, at time
of assessment. Raw scores are charted on normative tables based on the child’s age
and what percentile the child falls into.
The first step in creating standardized test scores for the W-J Test 22 was to compute the
total raw score, based on the number of items answered correctly. The second step
was to calculate the subjects’ age at the time of testing. This was accomplished by
25 Woodcock, R. W., McGrew, K. S., & Mather, N. (2001). Woodcock-Johnson III Tests of Achievement. Itasca, IL: Riverside
Publishing.

56 | P a g e
subtracting their birth date from the assessment date and then converting the
difference in days to age in months. Total raw score and age were then entered into
the Woodcock Compuscore and Profile software to generate the normative score and
related statistics. In the process, the raw score of the test was matched to an
intermediate number known as the W Score. The intermediate step allowed
standardization across the different forms, if used, for the W-J battery of tests. The W
Score was then compared against the Reference W Score, which is the average W
Score for a child in the age group.
57 | P a g e
12.2. Scale – Sustained Attention Task (Leiter-R) During the Year 5 In-Home Study, interviewers administered the sustained attention task
from the Leiter International Performance Scale (Leiter-R). The task assesses children’s
ability to maintain attention on specific stimuli over time,26 and includes two aspects of
sustained attention—focused attention and lack of impulsivity.27,28
For this task, children were shown a picture booklet with a variety of different objects
placed throughout the page. There is a target picture at the top of each page and
the goal of the task is to put a line through as many of the target pictures as possible
within the allotted time, taking care not to erroneously cross out a non-target object.
12.2.1. Variables • ch4lr_age Age of child at assessment
• ch4lr_totmarkd Total number of marks
• ch4lr_totcorrt Total number correct
• ch4lr_toterror Total number errors
• ch4lr_adjcorrt Adjusted total correct
• ch4lr_corscor Total correct scaled score (Focused Attention)
• ch4lr_errscor Total errors scaled score (Lack of Impulsivity)
• ch4lr_adjscor Adjusted total correct scaled score
• ch4lr_diffscor Difference score (potential ADD/ADHD problem)
12.2.2. Scoring The Leiter-R variables were constructed using 3 steps. See articles cited above by
Martin, Razza, and Brooks-Gunn, and Razza, Martin, & Brooks-Gunn for examples of how
to use focused attention and lack of impulsivity variables.
Step 1: Scoring
This section describes how the constructed variables listed above were constructed.
Only the constructed scores, not raw data points, are included in the Year 5 file for the
Leiter-R.
The total number of marks on each page was counted for all four parts.
Four raw scores were calculated:
1. total number of marks (ch4lr_totmarkd) - a sum of ALL marks across the four parts
(from a above)
2. total number correct (ch4lr_totcorrt) - a sum of CORRECT marks across the four
parts (from b above)
3. total number of errors (ch4lr_toterror)- this is a sum of all errors and is calculated as
follows: ch4lr_toterror = ch4lr_totmarkd – ch4lr_totcorrt
26 Roid, G. H., Miller L. J. Leiter International Performance Scale--Revised. Wood Dale, IL: Stoelting; 1997 27 Martin, A., Razza, R. A., & Brooks-Gunn, J. (2012). Sustained attention at age 5 predicts
attention-related problems at age 9. International Journal of Behavioral Development, 36(6), 413-419. 28 Razza, R. A., Martin, A., & Brooks-Gunn, J. (2010). Associations among family
environment, sustained attention, and school readiness for low-income children. Developmental Psychology, 46(6), 1528-
1542.
58 | P a g e
4. adjusted correct (ch4lr_adjcorrt) – this is the total number correct adjusted for the
total number of errors and is calculated as follows: ch4lr_adjcorrt = ch4lr_totcorrt -
ch4lr_toterror
Step 2: Scaling:
The raw scores from Step 1 are converted into standardized scores
Scaling requires the following information:
1. the three scores calculated in #2-4 above (ch4lr_totcorrt, ch4lr_toterror,
ch4lr_adjcorrt)
2. the child’s chronological age on the day of the assessment
3. the scaling tables (Appendix B & C) from the Leiter examiner’s manual
The following three scaled scores are derived using the above information:
1. adjusted correct scaled score (ch4lr_adjscor) – this is the scaled score that is
typically reported in the literature. To obtain this value:
- open Appendix B of the Leiter examiner’s manual and find the age-
appropriate table (i.e., Table B-13 for children 4 years, 0 months through 4
years, 2 months)
- under the column heading “Attention Sustained” find the row with the
ch4lr_adjcorrt (#4 under Step 1) score value for that child (i.e., a raw score of
20 falls within the row for “19-22”)
- look across the row to the “Scaled Score” column and record the value at
the intersection of this column and the appropriate row (i.e., in this example,
the ch4lr_adjscor is “9”)
2. total correct scaled score (ch4lr_corscor) – this is the first of two scaled scores used
for clinical diagnosis. To obtain this value, follow these steps:
- open Appendix C of the Leiter examiner’s manual and find the age-
appropriate table (i.e., Table C1.13 for children 4 years, 0 months through 4
years, 2 months)
- under the column heading “Atten Sustain. Total Correct” find the row with the
ch4lr_totcorrt (#2 under Step 1) score value for that child (i.e., a raw score of
15 falls within the row for “13-16”)
- look across the row to the “Scaled Score” column and record the value at
the intersection of this column and the appropriate row (i.e., in this example,
the ch4lr_corscor is “6”)
3. total error scaled score (ch4lr_errscor) - this is the second of two scaled scores
used for clinical diagnosis. To obtain this value, follow these steps:
- open Appendix C of the Leiter examiner’s manual and find the age-
appropriate table (i.e., Table C1.13 for children 4 years, 0 months through 4
years, 2 months)
- under the column heading “Atten Sustain. Total Errors” find the row with the
ch4lr_toterror (#3 under Step 1) score value for that child (i.e., a raw score of 3
falls within the row for “3-4”)
- look across the row to the “Scaled Score” column and record the value at
the intersection of this column and the appropriate row (i.e., in this example,
the ch4lr_errscor is “10”)
Step 3: Clinical Significance:

59 | P a g e
Determine if scores from Step 2 meet clinical criteria.
To determine whether a child’s performance suggests ADD/ADHD:
1. compute a difference score (ch4lr_diffscor) – this score is calculated as follows:
ch4lr_diffscor = ch4lr_errscor – ch4lr_corscor
2. interpret the diffscor (based on Table F3.2):
- if the ch4lr_diffscor >= 4, then this indicates a potential ADD or ADHD problem.
- if the ch4lr_diffscor < 4, then this suggests no problem

60 | P a g e
12.3. Scale – Impulsivity
12.3.1. Variables Questions to mother, asked about mother: m4j25a1, m4j25a2
Questions to mother, asked about father: m4c40a, m4c40b
Questions to father29, asked about father: f4j25a1, f4j25a2
Questions to father, asked about mother: f4c40a, f4c40b
The impulsivity questions included in the Year 5 Core were derived from Dickman’s30
impulsivity scale. Only 2 of the 23 items in Dickman’s full impulsivity scale are included.
12.3.2. Modifications Scott J. Dickman designed a scale to identify two types of impulsivity: functional and
dysfunctional. The FFCWS Survey includes questions pertaining only to dysfunctional
impulsivity, which is associated with the tendency to deliberate less than most people of
equal ability before taking action when this is not optimal. The measure of
dysfunctional impulsivity provides a useful summary measure of the capacity for self-
control. The full impulsivity scale developed by Dickman consists of 23 items. The Core
Year 5 survey includes two of these items. The variables are coded on a 4-point Likert
scale (1=strongly agree and 4- strongly disagree).
Table 26: Dickman’s Impulsivity Scale Variables Included in Year 5
Variables Source Item
m4j25a2;
f4j25a2;
m4c40b;
f4c40b
I often get into trouble because I don’t think before I act.
m4j25a1;
f4j25a1;
m4c40a;
f4c40a
I often say and do things without considering the consequences.
29 A more detailed measure of father’s impulsivity is obtained at Year 1. 30 Dickman, S.J. (1990) Functional and Dysfunctional Impulsivity: Personality and Cognitive Correlates. Journal of
Personality and Social Psychology, 58, 95-102.
61 | P a g e
12.4. Scale – Child Behavior Problems (CBCL) This measure includes some of the items and scales from the Child Behavior Checklist
(CBCL/4-18).31 The purpose of this assessment was to obtain parental ratings of
children’s behavioral problems and prosocial behavior.
The original CBCL/4-18 consists of 113 behavior problem items on which a parent, or
parent surrogate, is asked to rate their child’s behavior. Our Year 5 PCG survey (section
L) and the corresponding core mother survey (section B) include 72 of the original items.
Items were read to each mother or PCG, who was asked to indicate whether the
statement was not true (0), sometimes or somewhat true (1), or very true or often true of
her child (2).
Relatively few well-standardized behavioral measures are available for young children.
Achenbach’s Child Behavior Checklists are the most widely used scales for assessing
problematic behavior, with versions available for preschoolers as well as older children,
and for teacher- as well as parent-report. They provide subscales for different subtypes
of problems and are supported with extensive normative data.
The child behavior items included in the Year 5 surveys were selected from two
established child behavior measures, the CBCL and ASBI (see section 12.6) to cover
constructs of interest (aggressive, delinquent behavior, anxious/depressed behavior,
social withdrawal, social problems, need for mental health services, and social
competence) while providing comparability with several other studies. The included
items should allow adequate comparisons with some other major studies such as the
Fast Track survey and the Longitudinal Studies of Child Abuse and Neglect (LONSCAN)
Assessments.
12.5.1 Variables Mother survey: m4b4b-m4b4b4, m4b4b6, m4b4b7, m4b4b9, m4b4b11-m4b4b19,
m4b29a1-m4b29a4, m4b29a6, m4b29a7, m4b29a9, m4b29a11-m4b29a19 (32 variables)
PCG survey: p4l1, p4l2, p4l4-p4l10, p4l12-p4l14, p4l16-p4l29, p4l31, p4l33-p4l40, p4l42-
p4l47, p4l49, p4l50, p4l52-p4l54, p4l56, p4l57, p4l59, p4l61, p4l62, p4l64, p4l65 (53
variables)
12.5.2. Modifications Because of time constraints, the entire CBCL could not be administered, and choice of
items was complicated by changes in the content of subscales between 1991 and
2000. Our Year 5 PCG survey (section L) and the corresponding core mother survey
(section B) include 72 of the original items.
Specifically, we exclude most items associated with somatic problems and those not
applicable for very young children in our study such as items with contents related to
drugs/alcohol use, school skipping, and sexual behaviors.
31 Achenbach, T.M. (1992). Manual for the Child Behavior Checklist / 2-3 and 1992 Profile. Burlington, VT: University of
Vermont Department of Psychiatry.

62 | P a g e
Selected items in the CBCL comprise the following eight constructs or syndromes: Social
Withdrawal, Somatic Complaints, Anxiety/Depression, Social Problems, Thought
Problems, Attention Problems, Delinquent Behavior, and Aggressive Behavior. The
Anxious/Depressed, Aggressive, and Withdrawn subscales include all of their
component items from the CBCL 4/18. The Delinquent subscale includes 10 of 13 CBCL
4/18 Delinquent scale items. The excluded items are not applicable for young children
in our study.
In addition, CBCL also allows examination of two broad groupings of syndromes:
Internalizing Problems and Externalizing problems. The Internalizing scale does not
include somatic complaints which are included in the Internalizing items from the CBCL
4/18. The Externalizing scale includes all but 3 of the CBCL 4/18 Externalizing scale items.
Table 27 presents items included in our survey based on selected subscales from the
PCG survey as well as the mother survey. A summary of psychometrics for the behavior
items are presented in Table 28. Note that since the full instrument was not
administered, the psychometric property of the Achenbach-like subscales may differ
from the original Achenbach’s CBC.
12.5.3. Scoring Scores for subscales can be calculated either by adding scores for each variable
(allowing comparison to T-scores and percentiles for the normalization sample for each
subscale – see below) or by averaging variable scores. All 72 items can be included to
generate the total behavior score.
Table 27: CBCL Subscales and Diagnostics Question N Variable
Anxious/Depressed (Full scale: 14 items) Complains of loneliness 2976 p4l5
Cries a lot 2832 m4b4b4; m4b29a4
Fears s/he might think/do something wrong 2970 p4l17
Feels s/he has to be perfect 2971 p4l18
Feels/complains no one loves him/her 2974 p4l19
Feels others out to get him/her 2973 p4l20
Feels worthless/inferior 2822 m4b4b18; m4b29a18
Nervous, high strung or tense 2827 m4b4b9; m4b29a9
Too fearful or anxious 2830 m4b4b14; m4b29a14
Feels too guilty 2970 p4l29
Self-conscious or easily embarrassed 2976 p4l43
Suspicious 2971 p4l53
Unhappy, sad or depressed 2831 m4b4b15; m4b29a15
Worries 2972 p4l65
Alpha on full sample = .70 Withdrawn (Full scale: 9 items)
Would rather be alone than with others 2973 p4l25
Refuses to talk 2975 p4l38
Secretive, keeps things to self 2970 p4l42

63 | P a g e
Question N Variable
Shy or timid 2977 p4l46
Stares blankly 2971 p4l47
Sulks a lot 2955 p4l52
Underactive, slow moving, lacks energy 2969 p4l61
Unhappy, sad or depressed 2831 m4b4b15; m4b29a15
Withdrawn, doesn’t get involved with others 2826 m4b4b17; m4b29a17
Alpha on full sample = .61
Attention Problems (Full scale: 11 items) Acts too young for age 2830 m4b4b19; m4b29a19
Can’t concentrate 2830 m4b4b1; m4b29a1
Can’t sit still 2830 m4b4b2; m4b29a2
Confused or seems to be in a fog 2975 p4l6
Daydreams or gets lost in his/her thoughts 2973 p4l8
Impulsive or acts without thinking 2974 p4l24
Nervous, high-strung or tense 2827 m4b4b9; m4b29a9
Nervous moment or twitching 2971 p4l27
Has poor school work 2948 p4l34
Poorly coordinated or clumsy 2976 p4l35
Stares blankly 2971 p4l47
Alpha on full sample = .71 Social Problems (Full scale: 8 items)
Acts too young for age 2830 m4b4b19; m4b29a19
Clings to adults or too dependent 2831 m4b4b3; m4b29a3
Does not get along with other kids 2829 m4b4b6; m4b29a6
Gets teased a lot 2974 p4l22
Not liked by other kids 2970 p4l28
Overweight 2971 p4l31
Poorly coordinated or clumsy 2976 p4l35
Prefers being with younger kids 2965 p4l37
Alpha on full sample = .43 Aggressive (Full scale: 20 items)
Argues a lot 2977 p4l1
Brags or boasts 2959 p4l2
Cruel, bullying or mean to others 2974 p4l7
Demands a lot of attention 2832 m4b4b16; m4b29a16
Destroys his/her own things 2975 p4l9
Destroys things belonging to family/others 2975 p4l10
Disobedient at home 2967 p4l12
Disobedient in school 2944 p4l13
Easily jealous 2975 p4l16
Gets in many fights 2976 p4l21
Physically attacks people 2974 p4l33
Screams a lot 2975 p4l40
Showing off/clowning 2970 p4l45
Stubborn/sullen/irritable 2826 m4b4b11; m4b29a11
Has sudden changes in mood or feelings 2831 m4b4b12; m4b29a12

64 | P a g e
Question N Variable
Talks too much 2972 p4l56
Teases a lot 2975 p4l57
Has temper tantrums or hot temper 2831 m4b4b13; m4b29a13
Threatens people 2974 p4l59
Unusually loud 2969 p4l62
Alpha on full sample = .84
Delinquent behavior (10 of 13 items) Doesn’t seem to feel guilt after misbehaving 2826 m4b4b7; m4b29a7
Hangs around w/ others who get in trouble 2975 p4l23
Lies or cheats 2975 p4l26
Prefers being with older kids 2968 p4l36
Runs away from home 2975 p4l39
Sets fire 2973 p4l44
Steals at home 2977 p4l49
Steals outside home 2972 p4l50
Swears or uses obscene language 2975 p4l54
Vandalizes 2968 p4l64
Alpha on full sample = .56
Summary of psychometrics for the behavior items are presented in Table 28:
Table 28: Variables included for the CBCL 4/18 (1991) Subscales in the
Year 5 Core and In-Home Interview
32 Scale alphas are computed using only cases with valid responses on all items in the scale; for Anxious/Depressed, n =
2769; for Withdrawn, n = 2761; for Total Internalizing, n = 2725; for Aggressive, n = 2727; for Delinquent, n = 2775; for Total
Externalizing, n = 2711; for Total CBCL, n = 2580 33 Ns for each scale apply to the scale means, standard deviations, ranges, and skew and kurtosis statistics; they reflect
the number of cases that have valid responses on at least 80% of the scale items; for cases with fewer than the total
number of items, the raw score was multiplied by (total # scale items/case total # of items). 34 Note that the computation also excluded 169 cases whose values for m4b4b11/m4b29a11, m4b4b12/m4b29a12,
m4b4b13/m4b29a13, m4b4b16/m4b29a16 were completely missing. Kurtosis was evaluated as below. For STATA users:
value in table + 3 = Stata’s kurtosis value
CBCL 1992
Subscale Variables Alpha32 N33
Mean
(SD) Range Skew Kurtosis34
Anxious/
Depressed
p4l5, m4b4b4,
p4l17, p4l19, p4l20,
m4b4b18, m4b4b9,
p4l29, p4l43, p4l53,
m4b4b15, p4l65
0.67 2,768
RAW:
3.39
(2.99)
0-20
AVG: .24
(.21) 0-1.43 1.29 5.05
Withdrawn
p4l25, p4l38, p4l42,
p4l46, p4l47, p4l52,
p4l61, m4b4b15,
m4b4b17
0.60 2,782
RAW:
2.06
(1.99)
0-13
AVG: .23
(.23) 0-1.44 1.41 5.61

65 | P a g e
Total
Internalizing
Anxious/
depressed &
withdrawn items
(m4b4b15 included
once)
0.75 2,746
RAW:
5.37
(4.26)
0-26
AVG: .24
(.19) 0-1.18 1.27 4.95
Aggressive
p4l1, p4l2, p4l7 ,
m4b4b16, p4l9,
p4l12, p4l13, p4l16,
p4l21, p4l33, p4l40,
p4l45, m4b4b12,
p4l56, p4l57,
m4b4b13, p4l59,
p4l62
0.85 2,747
RAW:
10.72
(6.35)
0-36
AVG:
.266
(.211)
0-1.3 1.25 4.89
Delinquent
m4b4b7, p4l23,
p4l26, p4l36, p4l39,
p4l44, p4l49, p4l50,
p4l54, p4l64
0.48 2,795
RAW:
1.89
(1.71)
0-12
AVG:
.189
(.171)
0-1.2 1.46 6.37
Total
Externalizing
Aggressive and
delinquent items 0.86 2,699
RAW:
12.61
(7.5)
0-45
AVG: .42
(.25) 0-1.50 0.92 3.91
Total CBCL
Anxious/depressed,
withdrawn,
aggressive,
delinquent items,
and other problem
items as listed in
the LONGSCAN
report 108 (page
230)
0.90 2808
RAW:
23.37
(13.46)
0-
78.35
AVG:
.325 (.19) 0-1.12 0.99 1.03
Attention
Problems
Subscale
m4b4b19, m4b4b1,
m4b4b2, p4l6, p4l8,
p4l28, m4b4b9,
p4l27, p4l34, p4l35,
p4l47
0.72 2758 RAW:
2.81(2.76) 0-17
AVEGD:
.26 (.25) 0-1.55 1.44 5.65

66 | P a g e
12.5. Scale – Adaptive Social Behavior Inventory (ABSI)
12.5.1. Variables PCG questions: p4l3, p4l11, p4l15, p4l30, p4l32, p4l41, p4l48, p4l51, p4l55, p4l58, p4l60,
p4l63, p4l66 (13 variables)
These items were adapted from the Express Subscale of the Adaptive Social Behavior
Inventory (ASBI).35,36 The ASBI is designed to be an educator’s report of child social skills.
Section L of the PCG Survey includes 13 of the positive behavior items from the ASBI
scale. The ASBI assesses multiple dimensions of social competence and includes
subscales for two aspects of positive behavior, Express and Comply. Special attention is
given to social behaviors, which may be influenced by educational/day care
experiences.
12.5.2. Modifications The three sub-scales of the inventory are Express, Comply and Disrupt. Comply subscale
items overlapped with constructs covered in the CBCL; the Express subscale included
unique, prosocial items and was chosen for use in this study. The Disrupt subscale
includes only a few items which were not used in our survey.
Table 29: ASBI Variables at Year 5 Question N Variable
Positive Behavior (Full scale: 13 items; ASBI)
Understands others’ feelings 2975 p4l3
Sympathetic to other children’s distress 2971 p4l11
Open and direct about needs 2976 p4l15
Will join a group of children playing 2975 p4l30
Plays games and talks with other children 2974 p4l55
Confident with other people 2975 p4l58
Tends to be proud of things s/he does 2970 p4l60
Interested in many different things 2971 p4l63
Enjoys talking with you 2964 p4l66
Easily gets other children’s attention 2966 p4l41
Asks or wants to play with other children 2976 p4l51
Says “please” and “thank you” 2974 p4l48
In social activity, tends to just watch others 2968 p4l32
Alpha on full sample = .80
35 Hogan, A. E., Scott, K. G., & Bauer, C. R. (1992). The Adaptive Social Behavior Inventory (ASBI): A new assessment of
social competence in high-risk three-year-olds. Journal of Psychoeducational Assessment, 10, 230-239. 36 Hogan, A. E., Scott, K. G., & Bauer, C. R. (1997). Social competence: The Adaptive Social Behavior Inventory (ASBI). In
R.T. Gross, D. Spiker, & C.W. Haynes (Eds.),
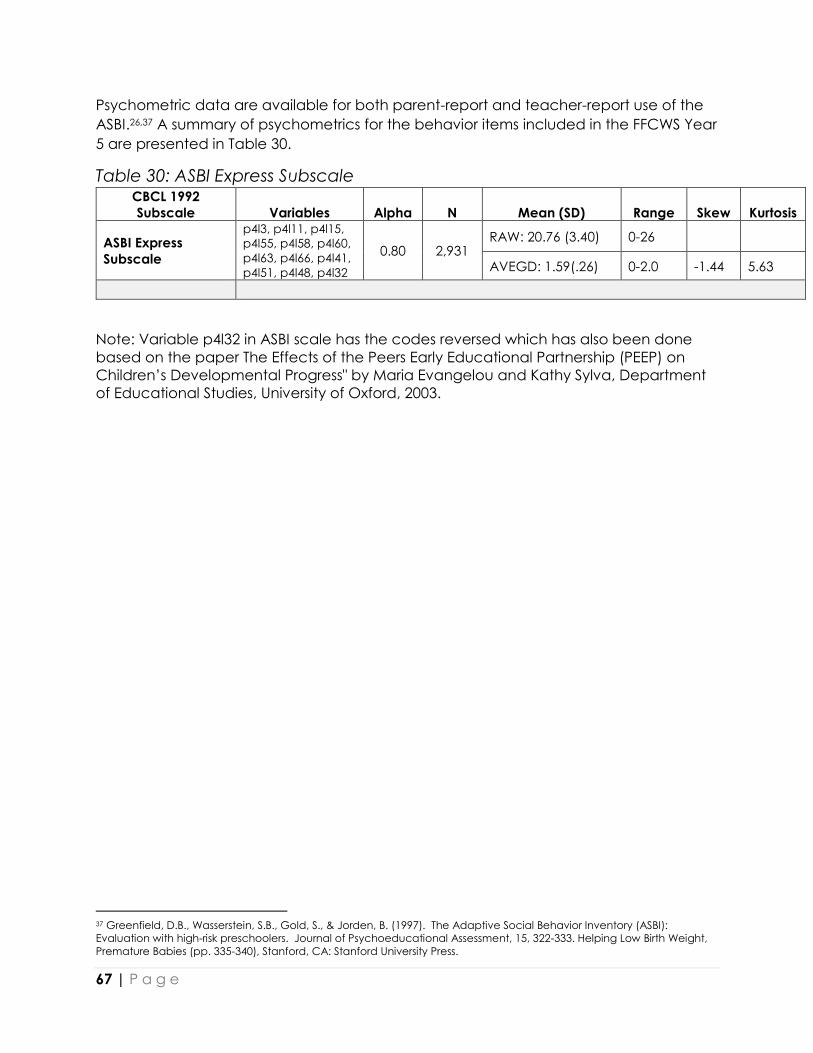
67 | P a g e
Psychometric data are available for both parent-report and teacher-report use of the
ASBI.26,37 A summary of psychometrics for the behavior items included in the FFCWS Year
5 are presented in Table 30.
Table 30: ASBI Express Subscale CBCL 1992
Subscale Variables Alpha N Mean (SD) Range Skew Kurtosis
ASBI Express
Subscale
p4l3, p4l11, p4l15,
p4l55, p4l58, p4l60,
p4l63, p4l66, p4l41,
p4l51, p4l48, p4l32
0.80 2,931 RAW: 20.76 (3.40) 0-26
AVEGD: 1.59(.26) 0-2.0 -1.44 5.63
Note: Variable p4l32 in ASBI scale has the codes reversed which has also been done
based on the paper The Effects of the Peers Early Educational Partnership (PEEP) on
Children’s Developmental Progress" by Maria Evangelou and Kathy Sylva, Department
of Educational Studies, University of Oxford, 2003.
37 Greenfield, D.B., Wasserstein, S.B., Gold, S., & Jorden, B. (1997). The Adaptive Social Behavior Inventory (ASBI):
Evaluation with high-risk preschoolers. Journal of Psychoeducational Assessment, 15, 322-333. Helping Low Birth Weight,
Premature Babies (pp. 335-340), Stanford, CA: Stanford University Press.

68 | P a g e
13. Employment At Year 5, the child’s mother, father and PCG were asked about their employment.
PCGs were administered an employment calendar, as part of the In-Home Activity
Workbook, to record detailed data about their employment history. Mothers and
fathers were asked questions about their type of employment, including traditional and
non-traditional employment (including working for self, “hustles”, and other work), and
unemployment. In traditional work questions, respondents were asked about their
regular forms of work, the typical times they spend at work and how often they’ve
worked in the last year. Non-traditional work questions also included information about
types of work and how much time was spent working these jobs. Questions related to
unemployment included if the respondent was looking for a regular job, how long had
they been looking and when they last received a regular paycheck. In work
stress/flexibility, both mother and father answered questions related to attitudes
surrounding their work, such as whether it is true or false that their shift/work schedule
causes extra stress for them and child or whether their schedule is flexible enough to
handle their family’s needs.
Table 31: Subtopics in Employment in Year 5 by survey instrument
Subtopics m f p h o t
Employment Calendar X
Traditional work X X
Non-traditional work X X
Unemployment X X
Work stress/flexibility X X
13.1. Occupations For traditional employment, we constructed an occupation variable for mothers
(m4k12) and fathers (f4k12) based on the 3 digits codes from the U.S. Bureau of Labor
Statistics (BLS) Occupational Classification System by Major Occupational Groups.
These categories are summarized below:
101 – Professional, Technical, and Related Occupations (Group A)
102 – Executive, Administrative, and Managerial Occupations (Group B)
103 – Sales Occupations (Group C)
104 – Administrative Support Occupations, including Clerical (Group D)
105 – Precision Production, Craft, and Repair Occupations (Group E)
106 – Machine Operators, Assemblers, and Inspectors (Group F)
107 – Transportation and Material Moving Occupations (Group G)
108 – Handlers, Equipment Cleaners, Helpers, and Laborers (Group H)
109 – Service Occupations, except Private Household (Group K)
110 – Unspecified
112 – Military
113 – Farming/Agriculture (father baseline only)
114 – Self-employed (father baseline only)
69 | P a g e
13.2. Constructed Variables - Employment Calendar Variables PCGs were administered an employment calendar, as part of the In-Home Activity
Workbook, to record detailed data about their employment history. The Year 5 child
care and employment calendar data file contains information for 2,013 respondents. A
similar calendar was also administered for the PCGs child care schedule. Approximately
1,400 respondents completed both the child care and employment calendars at the
Year 5 data collection. Please note, there are approximately 1,000 respondents who
completed the In-Home activities or the PCG telephone survey at the Year 5 wave but
do not have child care or employment calendar data for the corresponding follow-up.
For the Year 5 employment history calendar, the respondent was instructed to start by
describing any paid jobs they’ve held for at least 2 weeks since either the focal child’s
third birthday (if they had participated in the prior wave’s interview) or the focal child’s
birth (if they had not participated in the prior wave’s interview).
The Year 3 and Year 5 files contain a similar set of calendar variables related to the
respondent’s employment history. The employment calendars collected information on
the length of time the respondent spent in each job and the hours and shifts worked.
Data users should refer to questions E2 through E14 in the 5-year In-Home Activity
Workbook for the exact wording of the survey questions at each wave.
Please note that the employment history variables do not correspond precisely to the
questions in the Employment History Calendar sections of the Year 5 In-Home Activity
Workbook. For example:
- At each wave, the first question asked is whether the respondent “worked in a
paid job for at least two weeks in a row.” Those who responded “no” to this
question will have a “0” in the variable for the total number of jobs and then no
subsequent values in the variables which store substantive information about
particular jobs. Those who responded “yes” to this question will have a value of
“1” or greater for the total number of jobs. These respondents will have been
asked for substantive information on each job based on how many times they
continued to say that they had additional jobs at the end of the section.
- The Year 5 file does not contain the variable that was asked at each wave
regarding the “ideal” number of total hours the respondent would like to work
each week.
At each wave, the employment calendar collected a short set of basic descriptive
variables including the date of the interview (ch4emp_month and ch4emp_year) and
the total number of jobs the respondent has had (ch4emp_totjob). The employment
calendars also collected descriptive information on up to 10 jobs that the respondent
had had by the time of the interview. The employment calendar also contains
supplemental information that denotes when significant changes in hours and/or work
shifts for a particular job occurred, if applicable.

70 | P a g e
Table 32: Employment Calendar Variables Constructed Variable Variable Label Description
ch4emp_year Employment Calendar Interview
Year
Year calendar administered
ch4emp_month Employment Calendar Interview
Month
Month calendar administered
ch4emp_[0-9] Job [1-10] What number of Jobs
ch4emp_totjob Total number of jobs since child’s
birth
Total number of jobs since child’s
birth
ch4emp_leave_[0-9] j[1-10]: job protected leave? Leave for Job N
ch4emp_hrwk_[0-9] j[1-10]: hours per week worked Hours worked per week Job N
ch4emp_cs_[0-9] j[1-10]: change in shift? Change in shift for Job N
ch4emp_csday[1-5]_[0-9] j[1-10]: [1-5] shift is day? Type of shift change for Job N
ch4emp_cseve [1-5]_[0-9] j[1-10]: [1-5] shift is evening? Type of shift change for Job N
ch4emp_csnum_[0-9] j[1-10]: number of changes in shift Type of shift change for Job N
ch4emp_csrot[1-5]_[0-9] j[1-10]: [1-5] shift change is night? Type of shift change for Job N
ch4emp_csswi[1-5]_[0-9] j[1-10]: [1-5] shift change is
swing?
Type of shift change for Job N
ch4emp_shday_[0-9] j[1-10]: shift is day? Type of shift for Job N
ch4emp_sheve_[0-9] j[1-10]: shift is evening? Type of shift for Job N
ch4emp_shrot_[0-9] j[1-10]: shift is night? Type of shift for Job N
ch4emp_shswi_[0-9] j[1-10]: shift is swing? Type of shift for Job N
ch4emp_chhr[1-5]_[0-9] j[1-10]: hr/wk of [1-5] hr/wk
change
Hours worked per week for Job N
after change
ch4emp_chnum_[0-9] j[1-10]: number of changes in
hr/wk
Number of hour changes for Job N
ch4emp_csq[1-5]_[0-9] j[1-10]: qtr of [1-5] shift change First day of 1st/2nd/3rd/4th quarter
of year in which shift change
occurred
ch4emp_chq[1-5]_[0-9] j[1-10]: qtr of [1-5] hr/wk change First day of 1st/2nd/3rd/4th quarter
of year in which hour change
occurred
ch4emp_startq_[0-9] j[1-10]: q job [1-10] starts First day of 1st/2nd/3rd/4th quarter
of year in which job started
ch4emp_endq_[0-9] j[1-10]: q job [1-10] ends First day of 1st/2nd/3rd/4th quarter
of year in which job ended
Note: 0 denotes 10th job; 1-5 is the shift or hour change within the job that is being referred to.
71 | P a g e
14. Childcare At Year 5, both mother and father were asked about their childcare arrangements.
PCGs were also administered a child care calendar as part of the In-Home Activities.
Table 33: Subtopics in Childcare in Year 5 by survey instrument
Subtopics m f p h o t
Childcare Calendar X Childcare Services and Availability X X
14.1. Constructed Variables - Child Care Calendar Variables At the Year 5 wave of data collection, PCGs were administered a child care calendar
as par to the In-Home Activities. The respondent was instructed to start by describing
any child care arrangements the “focal” child has had since either the “focal” child’s
third birthday (if they had participated in the prior wave’s interview) or the “focal”
child’s birth (if they had not participated in the prior wave’s interview).
The Year 3 and Year 5 data contain a similar set of calendar variables related to the
respondent’s previous child care arrangements. The child care calendars collected
information on type, hours, and duration of child care arrangements for the “focal”
child. Data users should refer to questions E15 through E25 in the 5-year In-Home
Activity Workbook for the exact wording of the survey questions at each wave.
Please note that the child care arrangement variables in these data do not correspond
precisely to the questions in the Child Care Calendar sections of the Year 5 In-Home
Activity Workbook. For example:
- At each wave, the first question asked is whether the “focal” child had ever
been cared for on a regular basis by someone other than the respondent. Those
who responded “no” to this question will have a “0” in the variable for the total
number of child care arrangements and then no subsequent values in the
variables which store substantive information about particular arrangements.
Those who responded “yes” to this question will have a value of “1” or greater for
the total number of arrangements. These respondents will have been asked for
substantive information on each arrangement based on how many times they
continued to say that they had additional arrangements at the end of the
section.
- The Year 5 file does not contain variables that directly correspond to final two
questions in the Child Care Calendar sections (F26/F27); these questions were
created to lead interviewers through a script inviting the respondent to
participate in the Kindergarten Survey.
At each wave, the child care calendar collected a short set of basic descriptive and
identification variables, including the date of the interview (ch4cc_month and

72 | P a g e
ch4cc_year) and the total number of arrangements the respondent has had for the
focal child (ch4cc_totarr).
The child care calendars also collected descriptive information on up to 10 child care
arrangements that the respondent had had by the time of the interview. The child care
calendars also contain supplemental information that denotes when significant
changes in hours the focal child spends in a particular arrangement occurred, if
applicable.
Table 34: Child Care Calendar Variables Constructed Variable Variable Label Description
ch4cc_year Child Care Interview Year Year calendar administered
ch4cc_month Child Care Interview Month Month calendar administered
ch4cc_[0-9] Arrangement [1-10] Which arrangement
ch4cc_totarr Total number of arrangements since child
birth
Total number of arrangements since
child birth
ch4cc_vouch_[0-9] c[1-10]: voucher? Did they receive a voucher for this
arrangement
ch4cc_prov_[0-9] c[1-10]: provider Type of provider – additional
documentation in instrument
ch4cc_provlo_[0-9] c[1-10]: provider location Location provider – additional
documentation in instrument
ch4cc_cch_[0-9] c[1-10]: change in hr/wk? Indicates any significant change in
Hours for arrangement N
ch4cc_cchhr[1-10]_[0-9] c[1-10]: hr/wk of [1-5] hr/wk change Hours “focal” child in
Arrangement N per week after
change
ch4cc_cchnum_[0-9] c[1-10]: number of changes in hr/wk Number of hour changes
for arrangement N
ch4cc_cchq[1-10]_[0-9] c[1-10]: qtr of [1-5] hr/wk change First day of 1st/2nd/3rd/4th quarter
of year in which HOUR change
occurred
ch4cc_chrwk_[0-9] c[1-10]: hours per week child is in
arrangement
Hours worked per week “focal” child
in arrangement N
ch4cc_cstrtq_[0-9] c[1-10]: q arrangements [1-10] starts First day of 1st/2nd/3rd/4th quarter of
year in which arrangement started
ch4cc_cendq_[0-9] c[1-10]: q arrangements [1-10] ends First day of 1st/2nd/3rd/4th quarter of
year in which arrangement ended
Note: 0 denotes 10th child care arrangement; 1-5 references to the significant hour change within the
arrangements that is being referred to
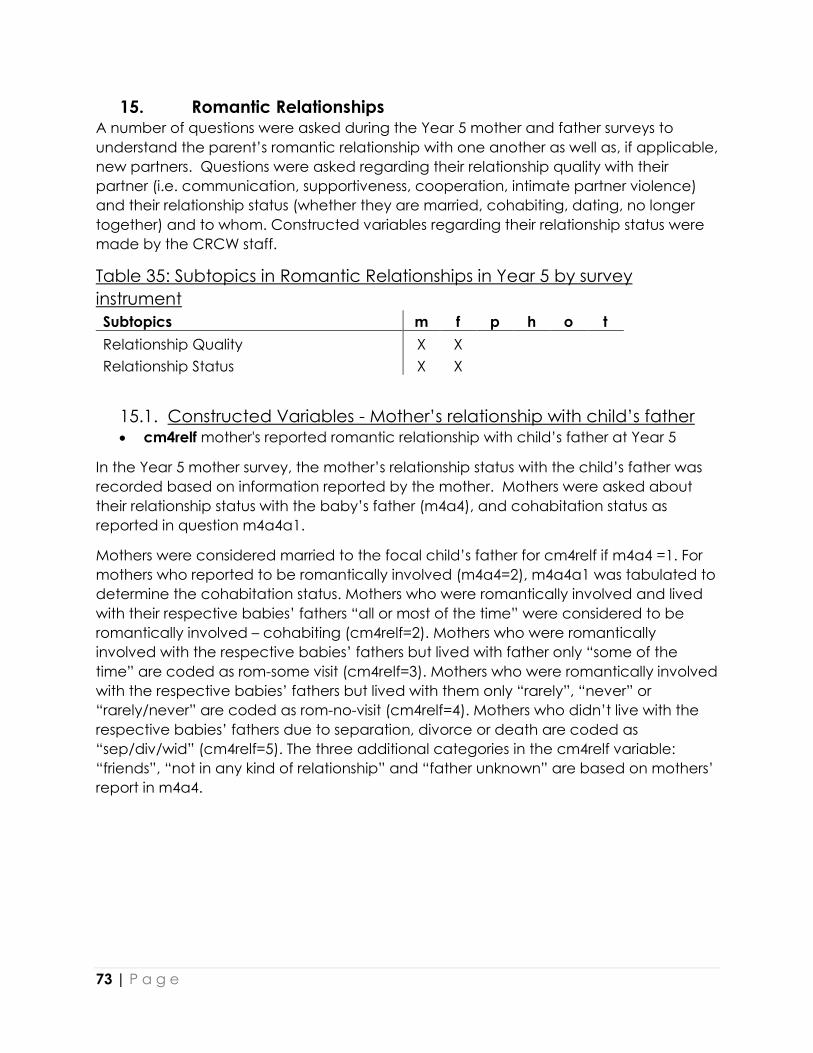
73 | P a g e
15. Romantic Relationships A number of questions were asked during the Year 5 mother and father surveys to
understand the parent’s romantic relationship with one another as well as, if applicable,
new partners. Questions were asked regarding their relationship quality with their
partner (i.e. communication, supportiveness, cooperation, intimate partner violence)
and their relationship status (whether they are married, cohabiting, dating, no longer
together) and to whom. Constructed variables regarding their relationship status were
made by the CRCW staff.
Table 35: Subtopics in Romantic Relationships in Year 5 by survey
instrument
Subtopics m f p h o t
Relationship Quality X X
Relationship Status X X
15.1. Constructed Variables - Mother’s relationship with child’s father • cm4relf mother's reported romantic relationship with child’s father at Year 5
In the Year 5 mother survey, the mother’s relationship status with the child’s father was
recorded based on information reported by the mother. Mothers were asked about
their relationship status with the baby’s father (m4a4), and cohabitation status as
reported in question m4a4a1.
Mothers were considered married to the focal child’s father for cm4relf if m4a4 =1. For
mothers who reported to be romantically involved (m4a4=2), m4a4a1 was tabulated to
determine the cohabitation status. Mothers who were romantically involved and lived
with their respective babies’ fathers “all or most of the time” were considered to be
romantically involved – cohabiting (cm4relf=2). Mothers who were romantically
involved with the respective babies’ fathers but lived with father only “some of the
time” are coded as rom-some visit (cm4relf=3). Mothers who were romantically involved
with the respective babies’ fathers but lived with them only “rarely”, “never” or
“rarely/never” are coded as rom-no-visit (cm4relf=4). Mothers who didn’t live with the
respective babies’ fathers due to separation, divorce or death are coded as
“sep/div/wid” (cm4relf=5). The three additional categories in the cm4relf variable:
“friends”, “not in any kind of relationship” and “father unknown” are based on mothers’
report in m4a4.
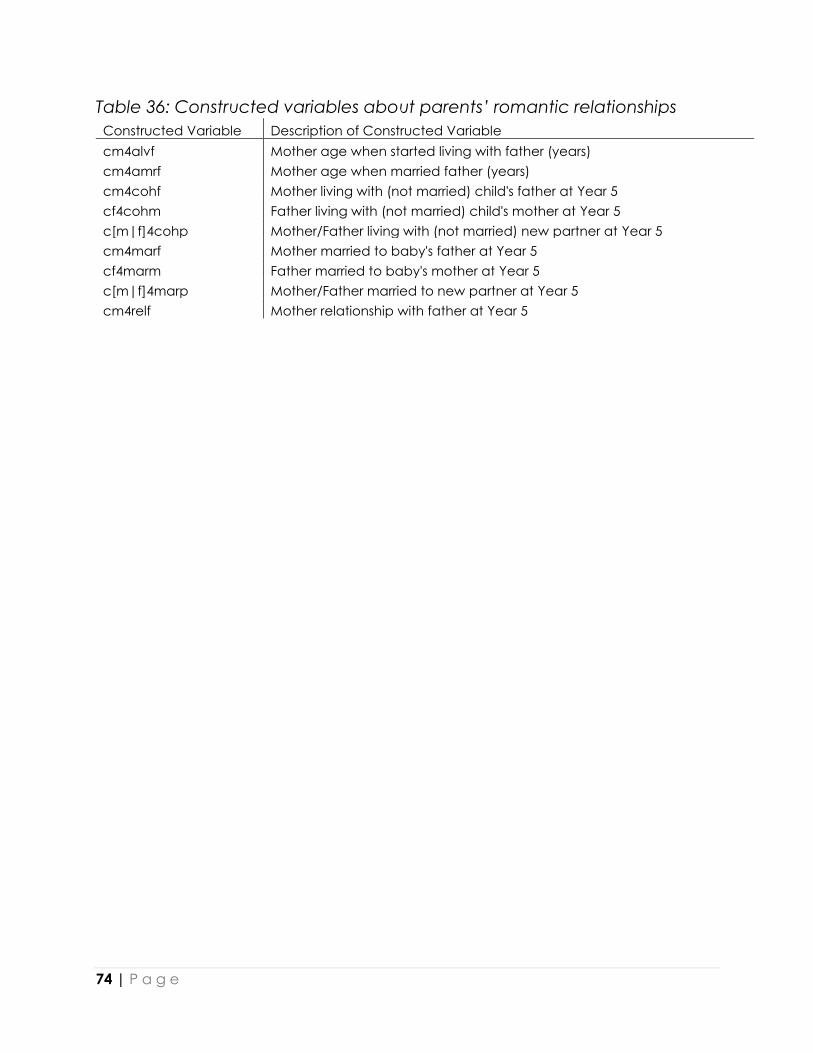
74 | P a g e
Table 36: Constructed variables about parents’ romantic relationships
Constructed Variable Description of Constructed Variable
cm4alvf Mother age when started living with father (years)
cm4amrf Mother age when married father (years)
cm4cohf Mother living with (not married) child's father at Year 5
cf4cohm Father living with (not married) child's mother at Year 5
c[m|f]4cohp Mother/Father living with (not married) new partner at Year 5
cm4marf Mother married to baby's father at Year 5
cf4marm Father married to baby's mother at Year 5
c[m|f]4marp Mother/Father married to new partner at Year 5
cm4relf Mother relationship with father at Year 5
75 | P a g e
15.2. Concept – Couple Relationship Quality These items assess the couple’s relationship with respect to their commitment,
satisfaction with the sexual relationship, and trust. It also questions parents on whether
their relationship is in trouble and the frequency with which they discuss breaking up.
15.2.1. Variables Mother questions: m4d6a-m4d6i
Father questions: f4d6a-f4d6i
Items D6a through D6f are coded on a 5-point scale (1=strongly disagree and
5=strongly agree). Items D6g through D6i are coded on a 3-point scale (1=often,
2=sometimes, 3=never).
15.2.1. Modifications Questions D6a-d are slightly modified versions of four questions from the Stanley and
Markman Commitment Inventory,38 three of which were included in the Oklahoma
Marriage Initiative Statewide Baseline Survey.39
Question D6e is a modification of a question from the National Survey of Families and
Households (NSFH) that asked individuals if they were 1 ‘very unhappy’ to 7 ‘very
happy’ with their sexual relationship.40
Three questions about whether the relationship might be in trouble and consideration of
breaking up (D6g-i) are modifications of NSFH questions, which were originally
developed by Booth, Johnson and Edwards as part of the Marital Instability Index.41
38 Stanley, Scott M. and Howard J. Markman. (1992). Assessing Commitment in Personal Relationships. Journal of Marriage
and the Family 54: 595-608. 39 Johnson, Christine A. and Scott M. Stanley, editors. (2001). The Oklahoma Marriage Initiative Statewide Baseline Survey.
Bureau for Social Research, Oklahoma State University. 40 Sweet, James A. and Larry L. Bumpass. (1996). The National Survey of Families and Households - Waves 1 and 2: Data
Description and Documentation. Center for Demography and Ecology, University of Wisconsin-Madison
(http://www.ssc.wisc.edu/nsfh/home.htm). 41 Booth, Alan, David Johnson and John N. Edwards. (1983). Measuring Marital Instability.
Journal of Marriage and the Family 45: 387-394.
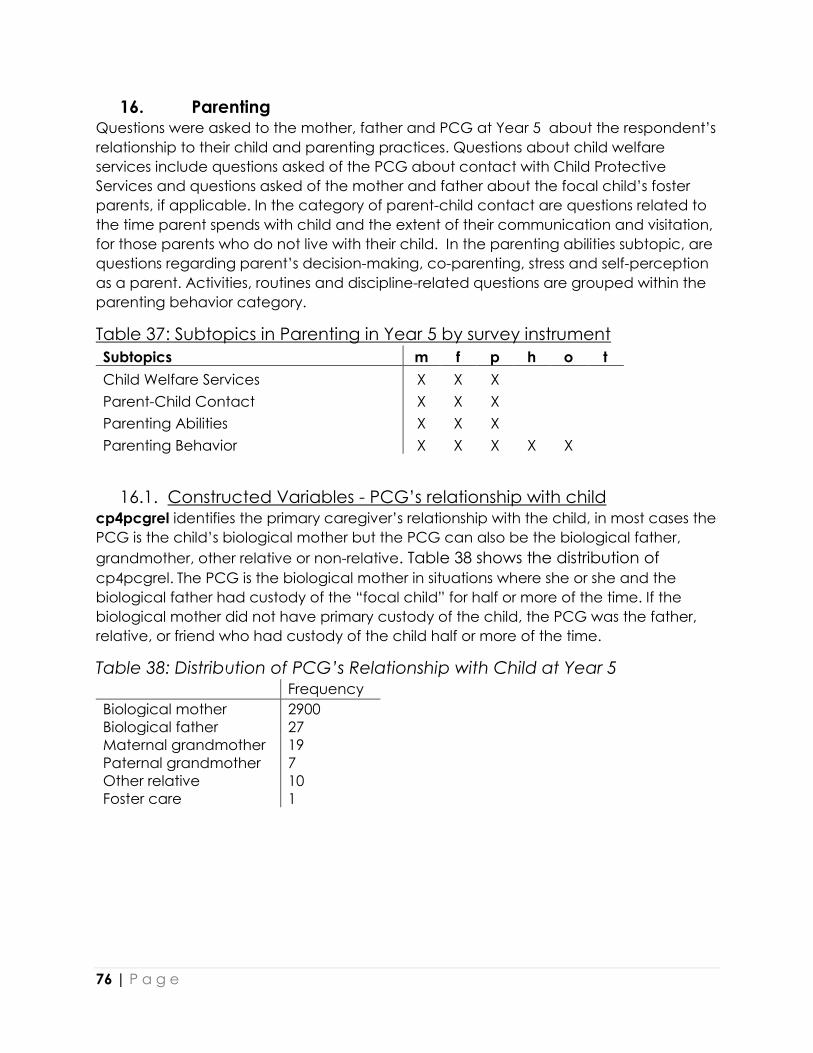
76 | P a g e
16. Parenting Questions were asked to the mother, father and PCG at Year 5 about the respondent’s
relationship to their child and parenting practices. Questions about child welfare
services include questions asked of the PCG about contact with Child Protective
Services and questions asked of the mother and father about the focal child’s foster
parents, if applicable. In the category of parent-child contact are questions related to
the time parent spends with child and the extent of their communication and visitation,
for those parents who do not live with their child. In the parenting abilities subtopic, are
questions regarding parent’s decision-making, co-parenting, stress and self-perception
as a parent. Activities, routines and discipline-related questions are grouped within the
parenting behavior category.
Table 37: Subtopics in Parenting in Year 5 by survey instrument
Subtopics m f p h o t
Child Welfare Services X X X
Parent-Child Contact X X X
Parenting Abilities X X X
Parenting Behavior X X X X X
16.1. Constructed Variables - PCG’s relationship with child cp4pcgrel identifies the primary caregiver’s relationship with the child, in most cases the
PCG is the child’s biological mother but the PCG can also be the biological father,
grandmother, other relative or non-relative. Table 38 shows the distribution of
cp4pcgrel. The PCG is the biological mother in situations where she or she and the
biological father had custody of the “focal child” for half or more of the time. If the
biological mother did not have primary custody of the child, the PCG was the father,
relative, or friend who had custody of the child half or more of the time.
Table 38: Distribution of PCG’s Relationship with Child at Year 5
Frequency
Biological mother 2900
Biological father 27
Maternal grandmother 19
Paternal grandmother 7
Other relative 10
Foster care 1
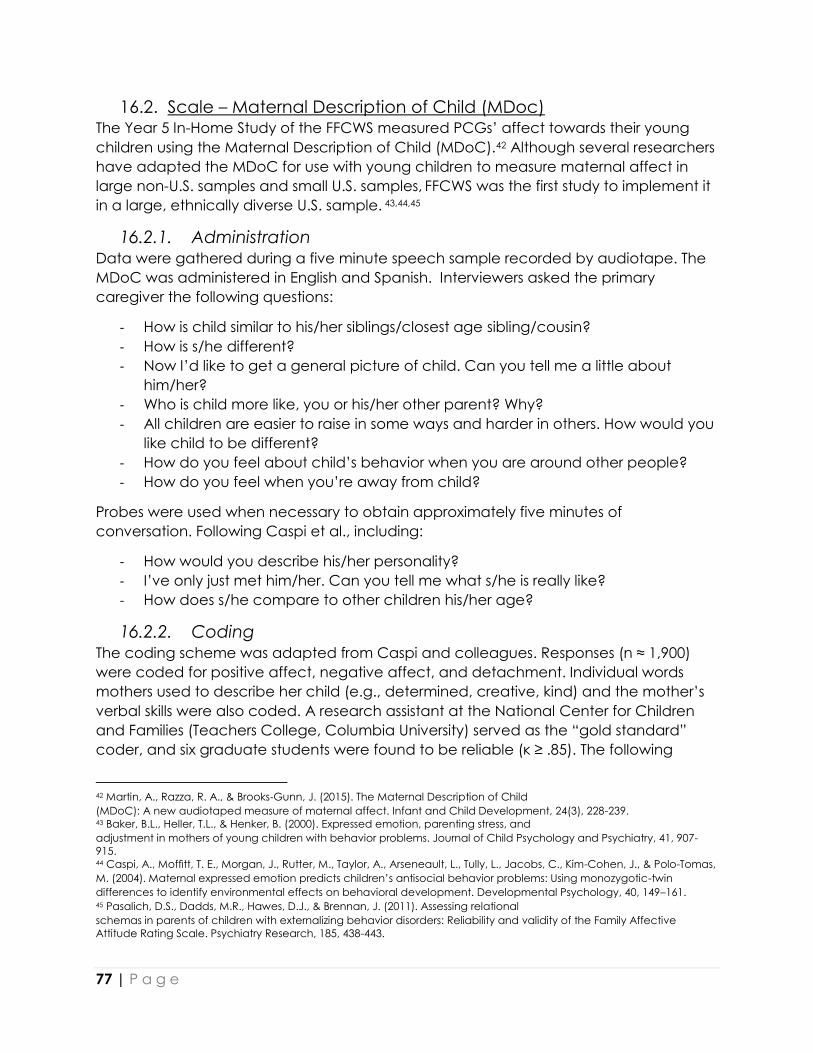
77 | P a g e
16.2. Scale – Maternal Description of Child (MDoc) The Year 5 In-Home Study of the FFCWS measured PCGs’ affect towards their young
children using the Maternal Description of Child (MDoC).42 Although several researchers
have adapted the MDoC for use with young children to measure maternal affect in
large non-U.S. samples and small U.S. samples, FFCWS was the first study to implement it
in a large, ethnically diverse U.S. sample. 43,44,45
16.2.1. Administration Data were gathered during a five minute speech sample recorded by audiotape. The
MDoC was administered in English and Spanish. Interviewers asked the primary
caregiver the following questions:
- How is child similar to his/her siblings/closest age sibling/cousin?
- How is s/he different?
- Now I’d like to get a general picture of child. Can you tell me a little about
him/her?
- Who is child more like, you or his/her other parent? Why?
- All children are easier to raise in some ways and harder in others. How would you
like child to be different?
- How do you feel about child’s behavior when you are around other people?
- How do you feel when you’re away from child?
Probes were used when necessary to obtain approximately five minutes of
conversation. Following Caspi et al., including:
- How would you describe his/her personality?
- I’ve only just met him/her. Can you tell me what s/he is really like?
- How does s/he compare to other children his/her age?
16.2.2. Coding The coding scheme was adapted from Caspi and colleagues. Responses (n ≈ 1,900)
were coded for positive affect, negative affect, and detachment. Individual words
mothers used to describe her child (e.g., determined, creative, kind) and the mother’s
verbal skills were also coded. A research assistant at the National Center for Children
and Families (Teachers College, Columbia University) served as the “gold standard”
coder, and six graduate students were found to be reliable (κ ≥ .85). The following
42 Martin, A., Razza, R. A., & Brooks‐Gunn, J. (2015). The Maternal Description of Child
(MDoC): A new audiotaped measure of maternal affect. Infant and Child Development, 24(3), 228-239. 43 Baker, B.L., Heller, T.L., & Henker, B. (2000). Expressed emotion, parenting stress, and
adjustment in mothers of young children with behavior problems. Journal of Child Psychology and Psychiatry, 41, 907-
915. 44 Caspi, A., Moffitt, T. E., Morgan, J., Rutter, M., Taylor, A., Arseneault, L., Tully, L., Jacobs, C., Kim-Cohen, J., & Polo-Tomas,
M. (2004). Maternal expressed emotion predicts children’s antisocial behavior problems: Using monozygotic-twin
differences to identify environmental effects on behavioral development. Developmental Psychology, 40, 149–161. 45 Pasalich, D.S., Dadds, M.R., Hawes, D.J., & Brennan, J. (2011). Assessing relational
schemas in parents of children with externalizing behavior disorders: Reliability and validity of the Family Affective
Attitude Rating Scale. Psychiatry Research, 185, 438-443.

78 | P a g e
detailed descriptions of positive affect, negative affect, and detachment are adapted
from the coding manual.46 Positive feelings, negative feelings, and detachment are
considered continuous variables.
Positive Feelings toward Child (ch4mdoc_posaff)
Positive feelings toward child (ch4mdoc_posaff) is a global scale measuring the level
of positive emotions and thoughts the parent expresses in her/his descriptions of the
child during the MDoC. This scale is based on the content of the parent’s
descriptions, measured as the quantity of positive statements and the specificity of
her/his descriptions, as well as her/his tone of voice when discussing the child. Thus,
scores on the overall valence of positive feelings toward child should represent a
composite of quantity, specificity and tone.
In terms of content, positive statements about the child include verbal expressions of
love, affection, delight, respect, pride and admiration. Feelings such as, “I love her,”
“he makes me happy,” “he keeps me going,” and “when she comes home, I’m so
glad to see her,” exemplify positivity when describing the child. Descriptions such as,
“she’s very intelligent,” “he’s loveable,” “he’s a good kid,” and “he’s very
advanced,” are positive attributes that also imply positive feelings. The quantity of
positive statements were also considered when scoring the scale, that is, how many
positive things the parent says about the child. Specificity relates to the level of
detail the parent uses to describe the child. For example, a statement such as,
“she’s a good kid, everybody likes her,” is less specific than, “She’s a leader with her
friends; everybody does what she wants when they play; when she grows up,
everyone will come to her with their questions – she’s just that type of person.”
Specificity is most often conveyed in stories or anecdotes about the child or
additional comments that clarify the meaning of the parent’s response. For a
parent’s description to be considered highly specific, the coder needed to feel like
the parent knows their child well.
Tone was evaluated by assessing the parent’s affect while describing the child. A
positive tone is one that is upbeat, warm, affectionate or proud. Coders listened for
cues of a positive affect, such as if the parent sounds like she is smiling when describing
the child. Tones that are not positive are either negative or flat. For descriptions of these
tones, see descriptions of Negative feelings toward child and Detachment from child. It
is important not to confuse a parent’s personality with their tone, as parents differ in
their energy levels and dispositions.
Coding Scale:
1: Expresses 0-2 positive statements toward child and almost no positive tone
46 Ryan, R. M., Martin, A., & Ontaneda, E. (2006). Fragile Families In Home Study, Maternal Description of Child coding
scheme: Instructions. New York: National Center for Children and Families, Teachers College.
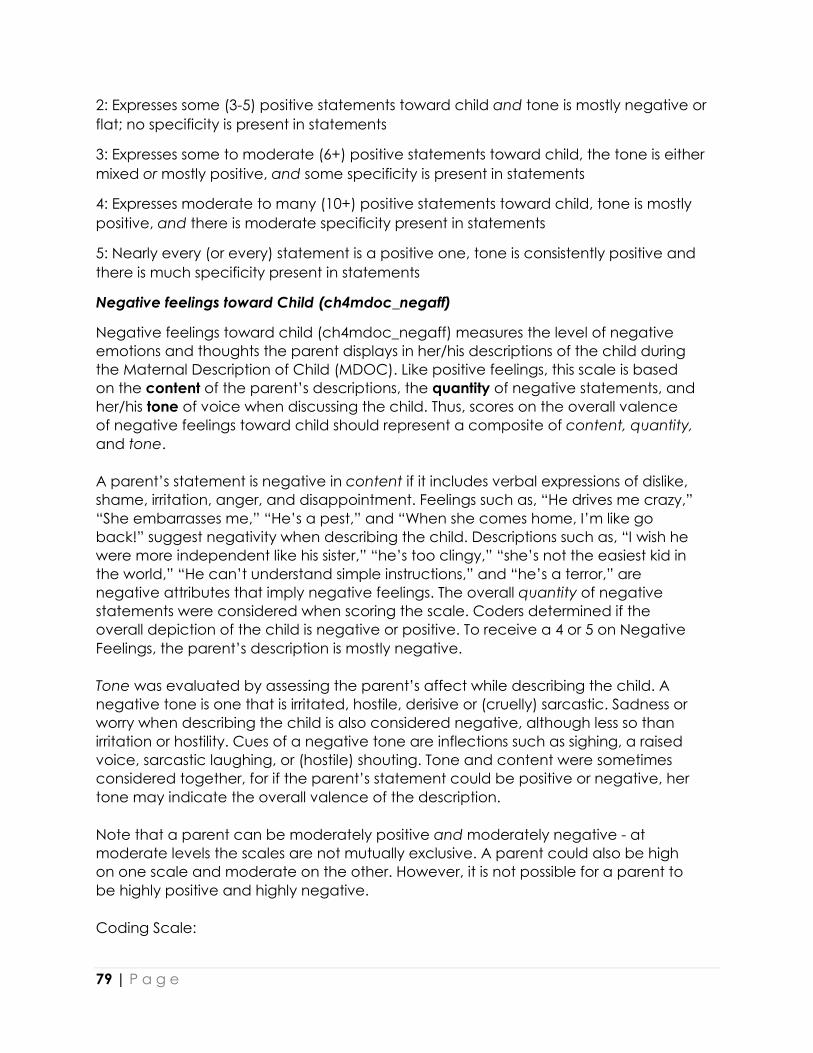
79 | P a g e
2: Expresses some (3-5) positive statements toward child and tone is mostly negative or
flat; no specificity is present in statements
3: Expresses some to moderate (6+) positive statements toward child, the tone is either
mixed or mostly positive, and some specificity is present in statements
4: Expresses moderate to many (10+) positive statements toward child, tone is mostly
positive, and there is moderate specificity present in statements
5: Nearly every (or every) statement is a positive one, tone is consistently positive and
there is much specificity present in statements
Negative feelings toward Child (ch4mdoc_negaff)
Negative feelings toward child (ch4mdoc_negaff) measures the level of negative
emotions and thoughts the parent displays in her/his descriptions of the child during
the Maternal Description of Child (MDOC). Like positive feelings, this scale is based
on the content of the parent’s descriptions, the quantity of negative statements, and
her/his tone of voice when discussing the child. Thus, scores on the overall valence
of negative feelings toward child should represent a composite of content, quantity,
and tone.
A parent’s statement is negative in content if it includes verbal expressions of dislike,
shame, irritation, anger, and disappointment. Feelings such as, “He drives me crazy,”
“She embarrasses me,” “He’s a pest,” and “When she comes home, I’m like go
back!” suggest negativity when describing the child. Descriptions such as, “I wish he
were more independent like his sister,” “he’s too clingy,” “she’s not the easiest kid in
the world,” “He can’t understand simple instructions,” and “he’s a terror,” are
negative attributes that imply negative feelings. The overall quantity of negative
statements were considered when scoring the scale. Coders determined if the
overall depiction of the child is negative or positive. To receive a 4 or 5 on Negative
Feelings, the parent’s description is mostly negative.
Tone was evaluated by assessing the parent’s affect while describing the child. A
negative tone is one that is irritated, hostile, derisive or (cruelly) sarcastic. Sadness or
worry when describing the child is also considered negative, although less so than
irritation or hostility. Cues of a negative tone are inflections such as sighing, a raised
voice, sarcastic laughing, or (hostile) shouting. Tone and content were sometimes
considered together, for if the parent’s statement could be positive or negative, her
tone may indicate the overall valence of the description.
Note that a parent can be moderately positive and moderately negative - at
moderate levels the scales are not mutually exclusive. A parent could also be high
on one scale and moderate on the other. However, it is not possible for a parent to
be highly positive and highly negative.
Coding Scale:
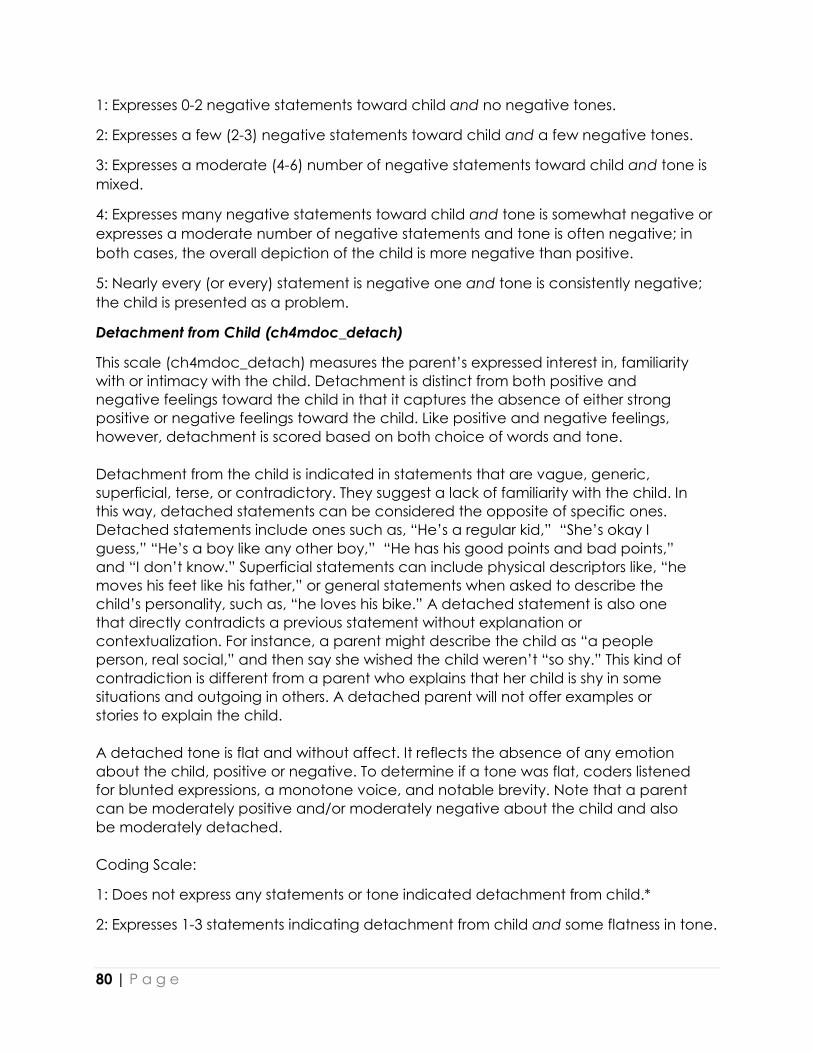
80 | P a g e
1: Expresses 0-2 negative statements toward child and no negative tones.
2: Expresses a few (2-3) negative statements toward child and a few negative tones.
3: Expresses a moderate (4-6) number of negative statements toward child and tone is
mixed.
4: Expresses many negative statements toward child and tone is somewhat negative or
expresses a moderate number of negative statements and tone is often negative; in
both cases, the overall depiction of the child is more negative than positive.
5: Nearly every (or every) statement is negative one and tone is consistently negative;
the child is presented as a problem.
Detachment from Child (ch4mdoc_detach)
This scale (ch4mdoc_detach) measures the parent’s expressed interest in, familiarity
with or intimacy with the child. Detachment is distinct from both positive and
negative feelings toward the child in that it captures the absence of either strong
positive or negative feelings toward the child. Like positive and negative feelings,
however, detachment is scored based on both choice of words and tone.
Detachment from the child is indicated in statements that are vague, generic,
superficial, terse, or contradictory. They suggest a lack of familiarity with the child. In
this way, detached statements can be considered the opposite of specific ones.
Detached statements include ones such as, “He’s a regular kid,” “She’s okay I
guess,” “He’s a boy like any other boy,” “He has his good points and bad points,”
and “I don’t know.” Superficial statements can include physical descriptors like, “he
moves his feet like his father,” or general statements when asked to describe the
child’s personality, such as, “he loves his bike.” A detached statement is also one
that directly contradicts a previous statement without explanation or
contextualization. For instance, a parent might describe the child as “a people
person, real social,” and then say she wished the child weren’t “so shy.” This kind of
contradiction is different from a parent who explains that her child is shy in some
situations and outgoing in others. A detached parent will not offer examples or
stories to explain the child.
A detached tone is flat and without affect. It reflects the absence of any emotion
about the child, positive or negative. To determine if a tone was flat, coders listened
for blunted expressions, a monotone voice, and notable brevity. Note that a parent
can be moderately positive and/or moderately negative about the child and also
be moderately detached.
Coding Scale:
1: Does not express any statements or tone indicated detachment from child.*
2: Expresses 1-3 statements indicating detachment from child and some flatness in tone.

81 | P a g e
3: Expresses 4 or more statements indicating detachment from child and some flatness
in tone.
*If a parent expresses 1-3 statements indicating detachment OR some flatness in tone,
give a score of 1; to get a 2, parents must express detachment in both content and
tone.
Table 39. MDoc Variables Variable Description
ch4mdoc_posaff Positive affect, quantity and intensity of affection and pride
ch4mdoc_negaff Negative affect, quantity and intensity of disappointment/dislike
ch4mdoc_detach Detachment, flat affect and lack of interest in child
ch4mdoc_verbal Amount and descriptiveness of PCG’s speech
ch4mdoc_chlike Which parent is child more like
ch4mdoc_totdes Total number of descriptors
ch4mdoc_firstdes First statement descriptor
ch4mdoc_des01-59 Descriptor variables
16.2.3. General Problems Approximately 11% of cases are considered uncode-able due to administrative issues.
ch4mdoc_anasm indicates whether a case had data of sufficient quality to be
included in an analytic sample, and should usually be used by researchers working with
the MDoC. Variables ch4mdoc_intflag* indicate a series of 6 potential issues, though
being flagged with an issue doesn’t necessarily exclude a case from the
recommended analytic sample.
Table 40. Administrative Flags Variable Description
ch4mdoc_uncode Reason case was excluded from analytic sample.
ch4mdoc_firstdes_m Reasons for missing first statement descriptor
ch4mdoc_intflag01 The parent spoke softly, making her responses difficult to hear.
ch4mdoc_intflag02 The parent didn’t seem to understand the questions, making her
responses difficult to characterize.
ch4mdoc_intflag03
The interviewer was overly suggestive, meaning that his/her
questions/responses may have lead the parent to respond more
positively or negatively that she would have without the
interviewer’s interference.
ch4mdoc_intflag04
The interviewer did not probe sufficiently, meaning the
interviewer missed many opportunities to follow up on brief,
unclear, and/or potentially revealing responses by the parent to
the point where we cannot be sure of the parent’s intended
feelings.
ch4mdoc_intflag05
Others who were present interfered, meaning other adults or
children are in the room and interfere to the point that their
responses dominate the sample, especially if the main
respondent is merely agreeing or disagreeing with what the
other adult is saying about the child without offering their own
ideas.
ch4mdoc_intflag06 Other problems

82 | P a g e
Table 41. Additional Variables describing Administration Variable Description
ch4mdoc_anasm Analytic Sample
ch4mdoc_flag Administered to Primary Caregiver (PCG)
ch4mdoc_span Administered in Spanish
ch4mdoc_mdocdc Data Collector ID
83 | P a g e
16.3. Scale – Aggravation in Parenting The Aggravation in Parenting questions in the Year 5 Core Survey are derived from the
Child Development Supplement (CDS) of the Panel Study of Income Dynamics (PSID).47
The scale measures the amount of parenting stress brought on by changes in
employment, income or other factors in the parent’s life. It was developed for the Job
Opportunities and Basic Skills Training Program (JOBS)48 child outcome survey by Child
Trends, Inc. and several items come from the Parent Stress Inventory.49 Items Q1B11a-e
are from the primary caregiver/child questionnaire in the PSID-CDS, and Q2A29a-d are
from the primary caregiver/household questionnaire. The items used in the JOBS study
are marked with an asterisk in the table below. Their 5-question scale had an alpha of
0.69. Research has shown that high levels of aggravation in parenting are related to
mothers’ employment status and to child behavior problems.50
16.3.1. Variables Mother questions: m4b6a- m4b6d (4 variables, resident mothers), m4b31a-m4b31d (4
variables, non-resident mothers)
Father questions: f4b6a-f4b6d (4 variables, resident fathers), f4b31a-f4b31d (4
variables, non-resident fathers) (8 variables)
16.3.2. Modifications
The Year 5 study does not use all 9 of the items mentioned above. Instead, the
four questions (asked to resident and non-resident parents separately) from
Q2A29a-d are used (see table below for complete listings). The Year 5 questions
are also scored on a 4-point scale, where 1 = “strongly agree,” 2 = “somewhat
agree,” 3 = “somewhat disagree,” and 4 = “strongly disagree,” whereas the
original questions used a 5-point Likert scale that ranged from “not at all true” to
“completely true.”
16.3.3. Scoring Information
Given that FFCWS did not implement the full scale, we suggest summing the
variables and dividing by the top value of the Likert-scale.
47 Primary Caregiver of Target Child Household Questionnaire for the Child
Development Supplement to the Family Economics Study, 1997. (1997). Retrieved March 27, 2003, from
ftp://ftp.isr.umich.edu/pub/src/psid/questionnaires/97child/PCGhhld.pdf 48 Now known as the National Evaluation of Welfare-to-Work Strategies (NEWWS).
49 Abidin, R. (1995). Parent Stress Inventory, 3rd Edition. Odessa, FL: Psychological Assessment Resources. 50 Hofferth, S., Davis-Kean, P.E., Davis, J., & Finkelstein, J. The Child Development Supplement to the Panel Study of
Income Dynamics: 1997 User Guide. Survey Research Center, The University of Michigan Institute for Social Research.

84 | P a g e
Table 42: Aggravation in Parenting Variables
PSID-CDS Year 5 Variables Source Items Q1A29a* m4b6a, m4b31a
f4b6a, f4b31a
Being a parent is harder than I thought it would be.
Q1A29b* m4b6b, m4b31b
f4b6b, f4b31b
I feel trapped by my responsibilities as a parent.
Q1A29c* m4b6c, m4b31c
f4b6c, f4b31c
I find that taking care of my child(ren) is much more work
than pleasure.
Q1A29d* m4b6d, m4b31d
f4b6d, f4b31d
I often feel tired, worn out, or exhausted from raising a
family

85 | P a g e
16.4. Scale – Conflict Tactics Section G of the PCG Survey contains 14 items from the Parent-Child Conflict Tactics
Scales (CTSPC). The original Conflict Tactics Scale (1979) was designed for use with
partners in a marital, cohabiting, or dating relationship. The CTSPC was created in 1995
in response to limitations of the original scale as a measure of child maltreatment.51
16.4.1. Variables In-Home Variables: p4g1-p4g19 (19 variables)
16.4.2. Modifications Our survey eliminates eight questions from the CTSPC that ask about severe physical
maltreatment. However, we include the CTSPC’s supplemental scale on Neglect
(p4g15-19; 5 questions). The 19 resulting questions from our survey are listed in Table 43
below under relevant subsections with prevalence and chronicity statistics from the
pioneer Gallup survey conducted in 1995.
51 Straus, M.A., Hamby, S.L., Finkelhor, D., Moore, D.W., & Runyan, D. (1998). Identification of child maltreatment with the
Parent-Child conflict Tactics Scales: Development and psychometric data for a national sample of American parents.
Child Abuse & Neglect, 22(4), 249 – 270.

86 | P a g e
Table 43: Conflict Tactics Scales Variables Variable Name; Scale; Item Year Ever Chronicity*
Nonviolent Discipline 97.7 99.9 46.0
p4g1. Explained why something was wrong 94.3 94.5 18.3
p4g5. Gave him/her something else to do instead of what he/she
was doing
77.0 83.1 12.2
p4g12. Took away privileges from him/her 76.0 78.5 10.8
p4g2. Put in “time out” (or sent to room) 75.5 81.3 13.0
Psychological Aggression 85.6 89.9 21.7
p4g6. Shouted, yelled, or screamed at 84.7 86.7 12.8
p4g10. Threatened to spank or hit but didn’t actually do it 53.6 61.8 10.6
p4g8. Swore or cursed at 24.3 26.0 6.5
p4g14. Called him/her dumb or lazy or some other name like that 16.3 17.5 5.7
p4g9. Said they would send him/her away or would kick him/her
out of the house
6.0 7.0 3.9
Physical Assault n/a n/a n/a
p4g7. Spanked him/her on the bottom with their bare hand 46.9 63.6 7.5
p4g4. Hit him/her on the bottom with something like a belt,
hairbrush, a stick or some other hard object
20.7 29.4 5.5
p4g11. Slapped him/her on the hand, arm, or leg 36.9 51.2 7.3
p4g13. Pinched him/her 4.3 5.9 6.4
p4g3. Shook him/her 9.0 15.0 2.8
Neglect 27.0 30.6 6.9
p4g15. Had to leave their child home alone, even when they
thought some adult should be with him/her
19.5 21.3 6.0
p4g16. Was so caught up with their own problems that they were
not able to show or tell their child that they loved him/her
.2 1.1 4.6
p4g17. Was not able to make sure their child got the food he/she
needed
11.0 13.7 5.5
p4g18. Was not able to make sure their child got to a doctor or
hospital when he/she needed it
.4 1.2 2.0
p4g19. Was so drunk or high that they had a problem taking care
of their child
2.3 3.3 5.9
* prevalence and chronicity statistics from the pioneer Gallup survey (1995), NOT based on
FFCWS data
16.4.3. Scoring Information For each question, subjects were asked to choose one of eight responses to the
question “How many times have you done this in the past year?” The possible
responses were:
a) once, b) twice, c) 3-5 times, d) 6-10 times, e) 11-20 times, f) more than 20 times,
g) not in the past year, but it happened before, or h) this has never happened.
As seen above, the CTSPC can be used to estimate both prevalence and chronicity. -
For research use, Prevalence (the percent who engaged in one more of the acts in the
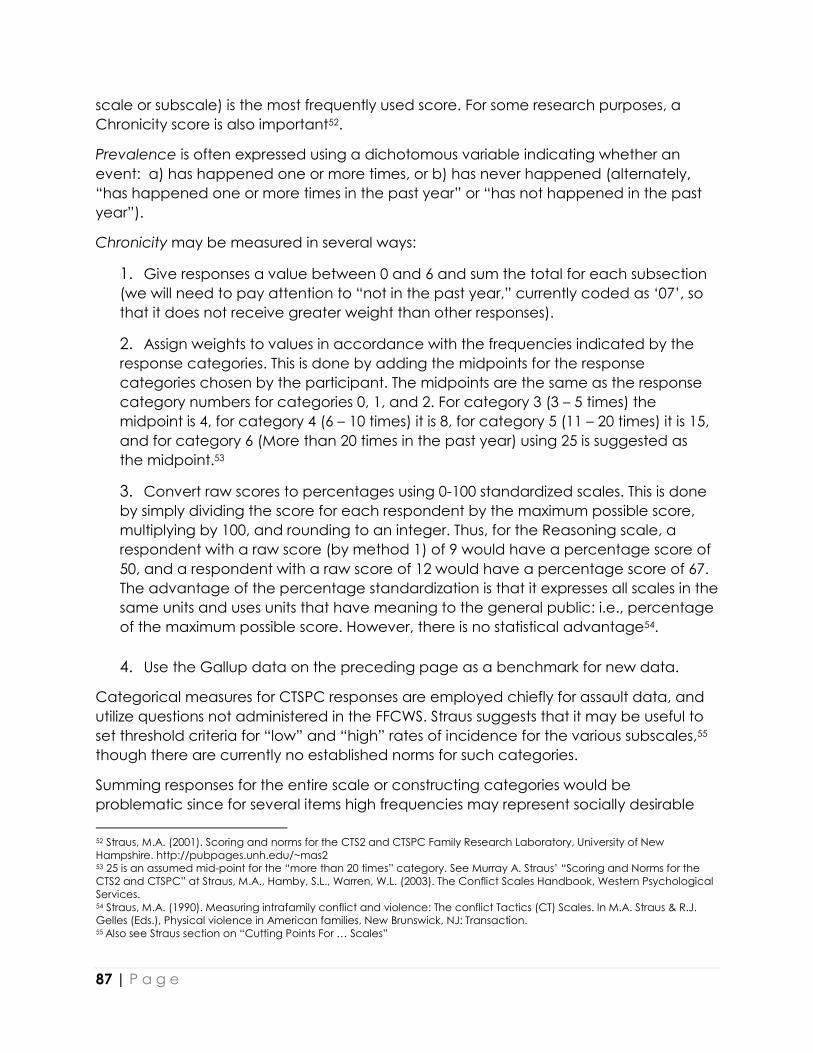
87 | P a g e
scale or subscale) is the most frequently used score. For some research purposes, a
Chronicity score is also important52.
Prevalence is often expressed using a dichotomous variable indicating whether an
event: a) has happened one or more times, or b) has never happened (alternately,
“has happened one or more times in the past year” or “has not happened in the past
year”).
Chronicity may be measured in several ways:
1. Give responses a value between 0 and 6 and sum the total for each subsection
(we will need to pay attention to “not in the past year,” currently coded as ‘07’, so
that it does not receive greater weight than other responses).
2. Assign weights to values in accordance with the frequencies indicated by the
response categories. This is done by adding the midpoints for the response
categories chosen by the participant. The midpoints are the same as the response
category numbers for categories 0, 1, and 2. For category 3 (3 – 5 times) the
midpoint is 4, for category 4 (6 – 10 times) it is 8, for category 5 (11 – 20 times) it is 15,
and for category 6 (More than 20 times in the past year) using 25 is suggested as
the midpoint.53
3. Convert raw scores to percentages using 0-100 standardized scales. This is done
by simply dividing the score for each respondent by the maximum possible score,
multiplying by 100, and rounding to an integer. Thus, for the Reasoning scale, a
respondent with a raw score (by method 1) of 9 would have a percentage score of
50, and a respondent with a raw score of 12 would have a percentage score of 67.
The advantage of the percentage standardization is that it expresses all scales in the
same units and uses units that have meaning to the general public: i.e., percentage
of the maximum possible score. However, there is no statistical advantage54.
4. Use the Gallup data on the preceding page as a benchmark for new data.
Categorical measures for CTSPC responses are employed chiefly for assault data, and
utilize questions not administered in the FFCWS. Straus suggests that it may be useful to
set threshold criteria for “low” and “high” rates of incidence for the various subscales,55
though there are currently no established norms for such categories.
Summing responses for the entire scale or constructing categories would be
problematic since for several items high frequencies may represent socially desirable
52 Straus, M.A. (2001). Scoring and norms for the CTS2 and CTSPC Family Research Laboratory, University of New
Hampshire. http://pubpages.unh.edu/~mas2 53 25 is an assumed mid-point for the “more than 20 times” category. See Murray A. Straus’ “Scoring and Norms for the
CTS2 and CTSPC” at Straus, M.A., Hamby, S.L., Warren, W.L. (2003). The Conflict Scales Handbook, Western Psychological
Services. 54 Straus, M.A. (1990). Measuring intrafamily conflict and violence: The conflict Tactics (CT) Scales. In M.A. Straus & R.J.
Gelles (Eds.), Physical violence in American families, New Brunswick, NJ: Transaction. 55 Also see Straus section on “Cutting Points For … Scales”

88 | P a g e
conflict management tactics. Even for undesirable tactics, there is a lack of agreement
over how to measure the severity of physical and psychological maltreatment. With
applicable standards, however, measures combining severity and chronicity would be
possible.56
56 Such measures are available for assault data. For one such measure, see the Frequency Times Severity Weighted (FS)
Scale in Kantor, G.K. and Jasinski, J.L. Out of the Darkness, pp. 123-124.

89 | P a g e
17. Legal System At Year 5, both mother and father were asked about any involvement they had had
with the criminal justice system and if so, when did the incident occur, whether they
were charged with a crime and if so, what were they charged for, as well as if and how
long did they spend time in jail or in prison. Questions were also asked regarding their
history with the criminal justice system, including if they were ever sent to a youth
correctional facility. Police contact questions included whether the respondent was
stopped by police but not arrested, and whether the respondent reported an incident
of IPV to the police. Other legal questions in the data are related to legal paternity the
father has over the child and which parent has legal custody.
Table 44: Subtopics in Legal System in Year 5 by survey instrument
Subtopics m f p h o t
Criminal Justice Involvement X X X
Legal Custody X X
Paternity X X
Police Contact and Attitudes X X
17.1. Constructed Variables - Father in Jail cm4finjail, cf4finjail, cm4ffinjail, cm4fevjail, cf4fevjail, cm4ffevjail
The constructed jail variables for mother report of father in jail, father report of his own
incarceration, combined reports, and cumulative measures of whether father has ever
been in jail are available at each wave. The constructed jail variables maximize reports
of fathers’ incarceration status based on information in the core files and from
disposition reports. The variables are coded as 0 for not in jail/never in jail and 1 for in
jail/ever in jail. We did not code cases “not in wave” on these variables; instead, missing
values represent no information available on jail status.
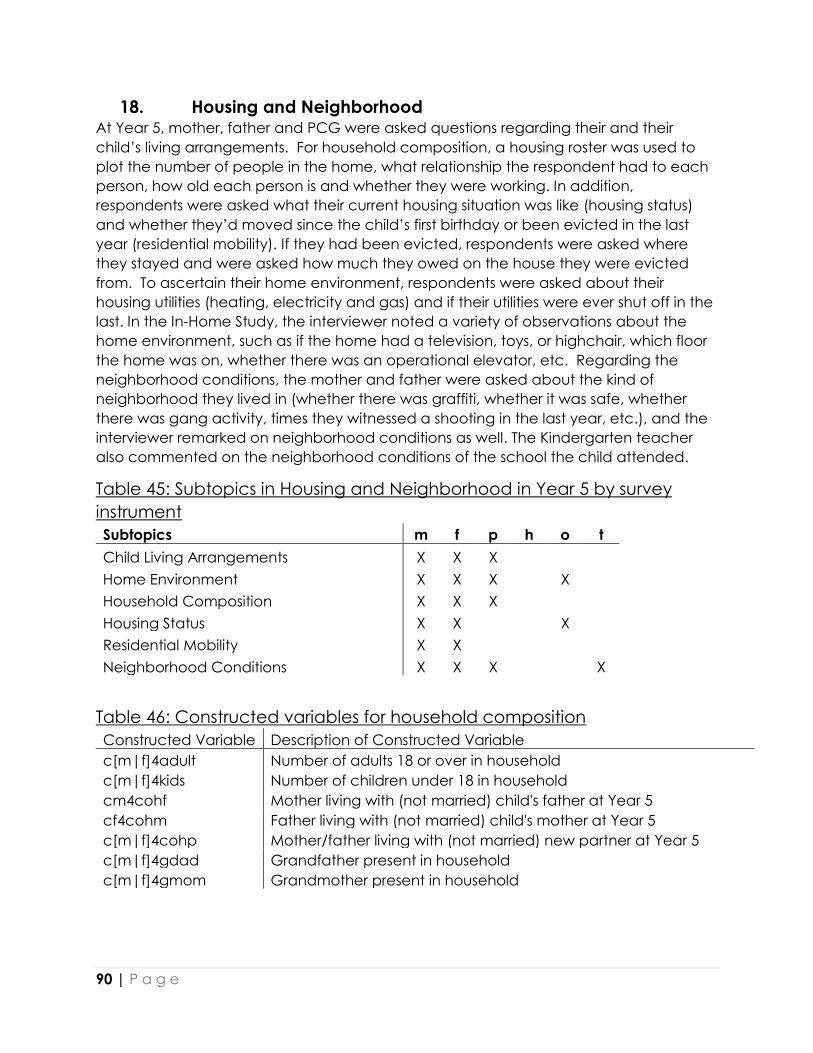
90 | P a g e
18. Housing and Neighborhood At Year 5, mother, father and PCG were asked questions regarding their and their
child’s living arrangements. For household composition, a housing roster was used to
plot the number of people in the home, what relationship the respondent had to each
person, how old each person is and whether they were working. In addition,
respondents were asked what their current housing situation was like (housing status)
and whether they’d moved since the child’s first birthday or been evicted in the last
year (residential mobility). If they had been evicted, respondents were asked where
they stayed and were asked how much they owed on the house they were evicted
from. To ascertain their home environment, respondents were asked about their
housing utilities (heating, electricity and gas) and if their utilities were ever shut off in the
last. In the In-Home Study, the interviewer noted a variety of observations about the
home environment, such as if the home had a television, toys, or highchair, which floor
the home was on, whether there was an operational elevator, etc. Regarding the
neighborhood conditions, the mother and father were asked about the kind of
neighborhood they lived in (whether there was graffiti, whether it was safe, whether
there was gang activity, times they witnessed a shooting in the last year, etc.), and the
interviewer remarked on neighborhood conditions as well. The Kindergarten teacher
also commented on the neighborhood conditions of the school the child attended.
Table 45: Subtopics in Housing and Neighborhood in Year 5 by survey
instrument
Subtopics m f p h o t
Child Living Arrangements X X X
Home Environment X X X X
Household Composition X X X
Housing Status X X X
Residential Mobility X X
Neighborhood Conditions X X X X
Table 46: Constructed variables for household composition
Constructed Variable Description of Constructed Variable
c[m|f]4adult Number of adults 18 or over in household
c[m|f]4kids Number of children under 18 in household
cm4cohf Mother living with (not married) child's father at Year 5
cf4cohm Father living with (not married) child's mother at Year 5
c[m|f]4cohp Mother/father living with (not married) new partner at Year 5
c[m|f]4gdad Grandfather present in household
c[m|f]4gmom Grandmother present in household
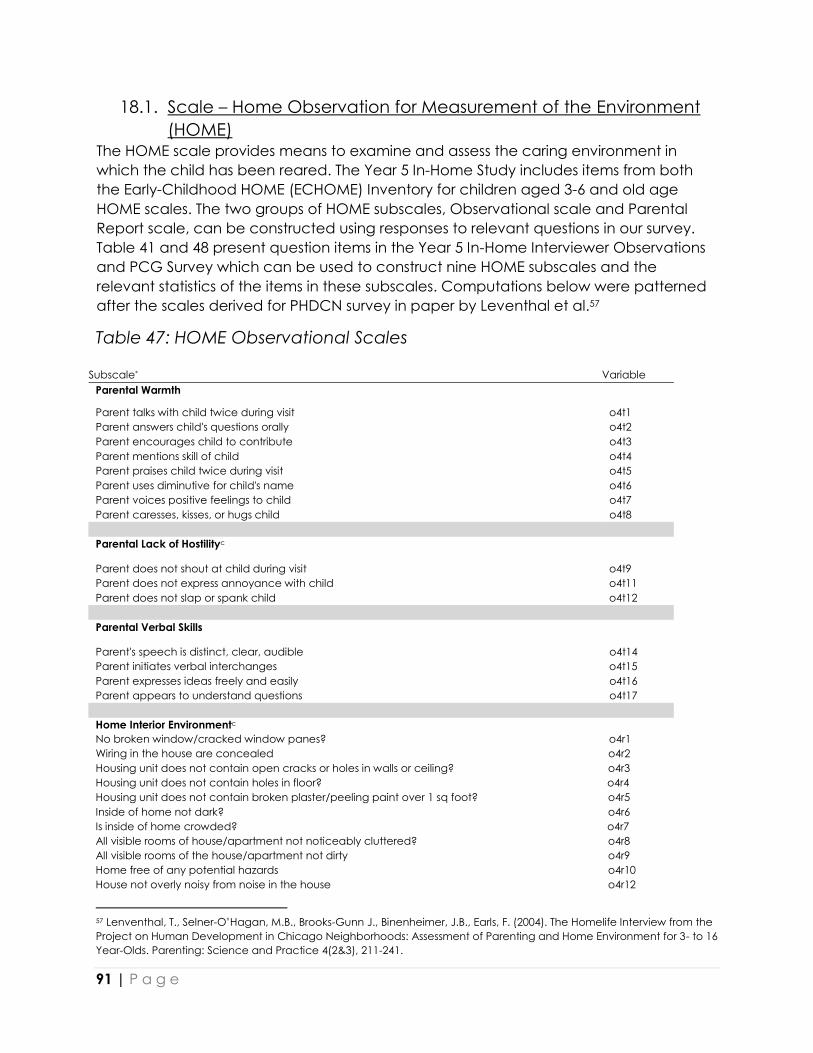
91 | P a g e
18.1. Scale – Home Observation for Measurement of the Environment
(HOME) The HOME scale provides means to examine and assess the caring environment in
which the child has been reared. The Year 5 In-Home Study includes items from both
the Early-Childhood HOME (ECHOME) Inventory for children aged 3-6 and old age
HOME scales. The two groups of HOME subscales, Observational scale and Parental
Report scale, can be constructed using responses to relevant questions in our survey.
Table 41 and 48 present question items in the Year 5 In-Home Interviewer Observations
and PCG Survey which can be used to construct nine HOME subscales and the
relevant statistics of the items in these subscales. Computations below were patterned
after the scales derived for PHDCN survey in paper by Leventhal et al.57
Table 47: HOME Observational Scales
Subscale* Variable
Parental Warmth
Parent talks with child twice during visit o4t1
Parent answers child's questions orally o4t2
Parent encourages child to contribute o4t3
Parent mentions skill of child o4t4
Parent praises child twice during visit o4t5
Parent uses diminutive for child's name o4t6
Parent voices positive feelings to child o4t7
Parent caresses, kisses, or hugs child o4t8
Parental Lack of Hostilityc
Parent does not shout at child during visit o4t9
Parent does not express annoyance with child o4t11
Parent does not slap or spank child o4t12
Parental Verbal Skills
Parent's speech is distinct, clear, audible
o4t14
Parent initiates verbal interchanges o4t15
Parent expresses ideas freely and easily o4t16
Parent appears to understand questions o4t17
Home Interior Environmentc
No broken window/cracked window panes? o4r1
Wiring in the house are concealed o4r2
Housing unit does not contain open cracks or holes in walls or ceiling? o4r3
Housing unit does not contain holes in floor? o4r4
Housing unit does not contain broken plaster/peeling paint over 1 sq foot? o4r5
Inside of home not dark? o4r6
Is inside of home crowded? o4r7
All visible rooms of house/apartment not noticeably cluttered? o4r8
All visible rooms of the house/apartment not dirty o4r9
Home free of any potential hazards o4r10
House not overly noisy from noise in the house o4r12
57 Lenventhal, T., Selner-O’Hagan, M.B., Brooks-Gunn J., Binenheimer, J.B., Earls, F. (2004). The Homelife Interview from the
Project on Human Development in Chicago Neighborhoods: Assessment of Parenting and Home Environment for 3- to 16
Year-Olds. Parenting: Science and Practice 4(2&3), 211-241.

92 | P a g e
Subscale* Variable
Condition of Surrounding Blockc
Garbage, litter, broken glasses on street o4p1
General condition of most buildings on block o4p2
Graffiti on the buildings/walls on block/within 100 yards o4p3
Vacant or abandoned building on block o4p4
Home Exterior Environmentc
Environment immediately outside home does not have unlit entrance or stairway o4p6a
Environment outside home does not have broken steps? o4p6b
Environment outside home does not have broken glass or broken toys o4p6c
Environment outside home does not have large ditches? o4p6d
Environment outside home does not have alcohol/drug paraphernalia? o4p6e
Environment outside home does not have strewn garbage/litter o4p6f
Exterior of building does not have peeling paint/need paint job? o4p7a
Exterior of building does not have crumbling or damaged walls? o4p7b
Table 48: HOME Parental Report Scales Subscale* Variable
Developmental Stimulationa
Access to toy or real musical instrument
p4c2
Access to toys to learn colors p4c1a
Access to toys to learn sizes p4c1b
Access to toys to learn shapes p4c1c
Access to toys to learn numbers p4c1e
Access to toys to learn animal names/behaviors p4c1d
Access to toys to learn spatial relations p4c1f
Access to at least 3 puzzles p4c3 & p4c4
Access to toys to learn patterned speech
(assuming this is "nursery rhymes or songs") p4c1g
Access to toys permitting free expression (assuming this
is "anything to make/draw things")
p4c5
Access to Readinga b
Parent/family member reads to child 3x/wk p4c7
Child has access to toys to learn alphabet p4c1h
Child has access to 10 books p4c9 & p4c10
Child has 3 or more books of own p4c11& p4c12
Outings/Activitiesa
Parent engages in outdoor recreational activities with
child every other week
p4c16a
Child goes on outings every other week p4c16b
Child has gone to museum past year p4c17a
Child has taken trip >50 miles from home in the past year p4c17c
Child was included in family's hobby p4c16c
Child has taken trip on plane, train, bus in the past year p4c17b

93 | P a g e
18.2. Concept – Exposure to Violence The variables in this section p4h1-p4h7 were adapted from the “My Exposure To
Violence” Interviews.58,59 Because we utilize only 7 items from this instrument, and
because these items have been adapted from the originals, we offer no standardized
methods for coding or analysis.
58 Buka, S., Selner-O’Hagan, M., Kindlon, D., & Earls, F. (1996). My exposure to violence and my child’s exposure to
violence. Unpublished manual. 59 Selner-O'Hagan, M. B., D.J. Kindlon, S.L. Buka, S.W. Raudenbush and F.J. Earls (1998). “Assessing Exposure to Violence in
Urban Youth.” Journal of Child Psychology and Psychiatry and Allied Disciplines, 39, pp. 215-224.

94 | P a g e
18.3. Scale – Neighborhood Collective Efficacy The Year 5 Core Surveys includes two sets of items that together measure neighborhood
collective efficacy. The first set is related to informal social control and the second
measures the level of cohesion and trust.
Items I0M1- I0M5 of this Section were reconstructed from the Informal Social Control
Scale and items I0N1-I0N5 from the Social Cohesion and Trust Scale.60,61 We are unable
to offer a standardized method for scoring/analyzing these variables, as the measures
have been altered from the original instruments.
18.3.1. Variables Mother Survey: m4i0m1- m4i0m5; m4i0n1- m4i0n5
Father Survey: f4i0m1- f4i0m5; f4i0n1- f4i0n5
60 Sampson, R. J. (1997). “Collective Regulation of Adolescent Misbehavior: Validation
Results from Eighty Chicago Neighborhoods.” Journal of Adolescent Research, 12(2), 227-244. 61 Sampson, R. J., Raudenbush, S. W., & Earls, F. (1997). Neighborhoods and Violent Crime: A Multilevel Study of Collective
Efficacy. Science, 211(5328): 918-924
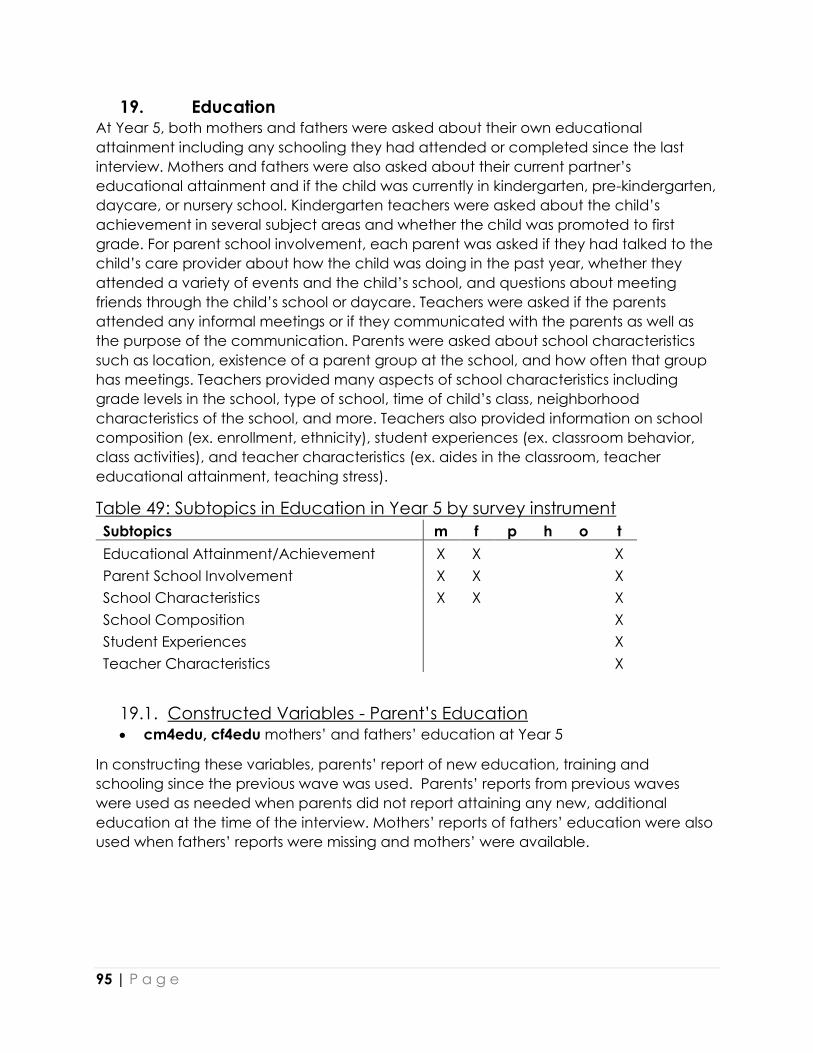
95 | P a g e
19. Education At Year 5, both mothers and fathers were asked about their own educational
attainment including any schooling they had attended or completed since the last
interview. Mothers and fathers were also asked about their current partner’s
educational attainment and if the child was currently in kindergarten, pre-kindergarten,
daycare, or nursery school. Kindergarten teachers were asked about the child’s
achievement in several subject areas and whether the child was promoted to first
grade. For parent school involvement, each parent was asked if they had talked to the
child’s care provider about how the child was doing in the past year, whether they
attended a variety of events and the child’s school, and questions about meeting
friends through the child’s school or daycare. Teachers were asked if the parents
attended any informal meetings or if they communicated with the parents as well as
the purpose of the communication. Parents were asked about school characteristics
such as location, existence of a parent group at the school, and how often that group
has meetings. Teachers provided many aspects of school characteristics including
grade levels in the school, type of school, time of child’s class, neighborhood
characteristics of the school, and more. Teachers also provided information on school
composition (ex. enrollment, ethnicity), student experiences (ex. classroom behavior,
class activities), and teacher characteristics (ex. aides in the classroom, teacher
educational attainment, teaching stress).
Table 49: Subtopics in Education in Year 5 by survey instrument
Subtopics m f p h o t
Educational Attainment/Achievement X X X
Parent School Involvement X X X
School Characteristics X X X
School Composition X
Student Experiences X
Teacher Characteristics X
19.1. Constructed Variables - Parent’s Education • cm4edu, cf4edu mothers’ and fathers’ education at Year 5
In constructing these variables, parents’ report of new education, training and
schooling since the previous wave was used. Parents’ reports from previous waves
were used as needed when parents did not report attaining any new, additional
education at the time of the interview. Mothers’ reports of fathers’ education were also
used when fathers’ reports were missing and mothers’ were available.
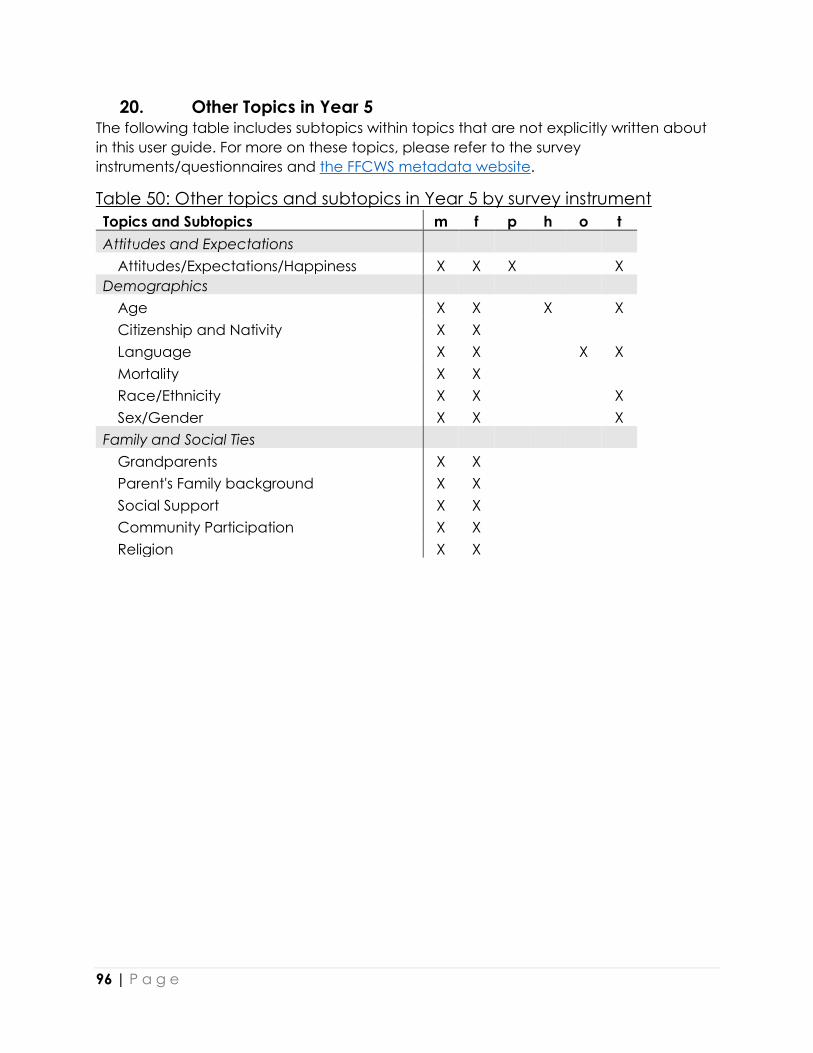
96 | P a g e
20. Other Topics in Year 5 The following table includes subtopics within topics that are not explicitly written about
in this user guide. For more on these topics, please refer to the survey
instruments/questionnaires and the FFCWS metadata website.
Table 50: Other topics and subtopics in Year 5 by survey instrument
Topics and Subtopics m f p h o t
Attitudes and Expectations
Attitudes/Expectations/Happiness X X X X
Demographics
Age X X X X
Citizenship and Nativity X X
Language X X X X
Mortality X X
Race/Ethnicity X X X
Sex/Gender X X X
Family and Social Ties
Grandparents X X
Parent's Family background X X
Social Support X X
Community Participation X X
Religion X X

97 | P a g e
Appendix: Additional Information on the Year 5 In-Home Survey
0. Study Background and Administration The In-Home Study was funded by a grant from the National Institutes of Health. The
research was a collaborative work of the researchers at the Center for Health and
Wellbeing (CRCW) of Princeton University and Teachers College of Columbia University.
Data collection was administered by Mathematica Policy Research, Inc. (MPR) in
Princeton, NJ.
0.1. Research Team The PIs of the In-Home Study included Christina Paxson, Jane Waldfogel, Neal B.
Guterman, and Jeanne Brooks-Gunn.
0.2. Components of the Study The In-Home Study consisted of three major components at Year 5: (1) the Primary
Caregiver (PCG) Survey, (2) the Activity Workbook, and (3) Interviewer Observations.
The PCG Survey questionnaire covers child’s health status and some details about the
most-recent accidents which occurred to the child, family routines, home toys and
activity items, nutrition, family’s expenditure on foods, housing characteristics, parental
stress, parental mastery, child discipline, nutrition and food expenditure, exposure to
violence, Child Protection Services (CPS) contact, child’s behavior problems, housing
common areas, interior of house, child’s appearance, family’s food expenditures, home
scales, and child’s emotion and cooperation. Variables derived from the Year 5 PCG
survey begin with the prefix “p4”.
The remaining questions in the In-Home survey were designed for the interviewers to fill
in their observations about the home environment, child’s appearance, and parent-
child interaction. We call this section of the survey the Interviewer Observations.
Variables derived from the Year 5 Interviewer Observations begin with the prefix “o4”.
The Activity Workbook was designed to record the height and weight measurements of
both child and mother or caretaker; responses to the Peabody Picture Vocabulary Test
(PPVT) and the Woodcock-Johnson Letter-Word Recognition test. In addition, the
workbook also includes an introduction script to request for permission to obtain the
contact information of the teacher of the children, who had been enrolling in
kindergarten, for a teacher interview, a separate component of the CCPE. Variables
derived from the Year 5 Activity Workbook begin with the prefix “h4”.
0.3. Conducting the In-Home Survey The Year 5 In-Home Study was conducted mostly in 2004 in the two pilot cities; and in
2005-2006 in the remaining eighteen cities.
Slightly over 91 percent of the respondents of the Year 5 Core mother survey were
contacted and invited to participate in the In-Home survey. Among people contacted,
about eighty one (81) percent completed the Year 5 In-Home Study. About seventy-

98 | P a g e
eight (78) percent of the Year 5 In-Home respondents completed all components of the
survey. Most of the remaining participants completed only the PCG interview over the
telephone either because the parent or the care giver refused participation in the In-
Home Study or such visit could not be conducted because the family had moved
away from the last located residence without leaving any new contact information. A
very small fraction of the respondents completed only a part of the Activity Workbook.
Respondents of the Fragile Families Baseline survey were located and screened for
eligibility for inclusion in the succeeding waves of the core survey and collaborative
studies of the core survey.
The survey administration process for both the Core and In-Home Studies is illustrated in
the flowchart in Figure 1.1. The process of administering the Year 5 In-Home surveys is
presented in the flowchart in Figure 1.2.a., 1.2.b, and 1.2.c. These charts show the initial
process of administering the Year 5 In-Home Study in the two pilot cities and the revised
process implemented in the remaining eighteen cities as follows:
- Version 1.2.a was used for the first wave survey in the two pilot cities with In-Home
Survey completed in home.
- Version 1.2.b was used for the second wave survey, In-Home Survey completed
in home.
- Version 1.2.c was used for the third wave survey, In-Home Survey completed over
the telephone.

99 | P a g e
Figure 1.1 Process of Administering the Fragile Families Core Study and the
In-Home Study

100 | P a g e
Figure 1.2.a Conducting Year 5 In-Home Survey in Pilot Cities Core Study completed on telephone or contact made in field. In-Home Study
completed in home.
Fragile Families Core Survey(phone)
End of Core Phone Script
In-Home Intro Script
Field Contact Script
Good time for child?
Activities: - For child and mom : Height and weight measurements
- for child: PPVT and W-J Letter recognition.
- for mom: PPVT/TVIP
Complete Core ( if necessary)
Yes No
In-Home Parent Survey

101 | P a g e
Figure 1.2.b. Conducting Year 5 In-Home Study in 18 cities Core Study completed on telephone or contact made in field. In-Home Study
completed in home.
Legends:
Core Survey In-Home Survey CCPE
Fragile Families Core 5- Year Survey (phone)
End of Core Phone Script
5- Year In-Home Introduction Script
Field Contact Script
Good time for child?
In-Home Parent Questionnaire
Activity Workbook if not completed), (
Including CCPE script if necessary) (
Yes No Activities : Height and Weight Child’s PPVT, WJ Test Parent’s PPVT/TVIPand Attention Sustained task Five-min Speech sample ---------------------------- Child Care & Parental Employment (CCPE) History Calendar
Complete Core survey if necessary) (
Good time for child?
Yes
No
Survey of Parents Kindergarten Script
Yes to participate
Obtain permission to contact teacher and complete question 27
If not completed Activities
No
E26: child attending kindergarten?
Yes

102 | P a g e
Figure 1.2.c. Conducting Year 5 In-Home Study in 18 cities Core Study completed on telephone or contact made in field. In-Home Study
completed over the telephone.
Core Survey In-Home Survey CCPE
Fragile Families Core Year Survey (phone) 5-
End of Core Phone Script
Field Contact Script
Phone version of Parent Survey Year In-Home 5-
Script to request an IH visit for Activities with cash incentive ( )
no mention about CCPE
In-Home Parent Questionnaire
Activity Workbook ( if not completed),
Including CCPE script ( if necessary)
Activities : Height and Weight Child’s PPVT, WJ Test Parent’s PPVT/TVIPand
Yes
Survey of Parents Kindergarten Script
Obtain permission to contact teacher and complete question 27
No
E26: child attending kindergarten?
Yes
Permission to visit home granted?
No
Complete Core survey
( if necessary)
Attention Sustained task Five-min Speech sample ---------------------------- Child Care & Parental Employment (CCPE) History Calendar
Legends :
If not completed Activities

103 | P a g e
1. Questionnaire Changes between Pilot Survey and the Revised Survey In 200462 the first wave of data collection of the Year 5 In-home Study was
conducted for two pilot cities. Data collection in this period was closely
monitored and the data gathered was analyzed and evaluated in order to
design strategies to improve data collection in the remaining cities including
identification of necessary modifications to the contents and structure of the
questions to improve the usefulness and quality of data collected.
Interviews in the 18 non-pilot cities were conducted in 2005-2006. Modification of the
survey instruments for these cities was assessed as not necessary, with a few exceptions.
1.1. Minor change to response option A minor change was made to a “No” response, pre-coded as “2”, for a few
questions with “Yes” or “No” response in the pilot instrument to “0” for similar
responses in the remaining 18 cities. This change made the negative response
code of the affected variables consistent with the code used in other
variables. Recodes of data values of the affected variables were done for
data of the pilot cities when we cleaned data for release.
1.2. Integration of Child Care and Parental Employment (CCPE)
questionnaire To facilitate data collection for another collaborative study, the Child Care
and Parental Employment (CCPE) questionnaire was integrated to the In-
Home Activity Workbook (version used for 18 cities).
Components of the survey for the CCPE included in the Activity Workbook of the Year 5
In-Home survey include: the PCG’s Employment History Calendar (variable name
prefix: ch4emp); Child Care Calendar information (ch4cc), Leiter-R Attention Sustained
Task(ch4lr), Five-Minute Speech sample (ch4mdoc), and a request to obtain contact
information of the kindergarten teacher of the child.
1.3. Activity Workbook timing When the In-Home Study was conducted in the remaining 18 cities, the interviewer
could conduct the Activity Workbook with the respondent and child in one of the
following three orders:
a) immediately after the "Neglect Introduction Script" (first thing),
b) following completion of the core, or
c) at the end of the PCG interview (after core and PCG survey).
Refer to flowchart version 1.2.b for further illustration.
In the pilot version, only the possibilities presented in (b) and (c) were
employed. For the LSPAC conducted on the phone (flowchart version 1.2.c), a
62 A few parents were interviewed a few months earlier when the survey instruments were finalized.

104 | P a g e
script was used to request permission to visit the home for administering the
activity component of the study (this process had been followed in the pilot
cities).

105 | P a g e
2. Sample Counts and Attrition Overtime Similar to most other longitudinal surveys, attrition is an issue that researchers will have to
face when analyzing the FFCWS data across survey periods.
At Year 5, about eighty-five (84.7) percent of the baseline respondents completed the
Core Mother survey. Due to budget constraints at the beginning of the In-Home Study,
we selected only one-third of the respondents in each of two pilot cities for inclusion in
the In-Home Study. In addition, interview fatigue appeared to be another drawback in
survey participation. As such, roughly seventy-four (74) percent of the Year 5 Core
mother respondents completed the Year 5 In-Home Study. Overall, about fifty percent
of the respondents of the baseline survey participated in all five succeeding surveys:
Year 1 Core (mother survey), Year 3 Core (mother survey), Year 3 In-Home, Year 5 Core
(mother survey), and Year 5 In-Home survey.
2.1. Response Rate Overall, a total of 3,784 parents or caretakers were contacted for the Year 5 In-Home
Study. Only cases eligible for the In-Home Study with their status of survey participation
are presented in Table A2 and A3. It should be noted that not all eligible respondents of
the Year 5 Core mother survey were invited to participate in the In-Home Study
because of the following reasons:
1. financial constraints at the start of the Year 5 In-Home survey. To offset the cost, we
sampled 100 families who participated in the Year 5 Core survey (nearly one-third of the
eligible respondents) from each of two pilot cities. These sampled families were invited
to participate in the In-Home Study;
2. other shortcomings encountered during the time of data collection.
Among the 3,700 attempted eligible from the Core survey respondents: 3,001
completed either a full Year 5 In-Home Study or a component of the Study. As such, the
overall crude response rate is about 81 percent. Response rate based on race and
relationship of mother and father at the time of conducting the Year 5 Core survey are
presented in Table A1 and A2.
Table A1: Crude Response Rate by Race of Mother
Mom’s Race
Y5 In-Home
Respondent
Total Cases
Contacted
Crude Response
Rate (%)
Missing race 6 7 85.71
White, Non-Hispanic 638 789 79.82
Black, Non-Hispanic 1545 1850 82.70
Hispanic 749 915 81.20
Other 85 85 52.94
Total 3023 3700 81.11
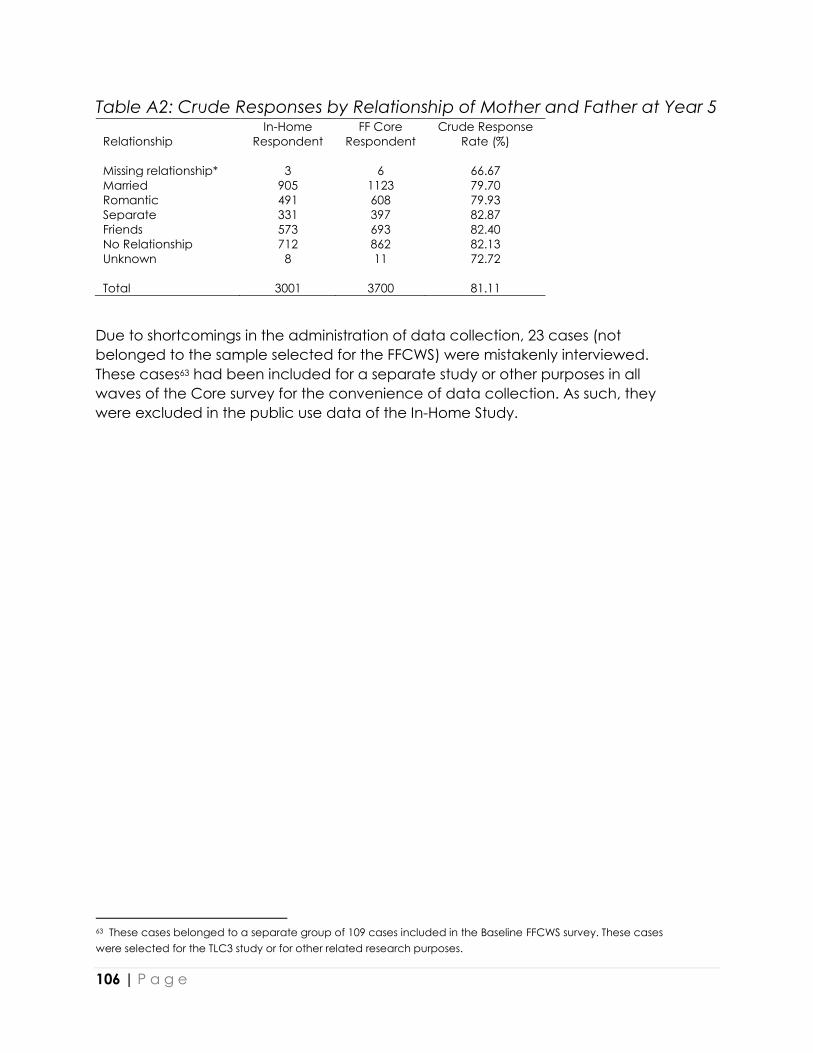
106 | P a g e
Table A2: Crude Responses by Relationship of Mother and Father at Year 5
Relationship
In-Home
Respondent
FF Core
Respondent
Crude Response
Rate (%)
Missing relationship* 3 6 66.67
Married 905 1123 79.70
Romantic 491 608 79.93
Separate 331 397 82.87
Friends 573 693 82.40
No Relationship 712 862 82.13
Unknown 8 11 72.72
Total 3001 3700 81.11
Due to shortcomings in the administration of data collection, 23 cases (not
belonged to the sample selected for the FFCWS) were mistakenly interviewed.
These cases63 had been included for a separate study or other purposes in all
waves of the Core survey for the convenience of data collection. As such, they
were excluded in the public use data of the In-Home Study.
63 These cases belonged to a separate group of 109 cases included in the Baseline FFCWS survey. These cases
were selected for the TLC3 study or for other related research purposes.