user’s manual for the highway safety manual analysis tool ... · functionality of the hsm safety...
TRANSCRIPT

Pennsylvania Department of Transportation
User’s Manual for
The Highway Safety Manual Analysis Tool
& The Alternatives and Safety
Benefit Analysis Tool

Background and Intent
The safety culture has been evolving rapidly over the past few years, as it was acknowledged within the transportation community that how we historically viewed safety was incomplete. Consequently, there has been a shift in how we perceive, define, and analyze safety. This primarily evolved with the publishing of the American Association of State Highway and Transportation Officials’ (AASHTO) Highway Safety Manual (HSM) in 2010. The HSM provides access to the latest science-based knowledge on the proven relationship between crashes and the roadway environment, thus enabling the safety effects of actions or treatments involving the highway and street environment to be quantified.
Part C of the HSM details the predictive method, which is based on a series of models called Safety Performance Functions (SPFs). Along with geometric and volume data for a roadway, SPFs can be used to estimate the predicted crash frequency for that location. PennDOT has begun incorporating these HSM methods into their safety analysis procedures. These tools are intended to assist in performing the detailed calculations required for the Part C predictive method in order to obtain predicted and expected crash frequencies that will be used to evaluate safety performance and assist in alternative selection in Pennsylvania.
Functionality of the HSM Safety Analysis Tool
The safety analysis tool combines Ch. 10 Rural Two-Lane, Two-Way Roads, Ch. 11 Rural Multilane Highways, and Ch. 12 Urban and Suburban Arterials into one spreadsheet. A project with any combination of these three facility types may be analyzed in one file. Each analysis may include either a predicted crash frequency analysis (SPF only) or a predicted and expected crash frequency analysis (SPF and historical crash data). Summary and detailed reports may be created for each analysis.
General Information
→ Throughout the tools, there are “+” symbols that may be clicked for more information regarding certain steps or element inputs.
→ Click the toolbox icon or close a popup window to return to the toolbox. Any changed inputs in the window will not be saved. Click next or continue to save inputs.
→ The tool may be reset at any time by opening the toolbox and selecting “Reset Tool”. All data and results will be lost.

HSM Safety Analysis Tool User Instructions
Basic Analysis Steps Task 1. Create a Project File Task 2. Enter General Project Data Task 3. Enter General Element Data (repeat for each facility type) Task 4. Enter Detailed Element Data
Task 4.1. Enter Rural Two-Lane Segment Data Task 4.2. Enter Rural Two-Lane Intersection Data Task 4.3. Enter Rural Multilane Highway Segment Data Task 4.4. Enter Rural Multilane Highway Intersection Data Task 4.5. Enter Urban and Suburban Arterial Segment Data Task 4.6. Enter Urban and Suburban Arterial Intersection Data
Task 5. Generate the Summary Report (Detailed Report Optional) Task 6. Review and Print Summary Report Task 7. Review and Print Detailed Report (Optional)

Task 1. Create a Project File
1.1. Open the Pennsylvania DOT HSM spreadsheet tool. 1.2. Click “Enable Content” at the top of the spreadsheet to enable macros. 1.3. If starting a new project/analysis, save file as a new file. 1.4. Click on the toolbox to begin. The toolbox will allow users to update or change input information
throughout the analysis.
EXHIBIT 1: Toolbox Icon
Task 2. Entering General Project Data
2.1. Click the “Enter General Project Information” button in the toolbox.
EXHIBIT 2: Toolbox
2.2. On the “General Project Information” window, input the basic project information: → Project Description: Brief description of analysis project → Location: Corridor name for segments or primary roadway for intersections → Analyst: Individual entering data into the tool → District: District of the analyzed project → Analysis Jurisdiction: Agency/jurisdiction conducting the analysis → County: County of the analyzed project → Date (mm/dd/yyyy): Date that analysis is performed
Step 2.1

→ Analysis Year: Existing or horizon year of analysis 2.3. Check the box for the facility type of the project. If more than one facility type is present in the
project, select all that apply. 2.4. In the “Select the models to be used for analysis” dropdown, choose the desired SPF type to be
used: (Note: District and County SPFs should be used unless directed otherwise by PennDOT.) → District: Use the Pennsylvania SPFs with calibration specific to PennDOT districts → County: Use the Pennsylvania SPFs with calibration specific to Pennsylvania counties → HSM – AASHTO: Use the SPFs originally developed by the HSM (requires calibration factors)
2.5. Click “Next” button to continue.
EXHIBIT 3: General Project Information and Facility Type Selection
Step 2.2
Step 2.3
Step 2.5
Step 2.4
Task 3. Enter General Element Data
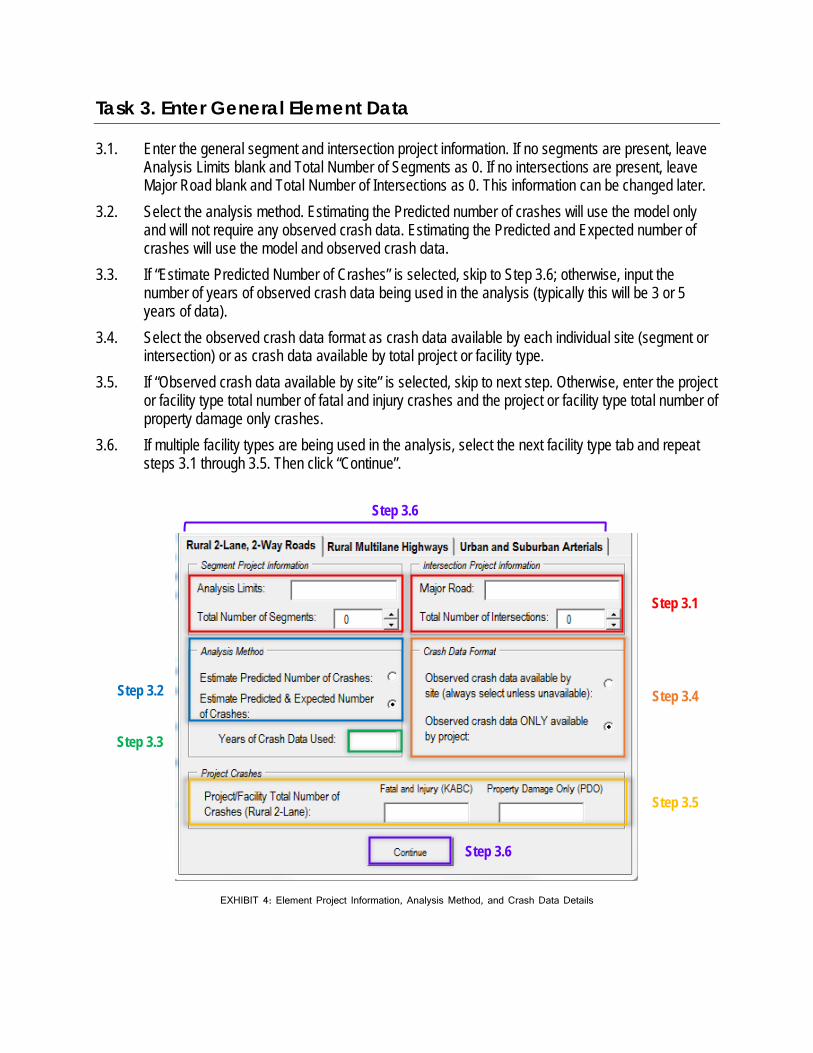
3.1. Enter the general segment and intersection project information. If no segments are present, leave Analysis Limits blank and Total Number of Segments as 0. If no intersections are present, leave Major Road blank and Total Number of Intersections as 0. This information can be changed later.
3.2. Select the analysis method. Estimating the Predicted number of crashes will use the model only and will not require any observed crash data. Estimating the Predicted and Expected number of crashes will use the model and observed crash data.
3.3. If “Estimate Predicted Number of Crashes” is selected, skip to Step 3.6; otherwise, input the number of years of observed crash data being used in the analysis (typically this will be 3 or 5 years of data).
3.4. Select the observed crash data format as crash data available by each individual site (segment or intersection) or as crash data available by total project or facility type.
3.5. If “Observed crash data available by site” is selected, skip to next step. Otherwise, enter the project or facility type total number of fatal and injury crashes and the project or facility type total number of property damage only crashes.
3.6. If multiple facility types are being used in the analysis, select the next facility type tab and repeat steps 3.1 through 3.5. Then click “Continue”.
EXHIBIT 4: Element Project Information, Analysis Method, and Crash Data Details
Step 3.1
Step 3.2
Step 3.3
Step 3.4
Step 3.5
Step 3.6
Step 3.6

Task 4. Enter Detailed Element Data
Upon continuing from the “General Project Information” window, the input window for the inputs of the first facility types selected will appear. This will vary by project. For specific instructions for each facility type, refer to Task 4.1 for Rural Two-Lane segments, Task 4.2 for Rural Two-Lane intersections, Task 4.3 for Rural Multilane segments, Task 4.4 for Rural Multilane intersections, Task 4.5 for Urban/Suburban Arterial segments, and Task 4.6 for Urban/Suburban Arterial intersections. Make sure to complete all of the inputs for all facility types included in the project.
Task 4.1 Enter Rural Two-Lane Segment Data 4.1.1. Click the “Segment” drop down to select which segment to input data for. Do not input any
information if “Select Segment” is displayed in the drop down. 4.1.2. Enter the additional location information: Segment ID and Segment Offset. For Segment ID, if the
segment being analyzed consists of only one segment ID, enter that value. If it consists of more than one segment ID, enter the ID of the most southern or western segment only. For Segment Offset, enter the offset value of the start of the analyzed segment that corresponds to the Segment ID provided.
4.1.3. Enter information in every box or drop down for Geometric and Traffic Data, Horizontal Curve Data (only one curve may be input per segment when HSM SPFs are used, PennDOT SPFs may have up to 10), Cross-Section Data, and Other Data. For Rural Two-Lane Segments, these inputs include: → Length of Segment (in miles) → Average Annual Daily Traffic (AADT
in vehicles/day) → Lane Width (in feet) → Shoulder Width (in feet) → Shoulder Type → Number of Horizontal Curves → Length of Horizontal Curve (in miles)* → Radius of Curvature (in feet)* → Sum of Degrees: All Curves (degrees) → Spiral Transition Curve*
→ Superelevation Variance (in ft/ft)* → Centerline Rumble Strips → Shoulder Rumble Strips → Passing Lane(s) → Two Way Left-Turn Lane → Segment Lighting → Driveway Density (driveways/mile) → Roadside Hazard Rating (1-7) → Automated Speed Enforcement → Grade (%) → Calibration Factor (C) (HSM only)
NOTE: For more information on each of these inputs, select the “+” symbol next to the appropriate inputs. This will provide definitions, possible input values, base condition values, or other pertinent information. *These inputs are only applicable for when HSM SPFs are used.
4.1.4. If “Observed crash data available by site” was selected on the “General Project Information” window, enter the crash information by severity type. Otherwise, skip to next step. (Input boxes will only be shown if the applicable option was selected.)
4.1.5. Click “Next Segment” button to automatically select the next segment. 4.1.6. Repeat Steps 4.1.2 through 4.1.5 for each segment in the project until all segments for this input
window have been completed.

4.1.7. Click “Save & Continue” to proceed to toolbox. NOTE: If desired, click the “Reset Form” button to clear all inputs on the open window and reset to the default values.
Task 4.2 Enter Rural Two-Lane Intersection Data If this is not the first facility type in this analysis, select the “Rural Two-Lane Roads: Intersection Inputs” button from the toolbox, before following the steps below.
4.2.1. Click the “Intersection” drop down to select which Intersection to input data for. Do not input any information if “Select Intersection” is displayed in the drop down.
4.2.2. Enter the additional location information: Intersection Location, Major Road, and Minor Road. 4.2.3. Enter information in every other box or drop down for Geometric and Traffic Data, Skew Angle
Data, and Other Data. For Rural Two-Lane Intersections, these inputs include: → Traffic Control Type → Intersection Type → Major Road Average Annual Daily
Traffic (AADT in vehicles/day) → Minor Road Average Annual Daily
Traffic (AADT in vehicles/day) → Intersection Skew Angle → Major Road Posted Speed Limit
(mph)
→ Minor Road Posted Speed Limit (mph) → Major Road Crosswalk → Minor Road Crosswalk → Non-Stop Controlled Approaches with
Left-Turn Lanes → Non-Stop Controlled Approaches with
Right-Turn Lanes → Intersection Lighting → Calibration Factor (HSM only)
NOTE: For more information on each of these inputs, select the “+” symbol next to the appropriate inputs. This will provide definitions, possible input values, base condition values, or other pertinent information.
4.2.4. If “Observed crash data available by site” was selected on the “General Project Information” window, enter the crash information by severity type. Otherwise, skip to next step. (Input boxes will only be shown if the applicable option was selected.)
4.2.5. Click “Next Intersection” button to automatically select the next Intersection. 4.2.6. Repeat Steps 4.2.2 through 4.2.5 for each intersection in the project until all intersections for this
input window have been completed. 4.2.7. Click “Save & Continue” to proceed to toolbox.
NOTE: If desired, click the “Reset Form” button to clear all inputs on the open window and reset to the default values.

Task 4.3 Enter Rural Multilane Highway Segment Data If this is not the first facility type in this analysis, select the “Rural Multilane Highways: Segment Inputs” button from the toolbox, before following the steps below.
4.3.1. Click the “Segment” drop down to select which segment to input data for. Do not input any
information if “Select Segment” is displayed in the drop down. 4.3.2. Enter the additional location information: Segment ID and Segment Offset. For Segment ID, if the
segment being analyzed consists of only one segment ID, enter that value. If it consists of more than one segment ID, enter the ID of the most southern or western segment only. For Segment Offset, enter the offset value of the start of the analyzed segment that corresponds to the Segment ID provided.
4.3.3. Enter information in every other box or drop down for Geometric and Traffic Data, Cross-Section Data, and Other Data. For Rural Multilane Segments, these inputs include: → Length of Segment (in miles) → Average Annual Daily Traffic (AADT
in vehicles/day) → Lane Width (in feet) → Shoulder Width (in feet) → Shoulder Type → Sum of Degrees: All Curves
(degrees) → Divided/Undivided Highway
→ Median Width → Sideslopes → Roadside Hazard Rating → Centerline Rumble Strips → Shoulder Rumble Strips → Lighting → Automated Speed Enforcement → Calibration Factor (HSM only)
NOTE: For more information on each of these inputs, select the “+” symbol next to the appropriate inputs. This will provide definitions, possible input values, base condition values, or other pertinent information.
4.3.4. If “Observed crash data available by site” was selected on the “General Project Information” window, enter the crash information by severity type. Otherwise, skip to next step. (Input boxes will only be shown if the applicable option was selected.)
4.3.5. Click “Next Segment” button to automatically select the next segment. 4.3.6. Repeat Steps 4.3.2 through 4.3.5 for each segment in the project until all segments for this input
window have been completed. 4.3.7. Click “Save & Continue” to proceed to toolbox.
NOTE: If desired, click the “Reset Form” button to clear all inputs on the open window and reset to the default values.

Task 4.4 Enter Rural Multilane Highway Intersection Data If this is not the first facility type in this analysis, select the “Rural Multilane Highways: Intersection Inputs” button from the toolbox, before following the steps below.
4.4.1. Click the “Intersection” drop down to select which Intersection to input data for. Do not input any
information if “Select Intersection” is displayed in the drop down. 4.4.2. Enter the additional location information: Intersection Location, Major Road, and Minor Road. 4.4.3. Enter information in every other box or drop down for Geometric and Traffic Data, Turn Lane Data,
and Other Data. For Rural Multilane Intersections, these inputs include: → Traffic Control Type → Intersection Type → Major Road Average Annual Daily
Traffic (AADT in vehicles/day) → Minor Road Average Annual Daily
Traffic (AADT in vehicles/day) → Intersection Skew Angle
→ Non-Stop Controlled Approaches with Left-Turn Lanes
→ Non-Stop Controlled Approaches with Right-Turn Lanes
→ Intersection Lighting → Calibration Factor (HSM only)
NOTE: For more information on each of these inputs, select the “+” symbol next to the appropriate inputs. This will provide definitions, possible input values, base condition values, or other pertinent information.
4.4.4. If “Observed crash data available by site” was selected on the “General Project Information” window, enter the crash information by severity type. Otherwise, skip to next step. (Input boxes will only be shown if the applicable option was selected.)
4.4.5. Click “Next Intersection” button to automatically select the next Intersection. 4.4.6. Repeat Steps 4.4.2 through 4.4.5 for each intersection in the project until all intersections for this
input window have been completed. 4.4.7. Click “Save & Continue” to proceed to toolbox.
NOTE: If desired, click the “Reset Form” button to clear all inputs on the open window and reset to the default values.
Task 4.5 Enter Urban/Suburban Arterial Segment Data If this is not the first facility type in this analysis, select the “Urban/Suburban Arterials: Segment Inputs” button from the toolbox, before following the steps below.
4.5.1. Click the “Segment” drop down to select which segment to input data for. Do not input any
information if “Select Segment” is displayed in the drop down. 4.5.2. Enter the additional location information: Segment ID and Segment Offset. For Segment ID, if the
segment being analyzed consists of only one segment ID, enter that value. If it consists of more than one segment ID, enter the ID of the most southern or western segment only. For Segment Offset, enter the offset value of the start of the analyzed segment that corresponds to the Segment ID provided.
4.5.3. Enter information in every other box or drop down for Geometric and Traffic Data, Cross-Section Data, and Roadside and Other Data. For Urban/Suburban Segments, these inputs include: → Segment Type → Length of Segment (in miles) → Average Annual Daily Traffic (AADT
in vehicles/day) → Speed Limit (mph) → On-Street Parking Presence → Type of On-Street Parking → Proportion of On-Street Parking → Median Width → Commercial Driveways (Major/Minor) → Center Turn Lane
→ Presence of Median Barrier → Commercial Driveways (Major/Minor) → Industrial & Institutional Driveways
(Major/Minor) → Residential Driveways (Major/Minor) → Other Driveways → Segment Lighting → Fixed Object Density → Offset to Fixed Objects → Automated Speed Enforcement → Calibration Factor (HSM only)
NOTE: For more information on each of these inputs, select the “+” symbol next to the appropriate inputs. This will provide definitions, possible input values, base condition values, or other pertinent information.
4.5.4. If “Observed crash data available by site” was selected on the “General Project Information” window, enter the crash information by severity type. Otherwise, skip to next step. (Input boxes will only be shown if the applicable option was selected.)
4.5.5. Click “Next Segment” button to automatically select the next segment. 4.5.6. Repeat Steps 4.5.2 through 4.5.5 for each segment in the project until all segments for this input
window have been completed. 4.5.7. Click “Save & Continue” to proceed to toolbox.
NOTE: If desired, click the “Reset Form” button to clear all inputs on the open window and reset to the default values.

Task 4.6 Enter Urban/Suburban Arterial Intersection Data If this is not the first facility type in this analysis, select the “Urban/Suburban Arterials: Intersection Inputs” button from the toolbox, before following the steps below.
4.6.1. Click the “Intersection” drop down to select which Intersection to input data for. Do not input any
information if “Select Intersection” is displayed in the drop down. 4.6.2. Enter the additional location information: Intersection Location, Major Road, and Minor Road. 4.6.3. Enter information in every other box or drop down for Geometric and Traffic Data, Turn Lane Data,
and Signalized Intersections (if applicable). For Urban/Suburban Intersections, these inputs include: → Traffic Control Type → Intersection Type → Major Road Average Annual Daily
Traffic (AADT in vehicles/day) → Minor Road Average Annual Daily
Traffic (AADT in vehicles/day) → Major Road Speed Limit (mph) → Minor Road Speed Limit (mph) → Intersection Lighting → Calibration Factor (HSM only)
→ Approaches with Left-Turn Lanes → Approaches with Right-Turn Lanes → Left-Turn Phasing (All Legs) → Right-Turn-on-Red Prohibited → Red-Light Cameras → Pedestrian Volume → Lanes Crossed by Pedestrians → Bus Stops → Schools → Alcohol Sales Establishments
NOTE: For more information on each of these inputs, select the “+” symbol next to the appropriate inputs. This will provide definitions, possible input values, base condition values, or other pertinent information.
4.6.4. If “Observed crash data available by site” was selected on the “General Project Information” window, enter the crash information by severity type. Otherwise, skip to next step. (Input boxes will only be shown if the applicable option was selected.)
4.6.5. Click “Next Intersection” button to automatically select the next Intersection. 4.6.6. Repeat Steps 4.6.2 through 4.6.5 for each intersection in the project until all intersections for this
input window have been completed. 4.6.7. Click “Save & Continue” to proceed to toolbox.
NOTE: If desired, click the “Reset Form” button to clear all inputs on the open window and reset to the default values.
Task 5. Generate the Summary Report (Detailed Report Optional)
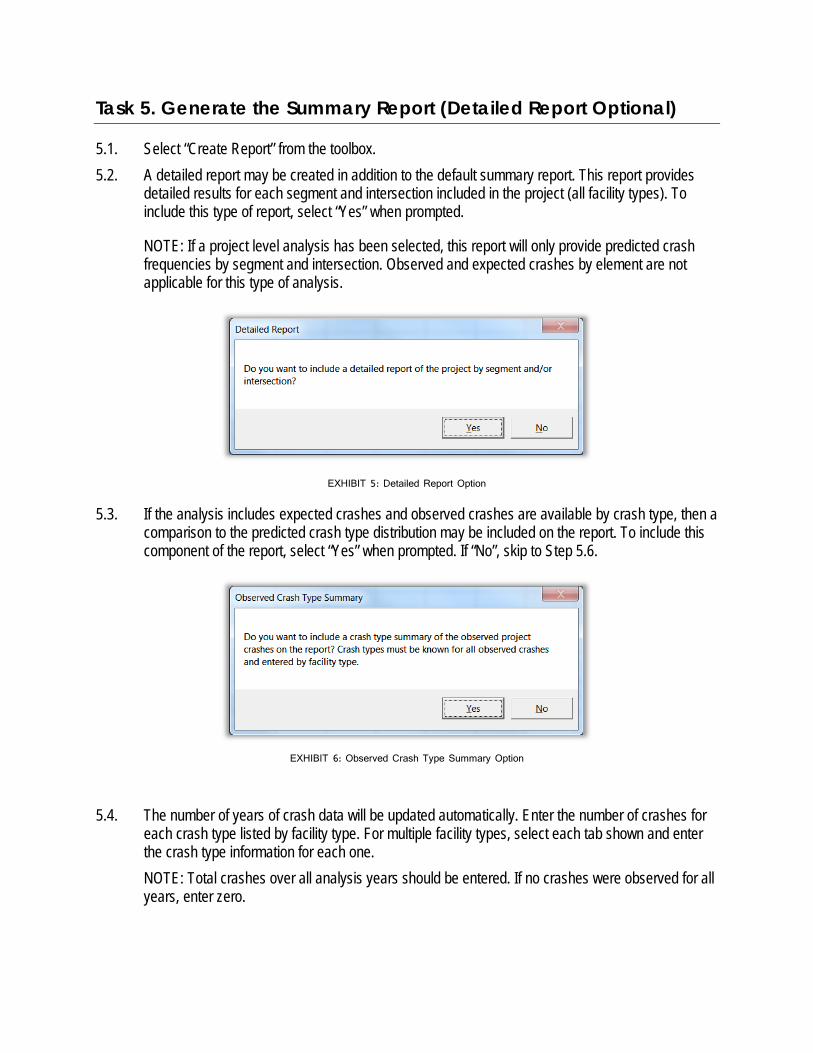
5.1. Select “Create Report” from the toolbox. 5.2. A detailed report may be created in addition to the default summary report. This report provides
detailed results for each segment and intersection included in the project (all facility types). To include this type of report, select “Yes” when prompted.
NOTE: If a project level analysis has been selected, this report will only provide predicted crash frequencies by segment and intersection. Observed and expected crashes by element are not applicable for this type of analysis.
EXHIBIT 5: Detailed Report Option
5.3. If the analysis includes expected crashes and observed crashes are available by crash type, then a comparison to the predicted crash type distribution may be included on the report. To include this component of the report, select “Yes” when prompted. If “No”, skip to Step 5.6.
EXHIBIT 6: Observed Crash Type Summary Option
5.4. The number of years of crash data will be updated automatically. Enter the number of crashes for
each crash type listed by facility type. For multiple facility types, select each tab shown and enter the crash type information for each one. NOTE: Total crashes over all analysis years should be entered. If no crashes were observed for all years, enter zero.
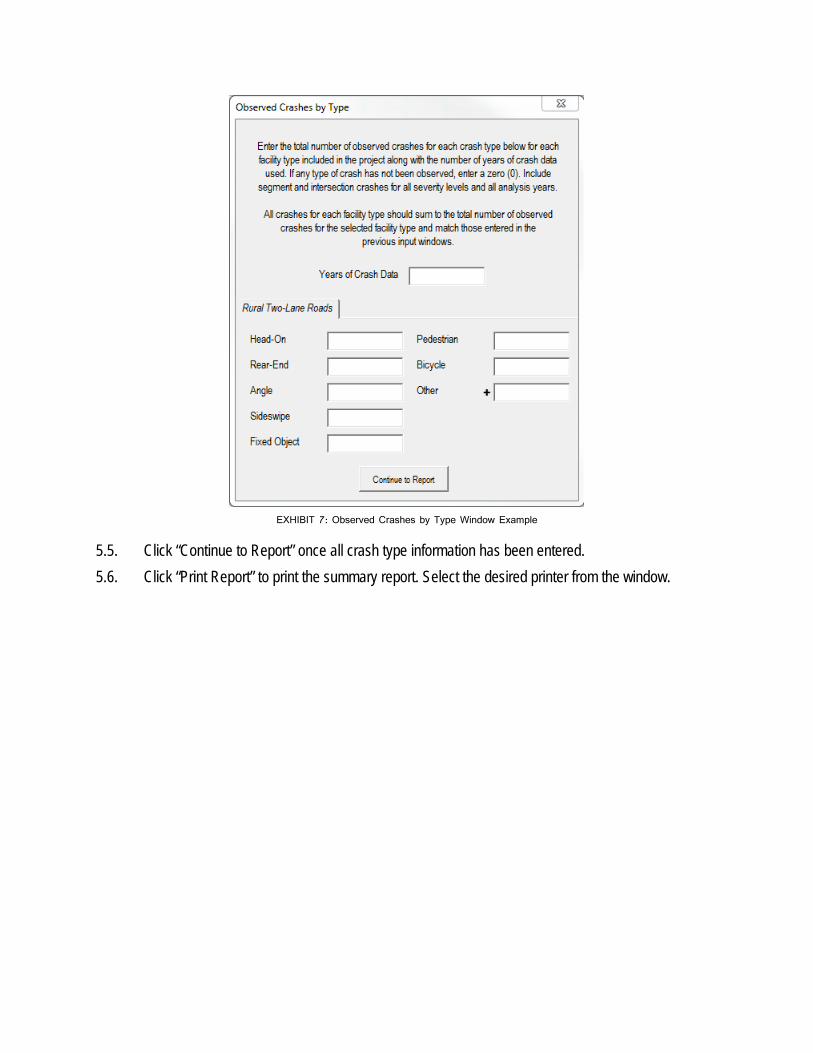
EXHIBIT 7: Observed Crashes by Type Window Example
5.5. Click “Continue to Report” once all crash type information has been entered. 5.6. Click “Print Report” to print the summary report. Select the desired printer from the window.

Task 6. Review and Print Summary Report
6.1. The first page of the report contains results for the total project. This includes: a. Basic project information as well as the analysis type and the facility type(s) included b. A bar chart showing the average safety performance of the project (predicted crashes,
observed crashes, and expected crashes) c. A tabular form of the average safety performance that also includes the potential for safety
improvement d. Three tables showing the safety performance by segments, intersections, and total project by
severity level e. A pie chart of the average annual predicted crash type distribution for the total project f. If observed crashes by type were included, a pie chart of the average annual observed crash
type distribution for the total project (If this option was not selected, the box will say “No Observed Crash Data Provided”. To add this information after the report has been created, return to the toolbox and select “Create Report”.)
EXHIBIT 8: Example of Project Summary Report (Total)
6.2. The subsequent pages of the report will include results summarized by facility type if more than one facility type was selected for the analysis. Each of these will include the same components as shown for the project total summary, but will apply to each facility type individually.
6.3. Click “Print Report” to print the summary report. Select the desired printer from the window.
a.
b.
c.
d.
e.
f.

Task 7. Review and Print Detailed Report (Optional)
7.1. The detailed report consists of one to six pages depending on the facilities and types of elements included in the project. One page is provided for segments or intersections for each facility type. For each segment or intersection, the data provided includes: → Segment ID/Offset or Intersection Location → Total Predicted Crashes → Total Observed Crashes → Total Expected Crashes → Potential for Safety Improvement
EXHIBIT 9: Example of Project Detailed Report
7.2. Click “Print Report” to print the detailed report. Select the desired printer from the window.

Functionality of the Alternatives and Safety Benefit Analysis Tool
The alternatives and safety benefit analysis tool allows users to import the analysis from the safety analysis tool in order to assess the safety implications of possible project alternatives and the corresponding economic impact of them. The alternatives analysis allows for changes to any of the inputs included in the safety analysis tool as well as allowing for the analysis of additional countermeasures. The safety benefit analysis requires implementation and maintenance costs in addition to service life for any changes from the existing project characteristics.
General Information
→ Throughout the tools, there are “+” symbols that may be clicked for more information regarding certain steps or element inputs.
→ Click the toolbox icon to return to the toolbox. → Closing a window using the red “X”, any changed inputs in the window will not be saved. Click next or
continue to save inputs.
Alternatives and Safety Benefit Analysis Tool User Instructions
Basic Analysis Steps Task 1. Create a Project File
Task 2. Entering General Analysis Options
Task 3. Import the Existing Conditions
Task 4. Enter Detailed Element Data
Task 5. Create, Show, and Review Summary Report
Task 6. Edit Alternatives’ Inputs (Optional)
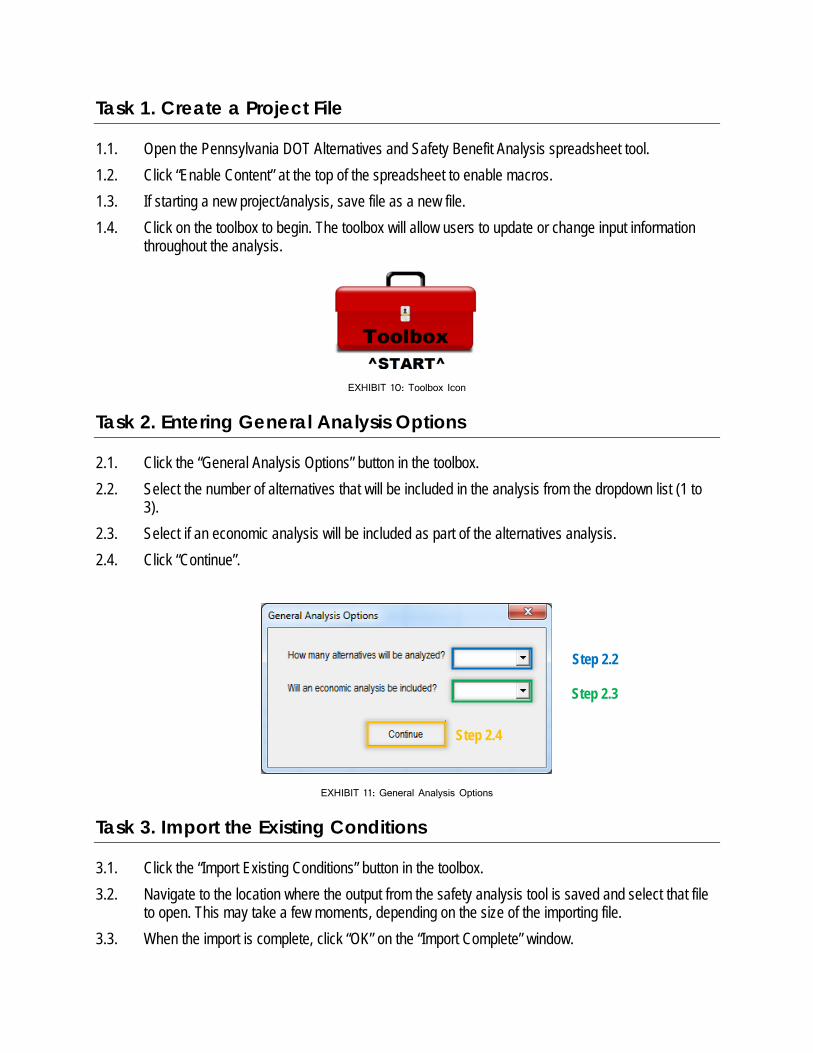
Task 1. Create a Project File
1.1. Open the Pennsylvania DOT Alternatives and Safety Benefit Analysis spreadsheet tool. 1.2. Click “Enable Content” at the top of the spreadsheet to enable macros. 1.3. If starting a new project/analysis, save file as a new file. 1.4. Click on the toolbox to begin. The toolbox will allow users to update or change input information
throughout the analysis.
EXHIBIT 10: Toolbox Icon
Task 2. Entering General Analysis Options
2.1. Click the “General Analysis Options” button in the toolbox. 2.2. Select the number of alternatives that will be included in the analysis from the dropdown list (1 to
3). 2.3. Select if an economic analysis will be included as part of the alternatives analysis. 2.4. Click “Continue”.
EXHIBIT 11: General Analysis Options
Task 3. Import the Existing Conditions
3.1. Click the “Import Existing Conditions” button in the toolbox. 3.2. Navigate to the location where the output from the safety analysis tool is saved and select that file
to open. This may take a few moments, depending on the size of the importing file. 3.3. When the import is complete, click “OK” on the “Import Complete” window.
Step 2.2
Step 2.3
Step 2.4
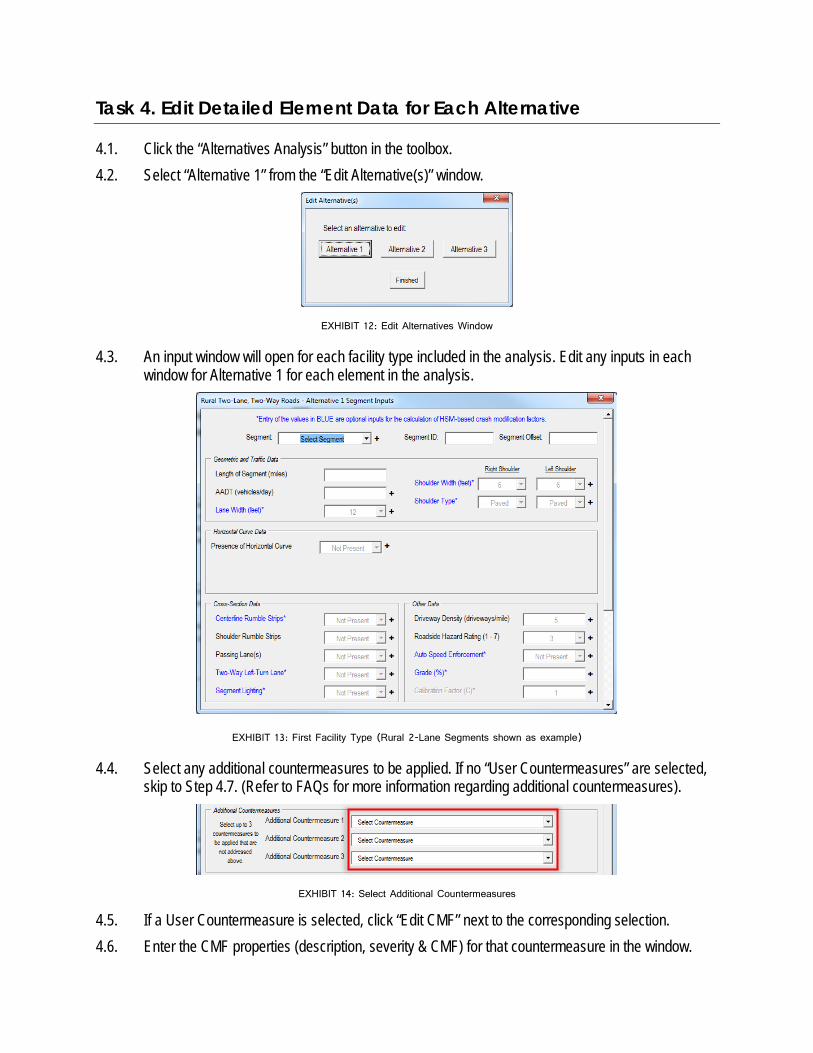
Task 4. Edit Detailed Element Data for Each Alternative
4.1. Click the “Alternatives Analysis” button in the toolbox. 4.2. Select “Alternative 1” from the “Edit Alternative(s)” window.
EXHIBIT 12: Edit Alternatives Window
4.3. An input window will open for each facility type included in the analysis. Edit any inputs in each window for Alternative 1 for each element in the analysis.
EXHIBIT 13: First Facility Type (Rural 2-Lane Segments shown as example)
4.4. Select any additional countermeasures to be applied. If no “User Countermeasures” are selected, skip to Step 4.7. (Refer to FAQs for more information regarding additional countermeasures).
EXHIBIT 14: Select Additional Countermeasures
4.5. If a User Countermeasure is selected, click “Edit CMF” next to the corresponding selection. 4.6. Enter the CMF properties (description, severity & CMF) for that countermeasure in the window.

4.7. If an economic analysis is being included, two buttons will be visible on each input window for entering cost information. 4.7.1. Click the “Enter Cost Information” button for characteristic changes from existing
conditions. Input the description (where applicable), initial cost, service life, annual maintenance cost, and salvage value for each active item in the window (i.e. not greyed out). Click “Save”.
4.7.2. Click the “Enter Cost Information” button for selected additional countermeasures. Input the description (where applicable), initial cost, service life, annual maintenance cost, and salvage value for each active item in the window (i.e. not greyed out). Click “Save”.
NOTE: If no items are active in the cost input windows, there have been no changes to existing or countermeasures selected, respectively, and no cost input information is required.
EXHIBIT 15: Additional Countermeasures and Costs
4.8. Select “Next Segment” (or “Next Intersection”) or “Save & Continue” to proceed to the next element or facility type, respectively.
4.9. Repeat Steps 4.3 through 4.6 for all elements and facility types included in the analysis. 4.10. When all inputs have been updated for Alternative 1, select “Alternative 2” from the “Edit
Alternative(s)” window, if applicable, and repeat Steps 4.3 through 4.7. 4.11. Repeat Steps 4.2 to 4.7 for Alternative 3, if applicable.
Task 5. Create, Show, and Review Summary Report
5.1. Select “Summary Report” button from the toolbox. 5.2. The Summary Report includes results for the existing conditions and all possible alternatives. This
includes: a. Basic project information b. A bar chart showing the average predicted crash performance for the Existing Conditions,
Alternative 1, Alternative 2, and Alternative 3 by severity level c. A tabular form of the average predicted crash performance that also includes the change in
predicted crashes from the Existing Conditions
Step 4.7.2
Step 4.8
Step 4.7.1
Step 4.5
d. A tabular summary of the Economic Performance for Alternative 1, Alternative 2, and Alternative 3 compared to the Existing Conditions (alternative cost, crash benefit/disbenefit, and safety benefit ratio)
5.3. Print report.
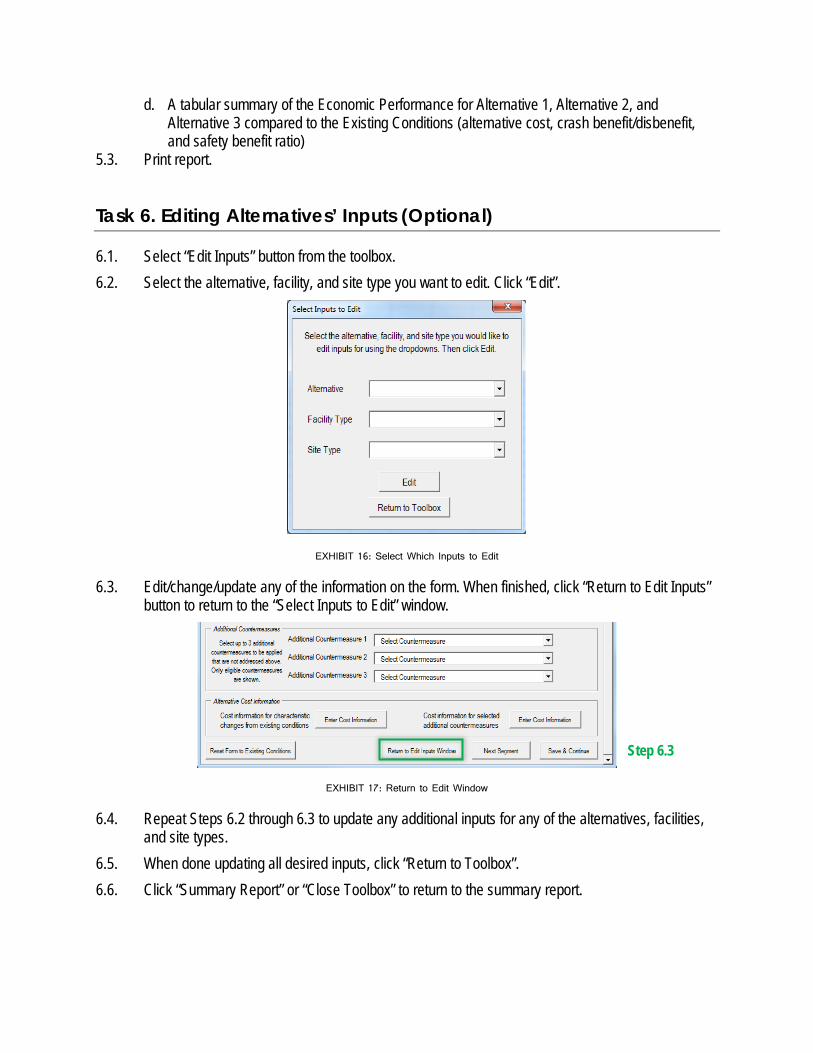
Task 6. Editing Alternatives’ Inputs (Optional)
6.1. Select “Edit Inputs” button from the toolbox. 6.2. Select the alternative, facility, and site type you want to edit. Click “Edit”.
EXHIBIT 16: Select Which Inputs to Edit
6.3. Edit/change/update any of the information on the form. When finished, click “Return to Edit Inputs” button to return to the “Select Inputs to Edit” window.
EXHIBIT 17: Return to Edit Window
6.4. Repeat Steps 6.2 through 6.3 to update any additional inputs for any of the alternatives, facilities, and site types.
6.5. When done updating all desired inputs, click “Return to Toolbox”. 6.6. Click “Summary Report” or “Close Toolbox” to return to the summary report.
Step 6.3

FAQ and Troubleshooting
The following topics cover common questions that may arise during an analysis or approaches for troubleshooting any issues that may occur.
General What if I have a project that doesn’t fit one of models/conditions? Contact your safety analysis coordinator at PennDOT to verify the appropriate course of action for analysis.
What if I want to analyze more than 3 alternatives? Multiple files must be used to analyze more than 3 alternatives. Import the existing conditions file into as many of the Alternatives and Safety Benefit Analysis tools as necessary to cover all of the necessary alternatives. For example, 4-6 alternatives would need two files, 7-9 alternatives would need three files, etc.
Input Data What county should I select if my project occurs in more than one? Select the county that the greater portion of the project is in. If only a small portion of a project falls in another county, the county SPFs can likely still be applied. If the project falls fairly equally in multiple counties, it may be more appropriate to use the district SPFs instead. Contact your safety analysis coordinator at PennDOT to verify.
Why can I only enter three additional countermeasures?
Countermeasures may have compounding effects when applied together. There is little research and a limited understanding of these interrelationships, which the HSM notes is especially the case when more than three CMFs are used (HSM, 3-21). Applying more than three CMFs that may affect the same crash type can result in overestimating (potentially significantly) the combined effect of multiple treatments.
Why can’t I enter an additional user countermeasure CMF for a specific crash type? The tool does not allow this type of input. User CMFs can be input by total crashes or by fatal/injury and property damage only crashes. If you would like to add a crash type-specific CMF, the calculations will have to be conducted outside of the tools using the output from the tool (including all other inputs).
Data Input Windows Why are some inputs blue? These inputs are optional for an analysis using the Pennsylvania SPFs (District or County). The inputs provide additional crash performance evaluation using HSM-based CMFs. These do not need to be input to perform an analysis unless the HSM SPFs are selected.
What if the input window is too big/cutoff? Many of the input windows have scroll bars to allow for visibility of all of the information. If there is not scroll bar, try changing the resolution of your computer screen to less than 100% (can be found under “Screen Resolution” in the Windows control panel). The windows should fit most computers, but may be slightly too big on a smaller screen.

Why can’t I input cost information? Cost information can only be input for attributes that have changed from the existing conditions. This is detected automatically and all cost inputs will be enabled for any features showing as different from the existing conditions. Similarly, if no additional countermeasures have been selected, the cost information will not be enabled for any of these features. If the buttons cannot be clicked at all (disabled), ensure that “Yes” was selected for including an economic analysis in the “General Analysis Options” window.
What if the cost information I have is not as detailed as the inputs shown? If the cost information is only available for the cost of an alternative overall or includes costs for more than one of the chosen countermeasures, the cost information can be input once in the inputs for any available (not greyed out) countermeasure. All information is aggregated to summarize the alternative(s) overall and does not need to be duplicated for each applicable countermeasure. The inputs just need to reflect the information of all included countermeasures (e.g. service life needs to be the same).
Reports Why is some of the data not showing up? Is this an error? If a project level analysis has been selected, then observed and expected crash frequencies are not available for segments and intersections, only for the project overall (for each facility type included). This also means that the detailed report, if used, will only provide predicted crash frequencies by individual segment and/or intersection. Note: Entering observed crashes by site should always be selected if this level of data is available.
If a site level analysis has been selected and the data is still not showing up, then verify whether predicted crashes only or predicted and expected crashes are included in the analysis (see “Start Window”). If predicted only crashes is selected, no observed crash information is input or used for the analysis. Therefore, observed and expected crash frequencies will not be displayed in the report.
If values are still not showing up, review the input information to ensure that all of the required data has been input. Pay particular attention to segment lengths, AADTs, site types, and crash data as these are generally the most crucial inputs.
The results seem too high and/or don’t make sense. This is likely an issue of units. Return to the input windows and verify that inputs have the correct units. For example, segment length should be entered in miles, AADT should be in vehicles per day, length of curve should be in miles, curve radius should be in feet, etc.