user interfaces for mobile navigation - coventry … interfaces for mobile navigation fotis...
TRANSCRIPT

User interfaces for mobile navigation Liarokapis, F. and Conradi, E. Author post-print (accepted) deposited in CURVE May 2010 Original citation & hyperlink: Liarokapis, F. and Conradi, E. (2007) User interfaces for mobile navigation. Library Hi Tech: special issue on 3D visualization, volume 25 (3): 352-365. http://dx.doi.org/10.1108/07378830710820934 Copyright © and Moral Rights are retained by the author(s) and/ or other copyright owners. A copy can be downloaded for personal non-commercial research or study, without prior permission or charge. This item cannot be reproduced or quoted extensively from without first obtaining permission in writing from the copyright holder(s). The content must not be changed in any way or sold commercially in any format or medium without the formal permission of the copyright holders. This document is the author’s post-print version, incorporating any revisions agreed during the peer-review process. Some differences between the published version and this version may remain and you are advised to consult the published version if you wish to cite from it.
CURVE is the Institutional Repository for Coventry University http://curve.coventry.ac.uk/open

User Interfaces for Mobile Navigation Fotis Liarokapis, Emily Conradi
giCentre, Department of Information Science, City University, London, UK
Fotis Liarokapis holds a BSc in Computer Systems Engineering (University of Sussex, 1998), an MSc in Computer Graphics and Virtual Environments (University of Hull, 1999) and a PhD in Engineering (University of Sussex, 2005). His research interests include computer graphics, virtual and augmented reality, mobile computing, visualisation, human computer interaction, learning systems and GIS.
Emily Conradi has an MSc in Electronic Publishing (City University, 2005), and a background in multimedia and web development. She currently works as a Project Manager for the e-learning Unit at St George's University of London Medical School. Specific research interests include e-learning applications for mobile and gaming technologies.
Abstract Purpose - The aim of this work is to explore the use of lightweight but effective user interfaces for mobile navigation and wayfinding in urban environments. Design/methodology/approach – Two interactive mobile interfaces were designed and implemented following a user centred approach. The first interface makes use of 2D digital technology such as different representations of 2D maps and textual information. To enhance the user experience during navigation, location aware searches may be performed indicating information about the surroundings. The second interface makes use of virtual reality (VR) and computer graphics to present 3D maps and textual information. The VR maps are also interactive and contain hyperlinks positioned in 3D space which link to either web-pages or other multimedia content. Findings – Both interfaces allow users to visualise and interact with different levels of representation of urban maps. Initial evaluation has been performed to test the usability of the 2D interface, and limitations of the 2D technology were recorded. To overcome these limitations and explore the potentials of alternative technologies a VR interface was prototyped and a pilot evaluation was conducted. Practical implications – This paper provides two prototype interfaces with some initial evaluation that may be useful for future navigation and wayfinding systems. Originality/value – As more and more people make use of mobile technologies and advanced interfaces to enhance access to location-based services, this paper offers two prototype interfaces for personal digital assistants that provide solutions to urban navigation and wayfinding. Keywords Location-based services, Mobile interfaces, Human-computer interaction, Virtual reality Paper type Case study
Introduction
Recent advances in digital technologies enable people to familiarise with a number of new applications ranging from digitisation of the physical environment to digital storage and visualisation. Modern user demands have evolved, and are very different to what they used to be before the digital era. A characteristic example of this demand is the necessity for using mobile technologies for tasks such as location-based services (LBS) and other mobile

Draft Paper, To Appear in Library Hi Tech, Special Issue on 3D visualization
2
applications. Depending on the application scenario, mobile devices - with appropriate software infrastructure - can be used to navigate within the urban environment, or to provide an index of commercial services, such as finding the nearest police station, hospital, supermarket, etc. Google Earth (Google Earth, 2006) and Virtual Earth (Virtual Earth, 2007) are two characteristic examples that illustrate the capabilities of digital maps, visualisation and LBS technologies. Besides, mobile devices such as personal digital assistants (PDAs) and third-generation (3G) phones are becoming more accessible in terms of price and ergonomics. Although there are still many features that need to be improved, including both the hardware and software components, one of the most promising areas concerns personal navigation systems. In-car navigation systems have been received with great enthusiasm and have already started to change the way people perceive navigation. These applications make use of Geographical Information Systems (GIS)—such as digital cartography and geovisualisation—aiming to extend the traditional paper map approach. Currently, traditional and digital maps are not detailed enough to be used as effective navigation guides for pedestrians. Ideally, mobile maps should provide a richer interface which will not only allow users to find their way from one position to another but also provide other useful information in a compelling and user friendly manner. Mobile interface design must be interactive, interoperable and user friendly to provide compelling mobile applications. Navigation is a part of human interaction design, and to be explored properly a range of issues must be researched including cognitive, cultural and social. Some of the most significant requirements for pedestrian navigation for mobile users include the following: to be able to quickly locate one's position on the map, to allow searching of location-relative information, and the ease of use of the interface. This work aims to address only some of the issues relating to the design and implementation of mobile interfaces for urban navigation and wayfinding including map visualisation, 2D/3D map navigation and finding local information. Two multimedia interfaces have been developed that propose different ways for pedestrian navigation. A pilot study was undertaken to evaluate their effectiveness as navigational interfaces.
Technological and Design Constraints
Mobile software and hardware technologies are rapidly evolving. Many experimental and commercial software applications have been developed, originating from both industry and academia. Wireless communications are also fast growing and it seems that the capabilities are now there to offer the basis for mobile client-server applications. However, although there have been significant improvements in both hardware and software for mobile technologies, there are still a number of technological constraints to be solved. In terms of hardware, mobile devices have small display screens with limited resolution, inadequate input tools and resources. The development process can sometimes become complicated as it must rely on a combination of different hardware technologies (i.e. a combination of sensor devices like trackers and web-cameras). As a result, many mobile applications are specifically designed for particular devices and can not be easily ported into others.

Liarokapis F. and Conradi E. User Interfaces for Mobile Navigation
3
A few mobile devices have started incorporating location (i.e. standard and assisted GPS) and orientation (e.g. digital compass, accelerometers and gyroscopes) chipsets which have the ability to offer information useful for mobile navigation. Nevertheless, processing power and graphics capabilities are still very limited, allowing for the development of minimal real-time applications only. Optics and ergonomics are improving constantly but still need to become smaller and cheaper. Part of the obstacle, is that most mobile researchers and developers focus more on the application rather than the end-user. Usually, most of the content accessed from mobile devices is initially intended for display on desktop computers (Schohn and Berger, 2004). Current mobile interfaces are typically complex and difficult to use, and so limit the range of users that can use them. Ideally, mobile interfaces must enable them to easily access information anywhere, fast and accurately.
Map Interfaces
Maps play an important role both for tourist and everyday activities such as planning and preparation (Norrie and Signer, 2005). The context and style of map varies greatly depending on the task they are designed for. For example, using digital maps for a navigation task from a fixed workstation has limited applicability. These maps need to be developed for use on mobile devices before they offer any real benefits to users (Conradi, 2005). During recent years, digital maps have begun to provide location context services or LBS. Characteristic examples are tourist guides which usually provide some information about either urban (e.g. town centre) or rural (e.g. parks and archaeological sites) areas. The tasks that tourists usually perform have been classified by Reichenbacher (2001) as locator, proximity, navigation and event tasks. Locator tasks deal with issues related to locating a user or an object. Proximity refers to finding information around the surrounding area. Navigation (and wayfinding) tasks are concerned with providing directions and information assisting a user to find a route or path from one location to another. Event tasks involve the geo-referenced information retrieval about an area or a specific place. The traditional way of navigating and wayfinding in an environment is considered to be the paper map, also known as an analogue map. The major advantages of using paper maps are that they are lightweight, easily transportable, relatively cheap to produce and do not require electric power (Longley et al., 2001; Norrie and Signer, 2005). However, based on the recent advances in information technologies, digital maps have the ability to store a greater amount of information, enabling them to become much more than just a point of reference.
Although digital mapping techniques bring new tools and new applications, such as routing services, it is crucial to understand and take into consideration the cognitive processes behind how users interact with spatial map data (Longley et al., 2001). For instance, the display of this information varies to a great extent depending on the visualisation system used. Physiology dictates that people have difficulties in screen-reading because of the unchanging focal plane (Horton, 1994), and screens have lower resolutions. Also, illuminated screens can be hard to read in daylight lighting conditions.

Draft Paper, To Appear in Library Hi Tech, Special Issue on 3D visualization
4
A benefit of digitising maps is that you can easily alter the map’s appearance. With paper-based maps dimensions, scale and colour-schemes are static. Paper maps are often split between pages (e.g. an A-Z index) or folded up, obscuring data and limiting usability (Conradi, 2005). Analogue maps are always flat. Another advantage of digital maps is that they can be presented in 3D instead of the standard 2D format (Liarokapis and Brujic-Okretic, 2006; Liarokapis et al, 2006). Although certain techniques can be employed to give traditional maps the illusion of depth (e.g. stereoscopic imagery), 3D visualization is limited to almost non-existent. Longley et al, (2001) argues that although screen-displays for digital maps are also presented in a flat 2D world, 3D visualization is more effective with a GIS and much easier to produce. Using digital mapping and cartography, image size can be manipulated to a much greater extent. Zooming within a GIS is a standard feature which gives an easy choice of scales, although zooming can sometimes distort the relative scale of features. If digital maps are constructed properly, and linked to relevant and accurate multimedia information, they become information-rich, and dynamic in nature, making them flexible and responsive to user interaction. Peterson (1999) argues that dynamic environments are more reflective of the real world and digital maps offer the possibilities of representing the world in a way that static, analogue maps can not compete with. Consequently, adding realism and interactivity to maps will make them more accessible to a wider range of users. Longley et al, (2001) believe that the dynamic and interactive capabilities allow maps to no longer be a one-way transfer of data from map to user. The user can communicate in a bidirectional way by transferring information back to the system.
Digital Content Generation
Digitisation is a process that converts information existing in the real environment into a digital representation. Over the past few years, a number of manual and automatic techniques have evolved that aim to provide accurate and realistic digital representations of maps, but as yet there is no solution that can produce fast and realistic results.
One of the major objectives of this research was to test mobile interfaces for urban navigation and wayfinding. To address this issue, ready-made two-dimensional digital maps were collected from online resources and prepared into an appropriate format for visualisation. In cases where the content was not available such as the 3D maps used in the mobile VR interface, they were digitised using a set of commercial tools (Liarokapis et al, 2005). As a test-location, City University’s main campus in Northampton Square, London was chosen. For the 2D mapping process, four different representations of the same area were generated to offer the users different zoom levels and perceptions of the map. Specifically, the maps used in this research were 2D raster maps and one 2D vector map collected by the Ordnance Survey (Ordnance Survey, 2006). The last map representation of an aerial view was supplied by our partner in the LOCUS project, the GeoInformation Group, a leading provider of high-resolution aerial photography products and services. The scales of the Ordnance Survey raster maps are 1:25,000 and 1:10,000 respectively while the vector map is 1:1,250.

Liarokapis F. and Conradi E. User Interfaces for Mobile Navigation
5
Raster maps are ideal for use as backdrop layers, with other layers of information embedded over them (Ordnance Survey, 2006). In comparison, vector-based maps contain much more detail within an urban location — every building and street kerb is viewable (Edina, 2005). In addition, the colour and key attributes can be easily manipulated using GIS software providing a customised view, potentially addressing accessibility issues (Conradi, 2005). Aerial photogrammetry can provide realistic representations of the environment, even if the resolution is not very high. The map data for the 2D interface first had to be converted into a form that would be compatible with Macromedia Flash MX. The three map categories (raster, vector and aerial) were aligned to ensure they each covered the same geographical area. These four layers were then converted into bitmaps and transported as four separate images. Transferring them into bitmap format ensured they were compatible for use with the software. This resulted in the vector map being converted to raster format. These four bitmap images were then converted into an appropriate image format – jpeg file formats to compress the file size and speed up download times. All four map types are available as a set of tiles that seamlessly connect. For the generation of the 3D maps, aerial photographs were used in conjunction with height values, in order to generate accurate 3D meshes. This information was input into ArcGIS, which provides the appropriate functionality for generating rough 3D geo-referenced scenes from 2D data. To further improve the realism of the 3D scene as well as optimise the geometry, a general purpose 3D modelling tool, called 3ds max, was employed. Photographs were manually taken and used as textures. More details about the 3D reconstruction stage can be found in Liarokapis et al, (2005).
2D Map Navigation Interface
In the past, a few experimental mobile applications have been proposed. Cheng and Gruen, (2003) researched on the technological challenges for creating user interfaces to support the complex ways people manage their email. They prototyped a Flash interface for PDAs by enhancing the user’s inbox with interface tools for viewing and navigating threaded email discussions, marking messages with pop-up menus and previewing content with one-line displays. Ballagas et al., (2006) developed a rapid prototyping platform that helps explore novel interactions combining sensor enhanced mobile phones and interactive spaces called iStuff Mobile. His system enables interaction designers to prototype interactions with existing applications, or with new ones based on the Series 60 SDK or Macromedia Flash Lite. The aim of the 2D mobile map interface was to provide an intuitive and user-friendly navigation and wayfinding application. Thus, it was designed based on a user-centered approach that focuses on user perception. To make the interface as effective as possible for mobile devices (which have less power than desktops, laptops and tabloid computers) the maps were compressed as much as possible. The addition of extra multimedia, such as auditory information, would reduce the effectiveness of both the visualisation and the interaction.

Draft Paper, To Appear in Library Hi Tech, Special Issue on 3D visualization
6
The major implementation was done initially in Macromedia Flash MX and then ported into Flash Lite (Macromedia Flash Lite, 2006). Flash Lite is the Flash technology specifically developed for mobile devices. PDAs make use of the Macromedia Flash Player 7 for Pocket PC which, as an ActiveX plug-in, can work via a web-browser. Because most displays for mobile devices are either 240x320 or 640x480, the interface was optimised for 240x320 screen resolution. A screenshot illustrating the starting page of the interface is presented in Figure 1.
Figure 1. Mobile map interface
As illustrated in Figure 1, the main functionality of the interface includes the following three categories: map visualisation, map navigation and finding local information. In the following sections an overview of each category is briefly described. Map Visualisation One of the main features of the mobile interface is that it provides a simple but effective way of visualising digital maps. To provide a multi-level visualisation framework similar to the ones existing in GIS software, four different types of maps can be displayed as shown in Figure 2.

Liarokapis F. and Conradi E. User Interfaces for Mobile Navigation
7
Figure 2. Map representations using the mobile map interface (a) raster map scale 1:10,000
(b) raster map scale 1:25,000 (c) vector map scale 1:1,250 (d) aerial photography
Figure 2 illustrates how each view-button of the interface corresponds to a different category of map. The first two buttons (‘view 1’ and ‘view 2’) correspond to raster maps (scale 1:10,000 and 1:25,000 respectively), the third button (‘view 3’) corresponds to a vector map (scale 1:1,250) and the last button (‘view 4’) corresponds to a high-resolution aerial map. Map Navigation When designing and implementing a mobile navigational interface, interaction techniques must be carefully considered. Traditional input and output devices, such as the keyboard and mouse, differ from standard computers. Instead, novel ways of interacting have come about such as handwriting, voice or gesture recognition (Wasinger et al, 2003). Gesture recognition can either refer to indications a user makes on the device screen with a stylus (i.e. touching the display with a stylus or sliding over the screen with a stylus) or by physically reacting to the outside world such as gesturing to an object using the mobile device (Wasinger et al, 2003). However, it is important to consider the usability trade-offs between simplicity, functionality and the relative power of the hardware running the program. In the presented interface, a simplistic approach was followed aiming to provide an easy to understand and use application for urban navigation. Specifically, users can interact with the 2D digital maps by either zooming, rotating or moving in eight directions inside the map.

Draft Paper, To Appear in Library Hi Tech, Special Issue on 3D visualization
8
Figure 3. VR navigation of City University’s campus
Figure 3 shows how hotspots can be used to enlarge the map to cover the whole mobile display screen (in this case 640×480 pixels). Hotspots can be also used as hyperlinks, linking the map with web-pages that either contain relevant information about the location (e.g. City’s University website) or other types of digital maps such as Google maps (Google Maps, 2006). Find Local Information The last category of the interface is about information retrieval (IR). The ‘Search’ tab allows participants to search for information such as street names and services (e.g. a list of restaurants, bars, supermarkets, etc). The ‘Local Information’ tab displays information about different features of the map. This category is currently partially implemented and works as a proof of concept. In the future a geo-spatial database will be added to the application so that it can feed relative information to mobile users.
User Evaluation
One of the most popular approaches for evaluating user-centred systems is the heuristic evaluation. Heuristic evaluation was adopted in this work because it is relative quick, cost effective and it is usually done by teams of three to five evaluators. Five evaluators are considered to be sufficient for detecting the most significant usability problems in a prototype system (Smith-Atakan 2006).

Liarokapis F. and Conradi E. User Interfaces for Mobile Navigation
9
The user testing took place out in the field with five volunteers navigating around Northampton square at City University. Each user studied the interface for approximately ten minutes and was then asked to navigate from one side of the campus to the main entrance. After navigating they were also asked to test out all the functionalities of the interface and their comments were collected by note taking as the user ‘thought aloud’ whilst interacting with the interfaces. Finally, they were asked to complete a small questionnaire. Their feedback is summarised in the following sections. Map Visualisation The focus of the first part of the evaluation process was to record participants’ feedback in terms of the map visualisation. All participants agreed that the idea of changing map views is very effective and is a useful interaction when navigating. In respect to the actual type of maps, participants preferred either the raster or the vector maps. Surprisingly, the aerial maps were not preferred by anyone, confusing the participants rather than assisting them. The vector map received the most positive feedback mainly because of the detail and variety in colour, although one user commented that the choice of colours is sometimes difficult to distinguish. In addition, the raster maps were also popular, due to the fact that they were more familiar to most participants. Additional comments with respect to the digital maps recommended using devices that have much larger displays. Nowadays, modern PDAs have a standard screen resolution of 640×480 pixels, and graphics acceleration is supported in some. Map Navigation Navigating around the maps can be realised through the use of eight arrow-buttons. In general, all eight navigation buttons were easily identified and used by all participants. Two of them found it easy and fast to navigate using the arrows as they preferred the structure of this type of navigation and pointed out that it was easy to find your place should you become lost. Some participants argued that map navigation should not be restricted to only eight directions and proposed the use of alternative methods (e.g. using the stylus tool to ‘drag’ the map in the direction of travel). The feedback recorded on the ‘map rotation’ feature was diverse. All participants agreed that the purpose of the rotation button was obvious and easy to detect. Two participants mentioned that the feature is really helpful and useful. However, another two participants found the operation pointless. The first suggested users do not tend to rotate maps when navigating and the second thought it would be easier to rotate the handset itself. The ‘zoom’ buttons were thought to play an important role during navigation tasks, and were designed to be a prominent part of the interface. The majority of participants agreed that the zoom functions are easy to use and work intuitively. One participant was slightly confused by the ‘zoom in’ button, as the plus sign was rotated slightly and looked more like a cross. Some general comments were recorded for future improvements. For example, one participant pointed out that when you zoom, the map reverts back to zoom into the centre of the complete map image, rather than the centre of the image that is currently viewed. In other words, to use this function you would have to zoom in first and then navigate to your desired area.

Draft Paper, To Appear in Library Hi Tech, Special Issue on 3D visualization
10
Find Local Information The information menu aims to provide context-aware information to mobile users. To view the information, the user must first click on the ‘local information’ tab, to open this panel. If they then navigate the stylus over the map, any information embedded onto the map features will display in the panel. Three participants liked this method of viewing the local information whilst navigating but they provided important comments for further improvements. One asked for the features to appear on the map itself whereas another commented that having some sort of sign to indicate what map features held information would make this feature much more useful. A third participant argued that this design limited the amount of information that could be attached to any one feature, whereas the separate text box could take a much greater amount, and make use of a scroll bar if necessary. The last participant did not understand how to click the local information tab away and suggested a need for ‘help’ menus. Additional feedback The last part of the evaluation process involved the collection of general comments about the interfaces. Two participants were impressed by the speed of responsiveness the interface demonstrated while the other two stated that they were satisfied with the overall performance of the interface. Additional functions that were suggested include a back button of some kind that could ‘remember’ and take the user back to a previous view, and a greater amount of area viewable, also known as the field of view (FOV). Improving the quality of the map was also mentioned in a couple of instances. Moreover, participants mentioned that a fully functioning ‘search box’ would be a beneficial feature. One had the idea of allowing the user to add their notes to the local information tool. Another suggested this sort of application would be better with some sort of route finder. Finally, one participant pointed out that the vector map could be good for people with vision disabilities (e.g. colour-blindness). Besides, most of the users were open to the idea of using digital maps with mobile devices for navigating urban environments. This may be because the age of the participants ranged between 20 to 30 years-old and so may possibly be more familiar with mobile and digital technologies. One user however, mentioned that traditional paper map navigation is their easiest and preferred method.
VR Interface
Interfaces for navigation devices prove more effective if they are intuitive, flexible, natural and robust (Wasinger et al, 2003; Vainio and Kotala, 2002). Nonetheless, some of the interactions users perform, such as zooming-in on the environment have no precedent in the real world (Vainio and Kotala, 2002). This paper argues that giving the user the choice of using 3D or VR maps can be a potential aid to those users who have real trouble in navigating with conventional 2D maps. In a previous study about a mobile navigation guide undertaken by Schilling and Coor (2004), participants found it easier to navigate in 3D mode when they had a bird’s eye view rather than walking level.

Liarokapis F. and Conradi E. User Interfaces for Mobile Navigation
11
Based on this study as well as on the feedback recorded from the 2D flash interface a mobile virtual reality interface was prototyped (Liarokapis and Brujic-Okretic 2006; Liarokapis et al, 2006). The interface is based on windows mobile 5.0 technology which is the industry standard in modern mobile devices and allows users to interact with the VR maps in six degrees-of-freedom (DOF) using either the stylus or the PDA’s keyboard. The graphics API is based on the well known Virtual Reality Modelling Language (also known as VRML) which is capable of presenting geo-referenced 3D maps as well as textual information to mobile devices such as PDAs. In addition, VRML supports animation and allows for spatial hyperlinks to be added to the virtual environment. These hyperlinks operate in exactly the same way as the hotspots used by the flash interface, the difference being that they exist in the 3D space, and can be linked with any type of multimedia content.
Figure 4. Virtual navigation of City University’s campus
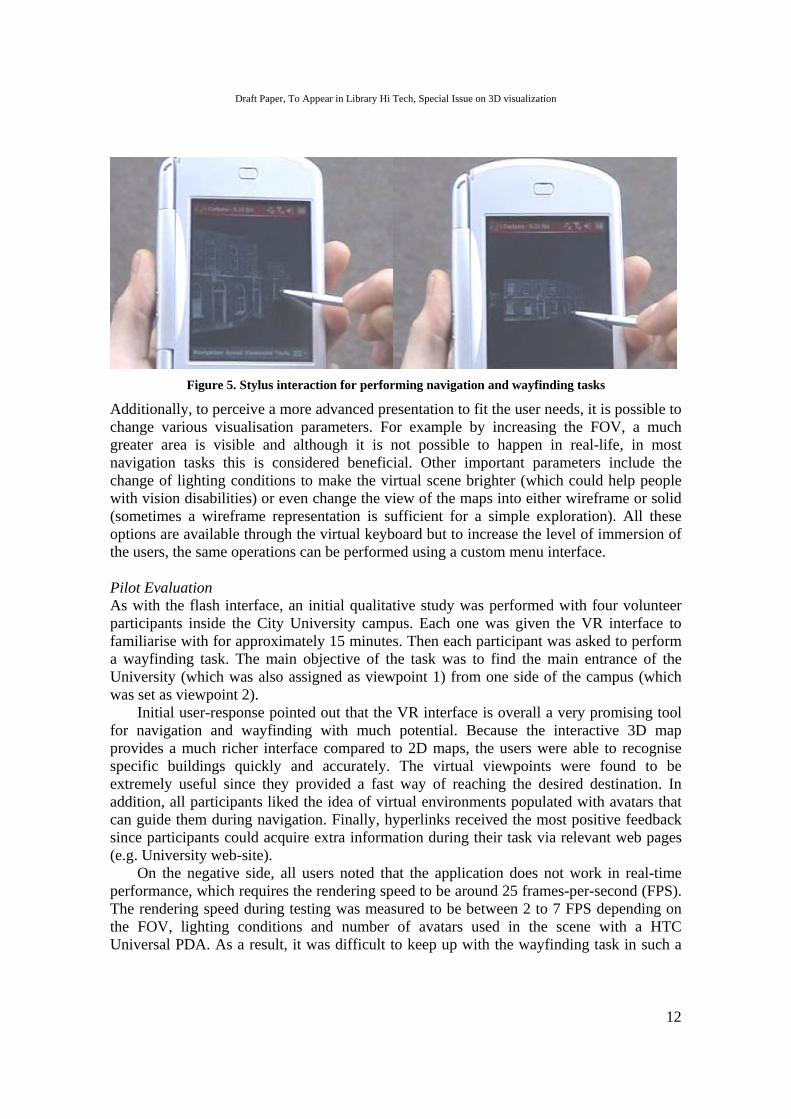
Figure 4 shows a virtual representation of the real environment (in this case City University’s campus) that the user perceives during navigation and wayfinding tasks. Each virtual building contains 3D textual information that provides useful information about the name of the building. To assist navigation, four viewpoints have been assigned to the scene, so that the users can quickly jump from one viewpoint to another. In addition, to enhance the immersion of the users, virtual representations of humans, known as avatars, are populated within the virtual environment. The avatars can be either static in space, or can perform specific tasks, such as illustrate a potential route to the users. In terms of interaction, participants can navigate inside the virtual environment by changing the virtual camera position and orientation interactively. Specifically users can walk, fly or examine the 3D map in order to perceive the scene from any angle using the stylus or the virtual keyboard. This allows them to get a good understanding of the environment without the need of visiting it. Two example screenshots of a user navigating around City University’s campus using the stylus are shown in Figure 5.
Draft Paper, To Appear in Library Hi Tech, Special Issue on 3D visualization
12
Figure 5. Stylus interaction for performing navigation and wayfinding tasks
Additionally, to perceive a more advanced presentation to fit the user needs, it is possible to change various visualisation parameters. For example by increasing the FOV, a much greater area is visible and although it is not possible to happen in real-life, in most navigation tasks this is considered beneficial. Other important parameters include the change of lighting conditions to make the virtual scene brighter (which could help people with vision disabilities) or even change the view of the maps into either wireframe or solid (sometimes a wireframe representation is sufficient for a simple exploration). All these options are available through the virtual keyboard but to increase the level of immersion of the users, the same operations can be performed using a custom menu interface. Pilot Evaluation As with the flash interface, an initial qualitative study was performed with four volunteer participants inside the City University campus. Each one was given the VR interface to familiarise with for approximately 15 minutes. Then each participant was asked to perform a wayfinding task. The main objective of the task was to find the main entrance of the University (which was also assigned as viewpoint 1) from one side of the campus (which was set as viewpoint 2). Initial user-response pointed out that the VR interface is overall a very promising tool for navigation and wayfinding with much potential. Because the interactive 3D map provides a much richer interface compared to 2D maps, the users were able to recognise specific buildings quickly and accurately. The virtual viewpoints were found to be extremely useful since they provided a fast way of reaching the desired destination. In addition, all participants liked the idea of virtual environments populated with avatars that can guide them during navigation. Finally, hyperlinks received the most positive feedback since participants could acquire extra information during their task via relevant web pages (e.g. University web-site). On the negative side, all users noted that the application does not work in real-time performance, which requires the rendering speed to be around 25 frames-per-second (FPS). The rendering speed during testing was measured to be between 2 to 7 FPS depending on the FOV, lighting conditions and number of avatars used in the scene with a HTC Universal PDA. As a result, it was difficult to keep up with the wayfinding task in such a

Liarokapis F. and Conradi E. User Interfaces for Mobile Navigation
13
low rendering speed. However, after testing the VR interface was also deployed on a Dell Axim x51 PDA which has a 16 MB graphics accelerator embedded and the rendering speed doubled. Moreover, although the 3D map was generated based on accurate data (i.e. used real photographs as textures), two users mentioned that the quality of the map is not analogous to the quality perceived from the real environment, and this can be distracting. However, as the processing and graphics capabilities of mobile devices become faster, more realistic rendering speeds will be achieved.
Conclusions and Future Work
To explore the potentials of pedestrian navigation within urban environments, two user-friendly interfaces for mobile devices are proposed. The first interface is based on 2D technologies displaying different versions of 2D maps and textual information. User testing highlighted key problems, mainly concerned with design and implementation issues, but also provided a better understanding of what users demand from a mobile navigation aid. The evaluations highlighted that when users navigate using the mobile interface they engage more heavily with the map image itself. Changing the view helped the users to locate themselves on the map, as different views had different accentuated features to help the users place themselves. The majority of the other button features are needed to get a clearer picture of the surrounding area. The second interface makes use of VR technology to provide a richer experience—3D interactive maps that contain 3D textual information, animation and hyperlinks—to mobile users. A pilot study indicated that the VR interface is a very promising tool for navigation and wayfinding because of the high-level of interactivity of the interface. However, it requires more processing power to become an effective tool that could be used in practice. Although direct comparison was not made between the two interfaces, the 2D flash interface seemed to be easier to use and thus more useful during navigation. The major advantage of the interfaces presented is that they are designed based on commercial and open-standard technologies and thus they can be customised to serve a number of library-related applications. Both interfaces with minor modifications could be applied to provide mobile assistance and services to both users and librarians. In a simple scenario, users could use either interface to find the location of the library in a town or in a university environment. In addition, inside the library, routing tools and services can be developed to assist users and librarians to find the specific locations of the books.
In the future, the systems will be integrated into a single interface in order to maximise the benefits of 2D and 3D visualisation. In addition, more evaluation studies will be performed using a bigger sample of users in order to address specific tasks as well as quantify the results. This feedback will be used to further improve the design as well as usability issues of these mobile navigation interfaces.
Acknowledgements

Draft Paper, To Appear in Library Hi Tech, Special Issue on 3D visualization
14
Part of this work was funded by the LOCUS project, funded by EPSRC through the Location and Timing KTN partnership. We would also like to thank the GeoInformation Group, partner on the LOCUS project, which made the entire database of the City of London buildings available as well as Dr. David Mountain and Christos Gatzidis for creating the 2D and 3D maps for this work.
References
Ballagas, R. Memon, F. Reiners, R and Borchers, J. (2006) “iStuff Mobile: prototyping interactions for mobile phones in interactive spaces”. To appear in Proc. PERMID, Workshop on Pervasive Mobile Interaction Devices at PERVASIVE 2006, Dublin, Ireland, LNCS.
Cheng, L.T. and Gruen D. (2003), “A Mobile User Interface for Threading, Marking, and Previewing Email”, Technical Report: 03-08.
Conradi, E. (2005), “Design, Development and Evaluation of User Interfaces for Mobile Devices”, MSc Thesis, City University, UK.
Liarokapis F. and Brujic-Okretic, V. (2006), “Location-based Mixed Reality for Mobile Information Services”, Advanced Imaging, April, Vol. 21, no. 4, pp. 22-25.
Liarokapis, F., Greatbatch, I., et al. (2005), “Mobile Augmented Reality Techniques for GeoVisualisation”, In Proc. of the 9th International Conference on Information Visualisation, IEEE Computer Society, 6-8 July, London, 2005, pp. 745-751.
Liarokapis, F., Raper, J., Brujic-Okretic, V. (2006), “Navigating within the urban environment using Location and Orientation-based Services”, European Navigation Conference & Exhibition 2006, 7-10 May, Manchester, UK.
Longley, P. A., Goodchild, M. F., Maguire, D. J. and Rhind, D. W. (2001), “Geographical information systems and science”, Chichester: John Wiley and Sons, Chichester, Ch.12, 263-267.
Norrie, M., and Signer, B. (2005), “Overlaying Paper Maps with Digital Information Services for Tourists”, In Proceedings of ENTER 2005, 12th International Conference on Information Technology and Travel & Tourism, Innsbruck, Austria, January.
Reichenbacher, T. (2001), “Adaptive Concepts for a Mobile Cartography”, Supplement Journal of Geographical Sciences, December, pp. 43-53.
Schilling, A. and Coors, V. (2004), “3D Maps on Mobile Devices”, In Branki, C.; Unland, R.; Wanner, G. (Hrsg.): Multikonferenz Wirtschaftsinformatik (MKWI) 2004, Universität Duisburg-Essen, 9.-11. März 2004, Band 3: Mobile Business Systems, Mobile and Collaborative Business, Techniques and Applications for Mobile Commerce (TAMoCO). Essen 2004.
Schohn, G. and Berger, A. (2004), “CENTAUR: A Two-Panel User Interface for

Liarokapis F. and Conradi E. User Interfaces for Mobile Navigation
15
Mobile Document Access”, In Mobile Human-Computer Interaction 2004, Glasgow, UK, pp. 501-506.
Smith-Atakan, S. (2006), “Human-Computer Interaction”, Thomson Learning, London, pp. 54-57.
Vainio, T. and Kotala, O. (2002), “Developing 3D Information Systems for Mobile Users: Some Usability Issues”, In Proc of the 2nd Nordic conference on Human-Computer Interaction NordiCHI, Vol. 31, 231-234.
Wasinger, R., Stahl, C. and Kruger, A. (2003), “Mobile Multi-Modal Pedestrian Navigation”, In IGC2003 Second International Workshop on Interactive Graphical Communication, London.
Web Sources
EDINA, (2005), “Digimap: OS Land-Line Plus”, Available at: [http://edina.ac.uk/digimap/description/products/landline.shtml], Accessed at: 31/07/2006.
Google Earth, (2007), “Explore, Search and Discover”, Available at: [http://earth.google.com/], Accessed at: 11/02/2007.
Google Maps (2006), “Google Maps”, Available at: [http://maps.google.com], Accessed at: 30/09/2006.
Macromedia Flash Lite, (2006), “Create engaging experiences for mobile phones & consumer electronics devices”, Available at: [http://www.adobe.com/products/flashlite/], Accessed at: 31/07/2006.
Ordnance Survey, (2006), “The national mapping agency of Great Britain”, Available at: [http://www.ordnancesurvey.co.uk/oswebsite/], Accessed at: 31/07/2006.
Virtual Earth, (2007), “Microsoft Virtual Earth”, Available at: [http://local.live.com/], Accessed at: 11/02/2007.