user guide - office for national statistics
TRANSCRIPT

User Guide VOLUME 6 – ANNUAL POPULATION SURVEY (LOCAL AREA DATABASE)

Labour Force Survey User Guide – Volume 6: Annual Population Survey (Local Area Database)
ANNUAL POPULATION SURVEY/LOCAL AREA DATABASE
CONTENTS Page SECTION 1 – INTRODUCTION ............................................................................ 1 SECTION 2 – ANNUAL DATA ............................................................................. 1 The Local Area database (LADB) .................................................................. 1 Annual Local Area LFS (ALALFS) ................................................................. 2 The Annual Population Survey (APS) ............................................................ 2 Weighting and Structure of the Local Area Annual Datasets ......................... 4 Sampling variability of the Local Area Annual Datasets ................................. 5 Standard error estimates for levels ................................................................ 6 Standard error estimates for rates ................................................................. 7 Thresholds ..................................................................................................... 7 Thresholds for data on ethnicity ..................................................................... 8 Thresholds for earnings data ......................................................................... 9 APS Income weight ....................................................................................... 9 Eurostat Ad-hoc module variables and weight ............................................. 10 Wave 1 variables ......................................................................................... 11
Personal Well-Being variables ..................................................................... 11 Sexual Identity/Orientation variables ............................................................ 12 Veteran variables ......................................................................................... 12 Other Integrated Household Survey (IHS) variables .................................... 13 APS Household datasets ............................................................................. 13 Geography variables .................................................................................... 14 APS 3 year pooled datasets......................................................................... 15 SECTION 3 – ACCESSING LOCAL AREA DATA ........................................... 17 ANNEX A – Core variables for JD04 to JD05 periods ........................................ 19 ANNEX B – Average grossing factors (mean weights) for unitary and local authority areas from the January-December 2019 APS data .............................. 20 ANNEX C – Sampling variability for employment and ILO unemployment (of persons aged 16+) for unitary and local authority areas from the January-December 2019 APS data ................................................................................. 30 ANNEX D – Calculating thresholds for England, Wales & Scotland ................... 39 ANNEX E – Wave 1 variables ........................................................................... 42 ANNEX F – Geographies removed from A15M16 ............................................. 43
Labour Force Survey User Guide-Volume 6:
Annual Population Survey (Local Area Database)
_________________________________________________________________________________
_________________________________________________________________________________
1
SECTION 1: INTRODUCTION
The Labour Force Survey (LFS) is a key source of information of labour supply – that is, on individuals who supply their labour. The LFS is a quarterly survey of approximately 37,000 responses from UK households per quarter (pre-Covid19). Each household is surveyed over five quarters, with the final (fifth) interview one year after the first. It is designed to provide robust national labour market and macroeconomic information, but its sample size is insufficient to provide reliable data at local level. Therefore, annual datasets are produced for local area analysis, originally from the quarterly datasets and then with additional boost surveys.
SECTION 2: ANNUAL LOCAL AREA DATABASE (LADB)
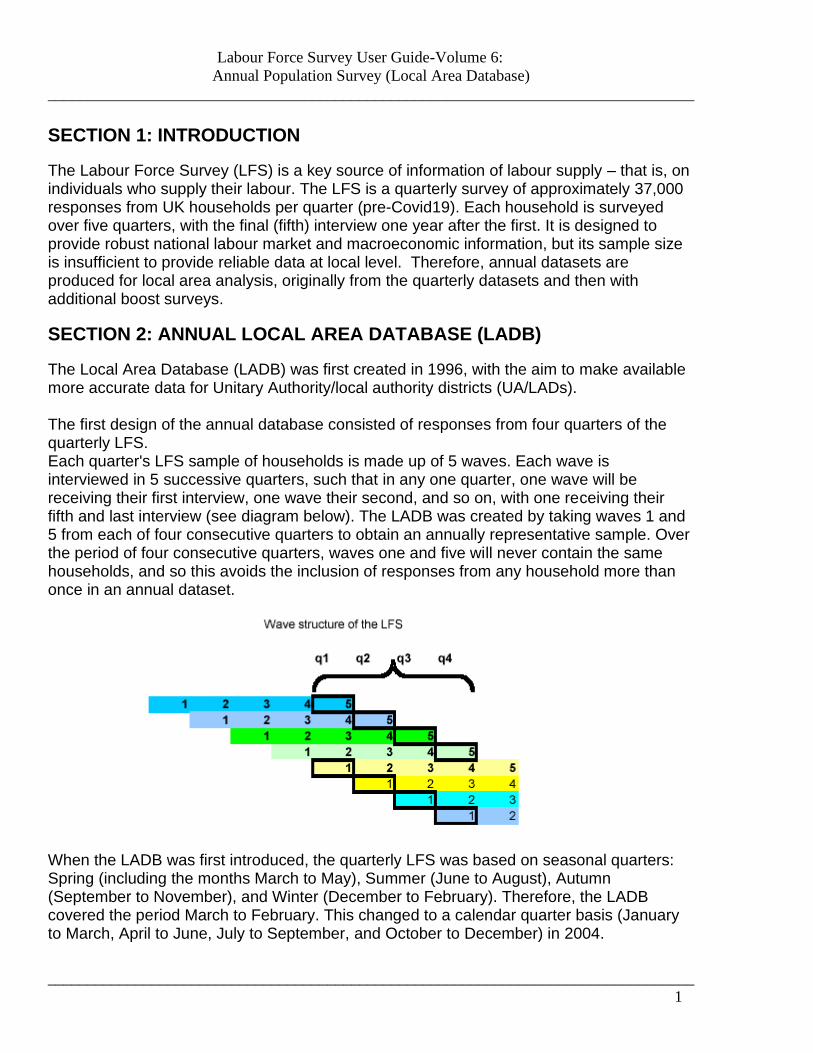
The Local Area Database (LADB) was first created in 1996, with the aim to make available more accurate data for Unitary Authority/local authority districts (UA/LADs). The first design of the annual database consisted of responses from four quarters of the quarterly LFS. Each quarter's LFS sample of households is made up of 5 waves. Each wave is interviewed in 5 successive quarters, such that in any one quarter, one wave will be receiving their first interview, one wave their second, and so on, with one receiving their fifth and last interview (see diagram below). The LADB was created by taking waves 1 and 5 from each of four consecutive quarters to obtain an annually representative sample. Over the period of four consecutive quarters, waves one and five will never contain the same households, and so this avoids the inclusion of responses from any household more than once in an annual dataset.
When the LADB was first introduced, the quarterly LFS was based on seasonal quarters: Spring (including the months March to May), Summer (June to August), Autumn (September to November), and Winter (December to February). Therefore, the LADB covered the period March to February. This changed to a calendar quarter basis (January to March, April to June, July to September, and October to December) in 2004.

Labour Force Survey User Guide-Volume 6:
Annual Population Survey (Local Area Database)
_________________________________________________________________________________
_________________________________________________________________________________
2
Annual Local Area Labour Force Survey (ALALFS)
For the period from March 2000 to February 2001, extra respondents were included in the LADB (but not in the quarterly LFS data). This first sample boost covered only respondents in England, and was called the English Local LFS (ELLFS) boost. In March 2002 a similar boost was introduced in Wales (the WLFS boost), and in 2003/04 the SLFS boost was introduced in Scotland. The combined surveys were called the Annual Local Area LFS (ALALFS). The ELLFS was designed in such a way to give an expected minimum sample size of 875 economically active adults in each Local Education Authority (LEA) (450 in London Boroughs and 300 in Rutland). The WLFS is designed to have an expected minimum sample size of 875 economically active adults in each Unitary Authority (UA) (700 for Anglesey and Ceredigion, 575 for Blaenau Gwent, and 500 in Merthyr Tydfil). The sample size in each UA in Scotland is boosted to produce an expected minimum of 875 economically active adults. However, to avoid saturation sampling, this figure is reduced to 300 in Clackmannanshire, 600 in Stirling, 700 in Inverclyde and Midlothian, and 800 in East Lothian and East Renfrewshire. Each household in the boost samples is interviewed annually for four years. To build up the sample, in 2000/01 for England (and 2001/02 for Wales and 2003/4 in Scotland), the sample was divided into four groups or waves. Over the following three years they dropped out one by one, so that only one of the original four waves was actually in the survey for all four years. A new wave is then sampled every year. More information on the methodology behind the ELLFS is available in articles on the ONS website and in the May 2000 issue of Labour Market Trends, pp195-199 and the January 2002 issue of Labour Market Trends, pp33-41.
The Annual Population Survey (APS) Although the quarterly LFS started using a calendar quarter basis in 2006, the LADB moved to a calendar quarter basis in 2004. In January 2004, a sample boost was introduced in England only. The aim of the boost was to provide an expected minimum sample size of 875 economically active adults in each UALAD in England instead of in each LEA. This allowed more accurate precision for the newly launched ONS Neighbourhood Statistics. The boost was called the Annual Population Survey boost (APSB), and combined with the Annual Local Area LFS (which included the ELLFS, WLFS, and SLFS) was called the Annual Population Survey. To avoid confusion between the whole dataset and the new boost, the whole dataset was called the Annual Population Survey (APS), and the new boost was called the APS(B).

Labour Force Survey User Guide-Volume 6:
Annual Population Survey (Local Area Database)
_________________________________________________________________________________
_________________________________________________________________________________
3
The respondents included in the APS(B) boost did not answer all the questions included in the main LFS and other sample boosts (ELLFS, WLFS and SLFS). Therefore, some estimates from the APS – such as those relating to qualifications - are based on a subset of the database excluding the APS(B) cases. With the introduction of the APS, it was decided that the annual data should be published four times a year rather than just once, as had been the case with the ALALFS. Data are now published quarterly for overlapping annual periods (January to December; April to March; July to June; and October to September). In 2006, funding for the APS(B) was withdrawn, and so the structure of the Annual Population Survey reverted to the same as the ALALFS (that is, waves 1 and 5 of the quarterly LFS plus the Local Labour Force Survey (LLFS) for England, Wales and Scotland). However, the name ‘Annual Population Survey’ has been retained, and the data continue to be published four times a year (and all questions are now based on the complete database). The figure below shows the current structure of the APS, with highlighted waves forming part of the APS January – December 2019 dataset.
APS Dataset: January – December 2019
Jan – March 2019
April – June 2019
July – Sept 2019
Oct – Dec 2019
LFS cohort 1 (first sampled January – March 2018)
Wave 5
LFS cohort 2 (first sampled April – June 2018)
Wave 4 Wave5
LFS cohort 3 (first sampled July – Sept 2018)
Wave 3 Wave 4 Wave 5
LFS cohort 4 (First sampled Oct – Dec 2018)
Wave 2 Wave 3 Wave 4 Wave 5
LFS cohort 5 (First sampled Jan – March 2019)
Wave 1 Wave 2 Wave 3 Wave 4
LFS cohort 6 (first sampled April – June 2019)
Wave 1 Wave 2 Wave 3
LFS cohort 7 (first sampled July – Sept 2019)
Wave 1 Wave 2
LFS cohort 8 (First sampled Oct – Dec 2019)
Wave 1
LLFS cohort 1 (first sampled Jan– Dec 2016)
Wave 4
LLFS cohort 2 (first sampled Jan– Dec 2017)
Wave 3
LLFS cohort 3 (first sampled Jan– Dec 2018)
Wave 2
LLFS cohort 4 (first sampled Jan– Dec 2019)
Wave 1

Labour Force Survey User Guide-Volume 6:
Annual Population Survey (Local Area Database)
_________________________________________________________________________________
_________________________________________________________________________________
4
Weighting and Structure of the Local Area Annual Datasets Weighting of the data is done in order to allow the sample to provide estimates relating to the total population and to minimise non-response bias. Each record’s weight is the number of people in the population represented by that one sample member. The weights are based on the age and sex structures of the sample and of the population. More information on the weighting procedure can be found in Volume 1 of the User Guide. For the LADB, it is desirable to improve the 'weighted totals' at the local area level. This is done by using mid-year population estimates for local authorities and taking account of local authority populations as well as the age and sex structures of the sample and population. The basic methodology which is used for weighting the datasets is the same as the method used for the quarterly LFS datasets, where the weights are calibrated to the population totals using a Generalised Estimation System (GES). For the periods January-December 2004 (JD04) to January-December 2005 (JD05), there are two weighting variables on the datasets (PWAPS14 and PWLFS14). This is due to the different data sources which make up the final dataset, as illustrated in the diagram below: The structure of the APS dataset

Labour Force Survey User Guide-Volume 6:
Annual Population Survey (Local Area Database)
_________________________________________________________________________________
_________________________________________________________________________________
5
APS/LFS/LLFS variables LFS/LLFS ONLY variables
LFS/LLFS data
APS(B) data
The LFS/LLFS comprises of the main LFS data (waves 1 and 5 from each quarter in the year) and all the data from the English, Scottish and Welsh enhancements (ELLFS/SLFS/WLFS). The APS boost (APS(B)) only covers a subset of topics covered in the LFS and the Local Labour Force Survey (LLFS), however all of the variables appear on the dataset. The variables that are covered in both the APS (B) core and the LFS/LLFS questionnaire are known as the CORE variables. NON CORE variables are those that are solely on the LFS/LLFS. A list of CORE variables from JD04 to JD05 can be found in Annex A. The LFSSAMP variable can be used to identify these cases- LFSSAMP=1=LFS cases LFSSAMP=2=LLFS cases LFSSAMP=6=APS Boost The two weights on the APS person datasets for the periods from JD04 to JD05 are:
• PWAPS14 – there is a weight for all cases on the dataset, which can be used when looking only at the CORE variables (e.g. age, sex, ethnic group).
• PWLFS14 – there is only a weight for the LFS/LLFS cases. The APS boost cases have a 0 value for this weight. This weight should be used only when looking at NON-CORE variables, or when looking at a combination of CORE and NON-CORE.
From April 05-May06 (A05M) the APS boost was removed, with the structure of the APS dataset comprising of LFS and LLFS data. As these data were asked both the CORE and

Labour Force Survey User Guide-Volume 6:
Annual Population Survey (Local Area Database)
_________________________________________________________________________________
_________________________________________________________________________________
6
NON CORE questions, a single weight (PWTA14) was present on subsequent APS dataset. The 2011 census resulted in revisions to the population estimates and in 2014/15 a reweighted exercise was carried out to reweight the APS historical datasets from JD04 to update the population totals. Datasets from this exercise will have a weight with a 14 as the last two digits. Another reweighting exercise was undertaken in 2018 going back to A11M, the last two digits on the weight for these datasets is 18.
From JD12 there is also an income weight included on the JD datasets, more information can be found in the section APS income weight below.
Sampling variability of the Local Area Annual Datasets As the LFS is a sample survey, all estimates from it are subject to sampling variability. Sampling variability is dependent on several factors, including the size of the sample, the size of the estimate as a proportion of the population, and the effect of the design of the sample on the variable of interest. Standard errors calculated from simple random samples will, typically, differ from those calculated from more complicated sample designs, such as clustered or stratified samples. In the case of the LFS sample design, there is a clustering effect. This reflects the fact that addresses are sampled, but results are estimated for individuals. For example, ethnic group is particularly clustered, since it is likely that all members of a household living at a particular address will share the same ethnic group. The sampling fraction is also important in determining sampling variability. A sampling fraction is the proportion of households in an area that are interviewed. For example, if there are 10,000 households and 50 of these are interviewed, then the sampling fraction would be 50/10,000 or 1/200. The greater the sampling fraction, the larger the sample size and hence the more reliable are the estimates. The sampling fraction of the main LFS is consistent across Great Britain. However, the design of the local area annual samples means that sampling fractions may vary by area; English, Scottish and Welsh UALAs (or LEAs / UALADs prior to 2012) receiving a larger boost will have a higher sampling fraction. Northern Ireland will see no change. The sampling fraction varies so that a pre-determined target of economically active adults is achieved across UALAs. Where the sampling fraction is consistent over all areas, the standard error of an estimate of a level is proportional to the size of the estimate. It is not possible to provide a table of size of estimate against standard error for the later, boosted, annual LFS datasets because of the different sampling fractions in different areas; however, there is a simple conservative formula that can be used to derive the standard errors of estimates of levels. A useful benchmark to assess the relative magnitude of a standard error is to calculate the ratio of the standard error derived from a particular (complex) sample design with the standard error that would have arisen from a simple random sample of the same size. This ratio (of the standard errors) is the design factor. It indicates the relative gain (or loss) in the

Labour Force Survey User Guide-Volume 6:
Annual Population Survey (Local Area Database)
_________________________________________________________________________________
_________________________________________________________________________________
7
estimate of standard error which results from the use of a particular complex sample design compared to a corresponding simple random sample. A design factor (or DEFT) of, say, 1.20 indicates that the standard error of the estimate in question is 20% greater than would have been the case for a simple random sample of the same size. The design factor (DEFT) should not be confused with the design effect (DEFF); the design effect is the design factor squared and is calculated by the ratio of variances instead of standard errors. SE estimates for levels An approximation to the standard error for an estimate of M thousand (MT) from the annual data can be given by: √(MT * Wi/1000) (1) where Wi is the average grossing factor (mean of the weights) for cases in a specific area i. Average grossing factors, from the 2019 APS, are given in Annex B. If the area of interest spans several UA/LADs then the average grossing factor for several areas W can be given by:
=
i
i
i
ii
s
sw
W
where wi is the average grossing factor for area i and si is the 16+ sample size in area i. The 95 per cent confidence interval for an estimate of M thousand (MT) is given by: MT ± 1.96 * s.e. SE estimates for rates A simple formula for producing standard errors for proportions (assuming a simple weighted random sample) is: √ (p(1 - p)/n) For instance, in the January to December 2019 APS dataset, the estimate of the total number of people aged 16 and over who are in employment is 32,551,866. This is 61.1% of all people in the UK who are aged 16 and over. The number of people aged 16 and over in the UK sample is 222,709. The standard error of 0.1% is calculated as: √ ((0.61 * 0.39)/222,709) ONS methodologists have produced more precise standard errors allowing for the design of the LFS including the different sampling fractions. However, this involves much more

Labour Force Survey User Guide-Volume 6:
Annual Population Survey (Local Area Database)
_________________________________________________________________________________
_________________________________________________________________________________
8
complex calculations than those described here for the approximate standard errors. Annex C shows the estimate, standard error and design factor (based on the precise standard errors) for the employment and ILO unemployment (of persons aged 16+) for UA/LADs using the 2019 APS data. The standard error of the level of the estimate is simply the standard error of the proportion (or rate) multiplied by the population aged 16 and over: 0.1% * 53,297,902 = 53,297 (2) The formulae (1) in the section above is an approximation of (2).
Thresholds It is the nature of sampling variability that the smaller the group whose size is being estimated, or from which an estimate is being derived, the less precise that estimate is. Put another way, the size of the standard error increases with the level of the estimate, so that the larger the estimate the larger the standard error. But the larger the sample estimate, the smaller will be the standard error in percentage terms (relative standard error being the standard error as a percentage of the estimate). Thus, larger sample estimates will be relatively more reliable than smaller estimates: an estimate of 500,000, while having a standard error of 13,800, will have a relative standard error of 3%, whereas an estimate of 25,000 which has a standard error of 3,100 has a relative standard error of 12%. Before 2005, publication thresholds were applied to quarterly and annual LFS estimates; any estimate smaller than the threshold was considered unreliable and hence not published. Since 2005, no estimates are suppressed due to lack of statistical reliability. All estimates are published along with 95% corresponding confidence intervals. These thresholds are no longer applied by ONS in the dissemination of LFS and APS estimates, but this section is retained as thresholds can be used as a simple way of identifying cells with high sampling variability. These thresholds were calculated to be approximately equivalent to publishing estimates which had a relative standard error of 20% or less. The threshold for quarterly LFS estimates was 10,000, and the thresholds for the annual LFS, before the sample boosts were introduced in 2000/01, was 6,000. However, since 2000/01, the nature of LFS enhancement has meant that some areas have seen a very large increase in sample size, and others very small increase or none at all. This means that a single threshold for all areas is no longer appropriate. For England, each area was allocated to one of three threshold bands - 2,000, 4,000 or 6,000. For Wales from 2001/02, each UA was given its own threshold. These ranged from 1,000 to 4,000. From 2003/04, each UA in Scotland was given its own threshold ranging from 1,000 to 5,000. Annex D shows how the thresholds were calculated for the local authorities in each of the three countries.

Labour Force Survey User Guide-Volume 6:
Annual Population Survey (Local Area Database)
_________________________________________________________________________________
_________________________________________________________________________________
9
These thresholds can also be applied to the APS. Thresholds for data on ethnicity It has long been known that the effect on the LFS of clustering within households (or ‘design effects’) for ethnic group and for totals segregated by ethnic group can be substantial. For the annual LFS-based surveys it is appropriate to take account of the design effects in the thresholds for estimates of variables by ethnic groups. The local design effects may be different from the regional and national design effects because of local variations in household size and because of variations in the proportions of households in multi-occupied dwellings in different areas. It is recommended for the ALALFS datasets in England that a single multiplier of 2.5 is applied to the general thresholds for most ethnic estimates1. A separate analysis of the WLFS recommended a multiplier of 4.0 in Cardiff and 2.5 in the rest of Wales. The SLFS uses the same multipliers of the standard thresholds as in England, and hence a multiplier of 2.5 is applied to the existing threshold. These thresholds can also be applied to the APS. Thresholds for earnings data For estimates of the number of people in a small group, which is a count, for example employed people in a small ethnic group, we can use an approximation of the variance to derive the minimum number of cases that is required in a group to achieve a relative standard error of less than 20%. However, Earnings cannot be regarded as a count, it is a continuous variable, and hence the method for counts does not apply. There is no approximation method that can be used to derive a reliability threshold of variables that are not counts. Instead, we propose a threshold based on values of relative standard errors of small groups that were computed using recent APS earnings data. Relative standard errors were obtained for estimates of mean gross earnings for groups defined by UALAD and age (grouped) and by UALAD and ethnicity (grouped). In both sets of groups, all groups with 25 or more cases had a relative standard error less than 20%. On the other hand, in groups with fewer than 25 cases, a proportion of the groups had a relative standard error higher than 20%. Estimates of counts also have a reliability threshold of 25 cases per group. The threshold depends on the variation of earnings, the sample design and weighting method, and hence may need to be revised in the future. We, therefore, recommend using a reliability threshold of 25 cases for estimates of earnings and monitor its value regularly, every two years, for example. APS Income weight (PIWTA**)

Labour Force Survey User Guide-Volume 6:
Annual Population Survey (Local Area Database)
_________________________________________________________________________________
_________________________________________________________________________________
10
From 2012 an income weight (PIWTA**) is included on the JD period datasets. From JD18 it will be included on every quarter. The income weight is calculated in a similar way to the LFS income weight. More information on this can be found in the volume 1 user guide. The main differences are there are six calibration groups used to calculate the APS income weight, whereas for the LFS income weight there are four. It is worth remembering that the primary source of data for earnings analysis in the UK is still the Annual Survey of Hours and Earnings. This business survey collects detailed information on the composition and distribution of earnings among employees, however as a business survey, ASHE collects only a limited range of personal characteristics regarding individual employees. This limits its usefulness in analysing earnings for instance by education and/or by different protected characteristics. As a result, the Labour Force Survey is still heavily used as a source of data on earnings. Though it is accepted that the accuracy and detail of earnings information captured by the LFS falls short of that obtained by ASHE, the greater range of personal and household characteristics broaden its potential uses. However, one drawback of earnings analysis on the LFS is that the achieved sample is relatively small. This is because earnings questions are asked only to employees and only in forty percent of the interviews carried out in each quarter. Furthermore, earnings questions on the LFS are known to have particularly poor response rates. The achieved sample for the LFS earnings questions is usually around 9,000, compared with approximately 150,000 respondents on ASHE. This limited sample size then restricts the extent to which you can perform multivariate analysis of earnings on the LFS, particularly where the variables of interest have many categories. It is this desire to have a sample size sufficient for more detailed analysis, alongside information on a wider range of personal characteristics which drives the user need for earnings weights on the APS. Eurostat Ad-hoc module variables and weight. From 2009, the JD APS person datasets have had additional variables added to the government cuts; these are known as the Eurostat Ad Hoc Modules (AHM) and the Eurostat wave 1 weight (EWEIGH**), where ** denotes the year that the weight was published. Under Regulation (EC) No 577/98, Eurostat includes a number of variables each year which provide information on aspects of the labour market that do not form part of the standard questionnaire. These set of variables constitute an "ad hoc module". The different themes since 2009 are:

Labour Force Survey User Guide-Volume 6:
Annual Population Survey (Local Area Database)
_________________________________________________________________________________
_________________________________________________________________________________
11
Year Theme
2009 Transition from school to work life
2010 Reconciliation between work and family life
2011 Employment of disabled people
2012 Transition from work into retirement
2013 Accidents at work and other work-related health problems
2014 Labour market situation of migrants and their descendants
2015 An ad-hoc module didn’t run this year 1
2016 Young people on the labour market
2017 Self-employment
2018 Reconciliation between work and family life
2019 Work organisation and working time arrangements
2020 Accidents at work and other work-related health problems
A brief description of the ad hoc module variables can be found in the volume 9a user guide. More information about the Eurostat aspect of the survey (including the background, the regular variables and ISCO country classification) can be found in user guide volume 9.,Both of these user guides can be found here: https://www.ons.gov.uk/employmentandlabourmarket/peopleinwork/employmentandemployeetypes/methodologies/labourforcesurveyuserguidance The Eurostat variables are collected in the first wave only on the LFS, and this means a separate weight is required (EWEIGH**) to use along with the AHM variables. The calculation of the Eurostat weight is similar to the method used for the calibration of the LFS and APS weights (GES). However, with the Eurostat weight the bounded option in GES is included, so the calibration weights cannot exceed the value 9999, a constraint set by Eurostat; this affects some multiple occupancy households from Q3 2010 due to changes to the LFS at that time. Since the Eurostat variables are based on wave 1 data only, the 75+ adjustment which is applied to wave 1 LFS data (as households where all residents are aged 75 and over are no longer interviewed in subsequent waves) is removed. Wave 1 variables From JD08, various wave 1 LFS variables have been added to the JD APS person datasets (on the Government cuts). A list of the wave 1 variables can be found in Annex E.
1 The wave 1 weight and variables are still included on the JD15 dataset

Labour Force Survey User Guide-Volume 6:
Annual Population Survey (Local Area Database)
_________________________________________________________________________________
_________________________________________________________________________________
12
It is worth noting that several of these variables have only recently (in quarters in 2014) been asked in wave 1 only. However, in order to do some analysis with other years, they have been included in earlier periods of the APS dataset where they may have been asked in Wave 1 and Wave 5 of the LFS. When analysis is carried out based on these variables the Wave 1 weight should be used: EWEIGH** (the Eurostat one that can also be used for the ad hoc modules). There may be a discrepancy between the unweighted and weighted results, as the Wave 5 cases will be included in the unweighted counts but not in the weighted counts (This is because only Wave 1 cases have weights). Personal Well-Being variables
From April 2011 the mainstream APS person datasets now contains Personal Well-Being questions (SATIS, WORTH, HAPPY, ANXIOUS), along with the Well-Being non-proxy weight (NPWT**), which should be used when analysing these variables. Previously (from 2011) a specific 'APS Well-Being micro dataset' was created, however the production of this separate dataset ceased from A14M. The APS person datasets (from A11M12 onwards) are now the official source for the Well-Being variables previously released as part of the 'APS Well-Being micro dataset'.
It is important to note that the size of the achieved sample for the Well-being questions within the APS dataset is approximately half that of the full APS file. This reduction is due to the Well-Being questions being only asked of persons aged 16 and over, who gave a personal interview; proxy answers are not accepted. As a result some caution should be used when analysing responses to Well-Being questions at detailed geography areas, or other variables, where unweighted respondent numbers are relatively small. It is recommended that for lower level geography analysis the variable ‘UACNTY09’ is used.
It is not possible to combine other single year APS/Personal Well-Being datasets together to carry out longitudinal analysis. The Personal Well-being datasets are not designed for longitudinal analysis, e.g. they are not designed to track individuals over time.
The ONS produce a Statistical Bulletin on Personal Well-Being in the UK, which is available from the ONS website. It provides an overview and analysis of UK personal well-being data and also includes information on how personal well-being data can be used: https://www.ons.gov.uk/peoplepopulationandcommunity/wellbeing Sexual Identity/Orientation variables
From January 2011 the APS person datasets now also contains a Sexual Identity variable (SIDV), along with the Sexual Identity weight (SIDWT**), which should be used when analysing this variable. Previously Sexual Identity variables were released as part of the Integrated Household Survey (IHS).

Labour Force Survey User Guide-Volume 6:
Annual Population Survey (Local Area Database)
_________________________________________________________________________________
_________________________________________________________________________________
13
Again like the Personal Well-Being questions it is important to note that the size of the achieved sample for the Sexual Identity is much smaller than the full APS file. This reduction is due to the Sexual Identity questions being only asked of persons aged 16 and over, who gave a personal interview; proxy answers are not accepted. As a result any analysis by geographical area below regional level is not recommended, and that caution should be used for analysing Sexual Identity responses by other variables where unweighted respondent numbers are relatively small. The ONS produce an experimental Statistical Bulletin on Sexual Orientation in the UK, which is available from the ONS website. It provides an overview and analysis of UK Sexual Identity data and also includes information on how Sexual Identity data can be used https://www.ons.gov.uk/peoplepopulationandcommunity/culturalidentity/sexuality Veteran variables Between 2014 and 2018 the questions listed below have been asked on the APS to try and measure the UK Armed Forces Veterans residing in Great Britain.
• VETCURR (Currently serving in the armed forces)
• VETSERV (Ever served in armed forces)
• VETYEARLFT (Year left armed forces)
• VTYRLFT2 (Age left the UK Regular Armed Forces or the UK Reserve Armed Forces)
• VTYRLFT3 (Year left the UK Regular Armed Forces or the UK Reserve Armed Forces).
• VETERAN (Final Veterans derived variable to be used) Due to the sensitive nature of these variables the Veteran questions are currently only released on APS Government level datasets. Other Integrated Household Survey (IHS) variables Other variables previously released via the IHS now been included in the APS person datasets. Use the APS person weight (PWTA**) for analysing these: Smoking Variables
• CIGEVER (Ever Smoked) from JM16, previously SMOKEVER
• CIGNOW (Smoke at all nowadays) from April 2009
• CIGSMK16 (Smoking Status) from JM16, previously CIGSMK1 The ONS produce a Statistical Bulletin on Smoking Prevalence in the UK, largely based on source information from the APS https://www.ons.gov.uk/peoplepopulationandcommunity/healthandsocialcare/healthandlifeexpectancies/bulletins/adultsmokinghabitsingreatbritain/2019

Labour Force Survey User Guide-Volume 6:
Annual Population Survey (Local Area Database)
_________________________________________________________________________________
_________________________________________________________________________________
14
Health Variable
• QHEALTH1 (How is the respondent’s health) from July 2009 APS Household datasets Household level APS datasets are also available for the January-December periods (which allow labour market analysis to be carried out on families and households, at local area levels and for small sub-groups of the population across the UK). , Additional information can be found in user guides volume 1 (background and methodology) and 8 (household and family data) https://www.ons.gov.uk/employmentandlabourmarket/peopleinwork/employmentandemployeetypes/methodologies/labourforcesurveyuserguidance The main points to remember between the person and household datasets are:
• For the household data set, non-responders are included, as they are necessary to identify relationships between household members, assign them to complete family units within the household, and derive family and household variables.
• Unlike in the person data sets, weights for each person in the same household are equal. This ensures that weighted estimates at the household level are consistent
The APS household level weight is PHHWTA14 (from JD 2006 to JD11) and PHHWTA18 (from JD12). Similar weighting methodology is used to the household-level LFS dataset, but with a more detailed set of calibration groups. Note due to changes from JD11, there are some additional cases included in the dataset (compared to JD06-JD10). These cases are: 1) households where everyone has an IOUTCOME of 6 (data brought forward from previous quarter) and THISWV=2,3 or 4, 2) households where everyone has an IOUTCOME of 3 (non-response) 3) households where everyone has an IOUTCOME of either 6 or 3 and THISWV=2,3 or 4. This won't have any impact on weighted analysis, since these cases have a zero weight, but it could have an impact if looking at the unweighted data. Geography variables There have been changes to the geography variables, which has involved some existing variables being removed and new ones added. This will affect the APS government datasets (both person and household level) from JD14. The change is due to ONS Geography moving to using a nine-digit coding structure in 2011, and the availability of new geographies following the 2011 Census

Labour Force Survey User Guide-Volume 6:
Annual Population Survey (Local Area Database)
_________________________________________________________________________________
_________________________________________________________________________________
15
The new geography variables (mostly nine-digit) can be seen in the table below:
Variable name Description
PARK National Parks
LEA Local Education Authority
CTRY9D Country
NUTS162/NUTS132 NUTS 2 areas (2016/13)
NUTS163/NUTS133 NUTS 3 areas (2016/13)
TTWA9D Travel to work area
RU11IND 2011 Census rural-urban classification
OA11 2011 Census output area
GOR9D Region
PCON9D Westminster parliamentary constituency (UK)
LAUA Local Authority District
TECLEC
Local Learning and Skills Council (England) Enterprise Region (Scotland) DCELLS (Wales)
LSOA11 2011 Census Lower layer super output area
MSOA11 2011 Census Middle layer super output area
WARD Electoral Ward
CCG Clinical Commissioning Groups
CTY Counties
LEP Local Enterprise Partnerships (DV not supported by ONS Geography)
ONS unsupported geographies (listed in Annex F) are no longer provided on APS datasets from A15M16 onwards. The reweighted historical LFS and APS government datasets (pre-2014) do not contain any nine-digit geographies. If you require these geographies pre-2014 a lookup can be provided on request to allow you to merge these onto historical datasets. APS 3 Year Pooled datasets The APS 3 year pooled dataset is designed to allow more robust analysis at lower level geographies, that isn't always possible using the single year APS dataset, especially for certain topics whose achieved sample size is smaller. This 3 year dataset will contain a sample size of around 530,000 respondents and will largely only include variables that appear in all of the 3 years it covers.
Labour Force Survey User Guide-Volume 6:
Annual Population Survey (Local Area Database)
_________________________________________________________________________________
_________________________________________________________________________________
16
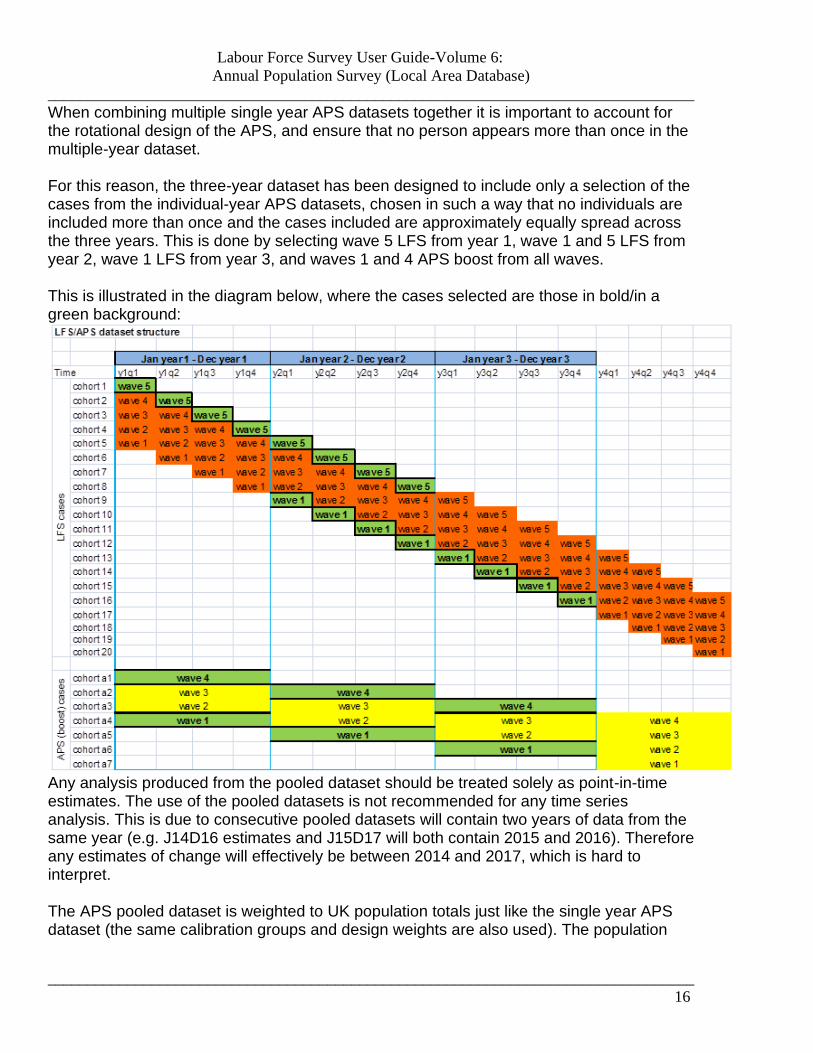
When combining multiple single year APS datasets together it is important to account for the rotational design of the APS, and ensure that no person appears more than once in the multiple-year dataset. For this reason, the three-year dataset has been designed to include only a selection of the cases from the individual-year APS datasets, chosen in such a way that no individuals are included more than once and the cases included are approximately equally spread across the three years. This is done by selecting wave 5 LFS from year 1, wave 1 and 5 LFS from year 2, wave 1 LFS from year 3, and waves 1 and 4 APS boost from all waves. This is illustrated in the diagram below, where the cases selected are those in bold/in a green background:
Any analysis produced from the pooled dataset should be treated solely as point-in-time estimates. The use of the pooled datasets is not recommended for any time series analysis. This is due to consecutive pooled datasets will contain two years of data from the same year (e.g. J14D16 estimates and J15D17 will both contain 2015 and 2016). Therefore any estimates of change will effectively be between 2014 and 2017, which is hard to interpret. The APS pooled dataset is weighted to UK population totals just like the single year APS dataset (the same calibration groups and design weights are also used). The population

Labour Force Survey User Guide-Volume 6:
Annual Population Survey (Local Area Database)
_________________________________________________________________________________
_________________________________________________________________________________
17
totals used are the average of the 6th month of each of the three years (e.g. for J15D17 the mean of the population totals for June 2015, June 2016 and June 2017 is used). There are several different weights on the dataset: • PWTA**C: Person Weight for 3 year pooled APS dataset • SIDWT**C: Sexual Identity weight for 3 year APS pooled dataset • NPWT**C: Non-proxy weight for 3 year APS pooled dataset Where ** denotes the year that the weight was published, for example the 2017 weight is pwta17.
The APS pooled datasets are available via the ONS Virtual Microdata Laboratory (VML) and the UKDS. SECTION 3: ACCESSING LOCAL AREA DATA
Local area LFS data are available via four routes: (i) ONS website The ‘Local labour markets: statistical indicators’ publication can be found at: http://www.ons.gov.uk/ons/taxonomy/index.html?nscl=Local+Labour+Market+Indicators This publication gives an overview of labour markets indicators for local areas, and the APS is used for estimates of labour supply. The publication includes some summary tables and analysis, plus downloadable Excel spreadsheets containing data for all local authorities and parliamentary constituencies. ONS’s on-line guide to labour market statistics http://www.ons.gov.uk/ons/rel/lms/labour-market-guidance/guide-to-labour-market-statistics/guide-to-lm-statistics.html also contains information on local area data, including information on the annual LFS and APS. The Guide to Regional and Local Labour Market Statistics can be found at: http://webarchive.nationalarchives.gov.uk/20110218135832/http:/statistics.gov.uk/downloads/theme_labour/Guide_regional_local_lms.pdf (ii) Nomis Nomis contains tables of both annual LFS and APS data for a wide range of geographies. To access these data visit www.nomisweb.co.uk. Regular users are encouraged to register and obtain a user account, but the data can be accessed without registering. The most recent annual data on Nomis allows some additional functionality, such as allowing user defined areas and variables. Estimates from the 2003/04 annual LFS and all APS datasets are output, along with corresponding 95% confidence intervals. Annual LFS/APS data are available for the following geographies:
• Countries

Labour Force Survey User Guide-Volume 6:
Annual Population Survey (Local Area Database)
_________________________________________________________________________________
_________________________________________________________________________________
18
• Government Office Regions
• Counties
• Unitary authorities
• Local authority districts
• Parliamentary constituencies
• NUTS areas
• Learning and policy geographies (eg ELWAs and local learning and skills councils) (iii) ONS local area LFS Dataservice The estimates from the annual LFS/APS available from the ONS web site and from Nomis are pre-defined aggregates. For users who want to specify their own analyses and tabulations, ONS runs a service to provide these. There is a charge for this service. To request a table from this service or obtain more information about the service e-mail [email protected] (iv) Access to APS micro-data The UK Data Service (UKDS) manages access to the APS microdata, offering a Secure Data Service (SDS) and an End–User Licence (EUL) procedure which allow users access to microdata files containing various levels of APS variables. Information on accessing APS data from the UKDS can be found here: https://www.ukdataservice.ac.uk/get-data/how-to-access The more detailed versions of the APS microdata are also available via the ONS Virtual Microdata Laboratory (VML). Information on how to access the VML files can be found here: https://www.ons.gov.uk/aboutus/whatwedo/paidservices/virtualmicrodatalaboratoryvml Further Information For general information about LFS local area data please telephone the Labour Market Statistics Helpline on 020 7533 6094, e-mail [email protected]. For further information about the ONS tabulation services contact [email protected] or Tel: 01633 455678. For more information on Nomis contact [email protected] or Tel: 0191 334 2680.

Labour Force Survey User Guide-Volume 6:
Annual Population Survey (Local Area Database)
_________________________________________________________________________________
_________________________________________________________________________________
19
ANNEX A – Core variables for JD04 to JD05 periods
aage Dteofbth gorwk2r lktima numhhld quals401 Samelad typhst4 xr12
add Durum Govtof lktimb numol4 quals402 sc2kmmj typhst5 xr13
addjob durun2 Govtor lkyt4 numol5 quals403 sc2kmmn Uacnty xr14
advhst Edage Hallres look4 numol5f quals404 schm04 Uala xr15
age Emplen hdpch19 manager numolfo quals405 Scotpca Ualdgb ystart
agedfe Empmon Hhld mardy numsce quals406 sctvec Ualdwk ytetjb
ages Enrol Higho marsex nuts2 quals407 sector Ukpca ytetmp
amarstt eth01 hitqua05y marstt nuts3 quals408 sectro03 Undabl aofl16 Ethas hitqua4 mpnr02 nuts4 quals409 self1 Undnst aofl19 Ethbl hitqua5 natidb nvqlev quals410 self2 undskhr aohl16 ethcen15 Hohid natide nvqsvq quals411 self3 Undst aohl19 ethcen6 Home natidi nvqun quals601 self4 Uresmc appr4 Ethmx Hout natido nvqun2 quals602 sex Urind attend Ethwh Hrp natids oacode quals603 smsxfu w1yr ayfl19 Everwk Hrpid natidw oneten quals604 soa1 Wait ayhl19 Extfu Hst nation ownbus quals605 soa2 ward03 Befor Famunit Ilodefr nato pca quals606 soc2km ward05 Beforf fdpch15 ilodefr05 natox pcode quals607 solo2 ward98 Btec fdpch16 ilodefr05y ndtype4 pdwage quals608 solor Wavfnd caind fdpch19 indd92m newdea4 persno quals609 start Week cameyr fdpch2 indg92m nolook prxrel quals610 stat2 Wnleft candg fdpch4 indm92m nolowa01 publicr quals611 statr wnleft2 caseno fdpch9 inds92m nolowa02 pwaps05a Quota stucur workage casward Fmplus Indsect nolowa03 qgcse41 Recno supvis worst30 conmon Ftpt inecac05 nolowa04 qgcse42 Refdte supvis2 worst30n conmpy Ftptwk inecac05y nolowa05 qgcse43 Refwkd teach41 Wrkage
consey Furn Inecacr nolowa06 qgcse44 Refwkm teach42 Wrking
country gcse41 Ioutcome nolowa07 qgcse45 Refwky teach43 xr00 2005
Only course gcse42 Jbaway nolowa08 qgnvq Regwkr teach44 xr01
cry01 gcse43 Jobbeg nolowa09 qrtr Relbus teach45 xr02 Ilodef05y
cryo gcse44 land96 nolowa10 qualch41 Relhfu teach46 xr03 Inecac05y
cryox gcse45 Lea nolwm qualch42 Relhrp teclec4 xr04 hitqual05y
cured gcseful1 Leftm nolwmy qualch43 Relig ten96 xr05 hiqual05y
degcls gcseful2 Leftw nowant qualch44 rent96 thiswv xr06 levqual05y
degree4 gcseful3 Leftyr nsecm qualch51 Resbby tlec98 xr07
difjob gcseful4 Leiscl nsecmmj qualch52 Resmth ttwa xr08 dobd gcseful5 Lfssamp num5up qualch53 Respno typhst1 xr09 dobm gnvq4 Likewk numal qualch54 Restme typhst2 xr10 doby Gorwkr Livtog numas qualch55 Rsa typhst3 xr11
Weight to use: PWAPS – Core Only PWLFS – Non Core or Non Core & Core
Labour Force Survey User Guide-Volume 6:
Annual Population Survey (Local Area Database)
_________________________________________________________________________________
_________________________________________________________________________________
20
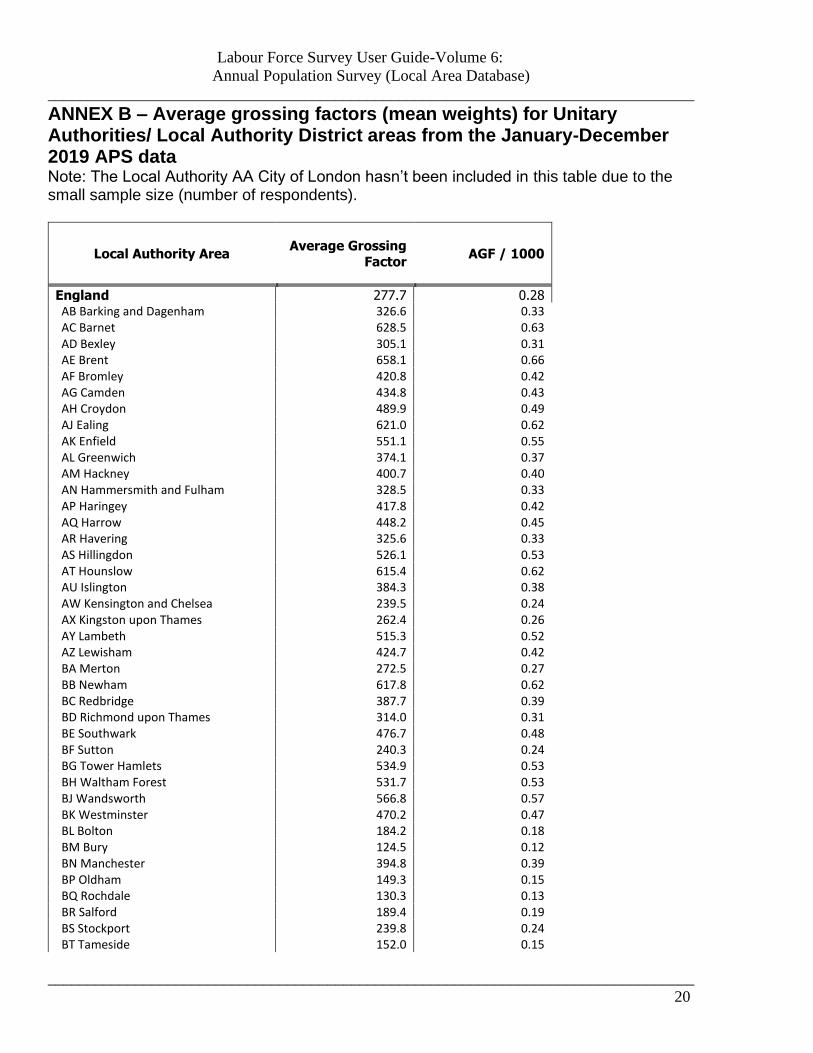
ANNEX B – Average grossing factors (mean weights) for Unitary Authorities/ Local Authority District areas from the January-December 2019 APS data
Note: The Local Authority AA City of London hasn’t been included in this table due to the small sample size (number of respondents).
Local Authority Area Average Grossing
Factor AGF / 1000
England 277.7 0.28 AB Barking and Dagenham 326.6 0.33 AC Barnet 628.5 0.63 AD Bexley 305.1 0.31 AE Brent 658.1 0.66 AF Bromley 420.8 0.42 AG Camden 434.8 0.43 AH Croydon 489.9 0.49 AJ Ealing 621.0 0.62 AK Enfield 551.1 0.55 AL Greenwich 374.1 0.37 AM Hackney 400.7 0.40 AN Hammersmith and Fulham 328.5 0.33 AP Haringey 417.8 0.42 AQ Harrow 448.2 0.45 AR Havering 325.6 0.33 AS Hillingdon 526.1 0.53 AT Hounslow 615.4 0.62 AU Islington 384.3 0.38 AW Kensington and Chelsea 239.5 0.24 AX Kingston upon Thames 262.4 0.26 AY Lambeth 515.3 0.52 AZ Lewisham 424.7 0.42 BA Merton 272.5 0.27 BB Newham 617.8 0.62 BC Redbridge 387.7 0.39 BD Richmond upon Thames 314.0 0.31 BE Southwark 476.7 0.48 BF Sutton 240.3 0.24 BG Tower Hamlets 534.9 0.53 BH Waltham Forest 531.7 0.53 BJ Wandsworth 566.8 0.57 BK Westminster 470.2 0.47 BL Bolton 184.2 0.18 BM Bury 124.5 0.12 BN Manchester 394.8 0.39 BP Oldham 149.3 0.15 BQ Rochdale 130.3 0.13 BR Salford 189.4 0.19 BS Stockport 239.8 0.24 BT Tameside 152.0 0.15

Labour Force Survey User Guide-Volume 6:
Annual Population Survey (Local Area Database)
_________________________________________________________________________________
_________________________________________________________________________________
21
Local Authority Area Average Grossing
Factor AGF / 1000
BU Trafford 166.9 0.17 BW Wigan 239.1 0.24 BX Knowsley 113.0 0.11 BY Liverpool 344.0 0.34 BZ St. Helens 139.4 0.14 CA Sefton 187.7 0.19 CB Wirral 216.5 0.22 CC Barnsley 165.0 0.16 CE Doncaster 227.6 0.23 CF Rotherham 200.0 0.20 CG Sheffield 431.8 0.43 CH Gateshead 155.6 0.16 CJ Newcastle upon Tyne 239.0 0.24 CK North Tyneside 171.4 0.17 CL South Tyneside 99.8 0.10 CM Sunderland 173.5 0.17 CN Birmingham 515.0 0.51 CQ Coventry 236.8 0.24 CR Dudley 228.4 0.23 CS Sandwell 216.6 0.22 CT Solihull 135.8 0.14 CU Walsall 186.0 0.19 CW Wolverhampton 164.3 0.16 CX Bradford 348.0 0.35 CY Calderdale 135.2 0.14 CZ Kirklees 274.7 0.27 DA Leeds 433.1 0.43 DB Wakefield 232.8 0.23 EB Hartlepool 59.3 0.06 EC Middlesbrough 84.1 0.08 EE Redcar and Cleveland 86.2 0.09 EF Stockton-on-Tees 137.3 0.14 EH Darlington 65.7 0.07 ET Halton 98.0 0.10 EU Warrington 158.0 0.16 EX Blackburn with Darwen 80.6 0.08 EY Blackpool 74.9 0.07 FA Kingston upon Hull, City of 228.2 0.23 FB East Riding of Yorkshire 232.1 0.23 FC North East Lincolnshire 99.7 0.10 FD North Lincolnshire 128.6 0.13 FF York 152.7 0.15 FK Derby 172.4 0.17 FN Leicester 315.0 0.32 FP Rutland 73.9 0.07 FY Nottingham 202.1 0.20

Labour Force Survey User Guide-Volume 6:
Annual Population Survey (Local Area Database)
_________________________________________________________________________________
_________________________________________________________________________________
22
Local Authority Area Average Grossing
Factor AGF / 1000
GA Herefordshire, County of 117.1 0.12 GF Telford and Wrekin 118.3 0.12 GL Stoke-on-Trent 167.3 0.17 HA Bath and North East Somerset 124.9 0.12 HB Bristol, City of 292.5 0.29 HC North Somerset 140.7 0.14 HD South Gloucestershire 198.1 0.20 HG Plymouth 187.8 0.19 HH Torbay 84.9 0.08 HN Bournemouth 158.0 0.16 HP Poole 126.6 0.13 HX Swindon 138.5 0.14 JA Peterborough 144.3 0.14 KA Luton 107.5 0.11 KF Southend-on-Sea 96.2 0.10 KG Thurrock 122.1 0.12 LC Medway 258.7 0.26 MA Bracknell Forest 82.2 0.08 MB West Berkshire 129.5 0.13 MC Reading 134.5 0.13 MD Slough 115.7 0.12 ME Windsor and Maidenhead 88.0 0.09 MF Wokingham 110.2 0.11 MG Milton Keynes 190.8 0.19 ML Brighton and Hove 251.4 0.25 MR Portsmouth 154.9 0.15 MS Southampton 166.7 0.17 MW Isle of Wight 83.2 0.08 09UC Mid Bedfordshire 348.1 0.35 09UD Bedford 326.8 0.33 09UE South Bedfordshire 320.2 0.32 11UB Aylesbury Vale 412.8 0.41 11UC Chiltern 304.9 0.30 11UE South Bucks 371.9 0.37 11UF Wycombe 347.1 0.35 12UB Cambridge 452.1 0.45 12UC East Cambridgeshire 449.0 0.45 12UD Fenland 559.6 0.56 12UE Huntingdonshire 433.4 0.43 12UG South Cambridgeshire 438.0 0.44 13UB Chester 497.2 0.50 13UC Congleton 421.3 0.42 13UD Crewe and Nantwich 473.6 0.47 13UE Ellesmere Port and Neston 520.4 0.52 13UG Macclesfield 454.8 0.45 13UH Vale Royal 482.3 0.48

Labour Force Survey User Guide-Volume 6:
Annual Population Survey (Local Area Database)
_________________________________________________________________________________
_________________________________________________________________________________
23
Local Authority Area Average Grossing Factor AGF / 1000
15UB Caradon 383.5 0.38 15UC Carrick 473.9 0.47 15UD Kerrier 439.6 0.44 15UE North Cornwall 289.8 0.29 15UF Penwith 461.2 0.46 15UG Restormel 322.2 0.32 16UB Allerdale 291.5 0.29 16UC Barrow-in-Furness 324.3 0.32 16UD Carlisle 321.9 0.32 16UE Copeland 304.9 0.30 16UF Eden 306.2 0.31 16UG South Lakeland 269.9 0.27 17UB Amber Valley 507.3 0.51 17UC Bolsover 550.3 0.55 17UD Chesterfield 416.9 0.42 17UF Derbyshire Dales 423.7 0.42 17UG Erewash 401.0 0.40 17UH High Peak 451.4 0.45 17UJ North East Derbyshire 498.9 0.50 17UK South Derbyshire 435.7 0.44 18UB East Devon 375.8 0.38 18UC Exeter 474.5 0.47 18UD Mid Devon 418.8 0.42 18UE North Devon 507.7 0.51 18UG South Hams 547.4 0.55 18UH Teignbridge 441.2 0.44 18UK Torridge 524.2 0.52 18UL West Devon 356.9 0.36 19UC Christchurch 373.8 0.37 19UD East Dorset 296.8 0.30 19UE North Dorset 298.5 0.30 19UG Purbeck 348.7 0.35 19UH West Dorset 311.9 0.31 19UJ Weymouth and Portland 305.9 0.31 20UB Chester-le-Street 307.8 0.31 20UD Derwentside 320.2 0.32 20UE Durham 364.7 0.36 20UF Easington 361.2 0.36 20UG Sedgefield 260.2 0.26 20UH Teesdale 258.5 0.26 20UJ Wear Valley 310.9 0.31 21UC Eastbourne 434.9 0.43 21UD Hastings 555.7 0.56 21UF Lewes 405.8 0.41 21UG Rother 427.2 0.43 21UH Wealden 394.0 0.39

Labour Force Survey User Guide-Volume 6:
Annual Population Survey (Local Area Database)
_________________________________________________________________________________
_________________________________________________________________________________
24
Local Authority Area Average Grossing Factor AGF / 1000
22UB Basildon 512.4 0.51 22UC Braintree 513.8 0.51 22UD Brentwood 610.0 0.61 22UE Castle Point 596.8 0.60 22UF Chelmsford 505.5 0.51 22UG Colchester 416.7 0.42 22UH Epping Forest 527.4 0.53 22UJ Harlow 477.0 0.48 22UK Maldon 504.9 0.50 22UL Rochford 517.7 0.52 22UN Tendring 473.6 0.47 22UQ Uttlesford 461.0 0.46 23UB Cheltenham 386.5 0.39 23UC Cotswold 366.3 0.37 23UD Forest of Dean 391.6 0.39 23UE Gloucester 397.5 0.40 23UF Stroud 396.6 0.40 23UG Tewkesbury 354.1 0.35 24UB Basingstoke and Deane 476.8 0.48 24UC East Hampshire 459.1 0.46 24UD Eastleigh 446.3 0.45 24UE Fareham 413.7 0.41 24UF Gosport 489.1 0.49 24UG Hart 437.6 0.44 24UH Havant 517.4 0.52 24UJ New Forest 427.1 0.43 24UL Rushmoor 458.1 0.46 24UN Test Valley 457.4 0.46 24UP Winchester 400.8 0.40 26UB Broxbourne 530.8 0.53 26UC Dacorum 513.4 0.51 26UD East Hertfordshire 444.8 0.44 26UE Hertsmere 792.9 0.79 26UF North Hertfordshire 464.3 0.46 26UG St. Albans 590.2 0.59 26UH Stevenage 457.8 0.46 26UJ Three Rivers 554.9 0.55 26UK Watford 677.1 0.68 26UL Welwyn Hatfield 569.3 0.57 29UB Ashford 560.3 0.56 29UC Canterbury 500.7 0.50 29UD Dartford 633.2 0.63 29UE Dover 465.0 0.46 29UG Gravesham 748.3 0.75 29UH Maidstone 730.3 0.73 29UK Sevenoaks 807.8 0.81

Labour Force Survey User Guide-Volume 6:
Annual Population Survey (Local Area Database)
_________________________________________________________________________________
_________________________________________________________________________________
25
Local Authority Area Average Grossing Factor AGF / 1000
29UL Shepway 520.4 0.52 29UM Swale 483.5 0.48 29UN Thanet 551.2 0.55 29UP Tonbridge and Malling 588.4 0.59 29UQ Tunbridge Wells 587.0 0.59 30UD Burnley 442.1 0.44 30UE Chorley 447.8 0.45 30UF Fylde 451.9 0.45 30UG Hyndburn 435.9 0.44 30UH Lancaster 432.6 0.43 30UJ Pendle 408.0 0.41 30UK Preston 592.3 0.59 30UL Ribble Valley 475.8 0.48 30UM Rossendale 401.1 0.40 30UN South Ribble 430.0 0.43 30UP West Lancashire 444.1 0.44 30UQ Wyre 418.4 0.42 31UB Blaby 448.9 0.45 31UC Charnwood 482.0 0.48 31UD Harborough 401.1 0.40 31UE Hinckley and Bosworth 490.9 0.49 31UG Melton 362.0 0.36 31UH North West Leicestershire 454.8 0.45 31UJ Oadby and Wigston 407.0 0.41 32UB Boston 591.1 0.59 32UC East Lindsey 527.4 0.53 32UD Lincoln 446.9 0.45 32UE North Kesteven 431.3 0.43 32UF South Holland 447.6 0.45 32UG South Kesteven 453.3 0.45 32UH West Lindsey 468.6 0.47 33UB Breckland 490.5 0.49 33UC Broadland 524.6 0.52 33UD Great Yarmouth 557.0 0.56 33UE Kings Lynn and West Norfolk 420.3 0.42 33UF North Norfolk 495.8 0.50 33UG Norwich 465.4 0.47 33UH South Norfolk 435.5 0.44 34UB Corby 518.7 0.52 34UC Daventry 428.0 0.43 34UD East Northamptonshire 486.7 0.49 34UE Kettering 500.5 0.50 34UF Northampton 561.9 0.56 34UG South Northamptonshire 412.7 0.41 34UH Wellingborough 560.8 0.56 35UB Alnwick 199.0 0.20 35UC Berwick-upon-Tweed 200.9 0.20

Labour Force Survey User Guide-Volume 6:
Annual Population Survey (Local Area Database)
_________________________________________________________________________________
_________________________________________________________________________________
26
Local Authority Area Average Grossing
Factor AGF / 1000
35UD Blyth Valley 188.0 0.19 35UE Castle Morpeth 209.8 0.21 35UF Tynedale 214.3 0.21 35UG Wansbeck 187.5 0.19 36UB Craven 444.2 0.44 36UC Hambleton 346.6 0.35 36UD Harrogate 385.8 0.39 36UE Richmondshire 581.3 0.58 36UF Ryedale 364.8 0.36 36UG Scarborough 363.3 0.36 36UH Selby 350.5 0.35 37UB Ashfield 451.6 0.45 37UC Bassetlaw 462.4 0.46 37UD Broxtowe 359.6 0.36 37UE Gedling 442.0 0.44 37UF Mansfield 476.1 0.48 37UG Newark and Sherwood 408.0 0.41 37UJ Rushcliffe 432.9 0.43 38UB Cherwell 464.2 0.46 38UC Oxford 522.5 0.52 38UD South Oxfordshire 410.5 0.41 38UE Vale of White Horse 388.2 0.39 38UF West Oxfordshire 430.9 0.43 39UB Bridgnorth 219.2 0.22 39UC North Shropshire 215.2 0.22 39UD Oswestry 182.4 0.18 39UE Shrewsbury and Atcham 203.9 0.20 39UF South Shropshire 197.1 0.20 40UB Mendip 414.2 0.41 40UC Sedgemoor 343.7 0.34 40UD South Somerset 374.9 0.37 40UE Taunton Deane 336.6 0.34 40UF West Somerset 368.3 0.37 41UB Cannock Chase 583.9 0.58 41UC East Staffordshire 414.8 0.41 41UD Lichfield 451.7 0.45 41UE Newcastle-under-Lyme 560.3 0.56 41UF South Staffordshire 512.3 0.51 41UG Stafford 487.3 0.49 41UH Staffordshire Moorlands 508.9 0.51 41UK Tamworth 439.2 0.44 42UB Babergh 378.2 0.38 42UC Forest Heath 540.0 0.54 42UD Ipswich 436.7 0.44 42UE Mid Suffolk 427.4 0.43 42UF St. Edmundsbury 475.5 0.48 42UG Suffolk Coastal 371.2 0.37

Labour Force Survey User Guide-Volume 6:
Annual Population Survey (Local Area Database)
_________________________________________________________________________________
_________________________________________________________________________________
27
Local Authority Area Average Grossing Factor AGF / 1000
42UH Waveney 486.1 0.49
43UB Elmbridge 466.2 0.47
43UC Epsom and Ewell 488.0 0.49
43UD Guildford 557.2 0.56
43UE Mole Valley 461.9 0.46
43UF Reigate and Banstead 539.7 0.54
43UG Runnymede 589.7 0.59
43UH Spelthorne 427.9 0.43
43UJ Surrey Heath 521.5 0.52
43UK Tandridge 534.6 0.53
43UL Waverley 453.1 0.45
43UM Woking 662.2 0.66
44UB North Warwickshire 417.8 0.42
44UC Nuneaton and Bedworth 396.7 0.40
44UD Rugby 413.9 0.41
44UE Stratford-on-Avon 345.3 0.35
44UF Warwick 341.7 0.34
45UB Adur 618.6 0.62
45UC Arun 600.9 0.60
45UD Chichester 515.7 0.52
45UE Crawley 518.0 0.52
45UF Horsham 476.9 0.48
45UG Mid Sussex 611.6 0.61
45UH Worthing 490.3 0.49
46UB Kennet 411.8 0.41
46UC North Wiltshire 322.8 0.32
46UD Salisbury 321.6 0.32
46UF West Wiltshire 323.2 0.32
47UB Bromsgrove 370.2 0.37
47UC Malvern Hills 377.2 0.38
47UD Redditch 312.9 0.31
47UE Worcester 348.9 0.35
47UF Wychavon 380.1 0.38
47UG Wyre Forest 394.7 0.39

Labour Force Survey User Guide-Volume 6:
Annual Population Survey (Local Area Database)
_________________________________________________________________________________
_________________________________________________________________________________
28
Local Authority Area Average Grossing Factor AGF / 1000
Wales 103.2 0.10 NA Anglesey, Isle of
45.6 0.05 NC Gwynedd 98.6 0.10 NE Conwy 86.0 0.09 NG Denbighshire 65.4 0.07 NJ Flintshire 117.5 0.12 NL Wrexham 105.9 0.11 NN Powys 104.5 0.10 NQ Ceredigion 57.4 0.06 NS Pembrokeshire 78.6 0.08 NU Carmarthenshire 113.0 0.11 NX Swansea 144.1 0.14 NZ Neath Port Talbot
110.4 0.11 PB Bridgend 103.8 0.10 PD Vale of Glamorgan, The 106.5 0.11 PF Rhondda, Cynon, Taff
162.7 0.16 PH Merthyr Tydfil 63.1 0.06 PK Caerphilly 112.4 0.11 PL Blaenau Gwent 66.6 0.07 PM Torfaen 67.4 0.07 PP Monmouthshire 65.9 0.07 PR Newport 99.3 0.10 PT Cardiff 271.5 0.27

Labour Force Survey User Guide-Volume 6:
Annual Population Survey (Local Area Database)
_________________________________________________________________________________
_________________________________________________________________________________
29
Local Authority Area Average Grossing Factor AGF / 1000
Scotland 151.6 0.15 QA Aberdeen City 215.7 0.22 QB Aberdeenshire 252.7 0.25 QC Angus 82.0 0.08 QD Argyll & Bute 58.7 0.06 QE Scottish Borders, The 99.1 0.10 QF Clackmannanshire 68.6 0.07 QG West Dunbartonshire 59.6 0.06 QH Dumfries and Galloway 125.5 0.13 QJ Dundee City 104.2 0.10 QK East Ayrshire 115.2 0.12 QL East Dunbartonshire 64.1 0.06 QM East Lothian 99.2 0.10 QN East Renfrewshire 86.5 0.09 QP Edinburgh, City of 417.1 0.42 QQ Falkirk 133.5 0.13 QR Fife 296.8 0.30 QS Glasgow City 411.1 0.41 QT Highland 249.9 0.25 QU Inverclyde 67.7 0.07 QW Midlothian 90.6 0.09 QX Moray 81.1 0.08 QY North Ayrshire 107.7 0.11 QZ North Lanarkshire 280.5 0.28 RA Orkney Islands 120.8 0.12 RB Perth and Kinross 127.9 0.13 RC Renfrewshire 162.4 0.16 RD Shetland Islands 137.4 0.14 RE South Ayrshire 98.9 0.10 RF South Lanarkshire 296.4 0.30 RG Stirling 72.2 0.07 RH West Lothian 159.1 0.16 RJ Eilean Siar (Western Isles) 39.0 0.04
Northern Ireland 168.1 0.17

Labour Force Survey User Guide-Volume 6:
Annual Population Survey (Local Area Database)
_________________________________________________________________________________
_________________________________________________________________________________
30
ANNEX C – Sampling Variability for employment and ILO unemployment (of persons aged 16+) for Unitary Authorities/Local Authority District areas from the January-December 2019 APS data Note: The Local authority AA City of London hasn’t been included in this table due to the small sample size (number of respondents). Some of the figures may differ slightly from publication due to seasonal adjustment 1 The total estimate and standard error have been divided by 1000.
Sample Size Estimate1
Standard
Error1
Design
Factor Estimate
Standard
Error
Design
Factor
Sample
Size Estimate1
Standard
Error1
Design
Factor Estimate
Standard
Error
Design
Factor
England92,550 27,555 54.7 0.88 61.5 0.1 1.01 3,759 1,130 21.6 1.23 2.5 0.0 1.23
AB Barking and Dagenham 290 98 3.5 0.83 60.9 2.2 0.99 16 6 1.6 1.15 3.8 1.0 1.15
AC Barnet311 202 6.3 0.80 63.8 2.0 0.93 17 12 3.0 1.11 3.8 1.0 1.12
AD Bexley 375 122 3.2 0.73 61.3 1.6 0.84 20 6 1.3 1.00 3.0 0.7 1.00
AE Brent 224 166 5.3 0.71 63.6 2.0 0.83 12 11 3.5 1.34 4.2 1.4 1.34
AF Bromley 400 171 4.0 0.67 65.5 1.5 0.80 8 3 1.1 0.96 1.2 0.4 0.96
AG Camden 280 135 4.6 0.86 62.1 2.1 0.97 17 8 2.0 1.07 3.7 0.9 1.07
AH Croydon 400 198 5.2 0.76 65.7 1.7 0.91 15 7 1.9 1.03 2.4 0.6 1.03
AJ Ealing 233 166 5.5 0.75 64.2 2.1 0.90 11 8 2.3 1.07 3.0 0.9 1.07
AK Enfield 254 151 5.7 0.83 57.4 2.2 0.95 17 12 2.6 1.04 4.5 1.0 1.05
AL Greenwich 378 154 3.5 0.67 67.5 1.5 0.81 18 7 1.7 1.05 3.3 0.8 1.06
AM Hackney 326 150 4.4 0.82 67.7 2.0 1.00 15 7 1.7 1.04 3.1 0.8 1.05
AN Hammersmith and
Fulham 266 98 3.0 0.79 67.8 2.1 0.94 11 4 1.3 1.20 2.6 0.9 1.20
AP Haringey 338 156 4.2 0.78 70.4 1.9 0.96 10 4 1.4 1.03 2.0 0.6 1.03
AQ Harrow 237 113 4.7 0.89 55.7 2.3 0.99 13 6 1.7 1.04 3.0 0.8 1.05
AR Havering378 127 3.4 0.74 60.8 1.6 0.85 18 7 1.6 1.12 3.2 0.8 1.13
AS Hillingdon 264 148 4.8 0.75 63.3 2.1 0.90 14 8 2.0 1.01 3.2 0.9 1.02
AT Hounslow201 136 5.2 0.80 63.0 2.4 0.94 8 5 1.8 1.01 2.4 0.8 1.01
AU Islington 322 142 4.1 0.86 69.3 2.0 0.99 15 6 1.7 1.09 3.0 0.8 1.10
AW Kensington and Chelsea262 72 3.0 1.00 57.3 2.4 1.11 16 4 1.1 1.07 3.3 0.8 1.08
AX Kingston upon Thames325 96 2.7 0.79 67.0 1.9 0.94 10 3 0.9 1.05 2.0 0.6 1.05
AY Lambeth359 194 5.0 0.77 72.0 1.8 0.93 25 12 2.5 1.00 4.6 0.9 1.01
AZ Lewisham 381 174 3.9 0.69 71.8 1.6 0.86 18 9 2.0 1.05 3.6 0.8 1.05
BA Merton 391 114 2.6 0.69 68.8 1.6 0.83 18 5 1.5 1.26 3.2 0.9 1.27
BB Newham 271 182 5.3 0.72 65.8 1.9 0.86 13 9 2.6 1.09 3.4 0.9 1.09
BC Redbridge362 149 4.2 0.77 62.4 1.8 0.91 13 6 1.6 1.07 2.5 0.7 1.08
BD Richmond upon Thames 328 109 2.7 0.68 70.0 1.7 0.84 3 1 0.7 1.12 0.7 0.4 1.12
BE Southwark 364 185 4.3 0.71 71.8 1.7 0.87 16 8 1.9 0.99 3.1 0.7 1.00
BF Sutton 421 107 2.5 0.72 66.6 1.6 0.87 24 7 1.4 1.12 4.1 0.9 1.13
BG Tower Hamlets 282 171 5.8 0.88 66.9 2.3 1.05 13 7 2.3 1.18 2.8 0.9 1.18
BH Waltham Forest 270 145 4.9 0.80 67.9 2.3 0.99 16 10 2.8 1.22 4.7 1.3 1.23
BJ Wandsworth 328 199 4.6 0.69 73.6 1.7 0.84 15 9 2.4 1.07 3.4 0.9 1.07
BK Westminster 252 127 4.6 0.86 62.4 2.2 0.96 12 6 1.9 1.09 3.2 0.9 1.09
BL Bolton622 126 3.0 0.82 56.4 1.3 0.93 45 10 1.6 1.21 4.4 0.7 1.21
BM Bury 673 88 1.8 0.74 58.7 1.2 0.84 29 4 0.8 1.07 2.7 0.5 1.07
BN Manchester 608 262 6.3 0.85 60.5 1.5 0.99 39 17 2.8 1.09 4.0 0.7 1.10
BP Oldham
649 105 2.6 0.87 57.1 1.4 0.99 20 4 0.9 1.26 2.1 0.5 1.27
BQ Rochdale 683 96 2.2 0.83 57.7 1.3 0.95 43 6 1.0 1.12 3.9 0.6 1.12
BR Salford658 129 2.7 0.77 63.8 1.3 0.89 34 7 1.2 1.05 3.4 0.6 1.05
BS Stockport 554 143 3.3 0.78 59.8 1.4 0.88 23 7 1.5 1.15 2.9 0.6 1.15
BT Tameside 671 108 2.3 0.78 59.9 1.3 0.88 28 5 0.9 1.12 2.5 0.5 1.12
Employment ILO Unemployment
Total Rate Total Rate

Labour Force Survey User Guide-Volume 6:
Annual Population Survey (Local Area Database)
_________________________________________________________________________________
_________________________________________________________________________________
31
Sample
Size Estimate1
Standard
Error1
Design
Factor Estimate
Standard
Error
Design
Factor
Sample
Size Estimate1
Standard
Error1
Design
Factor Estimate
Standard
Error
Design
Factor
BU Trafford 669 118 2.3 0.74 63.3 1.2 0.86 30 6 1.1 1.17 3.1 0.6 1.18
BW Wigan 636 160 3.3 0.75 62.0 1.3 0.86 17 5 1.1 1.05 1.8 0.4 1.05
BX Knowsley 591 72 1.6 0.76 60.2 1.3 0.87 16 2 0.5 1.11 1.8 0.5 1.11
BY Liverpool 590 230 5.8 0.89 56.2 1.4 0.98 29 11 2.1 1.09 2.7 0.5 1.09
BZ St. Helens 564 84 1.9 0.76 57.7 1.3 0.85 32 5 0.9 1.12 3.4 0.6 1.12
CA Sefton 650 130 2.6 0.74 57.5 1.2 0.82 17 3 0.9 1.14 1.5 0.4 1.14
CB Wirral 668 152 3.2 0.76 60.6 1.3 0.88 33 8 1.3 1.04 3.0 0.5 1.05
CC Barnsley 666 116 2.5 0.79 58.1 1.2 0.88 31 6 1.0 1.09 2.8 0.5 1.09
CE Doncaster 574 139 3.6 0.88 55.8 1.5 0.97 36 11 1.9 1.23 4.3 0.8 1.24
CF Rotherham 550 117 3.2 0.89 54.8 1.5 0.98 30 7 1.7 1.40 3.4 0.8 1.40
CG Sheffield 613 289 6.3 0.80 62.2 1.4 0.92 26 13 2.5 1.07 2.8 0.5 1.08
CH Gateshead 572 95 2.3 0.81 57.8 1.4 0.90 33 6 1.0 1.09 3.4 0.6 1.09
CJ Newcastle upon Tyne 530 138 3.7 0.88 56.6 1.5 0.98 24 7 1.5 1.15 3.0 0.6 1.15
CK North Tyneside 548 101 2.0 0.67 59.3 1.2 0.74 15 3 0.9 1.20 1.8 0.5 1.20
CL South Tyneside 572 63 1.6 0.85 53.7 1.4 0.94 46 6 0.8 1.12 4.7 0.7 1.12
CM Sunderland 661 124 3.0 0.88 54.8 1.3 0.97 43 9 1.4 1.14 4.1 0.6 1.14
CN Birmingham 932 490 10.6 0.88 57.0 1.2 1.02 83 46 5.0 1.05 5.3 0.6 1.06
CQ Coventry 714 184 4.0 0.85 61.1 1.3 0.96 38 10 1.6 1.04 3.4 0.5 1.05
CR Dudley 563 143 3.5 0.82 56.5 1.4 0.92 28 7 1.4 1.08 2.8 0.5 1.08
CS Sandwell 646 147 3.4 0.80 57.4 1.3 0.92 34 8 1.4 1.07 3.2 0.5 1.07
CT Solihull 705 102 2.0 0.75 58.8 1.2 0.84 26 4 0.8 1.06 2.3 0.5 1.06
CU Walsall 628 124 3.0 0.84 56.4 1.4 0.95 44 9 1.4 1.09 4.0 0.6 1.10
CW Wolverhampton 608 113 2.9 0.91 53.1 1.4 0.99 42 8 1.3 1.11 3.9 0.6 1.12
CX Bradford 603 223 5.6 0.84 54.6 1.4 0.95 40 16 2.7 1.16 3.9 0.7 1.17
CY Calderdale 701 98 2.1 0.81 56.5 1.2 0.89 20 3 0.7 1.08 1.8 0.4 1.08
CZ Kirklees 703 202 4.2 0.77 58.8 1.2 0.88 19 6 1.3 1.08 1.6 0.4 1.08
DA Leeds 905 398 7.6 0.82 63.4 1.2 0.95 38 17 2.8 1.05 2.7 0.4 1.05
DB Wakefield 660 161 3.4 0.76 58.4 1.2 0.86 35 9 1.5 1.07 3.3 0.6 1.08
EB Hartlepool 592 39 1.0 0.89 52.3 1.4 0.98 47 3 0.5 1.09 4.3 0.6 1.09
EC Middlesbrough 616 57 1.5 0.91 52.1 1.4 1.02 46 5 0.7 1.12 4.1 0.6 1.13
EE Redcar and Cleveland 594 56 1.4 0.84 50.7 1.3 0.92 31 3 0.6 1.19 2.9 0.6 1.20
EF Stockton-on-Tees 587 89 2.2 0.85 57.6 1.4 0.96 36 6 0.9 1.08 3.6 0.6 1.08
EH Darlington 699 49 1.0 0.75 55.9 1.1 0.83 48 3 0.5 1.04 3.8 0.5 1.04
ET Halton 600 63 1.3 0.76 61.3 1.3 0.87 17 2 0.4 1.06 1.8 0.4 1.06
EU Warrington 620 107 2.0 0.71 63.3 1.2 0.81 16 3 0.8 1.11 1.8 0.5 1.11
EX Blackburn with Darwen 761 64 1.4 0.80 53.9 1.2 0.89 40 4 0.6 1.13 3.0 0.5 1.13
EY Blackpool 777 62 1.3 0.84 54.2 1.2 0.91 44 4 0.6 1.07 3.3 0.5 1.08
FA Kingston upon Hull, City
of 505 123 3.4 0.87 59.3 1.6 0.99 40 10 1.7 1.16 5.0 0.8 1.16
FB East Riding of Yorkshire 638 160 3.2 0.72 58.5 1.2 0.80 21 6 1.3 1.10 2.1 0.5 1.10
FC North East Lincolnshire 638 70 1.7 0.87 55.3 1.4 0.98 34 4 0.8 1.21 3.2 0.6 1.22
FD North Lincolnshire 550 77 2.0 0.86 54.4 1.4 0.94 24 4 0.8 1.13 2.6 0.5 1.14
FF York 668 110 2.3 0.81 61.7 1.3 0.90 16 3 0.7 1.09 1.6 0.4 1.09
FK Derby 682 123 2.6 0.77 59.2 1.2 0.87 28 5 1.0 1.06 2.6 0.5 1.06
FN Leicester 514 171 4.7 0.89 61.0 1.7 1.03 28 9 1.8 1.11 3.2 0.7 1.11
FP Rutland 215 17 0.6 0.74 52.5 1.9 0.80 6 - 0.2 1.00 1.3 0.5 1.00
FY Nottingham 677 148 3.7 0.91 54.1 1.4 1.00 55 13 1.8 1.11 4.7 0.6 1.12
ILO Unemployment
Total Rate
Employment
Total Rate

Labour Force Survey User Guide-Volume 6:
Annual Population Survey (Local Area Database)
_________________________________________________________________________________
_________________________________________________________________________________
32
Sample
Size Estimate1
Standard
Error1
Design
Factor Estimate
Standard
Error
Design
Factor
Sample
Size Estimate1
Standard
Error1
Design
Factor Estimate
Standard
Error
Design
Factor
GA Herefordshire, County of 748 98 1.7 0.71 59.8 1.0 0.78 14 2 0.7 1.42 1.4 0.5 1.42
GF Telford and Wrekin 686 88 1.8 0.77 61.3 1.2 0.88 30 4 0.7 1.03 2.8 0.5 1.03
GL Stoke-on-Trent 675 119 2.6 0.81 56.9 1.3 0.90 29 5 1.0 1.04 2.5 0.5 1.05
HA Bath and North East
Somerset 717 98 2.1 0.85 62.5 1.3 0.96 23 3 0.7 1.13 2.2 0.5 1.14
HB Bristol, City of 802 252 5.1 0.88 66.6 1.4 1.03 34 12 2.0 1.10 3.1 0.5 1.10
HC North Somerset 720 104 1.9 0.69 61.3 1.1 0.80 20 4 0.9 1.22 2.4 0.5 1.23
HD South Gloucestershire 693 148 2.5 0.68 63.9 1.1 0.78 17 4 1.0 1.17 1.7 0.4 1.18
HG Plymouth 633 127 2.8 0.81 57.6 1.3 0.89 25 6 1.2 1.13 2.7 0.5 1.14
HH Torbay 620 61 1.4 0.83 52.0 1.2 0.88 22 2 0.5 1.13 2.1 0.4 1.13
HN Bournemouth 638 109 2.4 0.85 64.6 1.4 0.95 12 2 0.7 1.13 1.3 0.4 1.14
HP Poole 531 74 1.5 0.69 58.5 1.2 0.77 16 2 0.6 1.04 1.8 0.4 1.05
HX Swindon 813 115 1.9 0.69 66.5 1.1 0.83 27 4 0.8 1.07 2.4 0.5 1.07
JA Peterborough 623 95 2.2 0.82 60.0 1.4 0.94 37 6 1.0 1.05 3.9 0.6 1.05
KA Luton 853 100 2.0 0.81 59.2 1.2 0.94 44 5 0.8 1.02 3.0 0.4 1.03
KF Southend-on-Sea 854 90 1.6 0.78 60.6 1.1 0.89 31 4 0.7 1.14 2.4 0.4 1.14
KG Thurrock 653 86 1.6 0.71 63.0 1.2 0.83 37 5 0.8 1.05 3.6 0.6 1.06
LC Medway 494 142 3.0 0.70 59.1 1.2 0.77 18 5 1.2 1.03 2.1 0.5 1.03
MA Bracknell Forest 750 66 1.0 0.62 70.1 1.0 0.76 17 2 0.4 1.12 1.8 0.4 1.12
MB West Berkshire 626 85 1.5 0.67 67.5 1.2 0.80 15 2 0.6 1.04 1.8 0.4 1.04
MC Reading 628 90 1.8 0.75 68.9 1.3 0.90 23 3 0.7 1.02 2.4 0.5 1.03
MD Slough 618 73 1.6 0.77 66.0 1.5 0.95 26 3 0.7 1.09 2.9 0.6 1.09
ME Windsor and
Maidenhead 854 78 1.2 0.69 66.2 1.1 0.82 20 2 0.4 1.09 1.6 0.4 1.09
MF Wokingham 717 83 1.4 0.66 64.5 1.1 0.78 14 2 0.5 1.11 1.2 0.4 1.11
MG Milton Keynes 694 137 2.5 0.70 63.5 1.2 0.82 32 7 1.2 1.09 3.2 0.6 1.09
ML Brighton and Hove 589 162 3.5 0.83 64.8 1.4 0.93 22 6 1.2 1.05 2.3 0.5 1.05
MR Portsmouth 573 104 2.4 0.83 57.1 1.3 0.91 21 4 0.9 1.10 2.4 0.5 1.10
MS Southampton 752 134 3.0 0.93 63.2 1.4 1.05 35 8 1.6 1.46 3.7 0.8 1.47
MW Isle of Wight 655 60 1.3 0.80 50.2 1.1 0.85 21 2 0.4 1.08 1.7 0.4 1.08
09UC Mid Bedfordshire 213 80 2.4 0.66 67.0 2.0 0.79 * * * * * * *
09UD Bedford 265 87 2.6 0.70 64.5 2.0 0.83 9 3 1.0 1.05 2.1 0.8 1.06
09UE South Bedfordshire 213 71 2.2 0.67 64.9 2.0 0.79 3 1 0.6 0.99 0.9 0.5 0.99
11UB Aylesbury Vale 242 104 3.1 0.67 64.9 1.9 0.79 9 4 1.2 1.00 2.3 0.8 1.00
11UC Chiltern 154 46 2.1 0.77 61.5 2.8 0.89 3 1 0.7 1.16 1.5 0.9 1.16
11UE South Bucks 93 33 1.9 0.73 63.7 3.7 0.90 * * * * * * *
11UF Wycombe 254 91 2.6 0.66 65.4 1.9 0.79 13 5 1.6 1.19 3.5 1.1 1.20
12UB Cambridge 147 71 2.7 0.74 72.8 2.8 0.90 3 1 0.6 0.94 1.0 0.7 0.95
12UC East Cambridgeshire 113 46 1.7 0.53 69.0 2.6 0.68 * * * * * * *
12UD Fenland 73 46 3.3 0.87 53.1 3.8 0.93 3 2 1.3 1.15 2.5 1.5 1.16
12UE Huntingdonshire 209 89 3.2 0.72 62.2 2.3 0.83 6 3 1.4 1.14 2.3 1.0 1.15
12UG South Cambridgeshire 184 83 2.6 0.61 65.7 2.1 0.74 3 2 1.2 1.22 1.6 0.9 1.22
13UB Chester 131 64 2.9 0.72 58.4 2.7 0.80 * * * * * * *
13UC Congleton 116 46 2.4 0.77 63.1 3.3 0.90 8 3 1.1 0.98 4.5 1.6 0.98
13UD Crewe and Nantwich 124 64 2.6 0.66 64.9 2.6 0.79 * * * * * * *
13UE Ellesmere Port and
Neston 69 38 2.3 0.71 59.4 3.7 0.82 * * * * * * *
13UG Macclesfield 182 78 2.8 0.66 60.3 2.2 0.77 12 5 1.5 0.97 4.1 1.1 0.97
13UH Vale Royal 111 60 3.1 0.77 57.3 2.9 0.86 4 2 1.3 1.24 2.2 1.3 1.25
Employment ILO Unemployment
Total Rate Total Rate

Labour Force Survey User Guide-Volume 6:
Annual Population Survey (Local Area Database)
_________________________________________________________________________________
_________________________________________________________________________________
33
Sample
Size Estimate1
Standard
Error1
Design
Factor Estimate
Standard
Error
Design
Factor
Sample
Size Estimate1
Standard
Error1
Design
Factor Estimate
Standard
Error
Design
Factor
15UB Caradon 103 40 1.9 0.64 52.4 2.5 0.69 3 1 0.7 1.00 1.6 0.9 1.01
15UC Carrick 87 46 2.7 0.79 53.4 3.2 0.85 5 3 1.3 1.07 3.4 1.5 1.08
15UD Kerrier 95 48 2.4 0.70 54.3 2.7 0.77 * * * * * * *
15UE North Cornwall 142 43 2.0 0.78 58.5 2.8 0.89 4 1 0.7 1.15 1.8 1.0 1.15
15UF Penwith 63 31 2.4 0.86 51.3 4.0 0.91 4 2 0.9 0.99 3.0 1.5 0.99
15UG Restormel 173 55 2.2 0.73 65.6 2.6 0.88 4 1 0.6 1.02 1.5 0.8 1.02
16UB Allerdale 162 48 1.6 0.62 60.8 2.1 0.70 6 2 0.7 0.96 2.1 0.8 0.96
16UC Barrow-in-Furness 84 26 2.1 0.93 46.8 3.9 0.99 3 1 0.5 0.95 1.7 0.9 0.95
16UD Carlisle 153 54 2.0 0.66 59.0 2.2 0.74 3 1 0.6 0.94 1.2 0.6 0.94
16UE Copeland 95 30 1.9 0.82 53.4 3.3 0.89 4 1 0.6 1.03 2.2 1.1 1.03
16UF Eden 99 30 1.5 0.75 69.7 3.4 0.87 * * * * * * *
16UG South Lakeland 194 50 1.6 0.63 61.7 2.0 0.73 4 1 0.5 0.94 1.2 0.6 0.94
17UB Amber Valley 142 71 3.0 0.75 63.7 2.7 0.82 4 2 0.9 0.94 1.7 0.8 0.94
17UC Bolsover 64 37 2.5 0.74 55.8 3.8 0.83 * * * * * * *
17UD Chesterfield 105 45 2.7 0.81 54.3 3.3 0.91 8 4 1.3 1.05 4.5 1.6 1.06
17UF Derbyshire Dales 92 37 2.2 0.80 65.5 3.7 0.89 * * * * * * *
17UG Erewash 151 60 2.2 0.64 66.3 2.5 0.78 * * * * * * *
17UH High Peak 95 44 2.6 0.81 60.7 3.6 0.93 * * * * * * *
17UJ North East Derbyshire 92 48 2.7 0.74 55.2 3.1 0.82 3 1 1.0 1.17 1.6 1.1 1.17
17UK South Derbyshire 131 57 2.0 0.60 74.9 2.6 0.79 3 1 0.7 0.99 1.7 1.0 0.99
18UB East Devon 179 66 2.7 0.73 59.5 2.4 0.84 * * * * * * *
18UC Exeter 155 72 3.6 0.93 69.2 3.5 1.11 3 2 1.5 1.60 1.7 1.4 1.61
18UD Mid Devon 109 43 1.8 0.63 68.4 3.0 0.79 6 3 1.3 1.22 4.3 2.0 1.22
18UE North Devon 83 48 2.5 0.72 61.3 3.2 0.81 * * * * * * *
18UG South Hams 69 40 2.8 0.82 56.6 4.0 0.91 * * * * * * *
18UH Teignbridge 152 62 3.1 0.81 61.4 3.0 0.94 6 3 1.1 1.01 2.9 1.1 1.01
18UK Torridge 75 38 2.0 0.67 64.5 3.4 0.76 * * * * * * *
18UL West Devon 66 25 1.6 0.74 59.5 3.9 0.85 * * * * * * *
19UC Christchurch 62 26 1.7 0.80 58.9 4.0 0.87 * * * * * * *
19UD East Dorset 118 37 2.0 0.77 51.7 2.7 0.85 3 1 0.6 1.23 1.1 0.8 1.24
19UE North Dorset 103 31 1.9 0.83 58.1 3.6 0.95 3 1 0.5 1.00 1.7 1.0 1.00
19UG Purbeck 54 22 1.7 0.83 56.5 4.2 0.89 3 1 0.6 1.04 2.7 1.6 1.04
19UH West Dorset 134 43 2.2 0.80 52.2 2.7 0.87 3 1 0.5 0.97 1.1 0.6 0.97
19UJ Weymouth and Portland 94 29 1.6 0.70 59.1 3.1 0.81 3 1 0.6 1.03 1.9 1.1 1.03
20UB Chester-le-Street 84 25 1.6 0.75 55.2 3.4 0.83 4 1 0.6 1.04 2.7 1.4 1.04
20UD Derwentside 134 46 2.2 0.79 60.9 2.9 0.91 7 3 0.9 0.98 3.5 1.2 0.99
20UE Durham 128 49 2.5 0.85 59.0 3.1 0.93 9 3 1.2 1.06 4.0 1.4 1.07
20UF Easington 110 39 2.5 0.87 54.0 3.5 0.98 8 3 1.0 0.95 4.0 1.3 0.96
20UG Sedgefield 158 43 1.7 0.72 59.7 2.4 0.82 6 2 0.6 1.00 2.2 0.9 1.01
20UH Teesdale 43 12 0.8 0.63 56.0 3.8 0.69 3 1 0.6 1.35 4.1 3.0 1.35
20UJ Wear Valley 90 28 2.1 0.91 53.4 4.0 1.02 5 2 0.8 1.18 3.2 1.6 1.18
21UC Eastbourne 93 46 2.6 0.77 55.9 3.2 0.87 4 2 0.8 0.94 2.2 1.0 0.94
21UD Hastings 77 49 2.7 0.73 62.9 3.4 0.83 * * * * * * *
21UF Lewes 119 48 2.5 0.76 55.8 2.8 0.83 4 2 0.9 1.04 2.2 1.0 1.04
21UG Rother 104 47 2.2 0.68 58.9 2.7 0.75 3 1 0.6 0.83 1.7 0.8 0.84
21UH Wealden 182 75 2.5 0.63 60.4 2.1 0.74 6 3 1.1 1.07 2.1 0.9 1.07
Employment ILO Unemployment
Total Rate Total Rate

Labour Force Survey User Guide-Volume 6:
Annual Population Survey (Local Area Database)
_________________________________________________________________________________
_________________________________________________________________________________
34
Sample
Size Estimate1
Standard
Error1
Design
Factor Estimate
Standard
Error
Design
Factor
Sample
Size Estimate1
Standard
Error1
Design
Factor Estimate
Standard
Error
Design
Factor
22UB Basildon 187 91 3.2 0.65 64.1 2.3 0.79 7 3 1.2 0.92 2.2 0.8 0.92
22UC Braintree 146 76 3.6 0.80 62.9 3.0 0.93 6 3 1.3 1.01 2.8 1.1 1.02
22UD Brentwood 67 41 2.3 0.67 60.3 3.4 0.73 * * * * * * *
22UE Castle Point 77 46 2.4 0.65 60.3 3.2 0.75 * * * * * * *
22UF Chelmsford 173 94 3.9 0.82 62.7 2.6 0.92 * * * * * * *
22UG Colchester 215 93 4.0 0.89 61.4 2.7 1.03 8 3 1.2 0.98 2.2 0.8 0.98
22UH Epping Forest 125 65 2.8 0.66 63.3 2.7 0.78 4 2 1.0 0.97 1.9 1.0 0.97
22UJ Harlow 87 39 2.5 0.76 60.6 3.9 0.91 7 3 1.0 0.91 4.4 1.6 0.91
22UK Maldon 65 33 2.1 0.71 66.4 4.2 0.87 * * * * * * *
22UL Rochford 92 47 2.6 0.76 66.5 3.6 0.89 * * * * * * *
22UN Tendring 123 58 3.5 0.85 47.2 2.9 0.92 6 3 1.1 0.96 2.2 0.9 0.96
22UQ Uttlesford 94 47 2.2 0.67 67.1 3.2 0.81 * * * * * * *
23UB Cheltenham 151 64 2.2 0.67 68.3 2.4 0.80 6 2 1.3 1.31 2.6 1.4 1.31
23UC Cotswold 113 44 2.3 0.81 60.1 3.1 0.90 * * * * * * *
23UD Forest of Dean 101 42 1.9 0.63 60.7 2.7 0.72 5 2 1.0 1.03 3.2 1.4 1.04
23UE Gloucester 177 70 2.5 0.69 69.1 2.5 0.85 7 3 1.2 1.05 3.1 1.1 1.05
23UF Stroud 149 64 2.3 0.67 62.4 2.3 0.75 * * * * * * *
23UG Tewkesbury 131 44 1.9 0.65 60.8 2.6 0.75 4 2 0.9 1.23 2.1 1.3 1.23
24UB Basingstoke and Deane 198 96 3.0 0.66 67.9 2.2 0.80 5 2 1.0 0.99 1.6 0.7 0.99
24UC East Hampshire 133 60 2.3 0.61 64.4 2.5 0.75 * * * * * * *
24UD Eastleigh 137 64 2.6 0.66 63.0 2.5 0.78 6 3 1.2 1.05 2.9 1.2 1.06
24UE Fareham 147 59 2.1 0.60 64.0 2.3 0.71 3 1 0.7 0.97 1.3 0.8 0.98
24UF Gosport 82 42 2.6 0.80 57.9 3.6 0.89 7 4 1.3 1.02 5.1 1.9 1.02
24UG Hart 110 49 2.0 0.60 72.8 2.9 0.80 3 1 0.7 0.93 1.7 1.0 0.93
24UH Havant 102 59 3.7 0.92 55.0 3.5 1.00 * * * * * * *
24UJ New Forest 205 88 3.0 0.69 62.7 2.2 0.81 * * * * * * *
24UL Rushmoor 120 55 2.5 0.77 72.5 3.3 0.95 * * * * * * *
24UN Test Valley 137 62 3.4 0.88 60.9 3.3 1.00 4 2 1.2 1.15 2.4 1.2 1.15
24UP Winchester 134 56 2.8 0.79 58.0 2.9 0.90 6 2 0.9 0.96 2.4 1.0 0.97
26UB Broxbourne 79 50 2.7 0.75 63.1 3.5 0.87 4 3 1.2 1.06 3.3 1.6 1.06
26UC Dacorum 154 80 3.4 0.76 69.8 2.9 0.94 4 2 1.2 1.07 2.0 1.0 1.07
26UD East Hertfordshire 160 72 3.2 0.78 61.5 2.7 0.90 3 1 0.8 1.08 1.2 0.7 1.08
26UE Hertsmere 64 54 3.0 0.65 64.0 3.6 0.76 * * * * * * *
26UF North Hertfordshire 161 71 2.7 0.67 66.9 2.5 0.80 6 3 1.2 1.02 3.1 1.2 1.02
26UG St. Albans 115 72 3.6 0.78 59.4 3.0 0.88 7 5 1.8 1.07 4.2 1.5 1.08
26UH Stevenage 100 47 2.2 0.67 70.5 3.3 0.86 3 1 0.8 0.99 2.1 1.2 0.99
26UJ Three Rivers 84 47 2.4 0.66 60.6 3.1 0.75 5 4 1.8 1.28 4.9 2.3 1.28
26UK Watford 77 55 2.3 0.57 70.8 3.0 0.70 * * * * * * *
26UL Welwyn Hatfield 123 68 2.4 0.57 68.0 2.4 0.68 3 2 0.9 0.95 1.7 0.9 0.95
29UB Ashford 114 67 3.6 0.84 62.0 3.4 0.97 6 4 1.6 1.12 3.6 1.5 1.13
29UC Canterbury 139 74 4.5 0.99 54.8 3.4 1.10 3 2 1.0 1.11 1.3 0.8 1.11
29UD Dartford 95 63 2.7 0.66 77.5 3.4 0.92 * * * * * * *
29UE Dover 115 51 2.9 0.79 58.3 3.3 0.91 9 5 1.8 1.22 5.5 2.1 1.23
29UG Gravesham 78 53 2.7 0.60 63.1 3.4 0.74 5 4 1.6 0.98 4.5 1.9 0.99
29UH Maidstone 112 88 4.0 0.72 62.4 2.9 0.83 * * * * * * *
29UK Sevenoaks 75 59 3.8 0.76 62.2 4.0 0.89 3 3 1.6 1.07 3.0 1.7 1.07
Employment ILO Unemployment
Total Rate Total Rate

Labour Force Survey User Guide-Volume 6:
Annual Population Survey (Local Area Database)
_________________________________________________________________________________
_________________________________________________________________________________
35
Sample
Size Estimate1
Standard
Error1
Design
Factor Estimate
Standard
Error
Design
Factor
Sample
Size Estimate1
Standard
Error1
Design
Factor Estimate
Standard
Error
Design
Factor
29UL Shepway 99 55 3 0.77 59.6 3.2 0.86 * * * * * * *
29UM Swale 146 65 3.4 0.81 61.5 3.3 0.98 7 3 1.0 0.79 3.0 0.9 0.79
29UN Thanet 94 61 3.5 0.78 51.1 3.0 0.87 3 2 1.3 1.14 1.9 1.1 1.14
29UP Tonbridge and Malling 121 72 3.1 0.71 72.4 3.2 0.91 6 3 1.4 0.99 3.4 1.4 0.99
29UQ Tunbridge Wells 99 58 2.9 0.70 68.1 3.5 0.89 3 2 0.9 0.94 1.9 1.1 0.94
30UD Burnley 87 38 2.5 0.81 56.7 3.8 0.93 5 2 1.0 0.99 3.4 1.5 1.00
30UE Chorley 119 56 2.5 0.70 61.3 2.8 0.81 * * * * * * *
30UF Fylde 85 42 2.5 0.83 61.9 3.7 0.92 * * * * * * *
30UG Hyndburn 90 41 2.2 0.73 62.7 3.3 0.83 * * * * * * *
30UH Lancaster 137 63 4.4 1.12 53.0 3.7 1.22 6 3 1.3 1.15 2.5 1.1 1.15
30UJ Pendle 95 38 2.4 0.79 57.2 3.6 0.92 4 2 1.1 1.08 3.7 1.6 1.08
30UK Preston 112 72 3.3 0.73 66.8 3.1 0.89 3 2 1.2 1.09 1.9 1.1 1.09
30UL Ribble Valley 64 31 1.9 0.72 64.5 3.9 0.83 * * * * * * *
30UM Rossendale 96 35 2.1 0.78 64.3 3.8 0.93 3 1 0.7 1.14 1.9 1.3 1.14
30UN South Ribble 130 59 1.8 0.53 66.7 2.1 0.64 * * * * * * *
30UP West Lancashire 104 50 3 0.85 55.5 3.3 0.94 3 2 0.9 1.09 1.8 1.0 1.09
30UQ Wyre 121 52 2.5 0.74 58.1 2.8 0.82 * * * * * * *
31UB Blaby 115 51 2.5 0.75 65.5 3.3 0.90 * * * * * * *
31UC Charnwood 196 96 3.4 0.74 65.0 2.3 0.85 7 3 1.4 1.12 2.3 1.0 1.12
31UD Harborough 112 49 2.1 0.70 68.0 3.0 0.84 3 1 0.8 1.10 1.8 1.1 1.10
31UE Hinckley and Bosworth 117 61 2.3 0.62 68.1 2.6 0.74 4 2 1.1 0.99 2.5 1.2 1.00
31UG Melton 73 25 1.6 0.72 58.9 3.7 0.81 * * * * * * *
31UH North West
Leicestershire 105 48 3.8 1.12 59.8 4.7 1.26 6 3 1.1 0.97 3.7 1.4 0.98
31UJ Oadby and Wigston 62 26 1.8 0.77 59.1 4.1 0.87 3 1 0.6 0.89 2.6 1.4 0.89
32UB Boston 53 32 2.4 0.76 59.8 4.6 0.88 3 2 1.1 1.05 3.6 2.1 1.06
32UC East Lindsey 109 56 3.5 0.83 48.6 3.1 0.89 6 3 1.2 0.96 2.6 1.0 0.96
32UD Lincoln 110 48 2.4 0.73 61.7 3.1 0.84 7 3 1.3 1.15 4.0 1.7 1.16
32UE North Kesteven 132 56 2.7 0.77 59.3 2.9 0.87 3 1 0.7 0.99 1.4 0.8 0.99
32UF South Holland 93 44 2.1 0.65 55.1 2.8 0.73 3 1 0.7 0.90 1.5 0.8 0.90
32UG South Kesteven 138 70 2.8 0.70 60.9 2.5 0.80 3 1 0.8 1.01 1.2 0.7 1.01
32UH West Lindsey 85 46 2.6 0.76 59.8 3.4 0.87 * * * * * * *
33UB Breckland 136 66 3.1 0.76 58.5 2.8 0.86 4 2 0.9 0.97 1.7 0.8 0.97
33UC Broadland 135 70 2.8 0.68 63.2 2.5 0.75 4 2 1.6 1.49 1.9 1.4 1.50
33UD Great Yarmouth 73 43 2.9 0.80 54.3 3.7 0.89 3 2 1.0 0.99 2.1 1.2 0.9933UE Kings Lynn and West
Norfolk 172 72 2.5 0.61 59.0 2.1 0.71 5 2 0.9 0.97 1.8 0.8 0.97
33UF North Norfolk 85 43 2.8 0.79 50.2 3.3 0.86 4 2 1.1 1.05 2.5 1.2 1.06
33UG Norwich 139 71 3.8 0.93 62.6 3.3 1.07 11 6 1.8 1.11 4.9 1.5 1.12
33UH South Norfolk 163 71 2.9 0.75 62.0 2.6 0.85 3 2 1.0 1.13 1.7 0.9 1.13
34UB Corby 80 39 2 0.65 74.6 3.7 0.86 * * * * * * *
34UC Daventry 98 44 1.5 0.52 66.7 2.4 0.62 * * * * * * *
34UD East Northamptonshire 97 49 1.8 0.55 65.7 2.5 0.65 * * * * * * *
34UE Kettering 98 50 2.9 0.81 63.2 3.7 0.95 3 2 0.9 1.03 2.1 1.2 1.03
34UF Northampton 213 119 4 0.70 66.2 2.2 0.84 11 6 1.8 0.97 3.4 1.0 0.98
34UG South Northamptonshire 106 45 1.8 0.59 61.7 2.6 0.70 3 1 0.6 0.92 1.5 0.8 0.92
34UH Wellingborough 71 40 2.7 0.81 59.1 3.9 0.87 * * * * * * *
35UB Alnwick 78 16 1 0.78 55.3 3.5 0.84 3 1 0.4 1.02 2.1 1.2 1.03
35UC Berwick-upon-Tweed 53 11 1 0.90 48.0 4.5 0.95 * * * * * * *
Employment ILO Unemployment
Total Rate Total Rate

Labour Force Survey User Guide-Volume 6:
Annual Population Survey (Local Area Database)
_________________________________________________________________________________
_________________________________________________________________________________
36
Sample
Size Estimate1
Standard
Error1
Design
Factor Estimate
Standard
Error
Design
Factor
Sample
Size Estimate1
Standard
Error1
Design
Factor Estimate
Standard
Error
Design
Factor
35UD Blyth Valley 187 36 1.7 0.90 55.5 2.7 1.01 12 2 0.8 1.16 3.6 1.2 1.17
35UE Castle Morpeth 93 23 1.3 0.81 51.9 3.0 0.87 10 3 0.8 1.15 5.9 1.9 1.15
35UF Tynedale 132 31 1.2 0.68 58.8 2.3 0.73 * * * * * * *
35UG Wansbeck 136 26 1.5 0.87 49.4 2.8 0.94 10 2 0.7 1.07 3.8 1.2 1.07
36UB Craven 58 24 1.8 0.72 53.7 4.2 0.82 * * * * * * *
36UC Hambleton 127 44 2.3 0.83 61.4 3.2 0.94 * * * * * * *
36UD Harrogate 207 84 2.5 0.64 63.0 1.9 0.72 * * * * * * *
36UE Richmondshire 42 24 2.3 0.86 58.5 5.7 0.97 * * * * * * *
36UF Ryedale 74 28 1.8 0.78 64.0 4.0 0.89 * * * * * * *
36UG Scarborough 143 51 2.4 0.76 58.3 2.8 0.87 4 1 0.6 0.91 1.5 0.7 0.91
36UH Selby 118 41 2.0 0.73 58.5 3.0 0.85 5 2 0.9 1.07 2.9 1.3 1.07
37UB Ashfield 153 65 2.8 0.73 67.5 2.9 0.91 * * * * * * *
37UC Bassetlaw 125 58 2.4 0.64 63.3 2.6 0.76 4 2 0.8 0.93 1.9 0.9 0.94
37UD Broxtowe 151 56 2.4 0.76 62.4 2.7 0.89 7 3 0.9 0.96 2.9 1.0 0.97
37UE Gedling 142 60 2.5 0.69 62.8 2.7 0.82 5 3 1.1 1.06 2.6 1.2 1.06
37UF Mansfield 114 52 2.8 0.78 59.5 3.2 0.89 5 3 1.5 1.34 3.1 1.7 1.34
37UG Newark and Sherwood 143 57 2.9 0.82 57.1 2.9 0.90 8 3 1.3 1.08 3.5 1.3 1.08
37UJ Rushcliffe 141 60 2.6 0.73 63.4 2.8 0.84 3 2 0.9 1.08 1.6 0.9 1.08
38UB Cherwell 174 80 2.1 0.52 68.4 1.9 0.64 * * * * * * *
38UC Oxford 155 87 3.5 0.78 71.0 2.8 0.95 * * * * * * *
38UD South Oxfordshire 182 78 2.9 0.76 68.2 2.5 0.88 * * * * * * *
38UE Vale of White Horse 158 64 2.6 0.72 65.1 2.6 0.86 3 1 0.6 0.95 1.1 0.6 0.95
38UF West Oxfordshire 139 60 2.0 0.59 70.5 2.4 0.74 * * * * * * *
39UB Bridgnorth 105 27 1.1 0.62 56.6 2.3 0.69 * * * * * * *
39UC North Shropshire 144 34 1.3 0.68 64.8 2.4 0.78 7 2 0.6 0.99 3.0 1.1 0.99
39UD Oswestry 114 22 1.1 0.79 65.5 3.3 0.93 * * * * * * *
39UE Shrewsbury and Atcham 257 53 1.5 0.67 63.3 1.9 0.78 6 1 0.6 1.15 1.5 0.7 1.15
39UF South Shropshire 98 21 1.2 0.82 52.9 3.2 0.89 * * * * * * *
40UB Mendip 149 62 2.5 0.74 66.5 2.7 0.84 * * * * * * *
40UC Sedgemoor 169 63 2.3 0.71 62.6 2.3 0.81 8 3 1.0 1.02 2.8 1.0 1.02
40UD South Somerset 194 80 2.7 0.69 60.1 2.1 0.79 4 1 0.7 0.99 1.1 0.6 0.99
40UE Taunton Deane 152 55 2.5 0.79 60.2 2.7 0.91 5 2 0.9 1.13 2.3 1.0 1.13
40UF West Somerset 48 17 1.7 0.96 54.5 5.6 1.01 * * * * * * *
41UB Cannock Chase 74 53 2.6 0.69 67.3 3.4 0.82 * * * * * * *
41UC East Staffordshire 146 60 2.2 0.64 64.1 2.4 0.74 * * * * * * *
41UD Lichfield 109 50 3.5 1.02 56.1 3.9 1.10 * * * * * * *
41UE Newcastle-under-Lyme 103 61 3.5 0.82 58.5 3.4 0.94 5 3 1.3 0.98 3.0 1.3 0.99
41UF South Staffordshire 108 56 2.5 0.65 65.6 2.9 0.79 * * * * * * *
41UG Stafford 126 64 3.1 0.77 57.1 2.8 0.85 4 2 1.1 1.13 1.8 1.0 1.13
41UH Staffordshire Moorlands 97 51 2.5 0.71 60.3 3.1 0.79 4 2 1.2 1.05 2.9 1.4 1.05
41UK Tamworth 93 39 1.9 0.65 69.7 3.4 0.84 5 2 0.9 0.95 3.9 1.6 0.96
42UB Babergh 115 40 2.2 0.75 55.9 3.0 0.83 * * * * * * *
42UC Forest Heath 64 35 2.2 0.74 66.7 4.3 0.88 * * * * * * *
42UD Ipswich 152 64 2.8 0.71 59.6 2.6 0.83 8 4 1.4 1.05 3.8 1.3 1.05
42UE Mid Suffolk 133 54 2.8 0.84 64.0 3.3 0.95 * * * * * * *
42UF St. Edmundsbury 122 59 2.8 0.77 61.6 2.9 0.85 * * * * * * *
42UG Suffolk Coastal 154 59 2.3 0.68 57.3 2.3 0.77 3 1 0.6 0.98 1.0 0.6 0.99
Employment ILO Unemployment
Total Rate Total Rate

Labour Force Survey User Guide-Volume 6:
Annual Population Survey (Local Area Database)
_________________________________________________________________________________
_________________________________________________________________________________
37
Sample
Size Estimate1
Standard
Error1
Design
Factor Estimate
Standard
Error
Design
Factor
Sample
Size Estimate1
Standard
Error1
Design
Factor Estimate
Standard
Error
Design
Factor
42UH Waveney 108 54 2.5 0.67 55.7 2.7 0.75 * * * * * * *
43UB Elmbridge 134 64 2.7 0.67 59.1 2.5 0.77 6 3 1.2 1.04 2.8 1.1 1.05
43UC Epsom and Ewell 85 40 1.9 0.61 63.6 3.2 0.74 4 2 0.9 0.94 2.9 1.4 0.95
43UD Guildford 145 88 3.4 0.76 70.0 2.7 0.88 * * * * * * *
43UE Mole Valley 101 45 2.2 0.69 64.5 3.2 0.82 * * * * * * *
43UF Reigate and Banstead 145 79 2.7 0.62 68.1 2.3 0.73 3 2 0.9 1.00 1.4 0.8 1.01
43UG Runnymede 79 48 3.0 0.84 68.7 4.4 1.03 * * * * * * *
43UH Spelthorne 126 55 2.3 0.71 69.8 3.0 0.88 6 3 1.2 1.08 4.0 1.6 1.08
43UJ Surrey Heath 83 45 1.9 0.55 65.7 2.8 0.67 * * * * * * *
43UK Tandridge 80 45 2.8 0.82 64.7 3.9 0.92 * * * * * * *
43UL Waverley 139 61 2.0 0.53 63.9 2.2 0.66 * * * * * * *
43UM Woking 91 58 2.9 0.72 71.2 3.6 0.88 * * * * * * *
44UB North Warwickshire 73 31 1.7 0.65 61.7 3.4 0.77 * * * * * * *
44UC Nuneaton and Bedworth 155 62 2.5 0.69 64.3 2.5 0.83 * * * * * * *
44UD Rugby 137 56 2.3 0.69 68.3 2.8 0.85 5 2 1.0 1.01 2.8 1.2 1.01
44UE Stratford-on-Avon 190 67 2.5 0.75 64.7 2.3 0.84 3 1 0.6 1.02 1.1 0.6 1.02
44UF Warwick 212 75 2.4 0.69 64.8 2.1 0.80 5 2 0.7 1.00 1.4 0.7 1.00
45UB Adur 51 35 1.7 0.52 69.6 3.4 0.65 * * * * * * *
45UC Arun 116 69 3.8 0.79 50.3 2.9 0.85 6 4 1.3 0.92 2.6 1.0 0.92
45UD Chichester 111 61 2.5 0.62 63.5 2.6 0.73 4 2 1.1 1.02 2.2 1.1 1.02
45UE Crawley 109 60 2.4 0.62 65.5 2.6 0.73 4 2 1.1 0.99 2.4 1.2 1.00
45UF Horsham 153 71 2.6 0.63 62.7 2.4 0.74 * * * * * * *
45UG Mid Sussex 120 80 3.1 0.64 66.1 2.6 0.77 4 3 1.4 1.05 2.5 1.2 1.05
45UH Worthing 119 57 2.7 0.73 66.5 3.1 0.87 5 2 0.9 0.93 2.4 1.1 0.93
46UB Kennet 105 47 2.1 0.68 62.8 2.8 0.77 * * * * * * *
46UC North Wiltshire 214 69 2.7 0.78 62.8 2.4 0.92 4 1 0.6 0.99 1.1 0.6 0.99
46UD Salisbury 190 61 2.4 0.74 59.0 2.3 0.83 6 2 0.7 0.95 1.9 0.7 0.95
46UF West Wiltshire 203 69 2.5 0.75 61.9 2.2 0.85 3 1 0.5 0.95 0.8 0.5 0.95
47UB Bromsgrove 118 46 2.2 0.73 58.1 2.8 0.82 5 2 0.9 1.06 2.7 1.2 1.07
47UC Malvern Hills 91 36 2.3 0.85 52.8 3.4 0.90 6 2 1.0 1.01 3.5 1.4 1.01
47UD Redditch 139 44 1.8 0.71 68.7 2.9 0.88 4 1 0.7 1.03 2.0 1.0 1.03
47UE Worcester 160 54 2.0 0.66 67.6 2.5 0.79 3 1 0.6 1.01 1.2 0.7 1.02
47UF Wychavon 154 60 2.5 0.73 58.2 2.4 0.81 4 2 0.8 1.04 1.6 0.8 1.04
47UG Wyre Forest 121 45 2.4 0.78 53.5 2.9 0.85 4 1 0.7 0.92 1.7 0.8 0.92
Employment ILO Unemployment
Total Rate Total Rate

Labour Force Survey User Guide-Volume 6:
Annual Population Survey (Local Area Database)
_________________________________________________________________________________
_________________________________________________________________________________
38
Sample
SizeEstimate
1Standard
Error1
Design
FactorEstimate
Standard
Error
Design
FactorSample
SizeEstimate
1Standard
Error1
Design
FactorEstimate
Standard
Error
Design
Factor
Wales 12,955 1,462 8.3 0.93 57.3 0.3 1.03 496 62 3.3 1.33 2.4 0.1 1.33
NA Anglesey, Isle of 647 32 0.7 0.78 56.3 1.2 0.87 31 2 0.3 1.15 2.7 0.5 1.16
NC Gwynedd 560 58 1.6 0.95 57.3 1.6 1.05 16 2 0.7 1.37 2.3 0.6 1.37
NE Conwy 518 51 1.2 0.80 52.9 1.3 0.87 14 2 0.4 1.18 1.7 0.5 1.19
NG Denbighshire 596 43 1.1 0.87 55.9 1.4 0.97 21 2 0.5 1.52 2.4 0.7 1.53
NJ Flintshire 600 78 1.6 0.74 61.5 1.3 0.85 14 2 0.6 1.15 1.7 0.5 1.15
NL Wrexham 593 67 1.7 0.88 60.0 1.5 1.00 34 4 1.1 1.59 3.8 0.9 1.60
NN Powys 554 62 1.5 0.82 56.9 1.4 0.90 16 2 0.5 1.16 1.7 0.5 1.16
NQ Ceredigion 556 33 1.3 1.21 51.0 1.9 1.30 12 1 0.3 1.29 1.4 0.4 1.29
NS Pembrokeshire 633 56 1.3 0.82 55.1 1.3 0.90 32 3 0.6 1.18 3.2 0.6 1.18
NU Carmarthenshire 710 83 1.9 0.84 54.5 1.3 0.92 27 3 0.7 1.12 2.3 0.5 1.12
NX Swansea 699 112 2.7 0.90 55.2 1.3 0.99 27 5 1.1 1.37 2.3 0.5 1.37
NZ Neath Port Talbot 526 65 1.6 0.82 56.3 1.4 0.91 21 3 0.6 1.16 2.4 0.6 1.16
PB Bridgend 591 67 1.5 0.78 57.6 1.3 0.88 26 3 0.6 1.06 2.4 0.5 1.06
PD Vale of Glamorgan, The 543 62 1.4 0.75 59.8 1.3 0.85 19 2 0.5 0.99 1.9 0.4 0.99
PF Rhondda, Cynon, Taff 598 104 2.7 0.88 53.8 1.4 0.98 34 7 1.1 1.09 3.4 0.6 1.09
PH Merthyr Tydfil 386 27 0.8 0.78 55.5 1.6 0.87 17 1 0.3 1.11 2.5 0.6 1.11
PK Caerphilly 677 81 2.0 0.87 55.3 1.3 0.97 34 5 0.9 1.25 3.3 0.6 1.25
PL Blaenau Gwent 413 30 0.9 0.87 53.3 1.6 0.95 17 1 0.3 1.03 2.2 0.5 1.03
PM Torfaen 564 41 1.0 0.84 55.3 1.4 0.93 22 2 0.4 1.13 2.6 0.5 1.13
PP Monmouthshire 633 45 1.0 0.82 58.1 1.3 0.90 16 1 0.3 1.13 1.5 0.4 1.13
PR Newport 674 71 1.6 0.82 59.9 1.3 0.94 26 3 0.6 1.15 2.5 0.5 1.16
PT Cardiff 684 194 4.2 0.84 64.9 1.4 0.97 20 6 1.5 1.17 2.2 0.5 1.17
Rate RateTotal Total
Sample
Size Estimate1
Standard
Error1
Design
Factor
Estim
ate
Standard
Error
Design
Factor
Sample
Size Estimate1
Standard
Error1
Design
Factor
Estim
ate
Standard
Error
Design
Factor
Scotland 15,807 2,664 14.4 1.00 59.6 0.3 1.12 518 96 5.2 1.37 2.1 0.1 1.37
QA Aberdeen City 520 128 2.8 0.81 66.6 1.5 0.93 19 4 1.1 1.13 2.2 0.6 1.13
QB Aberdeenshire 498 138 2.7 0.67 64.2 1.3 0.77 15 4 1.0 1.00 1.8 0.5 1.00
QC Angus 625 55 1.2 0.79 56.5 1.2 0.87 14 1 0.3 1.08 1.3 0.4 1.08
QD Argyll & Bute 553 40 1.0 0.89 56.1 1.4 0.97 13 1 0.4 1.42 1.8 0.5 1.42
QE Scottish Borders, The 520 55 1.3 0.78 57.6 1.4 0.86 16 2 0.4 1.08 1.8 0.5 1.08
QF Clackmannanshire 313 24 0.8 0.85 57.7 1.9 0.94 4 - 0.2 1.24 0.6 0.4 1.24
QG West Dunbartonshire 644 43 0.9 0.82 58.6 1.3 0.92 30 2 0.4 1.11 2.8 0.5 1.11
QH Dumfries and Galloway 491 69 1.8 0.82 55.3 1.4 0.89 12 2 0.6 1.12 1.7 0.5 1.12
QJ Dundee City 594 67 1.7 0.86 55.2 1.4 0.95 34 4 0.7 1.11 3.3 0.6 1.11
QK East Ayrshire 460 57 1.5 0.82 57.4 1.5 0.91 21 3 0.6 1.12 2.8 0.6 1.12
QL East Dunbartonshire 731 52 1.0 0.73 58.1 1.1 0.81 14 1 0.3 1.17 1.2 0.3 1.17
QM East Lothian 502 53 1.2 0.72 62.1 1.4 0.82 8 1 0.4 1.12 1.2 0.4 1.12
QN East Renfrewshire 471 43 1.0 0.70 57.1 1.3 0.79 12 1 0.4 1.14 1.5 0.5 1.14
QP Edinburgh, City of 632 273 6.4 0.87 63.3 1.5 0.98 16 8 2.0 1.10 1.8 0.5 1.10
QQ Falkirk 531 77 1.9 0.80 58.3 1.4 0.90 22 3 0.8 1.15 2.6 0.6 1.15
QR Fife 564 172 4.2 0.80 56.8 1.4 0.89 23 8 1.6 1.04 2.5 0.5 1.05
QS Glasgow City 687 298 7.2 0.90 57.9 1.4 1.00 33 14 2.6 1.07 2.8 0.5 1.08
QT Highland 380 118 3.2 0.84 60.9 1.7 0.95 9 3 1.4 1.47 1.8 0.7 1.47
QU Inverclyde 436 34 1.0 0.92 52.3 1.6 1.00 20 2 0.4 1.19 2.9 0.7 1.20
QW Midlothian 488 47 1.0 0.70 64.1 1.4 0.81 11 1 0.3 1.05 1.5 0.4 1.05
QX Moray 512 47 1.2 0.84 58.7 1.5 0.94 20 2 0.4 1.07 2.3 0.5 1.08
QY North Ayrshire 483 59 1.6 0.85 52.9 1.4 0.93 29 4 0.7 1.07 3.3 0.6 1.08
QZ North Lanarkshire 573 166 4.0 0.82 60.1 1.5 0.93 26 8 1.8 1.17 3.0 0.6 1.17
RA Orkney Islands 98 12 0.5 0.60 66.3 2.7 0.69 * * * * * * *
RB Perth and Kinross 576 80 1.6 0.73 64.4 1.3 0.83 12 2 0.5 1.08 1.4 0.4 1.09
RC Renfrewshire 522 89 2.0 0.73 60.9 1.3 0.82 24 4 0.8 1.03 2.8 0.6 1.03
RD Shetland Islands 72 12 1.2 1.29 63.1 6.1 1.48 * * * * * * *
RE South Ayrshire 452 50 1.3 0.78 53.7 1.4 0.85 13 2 0.5 1.27 2.0 0.6 1.27
RF South Lanarkshire 508 155 3.6 0.75 59.4 1.4 0.84 10 3 0.9 0.97 1.1 0.3 0.97
RG Stirling 542 45 1.1 0.89 59.2 1.5 0.99 19 2 0.5 1.30 2.6 0.6 1.31
RH West Lothian 545 93 2.0 0.73 63.1 1.3 0.84 13 2 0.6 0.97 1.4 0.4 0.98
RJ Eilean Siar (Western Isles) 284 13 0.4 0.88 61.0 2.0 0.98 3 - 0.1 1.33 0.7 0.5 1.33
Northern Ireland 4,943 871 7.4 0.83 59.3 0.5 0.95 122 23 2.1 1.08 1.6 0.1 1.08
Employment ILO Unemployment
Total Rate Total Rate

Labour Force Survey User Guide-Volume 6:
Annual Population Survey (Local Area Database)
_________________________________________________________________________________
_________________________________________________________________________________
39
ANNEX D - Calculating thresholds for England, Wales & Scotland
This Annex explains how the publication thresholds were calculated for different areas for annual LFS data in GB. ONS does not use these thresholds now, but they can still be used as a simple way of identifying cells with high sampling variability. It is the nature of sampling variability that the smaller the group whose size is being estimated, or from which an estimate is being derived, the less precise that estimate is relative to its size. Put another way, the size of the standard error increases with the level of the estimate, so that the larger the estimate the larger is the standard error. But the larger the estimate, the smaller is the standard error in relative terms. The standard error as a proportion of the estimate is known as the relative standard error or coefficient of variation (c.v.). When thresholds were applied (such that estimates with a lower value than the threshold were not published), estimates below 10,000 from the quarterly survey and below 6,000 for annual data prior to 2000/1 were not published, as they were considered to be unreliable. These thresholds equate to a sample size of about 30 and a relative standard error of about 20 per cent. The boosted sample, which combines with data from Wave 1 and Wave 5 from the main LFS to make up the annual LFS data for England, Wales and Scotland in 2003/04, is not spread evenly across the country. This means that for each local authority in England and for each unitary authority in Wales and Scotland, there may be a different sampling fraction. This in turn means that the relative standard errors for the same estimate may vary across local authorities, resulting in a requirement for individual thresholds for each area. Approximate thresholds may be calculated for each local authority with the aim of providing a threshold value that ensures that the relative standard error is at most 20 per cent. For a small subgroup from a large simple random sample, the subgroup sample size, n, is approximately distributed as a Poisson variable. For such a variable, the mean and the variance are equal and are estimated by n. If Wi is the average grossing factor (mean weight) for cases in subgroup i, the value of the grossed estimate is Wi * ni. Then ignoring the variable weights and the clustered design (approximately): Var (Ei=Wi * ni) = Wi 2 * ni (1) The effect of both the grossing and the clustered design is reflected in the design effect, and this has been calculated for the quarterly survey for a range of different estimates. These combined design effects vary substantially for different variables - for estimates of

Labour Force Survey User Guide-Volume 6:
Annual Population Survey (Local Area Database)
_________________________________________________________________________________
_________________________________________________________________________________
40
employment and economic activity they are substantially below 1, whereas for unemployment they are greater than 1. So (1) should be modified to: Var(Ei ) = Wi2 * ni * deffi (2) Thus: Cv(Ei)=Square root (deffi/ni) (3) For the threshold for this variable, we must have: cv(Ei) < 0.2 (4) So from (3) and (4) we obtain: ni > 25 * deffi Or in terms of the grossed estimate: Ei > 25 * Wi * deffi (5) The values of the right hand side of (5) provide the required thresholds. Wi for a particular local authority is the average grossing factor taken directly from the annual LFS data. One result of including the design effect in the calculation is to lead to different thresholds for different variables. However, variables are often used in combination - e.g. a tabulation of employment by ethnic group. The design effect for employment is low, but the design effects for some ethnic groups are very high. This makes it very difficult to come up with design effects for every eventuality. For the quarterly LFS, a design effect of 1 is assumed for all estimates except those for characteristics of minority ethnic groups, where a design effect of 2.5 is assumed. As noted above, this calculation leads to an individual threshold for each local authority. ONS recognises that this would be very complex to implement, and recommend the use of one of three threshold bands. The table below shows how the approximate thresholds have been used to assign areas to these bands.
Approximate threshold Threshold band
5000+ 6000
3000 – 4999 4000

Labour Force Survey User Guide-Volume 6:
Annual Population Survey (Local Area Database)
_________________________________________________________________________________
_________________________________________________________________________________
41
0 – 2999 2000
For Wales, the theoretical threshold for each unitary authority was not banded as above but simply rounded to the nearest thousand. This resulted in thresholds for the 23 UAs in Wales ranging from 1,000 to 4,000. For the 32 Scottish UAs, the ideal thresholds were rounded for the total employed and unemployed. Thresholds thus range from 1,000 to 5,000.
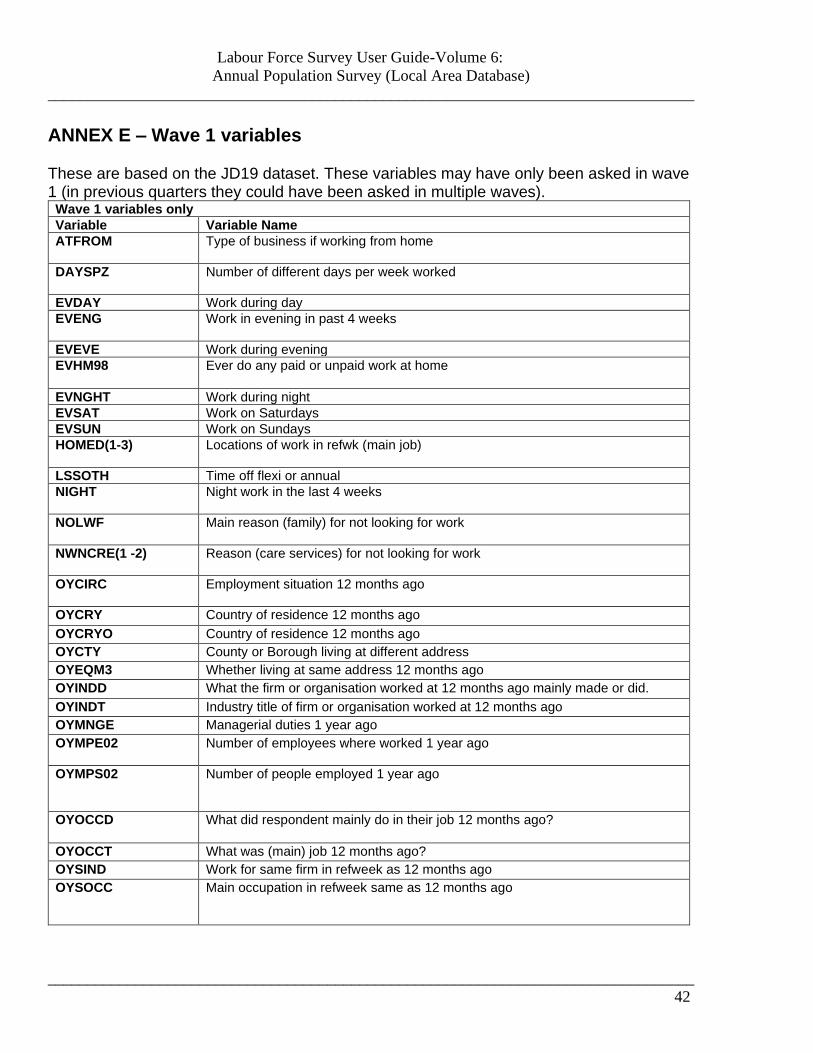
Labour Force Survey User Guide-Volume 6:
Annual Population Survey (Local Area Database)
_________________________________________________________________________________
_________________________________________________________________________________
42
ANNEX E – Wave 1 variables These are based on the JD19 dataset. These variables may have only been asked in wave 1 (in previous quarters they could have been asked in multiple waves).
Wave 1 variables only
Variable Variable Name
ATFROM Type of business if working from home
DAYSPZ Number of different days per week worked
EVDAY Work during day
EVENG Work in evening in past 4 weeks
EVEVE Work during evening
EVHM98 Ever do any paid or unpaid work at home
EVNGHT Work during night
EVSAT Work on Saturdays
EVSUN Work on Sundays
HOMED(1-3) Locations of work in refwk (main job)
LSSOTH Time off flexi or annual
NIGHT Night work in the last 4 weeks
NOLWF Main reason (family) for not looking for work
NWNCRE(1 -2) Reason (care services) for not looking for work
OYCIRC Employment situation 12 months ago
OYCRY Country of residence 12 months ago
OYCRYO Country of residence 12 months ago
OYCTY County or Borough living at different address
OYEQM3 Whether living at same address 12 months ago
OYINDD What the firm or organisation worked at 12 months ago mainly made or did.
OYINDT Industry title of firm or organisation worked at 12 months ago
OYMNGE Managerial duties 1 year ago
OYMPE02 Number of employees where worked 1 year ago
OYMPS02 Number of people employed 1 year ago
OYOCCD What did respondent mainly do in their job 12 months ago?
OYOCCT What was (main) job 12 months ago?
OYSIND Work for same firm in refweek as 12 months ago
OYSOCC Main occupation in refweek same as 12 months ago

Labour Force Survey User Guide-Volume 6:
Annual Population Survey (Local Area Database)
_________________________________________________________________________________
_________________________________________________________________________________
43
OYSOLO On own or with employees 1 year ago
OYSTAT Employee or self-employed 1 year ago
OYSUPVI Supervisory responsibilities 1 year ago.
PTNCRE7(1-2) Reason (care services) for part time work
SATDY How many Saturdays worked in past 4 weeks
SMESIT Reason working from home
SUNDY How many Sundays worked in past 4 weeks
TSUBJ4WK Main subject received during nonformal tuition
T4PURP Main purpose of training
T4WORK Whether training during work hours
TAUTHRS Total hours of instruction or tuition received
YNOTFT Reason for not wanting a full-time job
YPTCIA Reason for part time job
More information about these variables can be found in the user guide volume 2 and volume 3 (details of LFS variables): https://www.ons.gov.uk/employmentandlabourmarket/peopleinwork/employmentandemployeetypes/methodologies/labourforcesurveyuserguidance

Labour Force Survey User Guide-Volume 6:
Annual Population Survey (Local Area Database)
_________________________________________________________________________________
_________________________________________________________________________________
44
ANNEX F – Geographies removed from A15M16 A list of the unsupported geographies are no longer included on APS datasets from A15M16 onwards:
Variable name Description and (new 9 digit replacement variable)
TLEC99 Training and Enterprise Council (None)
ELWA Education and Learning Wales (None)
SCOTER Scottish Enterprise Regions (TECLEC9D)
WALESPCA Welsh Parliamentary Constituency Areas (None)
WARD03 Ward codes 2003 (WARD)
SCOTPCA Scottish Parliamentary Constituency Areas (None)
URINDSC Rural-urban classification Scotland (RU11IND)
UKPCA UK Parliamentary constituency (PCON9D)
TTWA07 Travel to work 2007 (TTWA9D)
URINDEW Rural-urban classification Eng & Wales (RU11IND)
PCA UK Parliamentary Constituency Areas (PCON9D)
PCA2010 UK Parliamentary Constituency Areas 2010 (PCON9D)
TTWA08 Travel to work 2008 (TTWA9D)
NUTS NUTS level (NUTS10)
NUTS2 NUTS level 2 (NUTS102)
NUTS3 NUTS level 3 (NUTS103)
NUTS4 NUTS level 4 (NUTS104)