user friendly recommender systems - university of …judy/homec/theses/2006_hingsto… · ·...
TRANSCRIPT

User Friendly Recommender Systems
MARK HINGSTON
SID: 0220763
SI D
ERE·M EN
S·EADEM
·M UT ATO
Supervisor: Judy Kay
This thesis is submitted in partial fulfillment ofthe requirements for the degree of
Bachelor of Information Technology (Honours)
School of Information TechnologiesThe University of Sydney
Australia
3 November 2006

Abstract
Recommender systems are a recent but increasingly widely used resource. Yet most, if not all of
them suffer from serious deficiencies.
Recommender systems often require first time users to enter ratings for a large number of items —
a tedious process that often deters users. Thus, this thesis investigated whether useful recommendations
could be made without requiring users to explicitly rate items. It was shown thatratings automatically
generated from implicit information about a user can be used to make usefulrecommendations.
Most recommender systems also provide no explanations for the recommendations that they make,
and give users little control over the recommendation process. Thus, when these systems make a poor
recommendation, users can not understand why it was made, and are notable to easily improve their
recommendations. Hence, this thesis investigated ways in which scrutability andcontrol could be imple-
mented in such systems. A comprehensive questionnaire was completed by 18participants as a basis for
a broader understanding of the issues mentioned above and to inform the design of a prototype; a pro-
totype was then created and two separate evaluations performed, each withat least 9 participants. This
investigation highlighted a number of key scrutability and control features that could be useful additions
to existing recommender systems.
The findings of this thesis can be used to improve the effectiveness, usefulness and user friendliness
of existing recommender systems. These findings include:
• Explanations, controls and a map based presentation are all useful additions to a recommender
system.
• Specific explanation types can be more useful than others for explaining particular recommen-
dation techniques.
• Specific recommendation techniques can be useful even when a user hasnot entered many
ratings.
• Ratings generated from purely implicit information about a user can be usedto made useful
recommendations.
ii

Acknowledgements
Firstly, I would like to thank my supervisor, Judy Kay, for all of the time and effort she has put into
guiding me through the production of this thesis.
I would like to thank Mark van Setten and the creators of the Duine Toolkit forproducing a high
quality piece of software and making it available to the public.
I want to also thank Joseph Konstan, for taking the time to talk with me and give me encouragement
at the formative, early stages of my thesis.
I would also like to thank my lovely girlfriend Sarah Kulczycki, for her unwavering support and
fun-loving spirit.
iii

CONTENTS
Abstract ii
Acknowledgements iii
List of Figures vii
Chapter 1 Introduction 1
1.1 Background . . . . . . . . . . . . . . . . . . . . . . . . . . . . . . . . . . . . . . .. . . . . . . . . . . . . . . . . . . . . . . . . . . . . . . . 1
1.2 Research Questions . . . . . . . . . . . . . . . . . . . . . . . . . . . . . . . . . .. . . . . . . . . . . . . . . . . . . . . . . . . . . . . . 2
Chapter 2 Literature Review 4
2.0.1 Social Filtering . . . . . . . . . . . . . . . . . . . . . . . . . . . . . . . . . . . . . .. . . . . . . . . . . . . . . . . . . . . . . . . 4
2.0.2 Content-Based Filtering . . . . . . . . . . . . . . . . . . . . . . . . . . . . . . . .. . . . . . . . . . . . . . . . . . . . . . . 5
2.1 Hybrid Recommenders (The Duine Toolkit) . . . . . . . . . . . . . . . . . . . . .. . . . . . . . . . . . . . . . . . . . . 7
2.2 Unobtrusive Recommendation. . . . . . . . . . . . . . . . . . . . . . . . . . . . .. . . . . . . . . . . . . . . . . . . . . . . . . . 8
2.3 Scrutability and Control . . . . . . . . . . . . . . . . . . . . . . . . . . . . . . . . .. . . . . . . . . . . . . . . . . . . . . . . . . . . 10
2.4 Conclusion . . . . . . . . . . . . . . . . . . . . . . . . . . . . . . . . . . . . . . . . .. . . . . . . . . . . . . . . . . . . . . . . . . . . . . . . 12
Chapter 3 Exploratory Study 14
3.1 Introduction . . . . . . . . . . . . . . . . . . . . . . . . . . . . . . . . . . . . . . . .. . . . . . . . . . . . . . . . . . . . . . . . . . . . . . . 14
3.2 Qualitative Analysis . . . . . . . . . . . . . . . . . . . . . . . . . . . . . . . . . . . .. . . . . . . . . . . . . . . . . . . . . . . . . . . . 15
3.3 Recommendation Algorithm Analysis . . . . . . . . . . . . . . . . . . . . . . . . . . .. . . . . . . . . . . . . . . . . . . . . 16
3.4 Questionnaire - Design . . . . . . . . . . . . . . . . . . . . . . . . . . . . . . . . .. . . . . . . . . . . . . . . . . . . . . . . . . . . . 19
3.4.1 Part A - Presentation Style . . . . . . . . . . . . . . . . . . . . . . . . . . . . . .. . . . . . . . . . . . . . . . . . . . . . . 20
3.4.2 Part B - Understanding & Usefulness . . . . . . . . . . . . . . . . . . . . .. . . . . . . . . . . . . . . . . . . . . . 20
3.4.3 Final Questions - Integrative . . . . . . . . . . . . . . . . . . . . . . . . . . .. . . . . . . . . . . . . . . . . . . . . . . . 22
3.5 Questionnaire - Results . . . . . . . . . . . . . . . . . . . . . . . . . . . . . . . . .. . . . . . . . . . . . . . . . . . . . . . . . . . . . 24
3.5.1 Usefulness . . . . . . . . . . . . . . . . . . . . . . . . . . . . . . . . . . . . . . .. . . . . . . . . . . . . . . . . . . . . . . . . . . . 24
3.5.2 Understanding . . . . . . . . . . . . . . . . . . . . . . . . . . . . . . . . . . . . .. . . . . . . . . . . . . . . . . . . . . . . . . . 29
3.5.3 Understanding And Usefulness . . . . . . . . . . . . . . . . . . . . . . . . .. . . . . . . . . . . . . . . . . . . . . . . 34
iv

CONTENTS v
3.5.4 Control . . . . . . . . . . . . . . . . . . . . . . . . . . . . . . . . . . . . . . . . . .. . . . . . . . . . . . . . . . . . . . . . . . . . . . 34
3.5.5 Presentation Method . . . . . . . . . . . . . . . . . . . . . . . . . . . . . . . . . .. . . . . . . . . . . . . . . . . . . . . . . . 37
3.5.6 Final Questions. . . . . . . . . . . . . . . . . . . . . . . . . . . . . . . . . . . . .. . . . . . . . . . . . . . . . . . . . . . . . . . 38
3.6 Test Data . . . . . . . . . . . . . . . . . . . . . . . . . . . . . . . . . . . . . . . . . .. . . . . . . . . . . . . . . . . . . . . . . . . . . . . . . . 40
3.7 Conclusion . . . . . . . . . . . . . . . . . . . . . . . . . . . . . . . . . . . . . . . . .. . . . . . . . . . . . . . . . . . . . . . . . . . . . . . . 42
Chapter 4 Prototype Design 45
4.1 Introduction . . . . . . . . . . . . . . . . . . . . . . . . . . . . . . . . . . . . . . . .. . . . . . . . . . . . . . . . . . . . . . . . . . . . . . . 45
4.2 User’s View . . . . . . . . . . . . . . . . . . . . . . . . . . . . . . . . . . . . . . . .. . . . . . . . . . . . . . . . . . . . . . . . . . . . . . . 46
4.2.1 iSuggest-Usability . . . . . . . . . . . . . . . . . . . . . . . . . . . . . . . . . . . .. . . . . . . . . . . . . . . . . . . . . . . . 47
4.2.2 iSuggest-Unobtrusive . . . . . . . . . . . . . . . . . . . . . . . . . . . . . . .. . . . . . . . . . . . . . . . . . . . . . . . . . 55
4.3 Design & Architecture. . . . . . . . . . . . . . . . . . . . . . . . . . . . . . . . . .. . . . . . . . . . . . . . . . . . . . . . . . . . . . 56
4.3.1 iSuggest-Usability . . . . . . . . . . . . . . . . . . . . . . . . . . . . . . . . . . . .. . . . . . . . . . . . . . . . . . . . . . . . 56
4.3.2 iSuggest-Unobtrusive . . . . . . . . . . . . . . . . . . . . . . . . . . . . . . .. . . . . . . . . . . . . . . . . . . . . . . . . . 58
4.4 Conclusion . . . . . . . . . . . . . . . . . . . . . . . . . . . . . . . . . . . . . . . . .. . . . . . . . . . . . . . . . . . . . . . . . . . . . . . . 59
Chapter 5 Evaluations 62
5.1 Introduction . . . . . . . . . . . . . . . . . . . . . . . . . . . . . . . . . . . . . . . .. . . . . . . . . . . . . . . . . . . . . . . . . . . . . . . 62
5.2 Design . . . . . . . . . . . . . . . . . . . . . . . . . . . . . . . . . . . . . . . . . . . .. . . . . . . . . . . . . . . . . . . . . . . . . . . . . . . . 62
5.2.1 iSuggest-Usability . . . . . . . . . . . . . . . . . . . . . . . . . . . . . . . . . . . .. . . . . . . . . . . . . . . . . . . . . . . . 63
5.2.2 iSuggest-Unobtrusive . . . . . . . . . . . . . . . . . . . . . . . . . . . . . . .. . . . . . . . . . . . . . . . . . . . . . . . . . 66
5.3 iSuggest-Usability Evaluations — Results . . . . . . . . . . . . . . . . . . . . . . .. . . . . . . . . . . . . . . . . . . . . 68
5.3.1 Recommender Usefulness . . . . . . . . . . . . . . . . . . . . . . . . . . . . . .. . . . . . . . . . . . . . . . . . . . . . . 68
5.3.2 Explanations . . . . . . . . . . . . . . . . . . . . . . . . . . . . . . . . . . . . . . .. . . . . . . . . . . . . . . . . . . . . . . . . . 70
5.3.3 Controls . . . . . . . . . . . . . . . . . . . . . . . . . . . . . . . . . . . . . . . . . .. . . . . . . . . . . . . . . . . . . . . . . . . . . 73
5.3.4 Presentation Method . . . . . . . . . . . . . . . . . . . . . . . . . . . . . . . . . .. . . . . . . . . . . . . . . . . . . . . . . . 76
5.4 iSuggest-Unobtrusive - Results . . . . . . . . . . . . . . . . . . . . . . . . . .. . . . . . . . . . . . . . . . . . . . . . . . . . . . 78
5.4.1 Statistical Evaluations . . . . . . . . . . . . . . . . . . . . . . . . . . . . . . . . . .. . . . . . . . . . . . . . . . . . . . . . . 78
5.4.2 Ratings Generation . . . . . . . . . . . . . . . . . . . . . . . . . . . . . . . . . . .. . . . . . . . . . . . . . . . . . . . . . . . 81
5.4.3 Recommendations . . . . . . . . . . . . . . . . . . . . . . . . . . . . . . . . . . . . .. . . . . . . . . . . . . . . . . . . . . . . 82
5.5 Conclusion . . . . . . . . . . . . . . . . . . . . . . . . . . . . . . . . . . . . . . . . .. . . . . . . . . . . . . . . . . . . . . . . . . . . . . . . 84
Chapter 6 Conclusion 87
6.1 Future Work . . . . . . . . . . . . . . . . . . . . . . . . . . . . . . . . . . . . . . . .. . . . . . . . . . . . . . . . . . . . . . . . . . . . . . . 88

CONTENTS vi
References 90
Appendix A Appendix A — Questionnaire Form 93
Appendix B Appendix B — Questionnaire Results 94
Appendix C Appendix C — iSuggest-Usability Evaluation Instructions 95
Appendix D Appendix D — iSuggest-Usability Evaluation Results 96
Appendix E Appendix E — iSuggest-Unobtrusive Evaluation Instructions 97
Appendix F Appendix F — iSuggest-Unobtrusive Evaluation Results 98

List of Figures
2.1 MAE For The Duine Toolkit’s System Lifecycle Test. Lower MAE Values Indicate Better
Performance. The Numbers Below Each Group Indicate The Sample Size (In Number Of
Predictions) 6
2.2 Examples Of Features That Can Be Computed For Various Item Types 7
2.3 Mean Response Of Users To Each Explanation Interface, Based OnA Scale Of One To Seven.
Explanations 11 And 12 Represent The Base Case Of No Additional Information. Shaded
Rows Indicate Explanations With A Mean Response Significantly Different From The Base
Cases. 12
3.1 Summary Of Possible Explanations And Control Features For The Major Algorithms In The
Duine Toolkit. 18
3.2 Demographic Information For Each Of The Respondents. 20
3.3 List Based Presentation That Was Shown To Participants In The Questionnaire 21
3.4 Map Based Presentation That Was Shown To Participants In The Questionnaire 21
3.5 One Of The Explanation Screens Shown To Participants In The Questionnaire. This Screen
Explains Recommendations From The Learn By Example Technique 22
3.6 One Of The Explanation Screens Shown To Participants In The Questionnaire. This Screen
Explains Recommendations From The Social Filtering Technique 22
3.7 The Genre Based Control Shown To Participants In The Questionnaire 23
3.8 The Screens With The Maximum Average Usefulness For Each Recommendation Method.
Error Bars Show One Standard Deviation Above And Below The Mean. N =18. 25
3.9 Average Ranking Given To Each Presentation Method. N = 18. Top Ranking = 1. Bottom
Ranking = 6. 25
vii
L IST OF FIGURES viii
3.10Average Response For Contribution That Each Method Should MakeTo A Combination Of
Recommendation Methods. Error Bars Show One Standard Deviation AboveAnd Below The
Mean. N = 18. 26
3.11The Screens With The Maximum Average Understanding For Each Recommendation Method.
Error Bars Show One Standard Deviation Above And Below The Mean. N =18 29
3.12Respondents’ Average Understanding Of Recommendation Methods Before And After
Explanations. Error Bars Show One Standard Deviation Above And BelowThe Mean. N = 18 30
3.13Average Ratings For Questions Regarding Respondents’ Understanding, Likelihood Of Using
And Perceived Usefulness Of Each Control Feature. Error Bars Show One Standard Deviation
Above And Below The Mean. N = 18 35
3.14User’s Responses For Questions Regarding Recommendation Presentation Methods. Error Bars
Show One Standard Deviation Above And Below The Mean. N = 18 37
3.15Average Rating For The Usefulness Of Possible Features Of A Recommender. Error Bars Show
One Standard Deviation Above And Below The Mean. 39
4.1 List Based Presentation Of Recommendations 47
4.2 The Star Bar That Users Used To Rate Items 47
4.3 Recommendation Technique Selection Screen. Note: The ‘Word Of Mouth’ Technique Shown
Here Is Social Filtering And The ‘Let iSuggest Choose’ Technique Is The Duine Toolkit Taste
Strategy 49
4.4 Explanation Screen For Genre Based Recommendations 49
4.5 Social Filtering (Simple Graph) Explanation Screen For Social Filtering Recommendations 49
4.6 Explanation Screen For Learn By Example Recommendations 50
4.7 Explanation Screen For Most Popular Recommendations 50
4.8 The Genre Based Control (Genre Slider) 51
4.9 The Social Filtering Control. Note: The actual control is the ‘Ignore This User’ Link 52
4.10Full Map Presentation — Zoomed Out View 53
4.11Full Map Presentation — Zoomed In View 54
4.12Similar Items Map Presentation 54
4.13The Explanation Screen Displayed After Ratings Generation 55

L IST OF FIGURES ix
4.14Architecture Of The Basic Prototype, With Components Constructed During This Thesis
Marked In Blue 56
4.15Architecture Of iSuggest-Usability, With Components Constructed DuringThis Thesis Marked
In Blue 57
4.16Architecture Of iSuggest-Unobtrusive, With Components ConstructedDuring This Thesis
Marked In Blue 58
5.1 Demographical Informations About The Users Who Conducted The Evaluations Of
iSuggest-Usability 66
5.2 Demographical Informations About The Users Who Conducted The Evaluations Of
iSuggest-Unobtrusive 67
5.3 Average Usefulness Ratings For Each Recommendation Method. ErrorBars Show Standard
Deviation. 69
5.4 Average Usefulness Ratings For Each Explanation. Error Bars Show Standard Deviation. 71
5.5 Users’ Ratings For The Overall Use Of The iSuggest Explanations. 72
5.6 Users’ Ratings For The Effectiveness Of Control Features. 74
5.7 Users’ Ratings For The Overall Effectiveness Of The iSuggest Control Features. 75
5.8 Average Usefulness Of The Map Based Presentations. Error BarsShow Standard Deviation. 76
5.9 Sum Of Votes For The Preferred Presentation Type. 77
5.10Comparison Of Distribution Of Ratings Values. 79
5.11Comparison Of MAE And SDAE For Movielens Recommendations And Recommendations
Using Generated Ratings. Lower Scores Are Better. Techniques Are Sorted By MAE. 80
5.12Average Usefulness Ratings For Each Recommendation Method. Error Bars Show Standard
Deviation. 82

CHAPTER 1
Introduction
Recommender systems are a recent, but increasingly widely used resource. Yet most, if not all of them
suffer from serious deficiencies.
With so much information available over the Internet, people often turn to recommendation services
to highlight the items that will be of most interest to them. All of the significant systems in the area
of recommendation build up a profile of a user (usually through asking users to rate items they have
seen) and then use content-based or collaborative filtering, or a combination (hybrid) of these methods,
to make recommendations about what other pieces of information a user might beinterested in. How-
ever many recommender systems require first time users to enter ratings for alarge number of items.
Further, these systems do not always make useful recommendations. Recommendations can be poor
for a number of reasons, but what happens when a recommenderdoesmake a poor recommendation?
Most recommender systems offer no information about the reason that theymade particular recommen-
dations. Further, most also offer users little opportunity to affect the system in a way that can improve
recommendations. The fact that recommenders require users to rate items can also be a failing, as the
tedious process of entering ratings can often deter users. When we takeaccount of all of these factors,
it is obvious that many existing recommender systems are not meeting their potential for usefulness and
usability.
1.1 Background
Since about 1995, recommender systems have been deployed across many domains. Two of the most im-
portant early recommender systems were Ringo (publicly available in 1994) and GroupLens1 (available
in 1996). The success of Ringo, one of the first large-scale music recommendation systems, is reported
in (Shardanand and Maes, 1995). GroupLens, an automated collaborative filtering system for Usenet
1www.grouplens.org/
1

1.2 RESEARCHQUESTIONS 2
news, also proved highly successful. (Konstanet al., 1997) reported trials of the GroupLens system, and
this classic paper showed that collaborative filtering could be effective on a large scale. The GroupLens
project was soon adapted to produce MovieLens2, a large-scale, publicly available movie recommenda-
tion system. Large interest in recommender systems was soon fostered by theincreasing public demand
for systems that helped deal with the problem of information overload. Sincethen, much academic and
commercial interest has been shown in recommender systems for many different domains. Although
much of their research is not published, Amazon.com is one of the most well known implementers of
this technology. Amazon.com makes use of collaborative filtering systems to recommend products that
a user might like to purchase. Other companies that use recommender systems, include netflix.com for
videos, TiVo for digital television and Barnes and Noble for books. Manymusic recommendation sys-
tems are also available today, such as Pandora.com (which maintains a staff of music analysts who tag
songs as they enter the system) and last.fm3. (Atkinson, 2006) rated these two systems as the best music
recommenders currently available to the public.
1.2 Research Questions
In order to make recommender systems more user friendly, the problems detailed above need to be
addressed. However, there is a lack of existing research into the way that recommender systems can:
make recommendations unobtrusively; explain recommendations and offer users useful control over the
recommendation process. This lack of research is especially prevalent inthe area of music recommen-
dation, where little research has been published. Thus, this project investigated the following research
questions:
Scrutability & Control: What is the impact of adding scrutability and control to a recommender
system?
Unobtrusive Recommendation:Can a recommender system provide useful recommendations
without asking users to explicitly rate items?
This thesis originally aimed to investigate these questions with reference to music recommender systems.
To further this goal, a dataset containing unobtrusively obtained information about users was located for
use in investigatingUnobtrusive Recommendation. However, it quickly became apparent that few music
2http://movielens.umn.edu/3http://www.last.fm

1.2 RESEARCHQUESTIONS 3
datasets containing users’ explicit ratings of music. Thus, in order to conduct a thorough and rigorous
study ofScrutability & Control, the MovieLens standard dataset was used. This contained information
on users and their ratings of movies.
The contributions of this thesis are: the identification of a lack of existing research into scrutability,
control and unobtrusiveness in recommender systems (Chapter 2); the identification of a number of
promising methods for adding scrutability and control to a recommender (Chapter 3); the creation of
a prototype that implements these scrutability and control methods, and can alsoprovide unobtrusive
recommendations (Chapter 4); and the evaluation of the methods implemented in thisprototype for
providing scrutability, control and unobtrusiveness within a recommendersystem (Chapter 5).

CHAPTER 2
Literature Review
The basic purpose of a music recommender is to recommend items that will be of interest to a specific
user. This task is required because of the fact that an abundance of information is now available to people
via the Internet and many don’t have the time sort through it all. Currently, all major recommendation
systems use social filtering, content-based filtering, or some combination of these two approaches to
predict how interested a user will be in a specific item. This information is then used to recommend
items that the system believes will be of the most interest to that user. Each of these approaches to rec-
ommendation is discussed below, with reference to Figure 2.0.1 (taken from (van Settenet al., 2002)).
This graph shows the results of testing a series of approaches to recommendation using the MovieLens
standard data set. These tests were evaluated using the Mean Absolute Error (MAE) metric, which
(Herlockeret al., 2004) lists as an appropriate metric for the evaluation of recommender systems. Fig-
ure 1 gives a good indication of the relative levels of performance that can be achieved by using each
approach.
2.0.1 Social Filtering
(Polcicovaet al., 2000), (Breeseet al., 1998) and (Shardanand and Maes, 1995) explain that social
filtering systems work by first asking users to rate items. Then by comparing those ratings, they locate
users who share common interests and make personalized recommendations based on like-minded user’s
opinions. Social filtering does not take formal content into account and makes judgments based purely
upon the ratings of users. The GroupLens project, documented in (Konstan et al., 1997), involved a
large-scale trial of a social filtering recommender system. This trial was confirmatory research - a large
amount of users were asked to test the system, and the results of this testing were collated to provide
a statistical confirmation that social filtering could be effective on a large scale. Many further research
projects into social filtering have confirmed its utility through simulation. Such projects include (Breese
4

2 LITERATURE REVIEW 5
et al., 1998) and (van Settenet al., 2002), which both contain simulations run on the MovieLens data set
and evaluated using mean error metrics.
In general, social filtering algorithms work in the following way:
"In the first step, they identify the k users in the database that are the most similar to the active user.
During the second step, they compute the [set of] of items [liked] by these users and associate a weight
with each item based on its importance in the set. In the third and final step, fromthis [set] they select
and recommend the items that have the highest weight and have not already been seen by the active
user" - (Deshpande and Karypis, 2004), p 4.
Figure 2.0.1 shows the social filtering recommender to have the equal lowestMAE in four of the five
tests, showing that it is a highly effective recommendation method. However,social filtering is not
without its problems. (Adomavicius and Tuzhilin, 2005) summarises the issues with social filtering as:
• An inability to make accurate predictions for new users. (Referred to in this thesis as thecold
start problem for new users).
• Poor recommendation accuracy during the initial stages of the system. (Referred to in this
thesis as thecold start problem for new systems).
• A lack of ability to recommend new items until they are rated by users.
Social filtering was one recommendation technique used in this project to make music and movie related
recommendations. As stated above, social filtering does not make use of thecontent of items, only the
ratings that users have given each item. This means that social filtering approaches were easily adapted
for use in both music and movie related recommendation.
2.0.2 Content-Based Filtering
In content-based filtering systems, users are again asked to rate items. Thesystem then analyses the
content of those items and creates a profile that represents a user’s interests in terms of item content
(features, key phrases, etc.). Then the content of items unknown to the user is analysed and these are
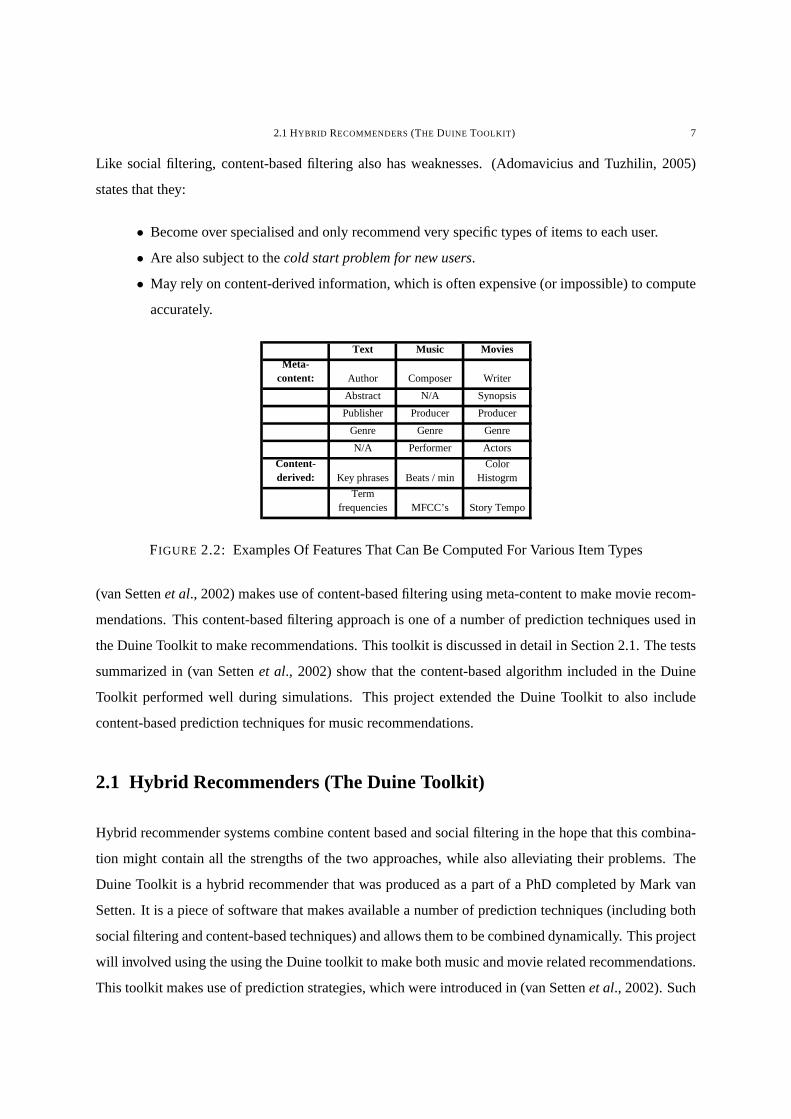
compared with the user’s profile in order to find the items that will be of interestto the user. The
information that a content-based filtering system can compute about a particular item falls into one of
two categories: content-derived and meta-content information. Content-derived information (used in
(Canoet al., 2005), (Logan, 2004) and (Mooney and Roy, 2000)) is computed bythe system through

2 LITERATURE REVIEW 6
FIGURE 2.1: MAE For The Duine Toolkit’s System Lifecycle Test. Lower MAE Val-ues Indicate Better Performance. The Numbers Below Each Group Indicate The SampleSize (In Number Of Predictions)
analysis of the actual content of an item (e.g. the beats per minute of a song or the key words found in
a document). Meta-content information (used in (Maket al., 2003), (van Settenet al., 2002) and (van
Settenet al., 2003)) is any information that the system can glean about an item that doesnot come from
analysing the content of that item (such information may come from an external database, or a header
attached to the item). Examples of the type of features that can be computed fortext, music and movie
data are given in Figure 2.2. Content-derived information about an item needs to make use of algorithms
that are specific to the type of item that is being analysed. In contrast, meta-content information does not
need to be computed from actual items and, in fact, meta-content information is often quite similar for
items from different domains. Figure 2.2 shows that meta-content informationfor each of the different
item types exhibits certain similarities, whereas the content-derived informationis quite specific to the
type of item. This fact means that meta-content based recommenders are ableto be easily adapted for
use in new domains, but that it is much more difficult to perform the same adaptation on recommenders
that use content-derived information. However, systems that make use ofcontent-derived information
gain a better picture of each of the items in the system and thus should be able to make more accurate
recommendations than systems that use only meta-content information.
2.1 HYBRID RECOMMENDERS(THE DUINE TOOLKIT) 7
Like social filtering, content-based filtering also has weaknesses. (Adomavicius and Tuzhilin, 2005)
states that they:
• Become over specialised and only recommend very specific types of items to each user.
• Are also subject to thecold start problem for new users.
• May rely on content-derived information, which is often expensive (or impossible) to compute
accurately.
Text Music MoviesMeta-
content: Author Composer Writer
Abstract N/A Synopsis
Publisher Producer Producer
Genre Genre Genre
N/A Performer Actors
Content-derived: Key phrases Beats / min
Color Histogrm
Term frequencies MFCC’s Story Tempo
FIGURE 2.2: Examples Of Features That Can Be Computed For Various Item Types
(van Settenet al., 2002) makes use of content-based filtering using meta-content to make movierecom-
mendations. This content-based filtering approach is one of a number of prediction techniques used in
the Duine Toolkit to make recommendations. This toolkit is discussed in detail in Section 2.1. The tests
summarized in (van Settenet al., 2002) show that the content-based algorithm included in the Duine
Toolkit performed well during simulations. This project extended the Duine Toolkit to also include
content-based prediction techniques for music recommendations.
2.1 Hybrid Recommenders (The Duine Toolkit)
Hybrid recommender systems combine content based and social filtering in thehope that this combina-
tion might contain all the strengths of the two approaches, while also alleviating their problems. The
Duine Toolkit is a hybrid recommender that was produced as a part of a PhD completed by Mark van
Setten. It is a piece of software that makes available a number of prediction techniques (including both
social filtering and content-based techniques) and allows them to be combined dynamically. This project
will involved using the using the Duine toolkit to make both music and movie related recommendations.
This toolkit makes use of prediction strategies, which were introduced in (van Settenet al., 2002). Such

2.2 UNOBTRUSIVE RECOMMENDATION 8
prediction strategies are a way of easily combining prediction techniques dynamically and intelligently
in an attempt to provide better and more reliable prediction results. (van Settenet al., 2002) introduces
these prediction strategies and demonstrates how they can be adapted depending upon the various states
that a system might be in. It introduces a software platform called Duine, which implements prediction
strategies and can be extended to include new prediction techniques and new strategies. Simulations run
in (van Settenet al., 2002) and (van Settenet al., 2004) showed that the combination of prediction tech-
niques into prediction strategies can improve the effectiveness of a recommendation system. The testing
done in these papers was of sound quality and was performed on the data set made available by the
MovieLens project, which is a well-known, standard data set for recommender systems. The results of
these tests are summarised in (van Settenet al., 2002). These results show that in every case, the Taste
Strategy (a particular prediction strategy used in testing) had the lowest MAEof all of the prediction
techniques used. This strategy is able to choose the most effective prediction technique for a particular
situation and thus is able to maximise prediction accuracy. The work done in (van Settenet al., 2002)
and (van Settenet al., 2004) focused on making predictions based on movie data. This project built upon
this work by extending the Duine Toolkit for use in music recommendation. As well as making use of
the Duine Toolkit in a new domain, this project also involved the addition ofScrutability & Control
features andUnobtrusive Recommendationto this toolkit. Each of these additions is discussed in the
following sections.
2.2 Unobtrusive Recommendation
Generally, recommender systems build a profile of a user’s likes and dislikesby asking a user to rate
specific items after they have listened to them. However, users often find this process to be tedious.
Further, the cold start problem for new users means that users may needto rate many items before
they receive useful recommendations. As a result, this thesis investigated ways in which a system
can elicit information about a user’s likes and dislikes in an unobtrusive manner. In order to investigate
Unobtrusive Recommendation, new features were added to the Duine Toolkit. This allowed would allow
the system to make recommendations without needing to ask a user to rate the items that they have seen
or heard. Accomplishing this task required an unobtrusive way to gauge auser’s level of interest in an
item. Some of the unobtrusive methods for judging how interested a user is in anitem are summarised
in (Oard and Kim, 1998). These methods include the length of time that a user spends viewing an item,
the number of times a user has viewed an item, the items that a user is willing to purchase, the items

2.2 UNOBTRUSIVE RECOMMENDATION 9
that a user deletes from their collection and the items that a user chooses to retain in their collection.
Unfortunately, (Oard and Kim, 1998) merely presents a summary of these methods and does not present
any testing of the methods it mentions. Of course, one of the problems with all ofthe methods mentioned
above for modelling users unobtrusively is the fact that preferences based upon such data are likely to be
less accurate than preferences based upon explicit user ratings. (Adomavicius and Tuzhilin, 2005) states
that "[unobtrusive] ratings (such as time spent reading an article) are often inaccurate and cannot fully
replace explicit ratings provided by the user. Therefore, the problem of minimizing intrusiveness while
maintaining certain levels of accuracy of recommendations needs to be addressed by the recommender
systems researchers" - (Adomavicius and Tuzhilin, 2005), p 12. This paper recognises the need for more
research into unobtrusive user modelling and notes a number of papers that have reported on work in
this area.
Unfortunately, there is a distinct lack of research published that deals witheliciting a user’s musical
preferences unobtrusively. The literature available on unobtrusive user modelling is often concerned
with determining user’s preferences in regard to websites and not their opinions on pieces of music.
(Kiss and Quinqueton, 2001) mentions the use of navigation histories to gauge a user’s level of interest
in particular websites. It also proposes some more creative methods for using implicit input, such as
matching the sort order of a search with the order that results were visited and using the time taken to
press the ’back’ button on a browser to judge a user’s interest in a page. Although (Kiss and Quinqueton,
2001) is obviously based upon some amount of research, and claims "the implementation has started and
is well advancing, and we begin to have some experimental results" - (Kiss and Quinqueton, 2001), p
15, disappointingly, results from the project are not easily available and,as user modelling forms only
one part of the paper, it is unlikely that it would be easy to identify the impact that particular user
modelling techniques had upon the results of this research. However, this paper does still present some
useful ideas on making use of implicit preference information that could be adapted for use in a music
recommender. (Middletonet al., 2001) describes similar techniques for user modelling and includes
results of a number of exploratory case studies that show that this form ofuser modelling can be quite
successful. This project built upon existing methods for user profiling and extended these to investigate
methods for inferring a user’s level of interest in an item from only implicit data.

2.3 SCRUTABILITY AND CONTROL 10
2.3 Scrutability and Control
The literature discussed in the sections above all deals with the desire to make high quality recommenda-
tions. Once these recommendations are made, scrutability is concerned with explaining to the user why
a particular recommendation was made. Further, control is concerned with allowing users to control a
recommender system in order to improve recommendations. Research published in (Sinha and Swearin-
gen, 2001) and (Sinha and Swearingen, 2002) shows that users aremore willing to trust or make use
of recommendations that are well explained (i.e. that are scrutable). Joseph Konstan, a leading figure
in recommender systems research noted that "adding scrutability to recommender systems is important,
but hard" - (Konstan, J., personal communication, June 3, 2006). Scrutability is a key component in a
recommender system for a number of reasons. First, users are not always willing to trust a system when
they are just beginning to use it. If users can be provided with some level ofassurance that the recom-
mendations made by a system are of a high quality, then they are more likely to trust that system. Such
assurances are given to the user by showing why a particular recommendation was made. Scrutability is
also useful in cases where a recommendation is made that a user believes is not appropriate. In this case,
if a user can access some explanation for the recommendation, they may be more likely to understand
why that recommendation might be of interest to them. Explanations may also help auser to identify
areas where a system is making errors and, ideally, control functions should then be able to help the
user alter the function of the system to make it less likely to make inappropriate recommendations. The
value of control functions is not limited to allowing alterations to the recommendationprocess when
errors occur. Rather, users can often make use of control functionsat any time during the operation of
a recommender system. This allows them to influence the process of recommendation in a way that
hopefully leads to improved recommendation accuracy.
Sinha and Swearingen have shown that scrutability improves the effectiveness of a recommendation
system. (Sinha and Swearingen, 2001) and (Sinha and Swearingen, 2002), published the results of re-
search that involved asking users to test a number publicly available recommendation systems and then
evaluate their experience with each one. The findings of these studies show that "in general users like
and feel more confident in recommendations perceived as transparent"- (Sinha and Swearingen, 2002),
p 2. Although their experiments were on only a small scale, they were well designed and the concept
of the importance of transparency is supported by other research suchas was conducted by "John-
son & Johnson (1993) [who] point out that explanations play a crucialrole in the interaction between
users and complex systems" - (Sinha and Swearingen, 2002), p 1. A similarexperimental study was

2.3 SCRUTABILITY AND CONTROL 11
conducted in (Herlocker, 2000), which describes scrutability experiments conducted on a much larger
sample group and confirms that "most users value explanations and would like to see them added to their
[recommendation] system. These sentiments were validated by qualitative textual comments given by
survey respondents" - (Herlockeret al., 2000), p 10. (Herlocker, 2000) describes in detail a series of
approaches to adding scrutability to social filtering recommender systems. Itreports on user trials that
were conducted involving a large number of users, who were each asked to use prototype recommender
systems and provide feedback on the value of the explanations given forrecommendations. The results
of these tests can be seen in Figure 2.3, which shows the most useful techniques for adding scrutabil-
ity to be explanations showing histograms of ratings from like-minded users (nearest neighbours) and
explanations showing the past performance of the recommender. (van Setten, 2005) also describes a
small scale investigation into explanations for recommender systems and (Mcsherry, 2005) and (Cun-
ninghamet al., 2003) present methods for explaining a particular method of recommendation, named
Learn By Example. Some commercial systems (such as liveplasma1) also offer innovative ways of pre-
senting recommendations, such as Map Based presentation of items. Such presentations may increase
the usefulness of recommendations and the ability of a user to understand these explanations.
The papers (and systems) mentioned above each demonstrate that scrutability can be beneficial in recom-
mender systems, and present some ways of creating it. However,Scrutability & Controlin recommender
systems is an area which has not received much research attention and thus; there are still many ques-
tions to be answered regarding the best way to achieve these goals. Specifically, there is a lack of existing
research into:
• Comparison of the multiple recommendation techniques in terms of their usefulnessand ability
to be explained.
• Providing explanations for recommendation techniques other than social filtering.
• The impact of adding of controls to a recommender system.
• The relationship between a user’s understanding of a recommendation technique and the use-
fulness of its recommendations, and the potential trade-off between the two.
• The effect of a Map Based presentation on the usefulness and understandability of recommen-
dations. As a result, this project addedScrutability & Controlfeatures to the Duine Toolkit in
order to build upon current research and investigate each of these areas.
1http://www.liveplasma.com

2.4 CONCLUSION 12
FIGURE 2.3: Mean Response Of Users To Each Explanation Interface, BasedOn AScale Of One To Seven. Explanations 11 And 12 Represent The Base Case Of NoAdditional Information. Shaded Rows Indicate Explanations With A Mean ResponseSignificantly Different From The Base Cases.
2.4 Conclusion
At this stage of the project, a number of key areas where more research was required were identified.
The first of these areas was the provision ofUnobtrusive Recommendationto users. Although there
is existing work into unobtrusive modeling of a user’s interests, most of this research has concentrated
upon the field of web browsing. Using implicit data to infer a user’s interests initems such as music
or movies is an area where little research has been conducted. Thus, this project aimed to build upon
existing work in the field of unobtrusive user modeling and investigate unobtrusive music recommenda-
tion. AddingScrutability & Controlto recommender systems is the second area where a lack of existing

2.4 CONCLUSION 13
research was identified. Current research into explaining and controlling recommender systems is quite
sparse, and although some research does exist, there are still many questions to be answered regarding
this goal. These questions include issues relating to the impact of adding controls to a recommender
system, as well as many issues related to providing scrutable recommendations. Ultimately, this project
aimed to advance research into bothScrutability & Control in recommender systems andUnobtrusive
Recommendation.

CHAPTER 3
Exploratory Study
3.1 Introduction
The review of literature from Chapter 2 highlighted that there is a lack of existing research in the areas
of scrutability, control and unobtrusiveness within recommender systems.This lack of research is espe-
cially prominent in the area of music recommendation, where little research at allhas been published.
Thus, this project aimed to investigate questions related toScrutability & Control and Unobtrusive
Recommendation. In order to investigate these areas, an exploratory study was first conducted, which
involved the following tasks:
• A qualitative analysis of existing recommender technologies.
• Conduct of a questionnaire to investigate aspects of recommender systems,as a foundation for
gaining the understanding needed to create a prototype recommender system.
• The creation of a dataset of implicit information about a large number of users, required for
performing evaluations on a prototype at a later stage of the thesis.
The first stage for this research project was a qualitative analysis of a number of existing recommender
systems and recommendation algorithms. This aimed to identify a suitable code basethat could be ex-
tended into a prototype recommender system. An analysis of the recommendationalgorithms contained
in the chosen code base was then performed. This analysis aimed to discover methods that could be used
to add controls and explanations to the prototype recommender system. To investigate users’ attitudes
toward these explanations and controls (as well as attitudes toward other aspects of recommender sys-
tems and usability), a questionnaire was conducted. The results of this questionnaire would be used later
in this thesis to guide the construction of the prototype. Finally, a source of test data was established for
use in evaluating the prototype. Each of these tasks is detailed in the sections below.
14

3.2 QUALITATIVE ANALYSIS 15
3.2 Qualitative Analysis
The system chosen as a code base needed to be open source and havegood code quality, resource con-
sumption (with particular reference to running time and memory usage) and recommendation quality.
It would also be highly useful if it provided support for the implementation offeatures such as ex-
planations, control features and unobtrusive recommendation. The recommendation toolkits that were
examined during the course of this qualitative analysis include:
Taste: open-source recommender, written in Java. Available from http://taste.sourceforge.net/
Cofi: open-source, written in Java. Available from http://www.nongnu.org/cofi/
RACOFI: open-source, written in Java. Available from http://www.daniel-lemire.com/fr/abstracts/COLA2003.html
SUGGEST: Free, written in C. Available from http://www-users.cs.umn.edu/ karypis/suggest/
Rating-Based Item-to-Item: public domain, written in PHP. Available from http://www.daniel-
lemire.com/fr/abstracts/TRD01.html
consensus:open-source, written in Python. Available from http://exogen.case.edu/projects/consensus/
The Duine Toolkit: open-source, written in Java. Available from http://sourceforge.net/projects/duine
The qualitative analysis of these systems began with an examination of the specifications of each toolkit.
Further analysis involved the examination of any available reference documentation. This analysis,
combined with learnings from the critical literature review described in 2 narrowed the candidates for
use down to just Taste, and the Duine Toolkit. At this stage, the code for each of these toolkits was
downloaded and examined. Ultimately, the Duine Toolkit was chosen for use for the following reasons:
Well documented code base:the Duine Toolkit has complete and high quality documentation,
as well as reference documents.
Good recommendation quality: (van Settenet al., 2004) showed that the Duine Toolkit is able
to choose the most effective recommendation technique for a particular situation and thus is
able to maximise the quality of recommendations.
Good resource usage:the Duine Toolkit has been built to conserve resources and ensures that
the most resource intensive operations (which involve calculating the similaritybetween a user
and all other users) occur only once for each user session, and notevery time that a user rates
an item.
Multiple recommendation methods: the Duine Toolkit has six built in recommendation tech-
niques and the facility to dynamically alter the recommendation technique that is being used.

3.3 RECOMMENDATION ALGORITHM ANALYSIS 16
This meant that a system could be built that allowed users to easily swap fromusing one rec-
ommendation technique to another. This also meant that we could test issues regarding users’
interactions with not just one, but several methods of recommendation.
Built in explanation facility: the Duine Toolkit was designed with explanations in mind — each
recommendation that is created using this toolkit can have an explanation object attached to it,
which describes how exactly that prediction was produced. This featurewas included in the
Duine Toolkit in in anticipation of further extensions to the toolkit that enabled recommenda-
tions to be displayed.
Easy to add user controls: In the Duine Toolkit, personal settings can be set and saved for each
user. Some of these settings affect the recommendations that are produced by the system.
The fact that the Duine Toolkit can set and save such personal settings means that it could be
extended to allow users to exert control over the recommendation process.
3.3 Recommendation Algorithm Analysis
Once the Duine Toolkit was chosen as the code base for this thesis, an analysis of the recommendation
techniques that it provided was necessary. The major recommendation techniques made available within
the Duine Toolkit are:
Most Popular: This technique recommends the most popular items, based on the average rating
each item was given, across all users of the system.
Genre Based:This is a content-based technique that uses a user’s ratings to decide what genres
that user likes and dislikes. It then recommends items based upon this decision.
Social Filtering: This is a social filtering technique that looks at the current user’s ratingsand
finds others who are similar to that user. These similar users are then used torecommend new
items. (Note: this method also makes use of ‘opposite users’).
Learn By Example: This is a content-based technique that predicts how interested a user will
be in a new artist by looking at how they have rated other similar items in the past. (Requires
some measure of similarity to be defined).
Information Filtering: This is a content-based technique that uses natural language processing
techniques to process a given piece of text for each item (e.g. A description). This information,
combined with the a user’s ratings is used to predict the user’s level of interest in new items.

3.3 RECOMMENDATION ALGORITHM ANALYSIS 17
Note that examination of this technique showed that it could be used to create recommen-
dations that were either Lyrics Based (using lyrics from songs) or Description Based (using
descriptions of particular artists).
Taste Strategy: As noted in Chapter 2, (van Settenet al., 2004) shows that this is the recommen-
dation technique that produces the highest quality recommendations within the Duine Toolkit.
This technique is, in fact, a ‘Prediction Strategy’ that is able to choose to makerecommen-
dations using any of the five techniques described above. This techniquechooses the best
available recommendation technique at any given point in time and makes recommendations
using that technique. This is the default recommendation technique for the Duine Toolkit.
Note that this technique was not considered as a candidate for the addition of scrutability
or control, as it is a ‘Prediction Strategy’ that merely makes use of other recommendation
techniques to make recommendations and does not actually create recommendations itself.
Thorough examination and testing was conducted upon these algorithms to ascertain ways in which
they could be explained and controlled. The results from this investigation are summarised in Figure
3.1. This table shows the possible explanations and control features that could be implemented for
each of the recommendation algorithms within the Duine Toolkit. It also lists any problems that may
be encountered when adding scrutability and control to this algorithm. For example, the entry for the
Genre Based technique notes that recommendations produced using this technique could be explained by
telling the user what genre an item belongs to and how interested the system thinks that user is in those
genres. It also notes that one of the ways that users could be given control over this technique would
be to allow them to specify their level of interest in particular genres. Finally,it shows that a possible
problem that may be encountered when offering users controls and explanations for this technique would
be if a user did not agree with the genres that an item was classified into.

3.3 RECOMMENDATION ALGORITHM ANALYSIS 18
Algorithm Possible Explanations Possible Control Features Problems
Most Popular Tell the user where this item ranks in terms of popularity.
Tell the user the average rating that has been given to this item.
Tell the user how many users have rated this item.
Genre Based Tell the user the recommendation was based on the genres that item belongs to.
Allow the user to specify their interest in a particular genre.
What if users don't agree with the genre classifications?
Show the user how interested the system thinks they are in each genre.
Social Filtering
Show the user how similar users have rated an item.
Allow the user to specify the impact that similar and opposite users should have on recommendations.
What if users do not think they are really similar to particular users?
Show the user the similar users that factored heavily in their recommendation.
Allow the user to choose users who they want to be considered as similar to them.
There is A LOT of information involved in this algorithm.
The 'opposite users' idea is a hard one to convey.
Learn By Example
Show the user the similar items that factored heavily in their recommendation and how they rated those similar items.
Allow the user to specify what factors should determine the similarity between items.
What if users do not think this item is actually similar to the items they have rated in the past.
Information Filtering
Show the user the key words that are present in the descriptions of items that they have liked in the past.
Allow user to control the features used in recommendation.
Users might disagree with the keywords used to categorise their interest - even if these key words are quite appropriate.
Users might not understand how this approach is working, especially if it works on something other than descriptions (e.g. it may work on the text from forum posts about an item).
FIGURE 3.1: Summary Of Possible Explanations And Control Features For The MajorAlgorithms In The Duine Toolkit.
The Taste Strategy, was also examined at this stage, but it was found that because it switches between
recommendation techniques, it is not a technique that can be explained in a consistent way to users. This
meant that it was not considered as a suitable technique to add scrutability and control to.

3.4 QUESTIONNAIRE - DESIGN 19
3.4 Questionnaire - Design
The recommendation algorithm analysis described in the previous section highlighted a number of us-
ability features that could be added to a recommender system. Further, the analysis of existing rec-
ommender systems described in Section 3.2 and the review of literature described in Chapter 2 also
brought to light some of the different usability features of existing recommender systems. In order to
investigate how understandable and effective users would find these usability features, a questionnaire
was designed. The results of this questionnaire should then be used to inform the construction of the
prototype. A questionnaire was chosen as it was the most efficient way to gather large amounts of de-
tailed information about users’ opinions on the set of potential usability features. The specific aims of
the questionnaire were to assess several potential usability features related to:
• Understanding of recommendations provided by various recommendation techniques.
• Usefulness of recommendations provided by various recommendation techniques.
• Attitudes toward control features for recommenders and understanding of how these would be
used.
• Preferences for recommendation presentation format.
To this end, an extensive questionnaire was designed. It asked usersto answer questions on a scale of 1
to 5, where 1 was the lowest score and 5 was the highest. Particular care was taken during the design of
the questionnaire to ensure that each question would elicit useful information from participants and that
all of the questions were clear and free of bias.
An initial group of five respondents filled out the questionnaire, each answering 60 questions. After
these respondents had completed the questionnaire, a number of revisionswere made. These revisions
included the removal of two questions, the addition of seven new questions and minor changes to the
wording of a small number of questions. The questionnaire was then conducted with a further 13 people,
who answered 65 questions (58 in common with the original questionnaire). Most respondents took
around 40 minutes to complete the questionnaire. Figure 3.4 shows demographic information for each
of the respondents. The sample group for this questionnaire was carefully selected to contain people
from a variety of backgrounds and both males and females. The majority (12/18) of the users who
completed the questionnaire were aged under 30. Since modern recommender systems are used most
often by people who fall in the 18-30 age range, a higher proportion of respondents in this age range
was deemed to be appropriate.

3.4 QUESTIONNAIRE - DESIGN 20
Participant: 1 2 3 4 5 6 7 8 9 10 11 12 13 14 15 16 17 18Age 22 21 20 30 22 51 52 19 21 22 22 21 19 47 48 18 47 19Gender F F M M M F M M F F F F M F M F F FHas An IT Background? N N N N Y N N N N N N N N N N N N NHas Used Any Type Of Recommender Before? Y N Y Y Y N Y Y Y Y Y N Y N N Y Y Y
FIGURE 3.2: Demographic Information For Each Of The Respondents.
Sections 3.4.1 to 3.4.3 now describe the final set of questions that were presented to respondents. Al-
though these were many questions, they were actually in three groups: Part A had one set of 5 questions,
Part B had six sets of questions, totalling 52 questions and the Final Questions comprised one set of
seven questions. The entire questionnaire is included as Appendix A.
3.4.1 Part A - Presentation Style
This section of the questionnaire aimed to investigate users’ preferences for recommendation presenta-
tion format.
At this stage, respondents were shown two forms of recommendation presentation. The first of these
was a standard List Based format (shown in Figure 3.3) and the second was a Map Based format (shown
in Figure 3.4), that was similar to the liveplasma1 interface mentioned in Chapter 2. After viewing an
example of each presentation format, respondents were then asked to ratehow well they understood
the information conveyed by that example and how useful they would find recommendations that were
presented in this format. Finally, after viewing both formats, respondents were asked to indicate whether
they would prefer the List Based format, the Map Based format or both.
3.4.2 Part B - Understanding & Usefulness
This section of the questionnaire aimed to investigate understanding of recommendations, usefulness of
recommendations and attitudes toward control features.
This section presented six recommendation techniques to respondents (Most Popular, Genre Based,
Social Filtering, Learn By Example, Description Based and Lyrics Based). For each of these techniques,
respondents followed this process:
1http://www.liveplasma.com/

3.4 QUESTIONNAIRE - DESIGN 21
FIGURE 3.3: List Based Presentation That Was Shown To Participants In The Questionnaire
FIGURE 3.4: Map Based Presentation That Was Shown To Participants In The Questionnaire
Respondents were first presented with a short textual description of how this technique works. At this
stage, they rated their initial understanding of the technique. Respondentswere then presented with
a number of explanation screens, each of which showed a recommended item and an explanation of
why it was recommended (example explanation screens are shown in Figures 3.5 and 3.6). For each
screen, respondents rated how well they understood why the recommendation had been made and how
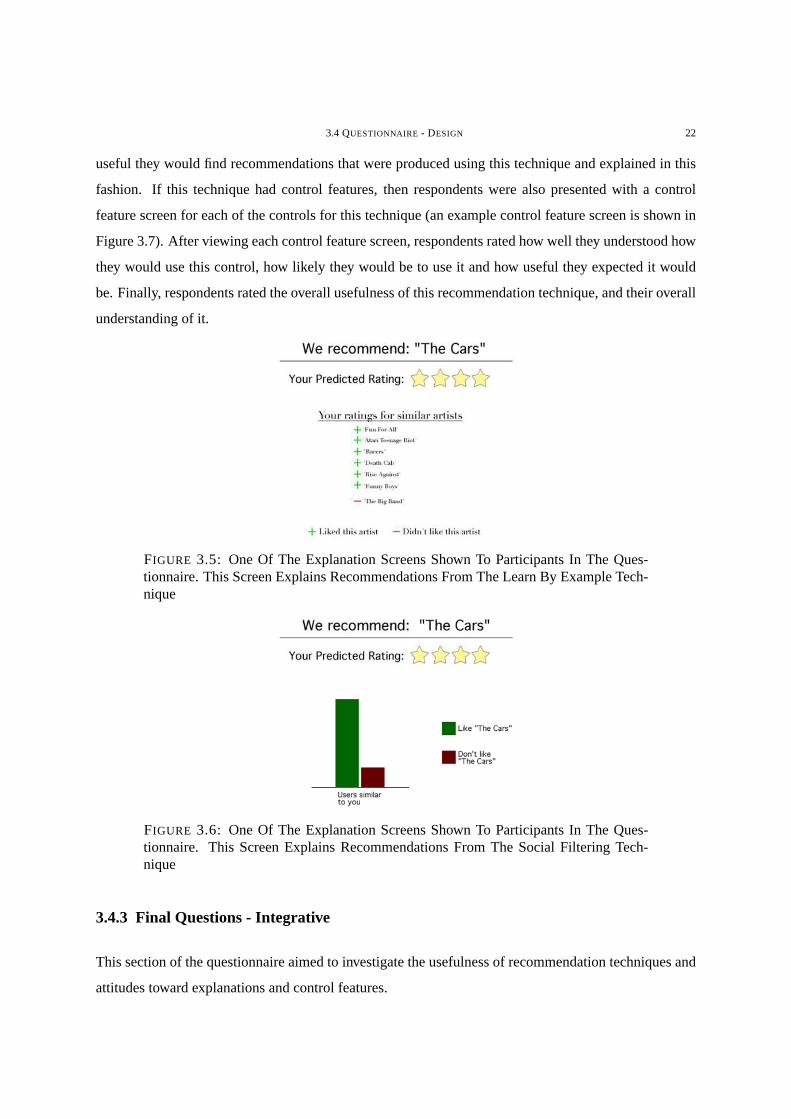
3.4 QUESTIONNAIRE - DESIGN 22
useful they would find recommendations that were produced using this technique and explained in this
fashion. If this technique had control features, then respondents were also presented with a control
feature screen for each of the controls for this technique (an example control feature screen is shown in
Figure 3.7). After viewing each control feature screen, respondentsrated how well they understood how
they would use this control, how likely they would be to use it and how useful they expected it would
be. Finally, respondents rated the overall usefulness of this recommendation technique, and their overall
understanding of it.
FIGURE 3.5: One Of The Explanation Screens Shown To Participants In The Ques-tionnaire. This Screen Explains Recommendations From The Learn By Example Tech-nique
FIGURE 3.6: One Of The Explanation Screens Shown To Participants In The Ques-tionnaire. This Screen Explains Recommendations From The Social Filtering Tech-nique
3.4.3 Final Questions - Integrative
This section of the questionnaire aimed to investigate the usefulness of recommendation techniques and
attitudes toward explanations and control features.

3.4 QUESTIONNAIRE - DESIGN 23
FIGURE 3.7: The Genre Based Control Shown To Participants In The Questionnaire
At this stage of the questionnaire, respondents were asked to indicate theirgeneral opinion on the use-
fulness of all the six recommendation techniques. They first ranked the techniques from 1 to 6 in order
of usefulness. Then respondents were also asked to indicate the weightthey would want to place on each
technique if a combination of techniques was to be used in a recommender system. The weight that they
could place on each technique ranged from ‘Not At All’ (weight of 0) to ‘Very Much’ (weight of 100).
The final five questions in the questionnaire then asked respondents to rate how useful they would find
the following five potential features of a recommender system:
System Chooses Recommendation Method:The recommender system chooses the best rec-
ommendation technique to use at any point in time.
System Chooses Combination Of Recommendation Methods:The recommender system chooses
a combination of recommendation techniques to be used.
View Results From Other Recommendation Methods:The recommender system chooses the
best recommendation technique to use at any point in time. However, users are then able to
view what their recommendations would look like if other recommendation techniques were
used.
Explanations: Explanations are provided for how recommendations were made.
Controls: Users are given some amount of control over how recommendations are made.
These final questions would give an overall picture of users’ attitude toward a variety of potential features
of a recommender system. As well as providing useful information, these questions also acted as internal
consistency checks, allowing a user’s answers to be validated. For example, when asked to rank the

3.5 QUESTIONNAIRE - RESULTS 24
recommendation techniques in order of usefulness, a user’s answers would be expected to correlate with
answers to usefulness questions asked earlier in the survey.
3.5 Questionnaire - Results
In total, 5 respondents answered the initial questionnaire (60 questions) and a further 13 respondents
answered the revised questionnaire (65 questions). We now present and discuss the results of the ques-
tionnaire, with reference to the aims of the questionnaire, as expressed in Section 3.4. The results in this
section are rather long because they report respondents’ answers interms of recommendation useful-
ness, recommendation understanding, control features and presentation method. Each of these factors is
important and each of them is different. For each factor, this section reports a small number of averages.
This is explained with illustrative additional data which helps understanding ofthe results. Then there
is a summary of the conclusions and a separate list of the implications for the prototype design. This
section is quite long, but it has not been relegated to an appendix becauseit is all new information about
how users can understand and control recommenders.
3.5.1 Usefulness
This section discusses the questionnaire results relevant to the aim of: assessing the perceived usefulness
of recommendations provided using various recommendation techniques.
In Part B of the questionnaire, respondents rated the usefulness of 18screens that presented recom-
mendations. The screens that had the maximum average usefulness for each technique are presented in
Figure 3.8, along with their average rating (error bars show one standard deviation above and below, ac-
tual results for each respondent shown in Appendix B). For example, from five Social Filtering screens
presented to respondents, the one with the highest average usefulnessrating was the Simple Text screen,
so this is shown in Figure 3.8.
In the Final Questions section of the questionnaire, respondents rankedthe recommendation techniques
in order of usefulness (where 1 is the highest possible ranking, and 6 isthe lowest ranking). Figure
3.9 shows the average ranking given to each technique, with error barsshowing one standard deviation
above and below the mean (actual results for each respondent shown inAppendix B).

3.5 QUESTIONNAIRE - RESULTS 25
1.0
1.5
2.0
2.5
3.0
3.5
4.0
4.5
5.0
Most Popular 2(Avg. Rating
Info.)
Genre Based 1(Genre Listing)
Word Of Mouth1 (Simple text)
Learn ByExample 2
(Similar Artists)
DescriptionBased 1
(Simple Text)
Lyrics Based 1(Simple Text)
Avg
. Use
fuln
ess
Rat
ing
FIGURE 3.8: The Screens With The Maximum Average Usefulness For Each Recom-mendation Method. Error Bars Show One Standard Deviation Above And Below TheMean. N = 18.
Technique Avg. St. Dev.Word of Mouth 1.9 1.3Genre Based 2.4 1.2Most Popular 2.8 1.3Learn By Example 3.3 1.0Description Based 4.6 1.0Lyrics Based 5.8 0.5
FIGURE 3.9: Average Ranking Given To Each Presentation Method. N = 18. TopRanking = 1. Bottom Ranking = 6.
In the Final Questions section, respondents also indicated the weight they would want to place on each
technique if a combination of techniques was to be used. Figure 3.10 shows the average weight (0-100)
chosen for each method. Note that respondents could choose any value0-100 for each technique. For
example, Participant 6 gave Most Popular a weight of 30, Genre Based aweight of 80, Social Filtering
a weight of 90, Learn By Example a weight of 70, Description Based a weight of 30 and Lyrics Based a
weight of 0. We now discuss these results.
Social Filtering: This method had the highest average ranking (1.9, where 1 is the ) and had
high average usefulness scores, but, surprisingly, it had the secondhighest average contribu-
tion, with a weight of 68. Six people indicated that Social Filtering should havethe most
contribution, but low scores from other respondents caused this technique to receive a lower
average contribution score than Genre Based. Social Filtering (Simple Text) was the highest
rated Social Filtering screen. This screen had the highest average usefulness rating (4.4/5)
of all screens shown in the questionnaire. The next highest rated Social Filtering screen was

3.5 QUESTIONNAIRE - RESULTS 26
0
10
20
30
40
50
60
70
80
90
100
Most Popular Genre Based Word of Mouth Learn ByExample
DescriptionBased
Lyrics Based
Avg
. Wei
gh
t
FIGURE 3.10: Average Response For Contribution That Each Method Should MakeTo A Combination Of Recommendation Methods. Error Bars Show One Standard De-viation Above And Below The Mean. N = 18.
the Simple Graph screen with an average of 3.9/5. Although Social Filtering (Similar Users)
had an average usefulness score of 3.1/5 (the lowest for all Social Filtering screens), four re-
spondents commented that they thought the Social Filtering (Similar Users) screen was useful
because it allowed you to view similar users and their profiles. One respondent commented
that Social Filtering "is a great way to recommend new music." A further two people com-
mented that this method would be useful, as long as similarity between users was calculated
accurately. Another person commented that they did not like the idea of opposite users factor-
ing in their recommendations. Finally, another commented that they would like to be able to
indicate friends that have similar interests and are already using the recommender system.
Genre Based:This method received the highest average contribution score (76) — six people
indicated that this technique should have the most contribution. It was also given the second
best average ranking (2.4/5). However, one respondent did mention that he thought classifying
items by genres was too broad. The Genre Based (Simple Text) screen hadthe second highest
average usefulness (4.1/5) of all screens presented in the questionnaire, and the two Genre
Based screens both had average scores of 4 or more. Two people commented that they thought
Genre Based (Genre Listing) was the best Genre Based screen as it provided more information.
Learn By Example: This method had an average contribution score of 58 and only two people
indicated that this method should have the highest contribution. This method wasgiven an
average ranking of 3.3, the fourth highest average ranking. The SimilarArtists screen had the
highest average usefulness score of the Learn By Example screens,with an average usefulness

3.5 QUESTIONNAIRE - RESULTS 27
of 4.0/5 — the third highest average usefulness score. One respondent commented that they
doubted whether similarity between artists could be calculated objectively.
Most Popular: Five respondents commented that they would not necessarily be interestedin the
the most popular items. However, Most Popular had the second highest average contribution
score, with 68, and seven people indicated that Most Popular should have the most contribution.
Most Popular was also given an average ranking of 2.8, which was the third best average rank-
ing. The two screens displaying Most Popular recommendations — Most Popular (Ranking)
and Most Popular (Avg. Rating Info.) — had average scores of 3.5/5 and 3.4/5 respectively.
Description Based: This method scored 41 average contribution and had the second worst av-
erage ranking. Respondents viewed only one screen that presented Description Based recom-
mendations. This screen had an average usefulness rating of 2.7/5, the second lowest average
usefulness score. Nine people commented that they doubted the usefulness of using descrip-
tions to make recommendations. Four of these people commented that descriptions are too
subjective to be useful.
Lyrics Based: This method scored 12 average contribution and had the worst average ranking.
Respondents viewed only one screen that presented Lyrics Based recommendations. This
screen had an average usefulness rating of 2.2/5, the lowest average usefulness score. Nine
respondents commented that they didn’t think lyrics would be useful for making recommenda-
tions. Seven of these commented that lyrics did not determine whether they likedan item.
Findings.
• Social Filtering and Genre Based were judged by respondents to be the most useful techniques.
This is supported by the fact that these two methods both had either the first or the second best
average score on every question.
• Respondents were less interested in having Most Popular recommendationsdelivered on their
own than they were in having this recommendation method combined with other techniques.
We can see this because this method had the second highest average weight in the question
regarding how techniques should be combined. However, five respondents commented that
they were not interested in just the most popular items.
• Respondents did not think that Description Based or Lyrics Based would be useful. This is
shown by the fact that these two methods consistently had the lowest average scores for each
question.

3.5 QUESTIONNAIRE - RESULTS 28
• Social Filtering (Simple Text), Genre Based (Simple Text), Most Popular (Ranking) and Learn
By Example (Simple Text) were all judged by respondents to be the most useful screens for
their particular recommendation techniques.
• Genre Based (Simple Text) and Genre Based (Genre Listing) were approximately equally use-
ful (their average usefulness scores were quite similar) and each offered a different form of
useful information.
• Most Popular (Avg. Rating Info.) and Most Popular (Ranking) were approximately as useful
as one another (their average usefulness scores were quite similar) andeach offered a different
form of useful information.
• Some users would find the Social Filtering (Similar Users) screen useful. This screen did not
receive a high average usefulness score, but four respondents commented that they liked the
ability it provided to examine the ratings of similar users.
Implications for the prototype.
• Social Filtering and Genre Based should be included as recommendation techniques.
• Most Popular should be included as an optional recommendation technique,or one which can
be combined with other techniques.
• Learn By Example should also be included as a recommendation technique, asit was not found
to be significantly less useful than the top three recommendation techniques.
• Description Based and Lyrics Based shouldnot be included in the prototype.
• Social Filtering (Simple Text), Genre Based (Simple Text), Most Popular (Ranking) and Learn
By Example (Simple Text) should all be included as explanation screens in the prototype.
• Genre Based (Simple Text) and Genre Based (Genre Listing) should be combined into a single
explanation screen, as their average usefulness scores were similar and each displays a different
piece of information which would be useful to users. Further, these two screens could easily
be combined without causing conflicting information to be displayed. For the same reasons,
Most Popular (Avg. Rating Info.) and Most Popular (Ranking) should also be combined.
• Social Filtering (Similar Users) should be considered for implementation in the prototype.

3.5 QUESTIONNAIRE - RESULTS 29
3.5.2 Understanding
This section discusses the questionnaire results relevant to the aim of: assessing understanding of rec-
ommendations provided using various recommendation techniques.
In Part B of the questionnaire, respondents rated their understanding of the 18 screens that presented
recommendations. The screens that had the maximum average understanding for each technique are
presented in Figure 3.11, along with their average rating (Error bars show one standard deviation above
and below the mean. Actual results for each respondent shown in Appendix B). For example, from five
Social Filtering screens presented in the questionnaire, the one with the highest average understanding
rating was the Simple Text screen, so this is shown in Figure 3.11 (3rd bar from the left).
1.0
1.5
2.0
2.5
3.0
3.5
4.0
4.5
5.0
Most Popular 2(Avg. Rating
Info.)
Genre Based 1(Genre Listing)
Word Of Mouth1 (Simple Text)
Learn ByExample 1
(Avg. RatingInfo.)
DescriptionBased 1
(Simple Text)
Lyrics Based 1(Simple Text)
Avg
. Un
der
stan
din
g R
atin
g
FIGURE 3.11: The Screens With The Maximum Average Understanding For Each Rec-ommendation Method. Error Bars Show One Standard Deviation Above And BelowThe Mean. N = 18
In Part B of the questionnaire, respondents also rated their understanding of four recommendation tech-
niques before and after they saw the screens for that technique. Figure 3.12 shows the average ranking
given to each technique, with error bars showing one standard deviationabove and below the mean (ac-
tual results for each respondent shown in Appendix B). We now discuss the results shown in Figures
3.11 to 3.12.
Social Filtering: Social Filtering (Simple Text) had the highest average understanding of all the
Social Filtering screens, with 4.6/5, which was the second highest average score given to any of
the Social Filtering screens. The Social Filtering (Simple Graph) screen (average of 4.5/5) and
the Social Filtering (Table) screen (average of 4.3/5) both also received high average scores for
understanding. Both Social Filtering (Graph w/ Opposites) and Social Filtering (Similar Users)

3.5 QUESTIONNAIRE - RESULTS 30
1.0
1.5
2.0
2.5
3.0
3.5
4.0
4.5
5.0
5.5
Most Popular Genre Based Word Of Mouth Learn By Example
Avg
. Un
der
stan
din
g R
atin
g
BeforeExplanations
AfterExplanations
FIGURE 3.12: Respondents’ Average Understanding Of Recommendation MethodsBefore And After Explanations. Error Bars Show One Standard Deviation Above AndBelow The Mean. N = 18
showed ‘opposite users’ in their explanation, but three users said that they were confused by
the ‘opposite users’ concept, and these screens had the lowest average ratings from all of the
Social Filtering screens in the questionnaire (Social Filtering (Similar Users)averaged 3.9/5
and Social Filtering (Graph w/ Opposites) averaged 3.8/5 — these were theonly average scores
that were below 4.0).
Social Filtering was given the highest average understanding rating before explanations
were provided (average of 4.4/5). However, after explanations wereprovided, the average
for this technique dropped to 3.9/5 — the lowest average understanding rating. As mentioned
above, three respondents commented that ‘opposite users’ had confused them and a further two
people commented that the explanations contained too much information and wereconfusing.
Genre Based:Two Genre Based screens were presented in the questionnaire, Genre Based (Sim-
ple Text) received the highest average understanding of all the explanation screens — 4.7/5.
Genre Based (Genre Listing) also received a high average understanding rating of 4.6/5 — the
third highest average understanding given to any of the 18 explanation screens. One respondent
commented that Genre Based (Simple Text) was the better of the two Genre Based screens as
it gave "more information about the individual artist and not just a genre". However, another
commented that Genre Based (Genre Listing) was better, as it was more related to his ratings
and profile.
Genre Based actually received the lowest average understanding rating before the expla-
nation screens were provided (average of 4.2/5). Remarkably, after explanations, the average
usefulness rating for this method increased to 4.8/5. Eight people gave this method a higher

3.5 QUESTIONNAIRE - RESULTS 31
understanding rating after viewing the explanation screens, ten gave it thesame rating, and no
respondents gave it a lower rating.
Learn By Example: Learn By Example (Simple Text) had the highest average understanding
rating of the two Learn By Example screens presented in the questionnaire. Learn By Example
(Simple Text) had an average of 4.2, which was just higher than the average of 4.1/5 for Learn
By Example (Similar Artists).
Learn By Example had the equal highest average understanding (4.4/5)before explanation
screens were presented. However, this dropped to an average of 4.1/5 after respondents viewed
the explanation screens — this was the second lowest after-explanation average. Only one
respondent gave Learn By Example a higher understanding rating afterexplanations, fourteen
gave it the same rating and three gave it a lower understanding rating.
Most Popular: The Most Popular screen with the highest average rating was Most Popular
(Ranking), with a score of 4.7/5 (which was the highest average understanding across all the
explanation screens). However, Most Popular (Avg. Rating Info.) also received a score of
4.5/5. Five people commented that Most Popular (Ranking) made recommendations easier to
understand as it gave more information. One person commented that he wouldlike comments
from users about that item to be added to the screen, indicating why they liked or disliked it.
Figure 3.12 shows that this method improved from an average understanding of 4.3/5 be-
fore explanations to an average of 4.6/5 after the viewing of explanation screens. The average
understanding rating for Most Popular after explanations is the second highest average under-
standing score shown in Figure 3.12. Four respondents gave Most Popular a higher under-
standing rating after explanations, twelve respondents gave it the same rating and two gave it a
lower understanding rating.
Description Based: Respondents viewed only one screen that presented Description Basedrec-
ommendations. This screen had an average understanding rating of 4.0/5,which is the lowest
of all the scores shown in Figure 3.11. Four respondents gave this methoda score of 3 or less.
This method is not shown in Figure 3.12 because once the first five respondents had com-
pleted the questionnaire, respondents were no longer asked to report their understanding of this
method before and after viewing its screens. This decision was made because this method had
been given low usefulness and low understanding scores by the first five respondents.
Lyrics Based: Respondents viewed only one screen that presented Lyrics Based recommenda-
tions. This screen had an average understanding rating of 4.1/5, which isthe second lowest of
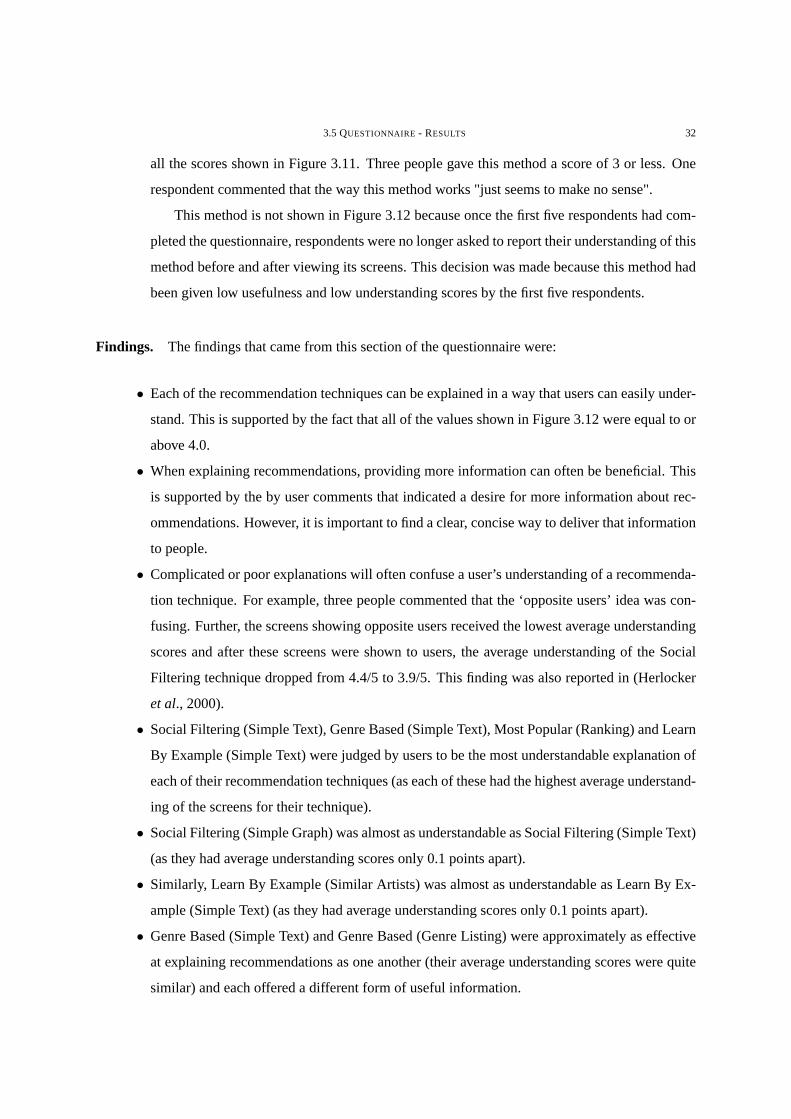
3.5 QUESTIONNAIRE - RESULTS 32
all the scores shown in Figure 3.11. Three people gave this method a scoreof 3 or less. One
respondent commented that the way this method works "just seems to make no sense".
This method is not shown in Figure 3.12 because once the first five respondents had com-
pleted the questionnaire, respondents were no longer asked to report their understanding of this
method before and after viewing its screens. This decision was made because this method had
been given low usefulness and low understanding scores by the first five respondents.
Findings. The findings that came from this section of the questionnaire were:
• Each of the recommendation techniques can be explained in a way that userscan easily under-
stand. This is supported by the fact that all of the values shown in Figure 3.12 were equal to or
above 4.0.
• When explaining recommendations, providing more information can often be beneficial. This
is supported by the by user comments that indicated a desire for more informationabout rec-
ommendations. However, it is important to find a clear, concise way to deliverthat information
to people.
• Complicated or poor explanations will often confuse a user’s understanding of a recommenda-
tion technique. For example, three people commented that the ‘opposite users’ idea was con-
fusing. Further, the screens showing opposite users received the lowest average understanding
scores and after these screens were shown to users, the average understanding of the Social
Filtering technique dropped from 4.4/5 to 3.9/5. This finding was also reported in (Herlocker
et al., 2000).
• Social Filtering (Simple Text), Genre Based (Simple Text), Most Popular (Ranking) and Learn
By Example (Simple Text) were judged by users to be the most understandableexplanation of
each of their recommendation techniques (as each of these had the highestaverage understand-
ing of the screens for their technique).
• Social Filtering (Simple Graph) was almost as understandable as Social Filtering (Simple Text)
(as they had average understanding scores only 0.1 points apart).
• Similarly, Learn By Example (Similar Artists) was almost as understandable as Learn By Ex-
ample (Simple Text) (as they had average understanding scores only 0.1 points apart).
• Genre Based (Simple Text) and Genre Based (Genre Listing) were approximately as effective
at explaining recommendations as one another (their average understanding scores were quite
similar) and each offered a different form of useful information.

3.5 QUESTIONNAIRE - RESULTS 33
• Most Popular (Avg. Rating Info.) and Most Popular (Ranking) were also approximately as
effective at explaining recommendations as one another (their average understanding scores
were quite similar) and each offered a different form of useful information.
• The inclusion of the ‘opposite users’ concept negatively affected users’ perceived understand-
ing of the Social Filtering (Similar Users) screen. This is supported by the fact that four re-
spondents commented that the ‘opposite users’ concept confused their understanding of Social
Filtering.
• People found Learn By Example to be harder to understand than techniques such as Most
Popular, Genre Based and even Social Filtering. This is surprising as one of the benefits often
noted for the Learn By Example technique is the "potential to use retrieved cases to explain
[recommendations]" - (Cunninghamet al., 2003), p 1.
• Different people prefer different styles of explanation. Evidence supporting this finding in-
cludes the fact that different users rated their understanding of different explanation screens
higher than others.
Implications for the prototype.
• Social Filtering (Simple Text), Genre Based (Simple Text), Most Popular (Ranking) and Learn
By Example (Simple Text) should all be included as explanation screens in the prototype.
• Learn By Example (Simple Text) and Learn By Example (Similar Artists) should becombined
into a single explanation screen, as their average understanding scoreswere similar and each
displays a different piece of information which would be useful to users.Further, these two
screens could easily be combined without causing conflicting information to bedisplayed.
• The case for combining Most Popular (Avg. Rating Info.) and Most Popular (Ranking) and
Genre Based (Simple Text) and Genre Based (Genre Listing) is also strengthened by these
results, as each of these pairs had similar average understanding ratings.
• Social Filtering (Similar Users) should be included in the prototype, without any reference to
‘opposite users’. This is because the ability to view similar users was deemed useful by some
respondents, and the ratings for this control may have been negatively affected by the fact that
it displayed ‘opposite users’ — a concept which consistently confused people.

3.5 QUESTIONNAIRE - RESULTS 34
3.5.3 Understanding And Usefulness
The Pearson Correlation was calculated between the ratings that respondents gave for the usefulness of
particular explanation screens and the ratings that they gave for their understanding of these screens.
This correlation was calculated to be 0.28. Squaring this value gives 0.078,or 7.8 percent. This suggests
that a user’s understanding of a recommendationdoesaffect how useful they deem it to be. In fact, this
value suggests that 7.8 percent of a user’s opinion on the usefulness of a recommendation technique is
determined by how well they understand that recommendation. This result is confirmed by a number
of cases that were observed within the questionnaire. Particularly significant were the cases in which a
user’s understanding was confused by complicated concepts within explanations. This often caused a
decrease in both the user’s understanding rating and their usefulness rating for that screen.
Findings.
• A user’s opinions on the usefulness of recommendations are related to theirunderstanding of
these recommendations.
3.5.4 Control
This section discusses the questionnaire results relevant to the aim of: assessing users’ attitudes toward
features that provide control over recommender techniques and their understanding of how these would
be used.
In Part B of the questionnaire, respondents rated three control features according to how well they
understood each control, how useful they thought each control wouldbe and how likely they would be
to use that control. Figure 3.13 shows the average score for each of these questions, with error bars
showing the one standard deviation above and below the mean (actual results for each user shown in
Appendix B).
Genre Based Control (Genre Slider):This control had the highest average scores for under-
standing (4.9/5), usefulness (4.5/5) and likelihood of use (4.6/5). All buttwo respondents gave
this control a 5 for understanding; the other two respondents gave it a 4.All but three people
gave this control a 5 for how likely they would be to use it, and all but one users gave this
control a rating of 4 or 5 when asked how useful they thought it would be. Further, seven users

3.5 QUESTIONNAIRE - RESULTS 35
1.0
1.5
2.0
2.5
3.0
3.5
4.0
4.5
5.0
Genre BasedControl
Word OfMouth
Control 1(Ignore User)
Word OfMouth
Control 2(Adjust
Influence)
Avg
. Rat
ing Understanding
Use
Likelihood Of Use
FIGURE 3.13: Average Ratings For Questions Regarding Respondents’ Understand-ing, Likelihood Of Using And Perceived Usefulness Of Each Control Feature. ErrorBars Show One Standard Deviation Above And Below The Mean. N = 18
commented that they strongly liked this control. One respondent commented thatthey would
like to specify interest in more specific genres (i.e. sub-genres), but another commented that
they thought too many genres would become confusing for users.
Social Filtering Control (Like/Not Like): This control had the second highest average scores
on all questions. Its average ratings were 4.6/5 for understanding, 3.5/5for likelihood of use
and 4.3/5 for usefulness. All but two respondents gave this control a rating of 4 or 5 for
understanding, and the other two gave a rating of 3. Most users also gave this control a rating
of 4 or 5 for usefulness. However, there was much more variation in the likelihood of use
ratings for this control. In fact, this question had the second highest standard deviation (1.3)
of any question asked about the three controls and responses to this question were distributed
relatively evenly between 1 and 5.
Social Filtering Control (Adjust Influence): This control had the lowest average scores for all
questions. Social Filtering Control (Adjust Influence) had an average understanding rating of
3.8, likelihood of use rating of 3.0 and usefulness rating of 3.4. This method asked users to
adjust the impact of ‘opposite users’ upon recommendations. As mentioned insection 3.5.2,
three users commented that the concept of ‘opposite users’ was confusing, and the average
understanding ratings for the Social Filtering technique fell when this concept was introduced.
The ratings given to this method were highly varied — three people responded with a 5 for the
usefulness of this control usefulness and 5 for their likelihood of using it,yet three others gave
scores of only 1 or 2 for both of these questions (each of these three gave lower ratings for
their understanding of the Social Filtering technique once the concept of ‘opposite users’ was

3.5 QUESTIONNAIRE - RESULTS 36
introduced.e three gave lower ratings for their understanding of the Social Filtering technique
once the concept of ‘opposite users’ was introduced.
Findings.
• The Genre Based Control (Genre Slider) would get used often and would be easy to understand.
Further, respondents also believed that it would be very useful. Thesefindings are supported
by the fact this control received the highest average usefulness scores, and most users gave a
rating of 4 or 5 for all questions regarding this control.
• It is important to get the number of available genres correct when allowing users to specify
their interest in genres. This is supported by the fact that many users users commented that
having too many genres would be overwhelming.
• Social Filtering Control (Like/Not Like) is easy to understand (most usersgave a rating of 4 or
5 for understanding). It would be used by some, but not all users (asthere was a high variation
in likelihood of use ratings). Further, most users would find this control to be quite useful
(most users gave 4 or 5 for usefulness).
• In general, most users would not understand how Social Filtering Control (Adjust Influence)
works and most users would not use it. Most respondents believed that this control would not
be very useful. These findings are supported by the fact that this control scored the lowest
average rating in every question and three users commented that they wereconfused by the
opposite users concept, which is a part of Social Filtering Control (Adjust Influence).
Implications for the prototype. Based upon these findings, it was decided:
• To include Genre Based Control (Genre Slider) in the prototype. It is important that the right
number of genres is used with this control. The number of genres should not be too large (as
this may become overwhelming) and should not be too small (as this may not be useful).
• To include Social Filtering Control (Like/Not Like) in the prototype. This control may not be
rated highly by all users, but it is worth testing its effectiveness in a real prototype.
• Not to include Social Filtering Control (Adjust Influence) in the prototype.

3.5 QUESTIONNAIRE - RESULTS 37
3.5.5 Presentation Method
This section discusses the questionnaire results relevant to the aim of: assessing users’ preferences for
recommendation presentation format.
In Part A of the questionnaire, respondents rated their understanding and opinion on the usefulness of
two presentation methods: Map Based and List Based. Figure 3.14(a) shows the average score for each
of these questions, with error bars showing the one standard deviation above and below the mean. Users
also indicated their preference for the way in which they would like recommendations to be displayed.
Figure 3.14(b) shows the sums of responses to this question. The actual results for each user shown in
Appendix B.
1.0
1.5
2.0
2.5
3.0
3.5
4.0
4.5
5.0
List Map
Avg
. Rat
ing
Understanding
Use
(a) Understanding And Usefulness Of Presentation Meth-ods
0
2
4
6
8
10
12
List Only Both ListAnd Map
Map Only
Su
m o
f P
refe
ren
ces
(b) Sum Of Recommendation PresentationPreferences.
FIGURE 3.14: User’s Responses For Questions Regarding Recommendation Presenta-tion Methods. Error Bars Show One Standard Deviation Above And Below The Mean.N = 18
Ten users indicated that they would prefer to have only List Based presentation. Four of these users
commented that List Based is quicker to understand and read. These comments are supported by the
results shown in Figure 3.14. This shows that List Based had an averageunderstanding rating of 4.7/5,
exactly one point higher than the average understanding rating for Map Based, which was 3.7/5. In addi-
tion, seven users commented that the map took longer to work out. However, List Based and Map Based
had similar average usefulness scores — List Based scored an average of 3.8/5 and Map Based had an
average of 3.5/5. Two users indicated that they would like to have recommendations presented through
a Map Based only and six users indicated that they would like to have recommendations displayed as
in both List Based and Map Based formats. Four users commented that the mapgave more information
and was useful for that reason.

3.5 QUESTIONNAIRE - RESULTS 38
Findings.
• Most users would find a List Based presentation easier to understand and quicker to read than
a Map Based presentation. This is supported by the fact that users commented that a list based
presentation is quicker and easier to read and by the fact that the List Based presentation scored
a higher average understanding rating than Map Based.
• In general, users indicated they would find a List Based presentation useful. This is evidenced
by the fact that 16/18 respondents indicated that they would want List Based as a part of their
recommendation system and this presentation received the highest average usefulness score.
• Some users indicated they would also find a Map Based presentation to be useful. Evidenced
supporting this finding includes that 8/18 users indicated that they would want a Map Based
presentation included in a recommender.
• Different people prefer different styles of presentation. This was shown through the variation
in the ratings that were given for the questions regarding presentation.
Implications for the prototype. Based upon these findings, it was decided:
• To definitely include a List Based presentation in the prototype.
• That there was enough enough support for the usefulness of a Map Based presentation to
include it in the prototype to examine how users would interact with an implementationof a
Map Based presentation.
3.5.6 Final Questions
This section discusses the results from the final questions asked of users, that gave an overall indication
of their opinion of the various features shown in the questionnaire.
In the Final Questions section of the questionnaire, respondents rated thegeneral usefulness of five
features that could be included in a recommender system. Figure 3.15 showsthe average ratings for
each of these features, with error bars showing the one standard deviation above and below the mean.
Choice Of Recommendation Method:The average rating for the usefulness of the system de-
ciding what recommendation method should be used was 3.6/5. Most people gave this feature a
rating of 3 or more, but one person gave this feature a rating of 1, while giving all other features
mentioned in this section a rating of 5. The average rating for this feature wasmuch lower than

3.5 QUESTIONNAIRE - RESULTS 39
1.0
1.5
2.0
2.5
3.0
3.5
4.0
4.5
5.0
System ChoosesReco. Method
System ChoosesCombination OfReco. Methods
View Results FromOther Reco.
Methods
Explanantions Controls
Avg
. Rat
ing
FIGURE 3.15: Average Rating For The Usefulness Of Possible Features Of A Recom-mender. Error Bars Show One Standard Deviation Above And Below The Mean. N =18
the average rating for the usefulness of having the system choose a combination of methods
(average of 4.6/5). There was very little deviation in the responses givento the usefulness of
the system selecting a combination of methods, with all respondents giving ratings of either 4
or 5. This feature had the highest average rating of all features presented in this section of the
questionnaire. Another feature with a high average usefulness rating was the ability to view
recommendations made using different recommendation techniques, which had an average of
4.5/5. One respondent commented that "viewing what your recommendationswould be like
with different methods allows you to compare the usefulness of each method and choose the
best one" and another commented that it would be "interesting and useful tosee what your
recommendations would look like using different methods."
Explanations: The average rating for the usefulness of explanations was 3.8/5 One respondent
commented that the addition of explanations "allows you to make your own judgments about
on the usefulness of the results." More than half of the respondents for this question gave
explanations a usefulness rating of 4 or 5.
Controls: The average rating given by users for the usefulness of controls was4.5/5. As noted in
Section 3.5.4, seven respondents commented that they had a strong liking forthe Genre Based
Control (Genre Slider)control. Twelve respondents rated the usefulness of controls as 5, four
users rated it as 4 and the remaining two gave controls a score of 2 and 1.
Findings.

3.6 TEST DATA 40
• Rather than having the system choose a single recommendation technique to use, people would
prefer to have the system choose a combination of recommendation techniques or allow them
to view recommendations using various techniques. This is supported by the fact that, on
average, users rated the usefulness of the ‘System chooses recommendation method’ feature
lower than the features that involved a combination of recommendation techniques and viewing
recommendations using different techniques.
• People in our study believed that explanations would be a useful addition to arecommender
system. This is evidenced by the fact that users gave an average of 3.8/5when asked to rate the
usefulness of explanations and more than half of the respondents for thisquestion gave a score
of 4 or 5.
• In general, people in our study believed that having control over a recommender system would
be very useful. This is supported by the fact that users gave an average of 4.5/5 when asked to
rate the usefulness of having control over a recommender system.
Implications for the prototype.
• The prototype should allow users to view recommendations produce using various techniques
and/or make recommendations using a combination of prediction techniques.
• The prototype should contain explanations for the recommendations that it produces. These
explanations should be offered to users if they are interested.
• The prototype should allow users to have control over certain elements of the recommender
system, to help them improve their recommendations.
3.6 Test Data
In order to perform evaluations at a later stage in the thesis, a source of test data needed to be established.
(Polcicovaet al., 2000), (Maltz and Ehrlich, 1995), (Konstanet al., 1997) and (Basuet al., 1998)
mention the fact that recommender systems are likely to exhibit poor performance unless they contain
a significantly large number of user ratings. As a result, the data set used for testing needed to be large
enough to allow effective recommendations to be made. In addition, the type and quantity of test data
that could be gained would heavily influence the process of creating and evaluating a prototype at later
stages of the project. An ideal set of test data for this project would havebeen a data set that contained
information about around 1000 users, detailing:

3.6 TEST DATA 41
• Their ratings for particular artists.
• The time that they spent listening to individual music tracks.
• The actions that they performed while listening to music tracks.
This mixture of music ratings information and listening patterns was desirable, asthis would allow
ratings generated from implicit data to be compared with each user’s explicit ratings. However, the
lack of sources for information regarding music ratings and listening patterns meant that it was not
possible to find a single data set containing both users’ explicit ratings and information about listening
habits. Further, it was not possible to find any significant source of information about actions users had
performed while listening to music. A dataset used in (Huet al., 2005) was identified as a possible
source of test data. This dataset is a collection of user’s ratings on for particular albums taken from the
epinions.com2 website. However, this dataset was inadequate for use in this project, as itwas deemed to
be too small to enable a recommendation system to produce good recommendations.
last.fm, an online radio service, was another source of data that was identified. This service makes large
amount of data on users’ play-counts available through a web service. Due to the large amount of data
available through this service, it was decided to use this to produce a dataset for use in investigating
Unobtrusive Recommendation. Reading data from this service produced an initial dataset of 500,000
play counts, spanning 10,000 artists and 5,000 users. This dataset was then culled (to get rid of the users
and artists that had few play-counts associated with them) to a size of 100,000 play-counts, spanning
3333 artists and 948 users. However, at this stage, the only source of test data that had been established
was implicit data based upon users’ listening patterns. This data would indeedbe useful for exploring
theUnobtrusive Recommendationquestion, yet it was not ideal for exploring theScrutability & Control
question. This is because, if scrutability and control features were to be added to a prototype that
made ratings based upon implicit data, then the performance of these features may be affected by the
fact that this was implicit and not explicit data. Therefore, a data set consisting of explicit ratings was
required in order to investigate theScrutability & Controlquestion. At this point, no significant source of
explicit music ratings was able to be located, and so, it was decided that the MovieLens standard dataset
(which provides explicit ratings on movies) should be used to investigate issues relating toScrutability
& Control. This dataset contains 100,000 ratings, from 943 users, on 1682 movies. Thus, two datasets
were chosen for use in this thesis — a dataset compiled from data taken fromlast.fm and the MovieLens
standard dataset.
2http://www.epinions.com

3.7 CONCLUSION 42
Implications for the prototype. The prototype will have to have two variants in order to separately
test the two goals of the thesis. These two variants would be:
• A prototype based upon the MovieLens standard dataset, that investigatedScrutability & Con-
trol.
• A prototype based upon the last.fm dataset that was created, that investigated Unobtrusive
Recommendation.
3.7 Conclusion
In order to investigate the areas ofScrutability & ControlandUnobtrusive Recommendation, an ex-
ploratory study conducted. This began with a Qualitative Analysis, that identified the Duine Toolkit as
the most appropriate code based for extension. This toolkit makes availablesix different recommenda-
tion techniques that could be used within a prototype system. A thorough examination of each technique
was then conducted to ascertain ways in which they could be explained and controlled. A number of
possible recommender usability features were brought to light through this analysis, and these, along
with existing recommender usability features, were investigated through the conduction of a question-
naire. Based upon the results of this questionnaire, a large number of findings could be gleaned about
the respondents in general. However, the data that was collected throughthis questionnaire was quite
rich, and demonstrated the individuality of each of the respondents. Particular respondents had prefer-
ences for different types of presentation and their answers clearly reflected this. This type of variance in
preferences makes a strong case for providing personalisation of presentations and explanations within
recommender systems.
• Each of the recommendation techniques can be explained in a way that userscan easily under-
stand.
• When explaining recommendations, providing more information can often be beneficial.
• Complicated or poor explanations will often confuse a user’s understanding of a recommenda-
tion technique.
• A user’s opinions on the usefulness of recommendations are related to theirunderstanding of
these recommendations.
• Social Filtering and Genre Based were judged by respondents to be the most useful recom-
mendation techniques.

3.7 CONCLUSION 43
• Respondents wanted the Most Popular recommendation technique to be combined with other
techniques.
• Respondents did not think that Description Based or Lyrics Based recommendation techniques
would be useful.
• Respondents believed that Social Filtering (Simple Text), Genre Based (Simple Text), Most
Popular (Ranking) and Learn By Example (Simple Text) screens were the easiest to understand
and most useful for their recommendation techniques.
• Some respondents had a strong interest in the ability to view the profiles of other similar users.
• Respondents indicated they would use the Genre Based Control (Genre Slider) often and that
it was easy to understand. Further, respondents believed that it would be very useful.
• Most respondents indicated they would find a List Based presentation easier to understand
and quicker to read than a Map Based presentation. Most users indicatedthey would find a
List Based presentation useful and some users indicated they would also find a Map Based
presentation to be useful.
• Respondents indicated they like to have the system choose a combination of recommendation
techniques or allow them to view recommendations using various techniques.
• Respondents believed that explanations would be a useful addition to a recommender system.
• Respondents also believed that having control over a recommender system would be very use-
ful.
• Different users prefer different forms of presentation and explanation.
These findings meant that the prototype should:
• Include both List Based and Map Based presentations.
• Allow users to view recommendations produce using various techniques and/or make recom-
mendations using a combination of prediction techniques.
• Contain explanations for recommendations.
• Allow users to have control over certain elements of the recommender system.
• Allow users to view profiles for similar users to them.
• Include Social Filtering, Genre Based, Most Popular and Learn By Example recommendation
techniques.
• Include the following optional explanation screens:

3.7 CONCLUSION 44
– Social Filtering (Simple Text), Social Filtering (Simple Graph) and Social Filtering (Sim-
ilar Users)
– Combination of Genre Based (Simple Text) and Genre Based (Genre Listing)
– Combination of Most Popular (Avg. Rating Info.) and Most Popular (Ranking)
– Combination of Learn By Example (Simple Text) and Learn By Example (Similar Artists)
• Include the following controls:
– Genre Based Control (Genre Slider)
– Social Filtering Control (Like/Not Like)
Finally, two sources of test data were established for use in conducting simulations and evaluations at
a later stage in the thesis. The results of the investigations described in this chapter, along with the test
data that was acquired, would inform the construction of a prototype, described in Chapter 4.

CHAPTER 4
Prototype Design
4.1 Introduction
In order to investigate questions regardingScrutability & Control in recommender systems andUnob-
trusive Recommendation, a prototype was developed. This prototype would later be used to conduct
user evaluations and simulations to establish the usefulness of a number of unobtrusive user modeling
and usability features. The findings of the questionnaire described in Chapter 3 were used to guide the
construction of this prototype and ensure that only features that were likely to be of use in improving
recommendation quality would be included in the prototype.
Section 1 stated that this thesis aimed to investigate two main questions: theScrutability & Controlques-
tion and theUnobtrusive Recommendationquestion. However, each of these two are separate research
questions. If a prototype was created to investigate both of these questionsat once, it could be difficult
to link each of the findings of this study to one specific research question. So, it was decided that two
variants of our prototype should be created - one to investigate each of themajor research questions for
this project. Each of these prototype variants could then be evaluated separately and the results from
each evaluation would provide findings that would clearly be related to only one research question. The
prototype that we created to investigate these questions was called iSuggest.The two variants that we
created of this prototype were called iSuggest-Usability and iSuggest-Unobtrusive.
iSuggest-Usability incorporated the highest rated usability interface features from the questionnaire.
This version of the prototype made movie recommendations, based upon the MovieLens standard data
set. iSuggest-Usability would later be used to investigate theScrutability & Controlfor recommenders
through user evaluations.
45

4.2 USER’ S V IEW 46
iSuggest-Unobtrusive made music recommendations based upon the last.fm1 dataset described in Sec-
tion 3.6. It would be used to investigateUnobtrusive Recommendation. iSuggest-Unobtrusive incorpo-
rated the ability to automatically generate the ratings that a user would give particular items using only
unobtrusively obtained information. Specifically, this meant that it read the play-counts from a user’s
iPod and then automatically generated a set of ratings that a user would giveto particular artists. The au-
tomatically generated ratings were then used to produce recommendations forthat user. This prototype
aimed to generate ratings for a user in a way that was accurate, but was also easy for them to understand.
iSuggest-Unobtrusive would later be used to investigate theUnobtrusive Recommendationthrough both
user evaluations and statistical evaluations.
This chapter describes the functions that each prototype variant made available to users, it then describes
the architecture of each of the two variants.
4.2 User’s View
The basic iSuggest prototype showed users the standard type of interface that is used within most current
recommender systems. A user’s first interaction with the basic iSuggest system was to create an account
within iSuggest and then log in. Users could then view three basic screens:
Rate Items: Showed the items that the user had not yet rated and could still enter a rating for.
My Ratings: Showed the items that the items that the user had rated, and the rating that the user
had given each item.
Recommendation List: Showed a list of the recommendations that the system had produced for
the user. 4.1 shows an example of this screen.
Each of these screens used a standard List Based presentation style, as suggested by the study reported
in Chapter 3. Users were able to click to view more information about any of theitems shown on any
of these screens. They could then click to search the Internet for more information about any of these
items (this linked to imdb.com2 for movie items and Amazon.com3 for music items). Users rated items
by clicking on the Star Bar (shown in Figure 4.2) and dragging their mouse to produce a rating between
0 stars (worst) and 5 stars (best) for each item. This basic prototype made all recommendations using a
1www.last.fm2www.imdb.com3www.amazon.com

4.2 USER’ S V IEW 47
single recommendation method — the Duine Toolkits default Taste Strategy (described in Section 3.3).
The Taste Strategy was chosen for use within the basic prototype as it is shown in (van Settenet al.,
2004) to be the most effective recommendation method available for use in the Duine Toolkit. In this
way, the basic iSuggest prototype utilised the optimum configuration of the Duine Toolkit and provided
a standard List Based presentation of information. The two prototype variants that would be used to
investigate the research goals of this thesis extended this basic prototype to incorporate new features and
enable these features to be evaluated.
FIGURE 4.1: List Based Presentation Of Recommendations
FIGURE 4.2: The Star Bar That Users Used To Rate Items
4.2.1 iSuggest-Usability
This version of the prototype extended the basic iSuggest prototype to incorporate all of the usability
features that the results of the questionnaire suggested would be usefuladditions to a recommender sys-
tem. This version of the prototype made movie recommendations, based upon theMovieLens standard
data set. When using iSuggest-Usability, users were presented with the following new usability and
interface features:
• Multiple recommendation techniques.

4.2 USER’ S V IEW 48
• Explanations for all recommendations that were produced.
• The ability to view a list of users similar to the current user.
• Control features that allowed the user to affect the recommendation process.
• A Map Based presentation of recommendations.
Each of these features is discussed in detail in the sections below.
Multiple Recommendation Techniques. Social Filtering, Genre Based, Most Popular and Learn By
Example recommendation techniques were all included as additional recommendation techniques that
could be used by iSuggest-Usability. These were included as the questionnaire suggested that users
would find these recommendation techniques to be the most useful. The questionnaire also suggested
that users would like a recommendation system to combine multiple techniques to makerecommenda-
tions and/or allow users to select which recommendation technique should be used. Thus, iSuggest-
Usability allowed users to select which of the five available methods (including thestandard Taste Strat-
egy) should be used to create recommendations. Users selected the recommendation technique to be
used by accessing an options screen that presented them with the five techniques. An example of this
screen is shown in Figure 4.3. Each of these techniques had a small description underneath its name to
describe how it functioned. Users selected one option from the list of recommendations and confirmed
this choice. This would cause the user’s recommendations to be replaced witha new set of recommen-
dations.
The questionnaire suggested that it would also have been desirable for iSuggest-Usability to enable
combinations of recommendation techniques to be used. However, this was deemed to be outside the
scope of the project.
Explanations. Every recommendation that was produced using the Social Filtering, GenreBased,
Most Popular or Learn By Example techniques was accompanied by an explanation that users could
view by clicking to see "More Info" about the recommended movie. The explanations provided to users
depended upon the recommendation technique that was used to create the recommendation. The way in
which recommendations from each technique were explained is described below.
Most Popular: The questionnaire suggested that the Most Popular (Avg. Rating Info.) and Most
Popular (Ranking) screens would be useful in explaining this technique tousers. Most Popular
was therefore explained using a combination of these two screens that displayed the amount of

4.2 USER’ S V IEW 49
FIGURE 4.3: Recommendation Technique Selection Screen. Note: The ‘Word OfMouth’ Technique Shown Here Is Social Filtering And The ‘Let iSuggestChoose’ Tech-nique Is The Duine Toolkit Taste Strategy
FIGURE 4.4: Explanation Screen For Genre Based Recommendations
FIGURE 4.5: Social Filtering (Simple Graph) Explanation Screen For Social FilteringRecommendations
users who had rated the recommended movie, the average rating these users had given to the

4.2 USER’ S V IEW 50
FIGURE 4.6: Explanation Screen For Learn By Example Recommendations
FIGURE 4.7: Explanation Screen For Most Popular Recommendations
movie and the rank that this movie therefore had in the database. The Most Popular explanation
screen is shown in Figure 4.7.
Genre Based:The questionnaire suggested that the Genre Based (Simple Text) and Genre Based
(Genre Listing) screens would be useful in explaining this technique to users. However, the
Genre Based (Genre Listing) screen showed users the average ratingthat they had given movies
within a particular genre. Unfortunately, this average is not used by the Genre Based technique
to create recommendations so using it to explain recommendations would not necessarily pro-
duce useful explanations. Rather, the Genre Based technique calculates a user’s interest in
particular genres and uses this to make recommendations. Hence, the explanation for the
Genre Based technique contained a listing of the genres that a movie belonged to and a link to
a screen where the user could view their calculated interest in each genre. The Genre Based
explanation screen is shown in Figure 4.4.
Social Filtering: The questionnaire showed that Social Filtering (Simple Text), Social Filtering
(Simple Graph) and Social Filtering (Similar Users) could all be useful waysto describe this
technique. However, these explanations could not easily be combined. Asa result, three
different types of Social Filtering explanations were provided to users —Simple Text, Graph
and Similar Users. Simple Text presented text indicating the number of similar users this
recommendation was based upon. Graph (shown in Figure 4.5) presentedtext indicating the
number of similar users that this recommendation was based upon and displayed a graph of
the number of users who ‘Liked This Movie’ and ‘Didn’t Like This Movie’.Finally, Similar
Users showed the names of the similar users who were most significant in the creation of this
recommendation and whether these users ‘Liked This Movie’ or ‘Didn’t Like This Movie’.
Users could then click to view the detailed profiles of these similar users.

4.2 USER’ S V IEW 51
Learn By Example: The questionnaire suggested that the Learn By Example (Simple Text) and
Learn By Example (Similar Artists) screens would be useful in explaining this technique to
users. Thus, Learn By Example was described using a combination of these two screens. This
combined screen listed the similar items that this recommendation was based upon (including
the rating that the user had given that item) and stated the average rating thatthis user had given
to these similar items. The Learn By Example explanation screen is shown in Figure 4.6.
Similar Users. This screen allowed a user to view a list of other users who the system believed were
the most similar to them. A user could then click to view the ratings given by each ofthe similar users
displayed in the list. This screen was included because the questionnaire suggested that users had a
strong interest in the ability to view the profiles of other similar users.
Control Features. The questionnaire suggested that control features would be a useful addition to a
recommender system. In particular, it was suggested that Genre Based Control (Genre Slider) and Social
Filtering Control (Like/Not Like) would be quite useful to users. As a result, these two features were
incorporated into iSuggest-Usability. These control features are detailedbelow.
FIGURE 4.8: The Genre Based Control (Genre Slider)
Genre Based Control (Genre Slider): (shown in Figure 4.8) This control screen displayed the
interest that the system had calculated the user had in each genre. Theseinterest levels were
displayed using slider bars and the users was able to manually adjust these sliders to indicate
their actual interest level in each genre.

4.2 USER’ S V IEW 52
FIGURE 4.9: The Social Filtering Control. Note: The actual control is the ‘IgnoreThisUser’ Link
Social Filtering Control: (shown in Figure 4.9) This control was integrated into all screens that
displayed similar users to the current user. On every screen where the system displayed the
details of a similar user, these details were accompanied by the option to ‘Ignore This User’.
Users could then choose to ignore a particular user if they felt that user was not similar to them.
This control feature was a slight variation upon the Social Filtering Controlscreen shown in
the questionnaire. The difference is that this feature no longer allowed users to confirm that
another user was indeed similar to them. This is because such a confirmation would not have
had any impact upon recommendations (as the system already believed that these two users
were similar).
Map Based Presentation. The questionnaire suggested that many users would find the option of a
Map Based presentation of recommendations to be useful. As a result, this form of presentation was
incorporated into the prototype. The Map Based presentation displayed itemsto users so that:
• Each movie on the map was shown as a circle and the name of the movie was written on that
circle.
• The closer that two circles were to one another, the more related they were (e.g. two very
closely related movies would appear right next to one another and two moviesnot related to
one another at all would appear far away from one another). Note: different relationships
between items existed for different map types, these are discussed below.
• If a user had seen an movie, it was coloured blue.

4.2 USER’ S V IEW 53
• If a user had not seen an movie, but their predicted rating for that movie was above 2.5 stars, it
was coloured a shade of green (darker green indicated a higher rating).
• If a user had not seen an movie, but their predicted rating for that movie was close to 2.5 stars,
it was coloured orange.
• If a user had not seen an movie, but their predicted rating for that movie was less than 2.5 stars,
it was coloured a shade of red (darker red indicated a lower rating).
• Users were allowed to zoom in and out on the map and move left, right up and down on the
map.
• Users could click on a particular circle to view more information about the movie that circle
represented.
Three variants of Map Based presentation were included in iSuggest-Usability. These variants were
included in order to investigate how useful users would find particular styles of Map Based presentation.
The details of each of these variants are described below.
FIGURE 4.10: Full Map Presentation — Zoomed Out View
Full Map: (shown in Figures 4.10 & 4.11) This map displayed all of the movies found in the
MovieLens dataset. Each movie on this map was placed close to the genres thatit belonged to.
The names of the genres that movies were divided into were displayed in largewriting on the
map.

4.2 USER’ S V IEW 54
FIGURE 4.11: Full Map Presentation — Zoomed In View
FIGURE 4.12: Similar Items Map Presentation
Top 100 Map: This map was exactly the same as the Full Map, except that to reduce clutter and
confusion on the map, it displayed only 100 movies. These 100 movies were the movies with
the highest predicted rating for this user.
Similar Items Map: (shown in Figure 4.12) This map showed the user a single focus item, sur-
rounded by a number of items. These items were described to users as beingrelated to the
focus item because the users who liked the focus item also liked these items. This map was

4.2 USER’ S V IEW 55
chosen for inclusion because it displays items in a similar to the way that liveplasma4) displays
items.
4.2.2 iSuggest-Unobtrusive
This version of the prototype extended the basic iSuggest prototype to incorporate the ability to generate
ratings using only unobtrusively obtained information about a user. iSuggest-Unobtrusive made use of
the play-counts that were stored on users’ iPods to automatically generate aset of ratings that these
users would give to particular artists. These ratings were then used to generate recommendations for
that user. When using iSuggest-Usability, users connected their iPod, then clicked to ‘Get Ratings
From My iPod’, ratings were then generated from the iPod connected to thesystem and an explanation
of the ratings generation was shown. Users could then see the ratings thathad been generated for
them and the recommendations that had been produced for them. Users were able to choose from three
different recommendation techniques — Random (which merely assigned a random number as the user’s
predicted rating for each item), Social Filtering and Genre Based.
The explanation of the ratings generation that was displayed is shown in Figure 4.13. It described the
number of ratings that had been generated. It also noted that artists the user listened to frequently had
been given a high rating and artists the user listened to less frequently received lower ratings. The con-
struction of the ratings generation algorithm and this explanation screen wasguided by the findings of
the questionnaire. A particularly important consideration was the suggestionthat complicated explana-
tions could confuse a user’s understanding and do more harm than good. Thus, this explanation screen
was designed to be simple for users to understand, yet still communicate effectively the way that ratings
had been generated.
FIGURE 4.13: The Explanation Screen Displayed After Ratings Generation
4http://www.liveplasma.com

4.3 DESIGN & A RCHITECTURE 56
4.3 Design & Architecture
The architecture of the basic prototype is shown in Figure 4.14, with components constructed during
this thesis marked in blue. The core components of the basic prototype were the iSuggest Controller,
the iSuggest Interface and the Duine Toolkit. The iSuggest Controller managed the iSuggest system,
allowing users to log in, submit ratings, set preferences and receive recommendations. It submitted any
ratings and preferences to the Duine Toolkit and decided when a user’srecommendations needed to
be updated. Such an update was required whenever a user changed their preferences or had submitted
a certain number of new ratings to the Duine Toolkit. The iSuggest Interfacemanages all of the user
interaction for the iSuggest system. This component was built using the Processing graphical toolkit
(available from http://processing.org/). The basic iSuggest Interface incorporates List Based presentation
screens that enable users to rate items and view recommendations. The iSuggest Interface submits the
users’ ratings and preferences to the iSuggest Controller and it receives new recommendations from
the iSuggest Controller whenever the user’s recommendations are updated. The Duine Toolkit receives
ratings and preferences from the iSuggest Controller and uses these,along with a Ratings Database to
generate recommendations when required.
��������������� � ����� ������������������������������������������ ����������� ������������������� ��� ! "##$%�&������'�������� ������'����������������(����� ��������(�����FIGURE 4.14: Architecture Of The Basic Prototype, With Components ConstructedDuring This Thesis Marked In Blue
4.3.1 iSuggest-Usability
iSuggest-Usability extended the basic prototype by adding scrutability and control features. This ver-
sion of the prototype made movie recommendations, based upon the MovieLensstandard data set. Fig-
ure 4.15 shows the architecture of iSuggest-Usability, with components constructed during this thesis
marked in blue.
The additional features included in this version of the prototype were:

4.3 DESIGN & A RCHITECTURE 57
)*+,-./0*+*1*/234-/+567+28954:;4<,2=2-/>2/+ 0*+*?2@ )*+,-./AB,/+,-.)*+,-./FIGURE 4.15: Architecture Of iSuggest-Usability, With Components ConstructedDuring This Thesis Marked In Blue
Map Based Presentation Screens:These presentation screens made use of the traer.physics5
and traer.animation6 libraries. The traer.physics library was used to create a simulated par-
ticle system. In such a system, all particles repel one another, and links holdparticles close
to one another. This particle system was used to determine the positions of items inthe Map
Based presentation. The Full Map and Top 100 Map maps began by placingall of the systems
movie genres onto the map as particles. Items were then placed one-by-one onto the map, and
each item would be linked to the genres that it belonged to. In this way, each item would be
repelled by all other items in the system, but it would stay close to the genres thatit belonged
to. The Similar Items Map used a different method to position items. This map calculated the
correlation between each movie and all other movies in the database in terms of the ratings
that users had given them. This map then displayed a single focus item, encircled by all of the
movies that had a high level of correlation with the focus item.
Similar Users Screen:This screen made use of the a list of similar users that was output from
the Social Filtering algorithm. It then displayed the users who were the most similar to the
current user (to a maximum of 9 similar users).
Control Features: These features received input from the user regarding their preferences and
forwarded this information to the iSuggest Controller. The iSuggest Controller then set these
preferences in the Duine Toolkit and updated the user’s recommendations.
Modified Recommendation Algorithms: The Social Filtering, Genre Based, Learn By Exam-
ple and Most Popular algorithms were all modified so that they attached extensive explanation
information to each recommendation that was made. This allowed the Explanation Screens to
5http://www.cs.princeton.edu/ traer/physics/6http://www.cs.princeton.edu/ traer/animation/

4.3 DESIGN & A RCHITECTURE 58
fully explain each of the recommendations. The Social Filtering and Genre Based algorithms
were also modified to make use of the user preferences that were set using control features.
Explanation Screens:These screens took the explanation information that was attached to each
recommendation and displayed this information in a way that the user should be able to under-
stand.
4.3.2 iSuggest-Unobtrusive
iSuggest-Unobtrusive extended the basic prototype by adding the ability to automatically generate a
user’s ratings from play-counts stored on their iPod. This version of theprototype made music recom-
mendations based upon the last.fm dataset. The architecture of iSuggest-Unobtrusive is shown in Figure
4.16, with components constructed during this thesis marked in blue.
CDEFGHIJDEDKDILMNGIEOPQELRSONT UDIEVWTXLIE JDEDYLZ CDEFGHI[\FIEFGHCDEFGHI[\]UDFGDEFNGI [\]UDFG^DEFNGIFIGURE 4.16: Architecture Of iSuggest-Unobtrusive, With Components ConstructedDuring This Thesis Marked In Blue
The additional features included in this version of the prototype were:
Ratings Generation Algorithm. This algorithm needed to be both accurate at generating ratings from
a users’ play-counts and easy to explain to users. The algorithm that waschosen to generate ratings
worked in the following way:

4.4 CONCLUSION 59
Input : Artists and play-counts from an iPod
Output : User’s ratings for artists found on the iPod
minimum count = min(play-counts)1
maximum count = max(play-counts)2
foreachartist on the iPoddo3
artist play-count = sum(play-counts from songs by this artist)4
normalized play-count = (artist play-count - minimum count) / (maximum count- minimum5
count)
new rating = (normalized play-count + 1) * 2.56
end7
Algorithm 1 : Ratings Generation Algorithm
On line 4, the the play-counts are normalized with reference to the other play-counts that exist on the
iPod. This places them on a scale of 0.0 – 1.0 Then, on line 5, these ratings are converted to a scale of
0.0 – 5.0. The minimum rating produced by this algorithm is 2.5, as this is a neutral rating, and the worst
that any artist on a user’s iPod should is neutral (as the mere fact that theartist is on their iPod implies
that the user has at least a neutral attitude toward that artist).
Explanation Screen. This screen took the explanation information that was provided by the ratings
generation algorithm and displayed this in a way that users should be able to understand.
4.4 Conclusion
To investigate the research goals of this project, a prototype called iSuggest was developed. This proto-
type was offered in two different versions, named iSuggest-Usability andiSuggest-Unobtrusive, each of
which was built to explore a separate research question. The basic iSuggest system was created to imitate
existing recommender interfaces and use the default Duine Toolkit recommendation technique (the Taste
Strategy). This basic prototype was extended to create the two prototype variants - iSuggest-Usability
and iSuggest-Unobtrusive.
iSuggest-Usability incorporated the highest rated usability interface features from the questionnaire.
This prototype made movie recommendations, based upon the MovieLens standard data set. It would

4.4 CONCLUSION 60
later be used to investigate the first research goal of the project throughuser evaluations. iSuggest-
Usability made the following functions available to the user:
Multiple Recommendation Techniques:The questionnaire suggested that the ability to choose
the recommendation technique to be used would be useful to users. Thus, iSuggest-Usability
allowed users to request that recommendations be produced using any offive different recom-
mendation techniques (Social Filtering, Genre Based, Most Popular, Learn By Example and
the Duine Toolkits Taste Strategy).
Explanations: Explanations were provided for all recommendations that were produced. Each
recommendation technique was explained using its highest rated explanation screen from the
questionnaire. Social Filtering was explained using three different explanation screens, each
of which were shown by the questionnaire to be useful.
Similar Users: Users were given the ability to view a list of the other users of the system who
were deemed to be the most similar to the current user. Users could view all ofthe ratings
entered by each similar user.
Control Features: These allowed the user to affect the recommendation process. The control
features implemented were the Genre Based Control (Genre Slider) and Social Filtering Con-
trol, as respondents of the questionnaire rated these highly.
Map Based Presentation Of Recommendations:This form of presentation was rated as use-
ful by many questionnaire respondents. Three different map based presentations were made
available to the user - Full Map, Top 100 Map and Similar Items Map.
iSuggest-Unobtrusive incorporated the ability to read the play-counts from a user’s iPod and then gener-
ate a set of ratings that user would give to particular artists. These ratingscould then be used to produce
recommendations for a user. This prototype made the following functions available to the user:
Automatic ratings generation: Users could have ratings automatically generated from the play-
counts on their iPod.
Ratings generation explanation:Every time that ratings were automatically generated by this
system, an explanation screen was shown to users that described how many ratings were gen-
erated and how these had been generated.
Recommendations using unobtrusive information:Recommendations were provided to each
user based upon the ratings that had been automatically generated. iSuggest-Unobtrusive made

4.4 CONCLUSION 61
use of the last.fm dataset, which contains only unobtrusively obtained information, to make
recommendations.
Once the construction of the prototypes was complete, each of them neededto be evaluated to investigate
the research goals of the project. The evaluation of these prototypes is described in Chapter 5.

CHAPTER 5
Evaluations
5.1 Introduction
In order to investigate the research goals for this thesis, the two versions of the prototype — iSuggest-
Usability and iSuggest-Unobtrusive — were evaluated. These evaluationsaimed to establish the ef-
fectiveness of the methods implemented in the prototype for providing scrutability, control and unob-
trusiveness. iSuggest-Usability was evaluated through a user evaluation, which was completed by 10
people. This evaluation aimed to investigate the effectiveness of explanations, controls and Map Based
presentations for improving explanations and providing scrutability. It alsoaimed to investigate how
users interact with these elements. iSuggest-Unobtrusive was evaluated through both a user evaluation
and statistical evaluations. These evaluations aimed to assess the ability of the prototype to generate
ratings from implicit data, and its ability to make useful recommendations using these ratings. Each of
these evaluations needed to be rigorously designed to ensure that it meaningfully and accurately tested
effectiveness and investigated users’ interactions with the prototype system. This chapter describes the
design of these evaluations and their results.
5.2 Design
In order to investigate the way in which users interact with recommender systems and the usefulness of
particularScrutability & Controlelements that we added to the two prototype systems that we developed,
we designed two user evaluations, one for each of the prototype systems that we produced. During the
completion of these evaluations, users were asked to answer questions about the usefulness of particular
aspects of the iSuggest-Usability. For each of these questions, 1 was the lowest score that could be
given, and 5 was the highest. Further, the evaluations were conducted through a process called a Think-
aloud (detailed in (Nielsen, 1993)), which involves asking users to verbalise their thought process while
62

5.2 DESIGN 63
making use of particular elements of a system. During the Think-aloud process, notes were made to
record the though processes expressed by users. Through the Think-aloud process, we aimed to discover
information about how users interacted with recommender systems and how useful they found particular
elements of the prototype that could not be captured by asking simple questions. The design of the two
user evaluations is described below.
5.2.1 iSuggest-Usability
The evaluations of the iSuggest-Usability were designed with the following goals in mind:
Goal 1: Investigate whether providing explanations for recommendations can improve the use-
fulness of these recommendations.
Goal 2: Investigate the most effective way to explain recommendations to users.
Goal 3: Investigate whether there is a trade-off between recommender usefulness and under-
standing of recommendations.
Goal 4: Investigate whether users can utilise control features to improve the quality of their rec-
ommendations.
Goal 5: Investigate whether a recommender system benefits from the introduction ofa map based
presentation.
Goal 6: Investigate the way in which users interact with a map-based style of presentation.
In order to achieve each of these goals, the user evaluations for the iSuggest-Usability consisted of
a Setup stage, Part A and Part B. Each user began by entering rating for movies at the Setup stage.
Following this stage, users were asked to complete the Part A and Part B stages, each of which asked
them to view recommendations and rate a number of different elements that were presented to them.
Finally, users were presented with a set of final questions to answer about their general opinion of
iSuggest-Usability. Part A presented users with a standard set of recommendation, with no additional
Scrutability & Control features at all. This stage was included in the evaluation in order to serve as
a control, to gauge the quality of the recommendations presented to users andto present them with a
standard method of recommendation, without anyScrutability & Control features. Part B presented
users with recommendations that incorporated theScrutability & Control elements of this prototype
and asked them to rate the recommendations and the usefulness of particularScrutability & Control
elements. In order to produce a Double Cross-over study, half of the participants in evaluations were

5.2 DESIGN 64
asked to complete Part A before Part B (Type 1), and the other half completed Part B before Part A
(Type 2). A full description of the details of each of the stages of the evaluation is included below (The
instructions that users followed during these evaluations can be found in Appendix C).
Setup. During this stage, users moved through a list of movies and rated any of the movies that they
had seen, according to how much they liked or disliked that movie. Users were asked to rate approx-
imately 30 movies, as this number of ratings meant that the user was still considered to be a new user
to the system, and thecold start problem for new userswould still be very apparent for this user. The
choice to simulate thecold start problem for new usersduring these user evaluations was motivated by
the fact that explanation and control features are both elements that we have added to our prototype
with the specific intention of: building users’ trust in the system, despite the quality of recommenda-
tions produced; aiding users in making better use of poor recommendations;and improving the quality
of recommendations that are produced by the system. Thecold start problem for new usersis a well
documented problem with recommender systems that causes such systems to produce poor recommen-
dations. Thus, simulating this problem should produce some poor quality recommendations and allow
us to assess the effectiveness of theScrutability & Controlelements that were added to this prototype.
Part A. During Part A of the user evaluations, users were presented with a list ofrecommendations that
were produced using the Duine Toolkit’s Main Strategy. These recommendations were presented to the
user without any form of explanation and users were offered no formof control over these recommen-
dations. Recommendations were presented to users in this form to show them that often recommender
systems do not provide theScrutability & Controlfeatures that were introduced with this prototype.
Part B. During this part of the user evaluations, users were presented with multiple sets of recom-
mendations, accompanied byScrutability & Controlfeatures such as explanations and controls. During
Part B, users were asked a number of questions in order to assess the usefulness of the recommendation
methods and theScrutability & Controlfeatures that were added to the prototype. Users were instructed
to select and use each of the different recommendation method in turn. Eachof these recommendation
methods was accompanied by a short explanation of how it worked, to giveusers some idea of how
recommendations would be produced. The questions that were presentedto the user during this stage
were divided into the following categories:

5.2 DESIGN 65
Recommender Usefulness:After each set of recommendations was presented, the user was
asked to rate how useful they found these recommendations.
Explanation Usefulness:The recommendations presented to users at this stage were each ac-
companied by an explanation, and users were asked to rate how useful they found that ex-
planation for helping them to understand and make use of the recommendationsthat were
provided. In the case of the Social Filtering recommendations, users werein fact presented
with three different forms of explanation for each recommendation and theywere asked to rate
each of these forms of explanation in turn.
Control Feature Usefulness:For the Genre Based and Social Filtering recommendations, users
were instructed to make use of specific control features that were intended to improve the
quality of recommendations. Users were then asked to rate how useful theyfound each control
feature for improving their predictions.
Map Usefulness:Users were presented with the three different Map Based presentations, Full
Map, Top 100 Map and Similar Items Map. They were asked to spend some time making use
of each Map Based presentation and then they were asked to rate its usefulness as a method
for viewing recommendations. In addition to asking users to rate each form of Map Based
presentation, the way in which users interacted with each of them was observed. This section
of the user trial focused on discovering whether users were interestedin having a map based
presentation of recommendations and if so, how such a presentation could most effectively be
created.
Final Questions. Upon completion of the user evaluations, users were asked five questions. They were
asked to rate the general usefulness of the explanations provided by thesystem and the usefulness of the
control features in improving recommendations. Users were also asked whether they would prefer a list
based presentation of recommendations, a map based presentation, or both. Finally, they were asked to
state what the best and worst features of the iSuggest prototype were.
Participants. In all, 10 people completed the evaluations of iSuggest-Usability. This is well beyond
the recommended minimum of 3 to 5 people for usability evaluations stated in (Nielsen, 1994). The
sample group for this evaluation was carefully selected to contain people from a variety of backgrounds
and both males and females. The majority (8/10) of the users who completed the questionnaire were
aged under 30, but modern recommender systems are used most often by people who fall in the 18-30
age range, so a higher proportion of respondents in this age range wasdeemed to be appropriate. Figure

5.2 DESIGN 66
5.1 shows demographical information about each of the participants, as well as indicating whether they
completed Part A first (Type 1) or Part B first (Type 2).
Group 1 Group 2Particpant Number 1 2 3 4 5 6 7 8 9 10Age 22 52 18 21 21 30 23 51 25 23Gender F M F F M M M F M FType 1 or 2 1 2 1 2 1 2 1 2 1 2
FIGURE 5.1: Demographical Information About The Users Who Conducted The Eval-uations Of iSuggest-Usability
5.2.2 iSuggest-Unobtrusive
The evaluations of the iSuggest-Unobtrusive were designed with the following goals in mind:
Goal 1: Investigate whether users’ play counts can be accurately mapped to their ratings.
Goal 2: Investigate whether effective recommendations can be made for users using only ratings
generated from play counts.
In order to achieve each of these goals, the user evaluations for the Usability Prototype consisted of
Parts A and B. The instructions that users followed during this evaluation can be found in Appendix E.
During Part A, ratings were generated for each user by applying the ratings generation algorithm, and
users were then asked to indicate how well they understood how these ratings had been generated and
how accurate the ratings were. Part B presented three sets of recommendations to users:
Random Recommendations:These recommendations were created by assigning a random num-
ber as the user’s predicted interest in each item. These recommendations were included to act
as a control, a reference point which could be used to judge the utility of the rest of the recom-
mendations presented to users.
Social Filtering Recommendations:These recommendations were created using the Social Fil-
tering recommendation technique. This technique was chosen for use as it was the top per-
forming algorithm on a set of statistical evaluations (the results of these statistical evaluations
are summarised in 5.4.1).

5.2 DESIGN 67
Genre Based Recommendations:These recommendations were created using the Genre Based
recommendation technique. This technique was chosen as it was the secondhighest perform-
ing algorithm on a set of statistical evaluations (the results of these statistical evaluations are
summarised later in this chapter, in Section 5.4.1).
For each set of recommendations, users were first presented with the listof recommendations, then they
were asked to spend as much time as they wanted assessing how useful theyfound the recommendations
that were provided. Users were then asked to give the recommendations aratings according to how
useful they were. In order to produce a Double Cross over study, five of the participants in evaluations
were shown Random Recommendations before Social Filtering and Genre Based Recommendations
(Type 1), and the other four were shown Social Filtering and Genre Based Recommendations before
Random Recommendations (Type 2). Once users had completed the trial, theywere also asked to
indicate whether or not they would like to have the ‘Get Ratings From My iPod’feature incorporated
into the iSuggest system.
Participants. In all, 9 people completed the evaluations of iSuggest-Unobtrusive. Theseusers were
not all the same users that completed the evaluation of iSuggest-Usability, though some users did com-
plete both evaluations. Again, the sample group for this evaluation was carefully selected to contain
people from a variety of backgrounds and both males and females. The majority (6/9) of the users
who completed the questionnaire were again aged under 30. Figure 5.2 shows demographic information
about each of the participants, as well as indicating whether they were shown Random Recommenda-
tions first (Type 1) or Social Filtering and Genre Based recommendations first (Type 2).
Participant: 1 2 3 4 5 6 7 8 9Age 18 52 20 51 19 21 20 23 31Gender F M F F M F M M FType 1 or 2 1 2 1 2 1 2 1 2 1
FIGURE 5.2: Demographical Information About The Users Who Conducted The Eval-uations Of iSuggest-Unobtrusive
Statistical Evaluations. In order to evaluate more thoroughly the ratings and recommendations that
were produced by iSuggest-Unobtrusive, a set of simulations were carried out, and statistical data was
collected during these simulations. An important issue in the execution of these simulations was the
choice of statistical measures for evaluating performance. The chosen measures needed to provide a
useful and reliable gauge of each systems performance. It was decided to evaluate the performance of

5.3 ISUGGEST-USABILITY EVALUATIONS — RESULTS 68
the ratings algorithm through the distribution of the ratings that were produced by that algorithm. This
distribution could then be compared to the distribution of ratings within the MovieLens standard dataset.
Evaluation of the usefulness of recommendations produced by iSuggest-Unobtrusive was slightly more
complicated. (Herlocker, 2000) provides an evaluation of a number of possible measures for evaluating
the usefulness of recommendations. This paper concluded that the MAE metric is an appropriate metric
for use in evaluating recommender systems. This metric judges the accuracy of the predictions that a
recommender system makes about a user’s level of interest in specific items. More accurate predictions
will lead to higher quality recommendations and thus, a better MAE will result in better recommenda-
tions. One of the advantages of calculating the MAE is the fact that this metric was also used in (van
Settenet al., 2002). This means that results from this simulation should be roughly comparable to the
results of this study. MAE measures the absolute difference between a predicted rating and the user’s
true rating for an item. The MAE is computed by taking the average value of this difference across the
entire system. The MAE of a system represents the overall accuracy of predictions (and thus recom-
mendations) made by that system. The standard deviation of the absolute error values (SDAE) is also
useful to compute, as this measure describes how consistently a system will produce reliable predic-
tions (and thus reliable recommendations). Thus, MAE and SDAE metrics wereused to evaluate the
iSuggest-Unobtrusive prototype.
5.3 iSuggest-Usability Evaluations — Results
This section reports the results of the evaluations of iSuggest-Usability. Theresults are reported in terms
of recommendation usefulness, explanations, control features and presentation method. At this point, it
is important to note that the average amount of ratings that were entered by users during evaluations was
27.1. This is only a small number of ratings for a user to have entered into a recommender system, so
thecold start problem for new usersexisted for each user during evaluations.
5.3.1 Recommender Usefulness
Users rated the usefulness of the six sets of recommendations produced.Figure 5.3 shows the average
score for each of the different techniques, with error bars showing one standard deviation above and
below the mean (actual results for each user shown in Appendix D). We now discuss these techniques
in order of average usefulness.

5.3 ISUGGEST-USABILITY EVALUATIONS — RESULTS 69
1.0
1.5
2.0
2.5
3.0
3.5
4.0
4.5
5.0
Duine MostPopular
GenreBased
GenreBased
(Revised)
SocialFiltering
Learn ByExample
Avg
. Use
fuln
ess
Rat
ing
FIGURE 5.3: Average Usefulness Ratings For Each Recommendation Method. ErrorBars Show One Standard Deviation Above And Below The Mean. N = 10
Genre Based (Revised):(average score of 3.9/5 after control features were used, ranked 1st).
The Genre Based recommendations were the lowest rated when first presented, with an average
score of 2.7/5. Five users gave their lowest rating to these recommendations and no users gave
their highest score. However, once users were given the chance to adjust their genre interests,
the average score for this method improved by 20% to 3.9/5. Seven people gave their highest
score to these revised recommendations, and only two did not (due to an error in copying the
questionnaire, one user did not give a rating for the revised Genre Based recommendations).
Learn By Example: (average score of 3.7/5, ranked 2nd). This method produced the largest
variation in user’s ratings, with most users rating this method above 3, yet others rating it as a
2. Despite the variation, this method had the second highest average score, and six users gave
this method their highest score.
Most Popular: (average score of 3.3/5, ranked 3rd). Three users rated this method highest and
two of these users spontaneously commented that they would be very interested in the movies
that were the most popular overall. In contrast, two other users rated this method lowest and
one user spontaneously commented that this recommendation method was unlikelyto ever
produce good recommendations for him, as he was not interested in popularmovies.

5.3 ISUGGEST-USABILITY EVALUATIONS — RESULTS 70
Duine: (average score of 3.1/5, ranked 4th). Most users were observed tofind that these recom-
mendations contained just a few items that were very interesting to them, among many that
they were uninterested in. Similar to the Most Popular method, three users rated Duine the
highest, and two users rated it lowest.
Social Filtering: (average score of 2.8/5, ranked 5th). Four users rated this method the lowest,
and although three users did give this method a score of 4/5, in general it was observed to often
recommend movies that were completely unsuited to the user’s tastes.
Discussion. Individuals differentiated the quality of the recommender techniques. However there was
no consistently superior technique: all methods were given at least one user’s highest rating, yet all
methods were also given at least one user’s lowest rating. This suggests the value of allowing users to
choose their recommendation method. Further, participants commented that the different recommenda-
tion methods could be useful for different tasks (e.g. one user commentedthat if he were in the mood
to see something quite mainstream, he would choose Most Popular recommendations. However, if he
were in the mood to see something more tailored to his own interests, he could choose Genre Based
recommendations). The fact that some users commented that they would be interested in Most Popular
recommendations, while others commented that they would not be is an example ofthe individuality of
users. Such individuality makes a case for providing personalisation of presentations and explanations
within recommender systems
Of significant interest is the fact that allowing users to adjust their genre interests improved recommen-
dations significantly, moving the Genre Based recommendations from the lowest rated to the highest
rated set of recommendations. The average rating for Genre Based recommendations increased by 20%
after the introduction of the Genre Control. This is strong evidence of the usefulness of control features
in recommender systems. Also interesting was the impact of thecold start problem for new userson the
performance of recommendation techniques. The learn algorithm was ratedhighly by users, indicating
that it is able to produce good recommendations even when users have entered few ratings. In contrast,
users rated the Social Filtering recommendations the second lowest, indicatingit produced poor rec-
ommendations. The poor performance of this recommendation algorithm was due to the its inability to
cope with such a small amount of ratings information. This serves as confirmation of the existence of
the cold-start problem in our evaluations. It is in this case, where the recommendations produced by the
social filtering algorithm are not good, that the explanations that are provided to users are quite crucial
— in order to help the user to decide how much trust to place in recommendations by allowing them to

5.3 ISUGGEST-USABILITY EVALUATIONS — RESULTS 71
1.0
1.5
2.0
2.5
3.0
3.5
4.0
4.5
5.0
MostPopular
GenreBased
SocialFiltering(Simple
Text)
SocialFiltering(Graph)
SocialExplain(SimilarUsers)
Learn ByExample
Avg
. Exp
lan
atio
n R
atin
g
FIGURE 5.4: Average Usefulness Ratings For Each Explanation. Error Bars ShowStandard Deviation. N = 10
understand how and why the system made a recommendation, especially if it is arecommendation that
the user feels is not useful.
5.3.2 Explanations
Users rated six explanation methods according to their usefulness for helping understand and use rec-
ommendations. Figure 5.4 shows the average score for each of the different explanations, with error
bars showing one standard deviation above and below the mean (actual results for each user shown in
Appendix D). We now discuss these explanations in order of average usefulness.
Most Popular: (average score of 4.0/5, ranked equal 1st). Seven people gave the Most Popular
explanation a score of 4 or more, and no users rated it below 3. However, one user did state
that he believed that the Most Popular recommendations were calculated using more than just
a simple average of the ratings given to each item — this belief was incorrect.
Social Filtering (Graph): (average score of 4.0/5, ranked equal 1st). This explanation had the
highest average rating of all the Social Filtering explanations. Seven users rated this explana-
tion highest and no users rated it lowest.
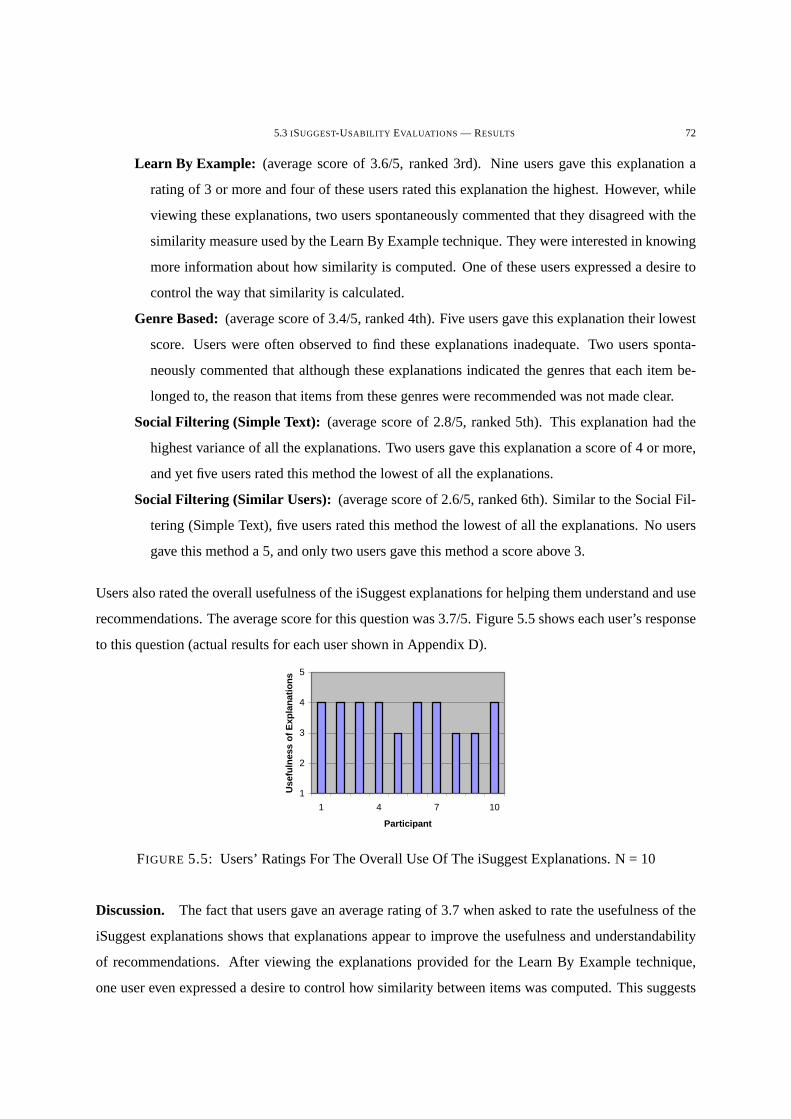
5.3 ISUGGEST-USABILITY EVALUATIONS — RESULTS 72
Learn By Example: (average score of 3.6/5, ranked 3rd). Nine users gave this explanation a
rating of 3 or more and four of these users rated this explanation the highest. However, while
viewing these explanations, two users spontaneously commented that they disagreed with the
similarity measure used by the Learn By Example technique. They were interested in knowing
more information about how similarity is computed. One of these users expressed a desire to
control the way that similarity is calculated.
Genre Based: (average score of 3.4/5, ranked 4th). Five users gave this explanation their lowest
score. Users were often observed to find these explanations inadequate. Two users sponta-
neously commented that although these explanations indicated the genres thateach item be-
longed to, the reason that items from these genres were recommended was not made clear.
Social Filtering (Simple Text): (average score of 2.8/5, ranked 5th). This explanation had the
highest variance of all the explanations. Two users gave this explanationa score of 4 or more,
and yet five users rated this method the lowest of all the explanations.
Social Filtering (Similar Users): (average score of 2.6/5, ranked 6th). Similar to the Social Fil-
tering (Simple Text), five users rated this method the lowest of all the explanations. No users
gave this method a 5, and only two users gave this method a score above 3.
Users also rated the overall usefulness of the iSuggest explanations for helping them understand and use
recommendations. The average score for this question was 3.7/5. Figure 5.5 shows each user’s response
to this question (actual results for each user shown in Appendix D).
1
2
3
4
5
1 4 7 10
Participant
Use
fuln
ess
of
Exp
lan
atio
ns
FIGURE 5.5: Users’ Ratings For The Overall Use Of The iSuggest Explanations. N = 10
Discussion. The fact that users gave an average rating of 3.7 when asked to rate theusefulness of the
iSuggest explanations shows that explanations appear to improve the usefulness and understandability
of recommendations. After viewing the explanations provided for the LearnBy Example technique,
one user even expressed a desire to control how similarity between items wascomputed. This suggests

5.3 ISUGGEST-USABILITY EVALUATIONS — RESULTS 73
that scrutability might spur some users to take more control over a system. In general, most of the
complaints that users did have about the explanations provided were that they wanted to know more
details about how the recommendation process worked. In particular, users wanted the Genre Based
and Learn By Example explanations to contain more information. Possible extensions to the existing
iSuggest explanations could include:
Genre Based: Indicating the user’s calculated interest in each genre that an item belongsto.
Learn By Example: Indicating why items were judged to be similar to one another. Further, a
useful control feature could be the ability to adjust the factors that are used to judge similarity
between items.
Of course, further research would be required to discover if these extension could be useful in improving
the understandability and usefulness of recommendations.
It was not surprising that the Most Popular explanations were rated highest on average. This method is
quite simple in operation and thus is easy to explain to users. However, the fact that the Social Filter-
ing (Graph) explanations were also rated highest on average was remarkable, as this recommendation
method is much more complicated. On average, the Graph-based explanation of the Social Filtering
technique was rated the higher than both the Simple Text and the Similar Users forms of explanation.
This suggests that users found this graph of the ratings of similar users to aid their understanding and
ability to use recommendations. The high performance of the Social Filtering (Graph) conflicted with the
results of the questionnaire(where Social Filtering (Simple Text had the highest average understanding
rating). The fact that Social Filtering (Graph) scored a higher average rating than Simple Text demon-
strated the value of implementing and testing explanations. In fact, this result is supported by research
in (Herlocker, 2000), where it was found that a histogram of similar user’s ratings was the most effec-
tive form of Social Filtering explanation. The fact that the Learn By Example explanations were rated
third is somewhat surprising, as one of the benefits often noted for the Learn By Example technique is
the "potential to use retrieved cases to explain [recommendations]" - (Cunninghamet al., 2003), p 1.
Finally, the Genre Based explanations scored poorly mainly due to the fact that these explanations did
not contain enough detail.

5.3 ISUGGEST-USABILITY EVALUATIONS — RESULTS 74
5.3.3 Controls
Users rated two control features according to their effectiveness in improving recommendations recom-
mendations. Figure 5.6 shows users’ ratings for each of the control features, with error bars showing the
standard deviation (results for each user also shown in Appendix D).
1
2
3
4
5
1 2 3 4 5 6 7 8 9 10
Participant
Eff
ecti
ven
ess
Rat
ing
(a) Genre Based
1
2
3
4
5
1 2 3 4 5 6 7 8 9 10
Participants
Eff
ecti
ven
ess
Rat
ing
(b) Social Filtering
FIGURE 5.6: Users’ Ratings For The Effectiveness Of Control Features.
Prediction Method Control: No specific statistical results were collected with respect to the
ability of users to control the recommendation method that was used. However, three users of
the system spontaneously commented that the ability to use many different prediction mech-
anisms was quite useful and one user stated that this helped him to "work with the system to
producerecommendations rather than simply be given a set of ‘take-it-or-leave-it’ recommen-
dations."
Genre Based Control: (average score of 4.4/5, rated 1st). Nine users gave this method a score
of 4 or more, and one user gave this control a 3. As noted in Section 5.3.1, the original Genre
Based recommendations received the lowest average score. However, once users were given
the chance to adjust their genre interests, the revised Genre Based recommendations received
an average of 3.9/5 — the highest average score. One user spontaneously commented that he
would like his genre interests to be used as input to other recommendation techniques, not just
Genre Based. Another user spontaneously commented that he would like to be able to adjust
his interest sub-genres, as well as genres. He felt that the ability to specify interest in sub
genres would enable this control to improve his recommendations even further.

5.3 ISUGGEST-USABILITY EVALUATIONS — RESULTS 75
Social Filtering Control: (average score of 2.6/5, rated 2nd). Three users rated this control ei-
ther 4 or 5, while the other seven users gave this control a rating of 2 or less. One user was
observed to find no users whom he thought should be ignored, despite examining the ratings for
all of the 9 most similar users. Two other users spontaneously commented thatalthough they
did click to ignore particular users, this had little to no impact upon their recommendations.
Users also rated the overall effectiveness of the iSuggest control features for improving their recommen-
dations. The average score for this question was 4.4/5. Figure 5.7 showseach user’s response to this
question (actual results for each user shown in Appendix D).
1
2
3
4
5
1 2 3 4 5 6 7 8 9 10
Participant
Eff
ecti
ven
ess
Rat
ing
FIGURE 5.7: Users’ Ratings For The Overall Effectiveness Of The iSuggestControl Features.
Discussion. The results of the survey showed that users were highly interested in having control over
their recommender system. The results of these evaluations confirmed that such control features can be
effectively incorporated into a recommender system. When asked how useful they found the iSuggest
control features in improving their recommendations, all gave consistently high scores. This is strong
evidence to support the case for including controls in recommender systems. However, the Social Fil-
tering control feature was rated quite lowly by many users. This is most probably due to the fact the
average amount of users that were ignored through the use of this control was only 2.3 — which is often
not enough users to produce a significant change. This result suggests that most users would not use this
control to ignore a large amount of users, and thus it would not be likely to be highly effective. However,
some users did rate this control highly, so further investigation is needed. Despite the poor performance
of this particular control, the overall results from this section of the evaluation show that control fea-
tures can be highly effective — as long as the controls that are incorporated are able to demonstrate a
noticeable effect.

5.3 ISUGGEST-USABILITY EVALUATIONS — RESULTS 76
The conclusions that we can draw from this investigation into the usefulnessof control features include:
• Controls can be useful in improving recommendations.
• Users have shown a strong interest in being offered control over theirrecommender system.
• The Genre Based Control is a very useful method for allowing users to improve the quality of
recommendations.
• Users found the ability to choose which recommendation technique was used was highly use-
ful.
5.3.4 Presentation Method
Five users rated the usefulness of three types of Map Based Presentation. After these users completed
evaluations, their feedback was used to make the following changes to the Map Based Presentations:
• Spread out the items in the map to make it less cluttered.
• Allowed users to click on a genre to zoom in on that genre.
• Had the map start in the ’zoomed out’ state, rather then a very ’zoomed in’ state.
• Allowed users to zoom in further to read movie titles more clearly.
A further group of five users then rated the usefulness of the Map Based Presentations. Figure 5.8 shows
the average score that each group gave to the different forms of Map Based Presentation, with error bars
showing the standard deviation (actual results for each user shown in Appendix D).
1
2
3
4
5
Full Map Top 100 Map Item-To-ItemMap
Avg
. Use
fuln
ess
(a) Group 1
1
2
3
4
5
6
Full Map Top 100 Map Item-To-ItemMap
Avg
. Use
fuln
ess
(b) Group 2 (After Revision Of Maps)
FIGURE 5.8: Average Usefulness Of The Map Based Presentations. Error Bars ShowStandard Deviation.

5.3 ISUGGEST-USABILITY EVALUATIONS — RESULTS 77
Full Map Presentation: (average of 2.0/5 from Group 1, average of 4.3/5 from Group 2). Group
1 gave this method a maximum rating of 3. Two users from this group commented that the
Map was too crowded. One user spontaneously commented that sometimes items were placed
near genres that they didn’t really belong to — which was confusing. However, following
the revision of the maps, Group 2 gave this method an average 4.3/5 — the highest score for
any of the maps. Further, all users from Group 2 gave the Full Map more than 3/5. Three
users from Group 2 rated Full Map the highest. One user from Group 2 commented that the
Full Map "gives you a scope and makes it easier to navigate between genres". Another user
spontaneously commented that she found the colour coding to be a useful way to quickly
discover what genres the system thought you were interested in.
Top 100 Presentation: (average of 2.6/5 from Group 1, average of 4.0/5 from Group 2). On
average, Group 1 rated Top 100 slightly higher than Full Map. However,as was the case with
Full Map presentation, all users from Group 1 rated Top 100 as 3 or below. The average rating
for Top 100 from Group 2 (4.0/5) was slightly lower than the average for Full Map, but 4.0 was
the second highest average score for any of the maps. One user fromGroup 2 gave this map a
5, three gave it a 4 and one user gave it a 3. Two users from Group 2 rated Top 100 the highest.
Item-to-item Similarity: (average of 2.6/5 from Group 1, average of 3.0/5 from Group 2). Two
users from Group 2 gave this method a four, but all other users from Groups 1 and 2 gave this
method 3 or less. In Group 1, this map had the equal highest average score. In Group 2, the
average scores of Full Map and Top 100 improved, but the average score for this map did not.
This meant that this map had the lowest average score for Group 2. One user spontaneously
commented that this map was not useful as it showed items that were not highly rated for
her and that often the map would display relationships between items that she felt were not
related. Another user volunteered that he felt this map should show more levels of Item-To-
Item similarity.
Users were also reported their preferred presentation type (’List Only’, ’Map Only’ or ’Both List And
Map’). Figure 5.9 shows the sum of the responses given by groups 1 and 2 (actual results for each user
shown in Appendix D).
Discussion. The initial group of five users gave all of the map based forms of presentations quite low
scores. Only one of this initial group indicated he would like Map Based Presentations included in a
recommender system. In general, users in Group 1 felt that the map based presentations were difficult

5.4 ISUGGEST-UNOBTRUSIVE - RESULTS 78
0
1
2
3
4
5
List Only Both ListAnd Map
Map Only
Su
m o
f P
refe
ren
ces
(a) Group 1
0
1
2
3
4
5
List Only Both ListAnd Map
Map Only
Su
m o
f P
refe
ren
ces
(b) Group 2 (After Revision Of Maps)
FIGURE 5.9: Sum Of Votes For The Preferred Presentation Type.
to use. This was because the map seemed very crowded and it was hard to zoom in on particular items
or areas of interest. However once the map interface was revised, the second group of users gave the
map-based presentation higher scores for utility. Users in Group 2 foundthe Full Map and Top 100
maps to be especially useful. The probable cause for the lower performance of the Item-to-Item map
lies in the fact that the Item-to-Item collaborative filtering process can sometimes produce relationships
between items that a user might not expect. This confused users who wereexpecting items that were
more directly related to be displayed with one another (e.g. movies in the same genre).
After the revision of the maps, four out of five users said they would like both List-Based and Map-
Based presentation. This strongly suggests that Map Based Presentationof recommendations would be
a worthwhile addition to a recommender system. The Full Map and Top 100 presentations are useful
presentation methods, though user interaction and scalability are two areas where more research needs
to be conducted. However, in general, once the initial usability issues wereovercome, users seemed
quite keen on having a Full Map presentation incorporated into a recommender system.
5.4 iSuggest-Unobtrusive - Results
This section reports the results of both statistical and user evaluations of iSuggest-Usability. At this
point, it is important to note that the average amount of ratings that were automatically generated for
users during user evaluations was 80.5. This was a sufficient number ofratings to mean that thecold
start problem for new userswould not be a factor during evaluations.

5.4 ISUGGEST-UNOBTRUSIVE - RESULTS 79
5.4.1 Statistical Evaluations
Before any user evaluations were performed, statistical evaluations were carried out on iSuggest-Unobtrusive.
These evaluations attempted to investigate the performance of the ratings generation algorithm and the
quality of recommendations produced using these ratings. The datasets used to complete these evalu-
ations were the MovieLens standard dataset, which contained 100,000 ratings and the last.fm dataset,
which contained 100,000 play-counts, that were converted into 70149 ratings. The two statistical eval-
uations that were conducted were: a calculation of the distribution of the ratings that existed or were
produced for each dataset; and a calculation of the MAE and SDAE for four recommendation tech-
niques using each of the datasets. The results of these evaluations are reported below.
The distribution of the ratings that were calculated from play-count data was calculated. This was
compared to the distribution of ratings within the MovieLens standard data set. Figures 5.10(a) and
5.10(b) show these distributions.
0%
10%
20%
30%
40%
50%
60%
70%
80%
0 0.5 1 1.5 2 2.5 3 3.5 4 4.5 5
Rating
% o
f T
ota
l Rat
ing
s
(a) Unobtrusively Generated Music Ratings
0%
10%
20%
30%
40%
50%
60%
70%
80%
0 0.5 1 1.5 2 2.5 3 3.5 4 4.5 5
Rating
% o
f T
ota
l Rat
ing
s
(b) Movie Ratings From MovieLens Dataset
FIGURE 5.10: Comparison Of Distribution Of Ratings Values.
The rating scale that was used to calculate the distribution of ratings was a scale of 0.0-5.0, with incre-
ments of 0.5 (as all ratings within iSuggest were displayed on this scale). However, the ratings contained
within the MovieLens dataset were based on a scale of 1.0-5.0, with increments of 1. This means that
there are a number of values shown in Figure 5.10(b) for which no ratingsexist. Despite this, the gen-
eral distribution of ratings in the MovieLens dataset is clear. Only sixteen percent of the ratings in the
MovieLens dataset occur below the value of 2.5, and zero percent of the ratings in the generated set
occur below this value. twenty seven percent of the MovieLens ratings were 2.5’s, compared to sixteen
percent of the generated ratings. Thirty five percent of MovieLens ratings were occur within the range
of 3.0 to 4.5 (inclusive), whereas eighty three percent of the generatedratings occur within this range.

5.4 ISUGGEST-UNOBTRUSIVE - RESULTS 80
Finally, twenty percent of the Movielens ratings were 5’s; only one percent of the generated ratings were
5’s.
The MAE for four different recommendation techniques was calculated using the ratings generated from
play-count data. This was compared to the MAE for the same techniques when recommending movies
using the MovieLens standard data set. Figures 5.11(a) and 5.11(b) show the MAE for each of the four
recommendation techniques, using MovieLens ratings and the generated ratings.
Technique GMAE St. Dev.Social Filtering 0.091 0.171Genre Based 0.101 0.174Learn By Example 0.102 0.185Most Popular 0.106 0.178
(a) MAE of Recommendation Techniques UsingUnobtrusively Generated Music Ratings
Technique GMAE St. Dev.Social Filtering 0.384 0.490Genre Based 0.425 0.530Learn By Example 0.465 0.592Most Popular 0.384 0.488
(b) MAE and SDAE of Recommendation Tech-niques Using Movie Ratings Taken From Movie-Lens Dataset
FIGURE 5.11: Comparison Of MAE And SDAE For Movielens RecommendationsAnd Recommendations Using Generated Ratings. Lower Scores Are Better.Tech-niques Are Sorted By MAE.
The average MAE for the recommendations using the generated ratings wascalculated to be 0.315
lower than the average MAE for the recommendations using the MovieLens dataset. Further, the av-
erage SDAE for recommendations using generated ratings was 0.348 lowerthan the average SDAE for
recommendations using MovieLens ratings. The Most Popular technique had the best (i.e. the lowest)
MAE for recommendations using the MovieLens data set. It also had the lowest standard deviation.
In contrast, this technique had the highest MAE for the recommendations created using generated rat-
ings. Genre Based had the second best MAE for simulations. Learn By Example had the second worst
MAE for the MovieLens recommendations, and the worst MAE for the generated rating recommenda-
tions. Finally, Social Filtering had the second worst MAE when recommendations were made using
the MovieLens ratings. However, it had the best MAE when the generatedratings were used to make
recommendations.
Discussion. The statistical evaluations showed that the ratings generation algorithm was generally
quite conservative — the percentage of generated ratings above 3 was smaller than the percentage of
ratings above 3 in the MovieLens data. One of the causes of this was the fact that the data used to
generate ratings was counts of songs that users listened to. Often this datawill contain artists for whom
the user has only one song, and whom the user listens to infrequently. Suchartists would be given

5.4 ISUGGEST-UNOBTRUSIVE - RESULTS 81
a rating quite close to 2.5 by the generation algorithm. Another cause is the factthat often, a user
will listen to one ‘favourite’ artist very frequently, and other artists less frequently. In this case, the
normalisation performed by the generation algorithm will result in the ‘favourite’ artist getting a high
rating and the other artists getting lower ratings. In fact, the more that a user listens to a single artist, the
lower that the ratings for other artists will be. As many users listen to a few ‘favourite artists’ very often,
the ratings for the artists who are not a user’s favourites are likely to be relatively close to 2.5. The use
of additional information in the ratings generation process (such as the number of songs by each artist
that are on a user’s iPod and the amount of time that a user has spent listening to each track) would be
likely to improve the accuracy of the ratings generation.
The evaluation of the ratings algorithm using MAE and SDAE showed that the average MAE and SDAE
for the recommendations using the generated ratings was much lower than the average MAE for recom-
mendations using MovieLens. For the most part, this is due to the fact that the generated ratings were
distributed over a much smaller range than the MovieLens ratings. The smaller range of the generated
ratings meant that predictions for a user’s interest in a particular item usingthese generated ratings would
be more likely to be correct than the predictions made using MovieLens data. Therefore, the MAE when
using generated ratings is likely to be much lower than the MAE when using the MovieLens ratings.
Due to the complexity of this situation, the MAE and SDAE calculations for the two simulations are not
comparable. However, the MAE does still provide a useful measure of theperformance of each of the
prediction techniques. The two techniques that had the best MAE for the generated ratings simulation
were Genre Based and Social Filtering. This meant that these two techniques were likely to be the most
useful for making recommendations based upon the generated ratings.
Once these statistical evaluations had been completed, users evaluations were conducted. The results of
the user evaluations are reported in Sections 5.4.2 to 5.4.3.
5.4.2 Ratings Generation
Users rated their understanding of how ratings had been generated from their iPod. They also rated the
accuracy of the ratings that were generated. The results of from thesequestions are discussed below.
Understanding Of Ratings Generation: (average score of 5.0/5). All users responded to this
question with a score of 5/5.
5.4 ISUGGEST-UNOBTRUSIVE - RESULTS 82
Accuracy Of The Ratings Generated: (average score of 4.3/5). One user spontaneously com-
mented that the program seemed to be a little bit conservative — being quite hesitant to give
out higher ratings, and tending to give out ratings of mainly 2.5 and 3 stars.However, this
question received very high scores from all users — no users responded with less than a score
of 4, and three users gave a score of 5. Two users spontaneously commented that their favourite
artist had been given the highest rating.
Discussion. Users gave consistently high scores when asked about their understanding of how their
ratings were generated. This indicates that they believed they had a very clear understanding of how their
ratings had been generated. Users also gave consistently high scores when asked about the accuracy of
their ratings. This suggests that the algorithm implemented in this prototype was able to successfully
model users’ interests in particular artists. Some users did comment that, as was shown in Section
5.4, the ratings generation process was quite conservative. Yet despitethis, users felt that the ratings
generated were quite accurate, especially due to the fact that the users’favourite artists were consistently
given the highest ratings.
5.4.3 Recommendations
Users rated the usefulness of the three sets of recommendations produced from their generated ratings.
Figure 5.12 shows the average score for each of the different techniques, with error bars showing the
standard deviation (actual results for each user shown in Appendix F).We now discuss these techniques
in order of average usefulness.
Genre Based Recommendations:(average score of 3.9/5, ranked 1st). The average rating for
these recommendations was substantially higher than the average for Random recommenda-
tions. In fact, all but one of the users gave Genre Based recommendations their highest rating.
Social Filtering Recommendations:(average score of 3.1/5, ranked 2nd). This method received
a higher average score than the Random Recommendations, yet it was notthe highest rated
recommendation method. One user commented that some artists that were recommended did
seem to be quite appropriate, but that the recommendation list contained too many incorrect
recommendations for it to be really useful.
Random Recommendations:(average score of 2.2/5, ranked 3rd). Seven users gave this method
their lowest rating. No users gave this method their highest rating.

5.4 ISUGGEST-UNOBTRUSIVE - RESULTS 83
1.0
1.5
2.0
2.5
3.0
3.5
4.0
4.5
5.0
Random Social Filtering Genre Based
Avg
. Use
fuln
ess
Rat
ing
FIGURE 5.12: Average Usefulness Ratings For Each Recommendation Method. ErrorBars Show Standard Deviation.
Users also reported whether they would like the ’Get Rating From My iPod’ feature incorporated into a
recommender system. In answer to this question, all users reported that they would like to have the ’Get
Ratings From My iPod’ function incorporated into a recommender system. Oneuser spontaneously
commented that "this is a great idea, and a really useful time saver". Three users commented that
having ratings generated was highly preferable to rating items individually bymoving through a large
list. One of these users continued, saying that they would be willing to make minoradjustments to
the ratings produced by the generation process to make the ratings more accurate and receive better
recommendations.
Discussion. The fact that Random recommendations received the lowest average score is not surpris-
ing, as these recommendations were presented to users to act as a control.The fact that 2.2/5 is the score
that users would give a random set of recommendations can serve as a reference point for judging the
utility of the recommendations presented to users. Social Filtering performed the best in the statistical
evaluations described in Section 5.4.1, so it was assumed that users would find it to be highly useful.
However, on average the usefulness of this method was rated lower than the Genre Based recommenda-
tions. The most likely reason for this is the fact that the ratings produced bythe generation algorithm
were distributed over only a small range. This meant that the process of matching similar users to one
another was less successful, as the differences between users in termsof their ratings was less pro-
nounced. This resulted in lower quality Social Filtering recommendations. Social Filtering performed
well in statistical evaluations because it predicts a user’s rating for a new item in a way that is similar to
taking the average rating that similar users gave this item. When there is such a low range of ratings in

5.5 CONCLUSION 84
the system, this ‘average rating’ style approach is very likely to calculate a predicted value that is close
to the average rating that users gave to items. Basically, because the rangeof ratings was so small in
this example, a predictor such as this, which draws heavily upon users’ ratings is more likely to perform
well on statistical evaluations. However, when used in a real world system,this recommendation method
does not produce optimum results because it struggles to clearly identify similar and opposite users and
thus produces poor recommendations.
The fact that Genre Based recommendations were rated highly by the majorityof users is strong evi-
dence to suggest that useful recommendations can indeed be made using only implicit ratings data. The
most likely reason that this recommendation method was able to produce high quality recommendations
is the fact that it does not use the ratings that are input by a user in the sameway that the Social Filtering
method does. The Genre Based method uses the user’s ratings to adjust their predicted interest in partic-
ular genres. This predicted interest is most significantly affected by the itemsthat a user has rated very
high or very low. Items that the user has given a relatively neutral rating affect these predicted interests
in a much less significant way. As a result, this recommendation method is not adversely affected by the
fact that the ratings generation algorithm produced a large amount of relatively neutral ratings. Thus, this
recommendation method was able to use the items that the user has rated highly to infer genre interests
and make successful recommendations.
The results of these user trials strongly suggest that useful recommendations can be made using only
implicit data as ratings information. One big indicator of this lay in the fact that, when asked, all users
reported that they would like to have the ’Get Ratings From My iPod’ functionincorporated into a
recommender system. In the future, more research is required to investigatewhether ratings generated
using a different algorithm might alter the performance of each recommendation technique.
5.5 Conclusion
Evaluations were designed and conducted for each of the two prototype variants. These evaluations
aimed to investigate the research questions defined in Chapter 1 and build upon the knowledge that was
gained from the questionnaire conducted in Chapter 3.
iSuggest-Usability was evaluated through user evaluations, conducted with10 people. These user eval-
uations produced the following findings:

5.5 CONCLUSION 85
Recommendation usefulness.
• Despite the fact that very few ratings had been entered by each user, the Genre Based and Learn
By Example techniques were highly rated by users. This suggests that these two techniques
would be useful, even in situations where thecold start problem for new usersexists.
Understanding.
• Explanations were shown to be a useful addition to a recommender system.
• A graph based method was shown to be the most effective way to explain Social Filtering
recommendations.
• On average, the Learn By Example recommendations were rated to be the thirdmost under-
standable recommendations — a curious results given that as one of the benefits of the Learn
By Example technique is stated to be the "potential to use retrieved cases to explain [recom-
mendations]" - (Cunninghamet al., 2003)
• Some of the explanations incorporated into the prototype would benefit fromthe addition of
extra information.
• Comments made by during evaluations suggested that the addition of scrutability might spur
some users to take more control over a system.
User Control.
• Controls can be useful for allowing users to improve their recommendations,particularly the
Genre Based control.
• Users have a high level of interest in being given control of their recommender system.
• Evidence showed that allowing users to select which recommendation technique should be
used is a highly useful.
Presentation.
• Evidence suggested that a Map Based presentation of recommendations (such as Full Map or
Top 100 Map included in iSuggest-Usability) would be a useful addition to a recommender
system.

5.5 CONCLUSION 86
Evaluations also highlighted the individuality of users, many of whom preferred different presentation
styles, explanation styles and recommendation techniques. In general, users found many of the features
included in iSuggest-Usability to be quite useful for improving the quality of recommendations and the
scrutability of a recommender system.
iSuggest-Unobtrusive was evaluated through user evaluations, conducted with 9 people, as well as
through statistical evaluations. These evaluations produced the following findings:
• Ratings can be generated from implicit information in a way that users have indicated is easy
to understand and is generally accurate.
• Useful recommendations can be made based purely upon ratings generated from implicit in-
formation about users.
• The ratings generation algorithm implemented in iSuggest-Unobtrusive is conservative, and
could definitely be improved upon.
• Genre Based is a useful recommendation technique to use when the distribution of ratings
values is conservative.
• The addition of other types of implicit data to the ratings generation process (such as time spent
listening to each track) could improve quality of the generated ratings.
Generally, found that iSuggest-Unobtrusive incorporated highly useful features that enabled ratings to
be generated unobtrusively and effective recommendations producedfrom this information.
Overall, the evaluations of the two prototype variants produced a number ofimportant findings regarding
both theScrutability & ControlandUnobtrusive Recommendationresearch questions.

CHAPTER 6
Conclusion
The research questions for this thesis were expressed in Chapter 1 to be:
Scrutability & Control: What is the impact of adding scrutability and control to a recommender
system?
Unobtrusive Recommendation:Can a recommender system provide useful recommendations
without asking users to explicitly rate items?
As noted in Chapter 2, there is very little published research that deals with either of these two ques-
tions, but clear recognition of their importance and the challenges of achieving them. Thus, this thesis
investigated each of these questions. An exploratory study was conducted, which involved an analysis of
existing systems and the conduct of a questionnaire. The results from this study informed the creation of
a prototype system, which included a number of scrutability, control and unobtrusive recommendation
features. Finally, this system was evaluated through a combination of statistical methods and user eval-
uations. Both the exploratory study and the evaluations of the prototype produced significant findings.
These findings include:
Scrutability & Control. Based on the results from the questionnaire (which had 18 respondents and
is detailed in Chapter 3) and the two user evaluations (each of which had at least 9 participants and are
detailed in Chapter 5), the following findings were made:
• Explanations are a useful addition to a recommender system. However, complicated or poor
explanations can often confuse a user’s understanding of recommendations.
• Specific explanation types were found to be more useful than others for explaining particular
recommendation techniques.
• Different users prefer different forms of presentation and explanation.
87

6.1 FUTURE WORK 88
• Genre Based and Learn By Example are both techniques that could be utilised to avoid thecold
start problem for new users.
• A Map Based presentation of recommendations can be a useful addition to a recommender
system.
• Users have a high level of interest in being given control of their recommender system. Further,
such controls can be useful for allowing users to improve the usefulnessof recommendations
• Respondents to our questionnaire did not think that Description Based or Lyrics Based recom-
mendation techniques would be useful.
Unobtrusive Recommendation.
• Ratings can be generated from implicit information in a way that users have indicated is easy
to understand and is generally accurate. These ratings can then be usedto made useful recom-
mendations.
Overall, this thesis was highly successful. It highlighted a number of key scrutability and control features
that would appear to be useful additions to existing recommender systems. These features can be used
to improve recommendation quality and usefulness, as well as improve users’trust and understanding
of recommender systems. Further, the Genre Based and Learn By Exampletechniques were shown to
produce useful recommendations, even when users had not entered alarge number of ratings (a situation
that causes many recommendation techniques to produce poor recommendations). It was also shown
that a Map Based presentation would be a useful presentation method, which could be incorporated
into existing recommender systems. Finally, it was shown that ratings automaticallygenerated from
implicit information about a user can be used to make useful recommendations.Each of these findings is
significant, as they can be used to improve the effectiveness, usefulness and user friendliness of existing
recommender systems.
6.1 Future Work
Despite the substantial progress made during this thesis, there are a numberof areas that require future
research. These areas include:
• Investigation of the usefulness of dynamically combining multiple recommendation techniques.
• Investigation of new or extended ways of providing explanations and control to users.

6.1 FUTURE WORK 89
• Further investigation into the most useful methods for providing a Map Basedpresentation of
recommendations.
• Improvements to the ratings generation algorithm presented in this thesis.
• Investigation of other types of implicit data that could be used to generate ratings.

References
G. Adomavicius and A. Tuzhilin. 2005. Toward the next generation of recommender systems: a surveyof the state-of-the-art and possible extensions.Knowledge and Data Engineering, IEEE Transactionson, 17(6):734–749.
J. Atkinson. 2006. Free music recommendation services, 25th May.
C. Basu, H. Hirsh, and W. Cohen. 1998. Recommendation as classification: Using social and content-based information in recommendation.Proceedings of the Fifteenth National Conference on ArtificialIntelligence.
J. S. Breese, D. Heckerman, and C. Kadie. 1998. Empirical analysis ofpredictive algorithms for collab-orative filtering.Proceedings of the Fourteenth Conference on Uncertainty in Artificial Intelligence,461.
P. Cano, M. Koppenberger, and N. Wack. 2005. An industrial-strength content-based music recommen-dation system.Proceedings of the 28th annual international ACM SIGIR conference onResearch anddevelopment in information retrieval, pages 673–673.
P. Cunningham, D. Doyle, and J. Loughrey. 2003. An Evaluation of the Usefulness of Case-BasedExplanation.Case-Based Reasoning Research and Development. LNAI, 2689:122–130.
M. Deshpande and G. Karypis. 2004. Item-based top-n recommendation algorithms.ACM Transactionson Information Systems (TOIS), 22(1):143–177.
J. L. Herlocker, J. A. Konstan, and J. Riedl. 2000. Explaining collaborative filtering recommendations.Proceedings of the 2000 ACM conference on Computer supported cooperative work, pages 241–250.
J. L. Herlocker, J. A. Konstan, L. G. Terveen, and J. T. Riedl. 2004. Evaluating collaborative filteringrecommender systems.ACM Transactions on Information Systems (TOIS), 22(1):5–53.
J. L. Herlocker. 2000.Understanding and Improving Automated Collaborative Filtering Systems. Ph.D.thesis, UNIVERSITY OF MINNESOTA.
X. Hu, J.S. Downie, K. West, and A. Ehmann. 2005. Mining Music Reviews:Promising PreliminaryResults. Proceedings of the 6th International Symposium on Music Information Retrieval, pages536–539.
A. Kiss and J. Quinqueton. 2001. Machine learning of user preferences in a corporate knowledgemanagement system.Proceedings of ISMCIK ’01, pages 257–269.
90

REFERENCES 91
J. A. Konstan, B. N. Miller, D. Maltz, J. L. Herlocker, L. R. Gordon, and J. Riedl. 1997. Grouplens:applying collaborative filtering to usenet news.Communications of the ACM, 40(3):77–87.
B. Logan. 2004. Music recommendation from song sets.Proc ISMIR.
H. Mak, I. Koprinska, and J. Poon. 2003. Intimate: a web-based movie recommender using textcategorization.Proceedings of the 2003 IEEE/WIC International Conference on Web Intelligence,pages 602–605.
D. Maltz and K. Ehrlich. 1995. Pointing the way: active collaborative filtering. Proceedings of theSIGCHI conference on Human factors in computing systems, pages 202–209.
D. Mcsherry. 2005. Explanation in Recommender Systems.Artificial Intelligence Review, 24(2):179–197.
S. E. Middleton, D. C. De Roure, and N. R. Shadbolt. 2001. Capturing knowledge of user preferences:ontologies in recommender systems.Proceedings of the international conference on Knowledgecapture, pages 100–107.
R. J. Mooney and L. Roy. 2000. Content-based book recommending using learning for text categoriza-tion. Proceedings of the fifth ACM conference on Digital libraries, pages 195–204.
J. Nielsen. 1993. Evaluating the thinking-aloud technique for use by computer scientists.Advances inhuman-computer interaction, 3:69–82.
J. Nielsen. 1994. Estimating the number of subjects needed for a thinking aloud test. InternationalJournal of Human-Computer Studies, 41(3):385–397.
D. W. Oard and J. Kim. 1998. Implicit feedback for recommender systems.Proceedings of the AAAIWorkshop on Recommender Systems, pages 81–83.
G. Polcicova, R. Slovak, and P. Navrat. 2000. Combining content-basedand collaborative filtering.Proceedings of ADBIS-DASFAA Symposium 2000, page 118âAS127.
U. Shardanand and P. Maes. 1995. Social information filtering: algorithmsfor automating âAIJwordof mouthâAI. Proceedings of the SIGCHI conference on Human factors in computing systems, pages210–217.
R. Sinha and K. Swearingen. 2001. Beyond algorithms: An hci perspective on recommender systems.Proceedings of the SIGIR 2001 Workshop on Recommender Systems.
R. Sinha and K. Swearingen. 2002. The role of transparency in recommender systems.Proceedings ofthe conference on Human Factors in Computing Systems, pages 830–831.
M. van Setten, M. Veenstra, and A. Nijholt. 2002. Prediction strategies: Combining prediction tech-niques to optimize personalization.Proceedings of the workshop Personalization in Future TV’02,pages 23–32.
M. van Setten, M. Veenstra, A. Nijholt, and B. van Dijk. 2003. Prediction strategies in a tv recommendersystem: Framework and experiments.Proceedings of IADIS WWW/Internet 2003, pages 203–210.

REFERENCES 92
M. van Setten, M. Veenstra, A. Nijholt, and B. van Dijk. 2004. Case-based reasoning as a predictionstrategy for hybrid recommender systems.Proceedings of the Atlantic Web Intelligence Conference,pages 13–22.
M. van Setten. 2005.Supporting People In Finding Information. Telematica Institut.

APPENDIX A
Appendix A — Questionnaire Form
Note: On this questionnaire, the technique referred to in the thesis as Learning By Example is called
Learning From Similar. Also, the technique referred to in the thesis as SocialFiltering is called Word
Of Mouth.
93
APPENDIX B
Appendix B — Questionnaire Results
Note: A * indicates that this user did not answer this question due to the fact that the content of the
questionnaire changed after the first five respondents.
94

APPENDIX C
Appendix C — iSuggest-Usability Evaluation Instructions
95

APPENDIX D
Appendix D — iSuggest-Usability Evaluation Results
Note: A * indicates that this user did not answer this question due to a copyingerror.
96

APPENDIX E
Appendix E — iSuggest-Unobtrusive Evaluation Instructions
97

APPENDIX F
Appendix F — iSuggest-Unobtrusive Evaluation Results
98