usepa-approved rio puerco watershed tmdl - part 2: … · the state of new mexico has developed and...
TRANSCRIPT

51
6.0 TEMPERATURE
Monitoring for temperature was conducted by SWQB in 2004 and 2006. Based on available data, several exceedences of the New Mexico WQS for temperature were noted throughout the watershed (Figures 6.1-6.2). Thermographs were set to record once every hour for several months during the warmest time of the year (generally May through October). Thermograph data are assessed using Appendix C of the State of New Mexico Procedures for Assessing Standards Attainment for the Integrated CWA §303(d)/§305(b) Water Quality Monitoring and Assessment Report (NMED/SWQB 2006b). Based on 2004 and 2006 data, a new temperature listing was added to the 2006-2008 State of NM §303(d) List for Impaired Waters (NMED/SWQB 2007) for Bluewater Creek (non-tribal Rio San Jose to Bluewater Reservoir) and temperature listings were retained for Bluewater Creek (Bluewater Reservoir to headwaters) and Rio Moquino (Laguna Pueblo to Seboyeta Creek). Temperature data from 2004 and 2006 were used to develop these TMDLs.
6.1 Target Loading Capacity
Target values for these temperature TMDLs will be determined based on 1) the presence of numeric criteria, 2) the degree of experience in applying the indicator, and 3) the ability to easily monitor and produce quantifiable and reproducible results. For this TMDL document, target values for temperature are based on the reduction in solar radiation necessary to achieve numeric criteria as predicted by a temperature model. This TMDL is also consistent with New Mexico’s antidegradation policy. The State of New Mexico has developed and adopted numeric water quality criteria for temperature to protect the designated use of coldwater aquatic life (CWAL) (Subsection H of 20.6.4.900 NMAC). These WQS have been set at a level to protect coldwater aquatic life such as trout. The CWAL use designation requires that a stream reach must have water quality, streambed characteristics, and other attributes of habitat sufficient to protect and maintain a propagating coldwater fishery (i.e., a population of reproducing salmonids). The standard leading to an assessment of use impairment is the numeric criterion for temperature of 20°C (68°F). Table 6.1 and Figure 6.1 highlight the 2004 and 2006 thermograph deployments. The following TMDLs address three reaches where temperatures exceeded the criterion (Appendix C of this document provides a graphical representation of thermograph data):
Bluewater Creek (Bluewater Reservoir to headwaters): One thermograph was deployed on this reach in 2004 at Bluewater Creek above Bluewater Lake at USGS gage 0841300 (site B). Recorded temperatures from June 10 through December 8 exceeded the CWAL use criterion 656 of 4,352 times (15%) with a maximum temperature of 27.86°C on July 13 at 17:00. Bluewater Creek (non-tribal Rio San Jose to Bluewater Reservoir): One thermograph was deployed on this reach in 2004 at Bluewater Creek at mouth of Bluewater Canyon (site C). Recorded temperatures from June 10 through December 8 exceeded the CWAL use criterion 582 of 4,353 times (13%) with a maximum temperature of 26.26°C on July 16.
52
Rio Moquino (Laguna Pueblo to Seboyettia Creek): One thermograph was deployed on this reach in 2006 at Rio Moquino below confl of Seboyetita Creek and Seboyeta Creek (site F). Recorded temperatures from August 23 through September 20 exceeded the CWAL use criterion 196 of 670 times (29%) with a maximum temperature of 28.84°C on August 31.
Table 6.1 Rio Puerco and Rio San Jose Thermograph Sites
Site
Number Site Name Deployment Dates
A Arroyo San Jose @ Hwy 550 6/3/2004-12/6/2004 B Bluewater Creek abv Bluewater Lake at USGS gage 08413001 6/10/2004-12/8/2004 C Bluewater Creek at mouth of Bluewater Canyon1 6/10/2004-12/8/2004 D La Jara Creek abv irrigation diversion1 6/3/2004-12/6/2004 E Nacimiento Creek @ Hwy 126 6/3/2004-12/6/204 F Rio Moquino below confl of Seboyetitia Creek and Seboyeta
Creek1 8/23/2006-9/20/2006
G Rio Puerco @ CR 13 6/3/2004-12/6/2004 H Rio Puerco @ Hwy 550 bridge1 6/16/2004-12/6/2004 I Rio Puerco abv La Ventana Restoration Project1 6/3/2004-12/6/2004 J Rio Puerco blw WWTP1 3/7/2006-9/20/2006 K Rito de los Pinos @ USFS gate on FR 95 6/3/2004-12/6/2004 L Senorito Creek abv Nacimiento Mine1 6/3/2004-12/6/2004 1 Air thermograph also deployed

53
Figure 6.1 Rio Puerco thermograph sites

54
Figure 6.2 Rio San Jose thermograph sites
6.2 Calculations
The Stream Segment Temperature (SSTEMP) Model, Version 2.0 (Bartholow 2002) was used to predict stream temperatures based on watershed geometry, hydrology, and meteorology. The USGS Biological Resource Division developed this model (Bartholow 2002). The model predicts mean, minimum, and maximum daily water temperatures throughout a stream reach by estimating the heat gained or lost from a parcel of water as it passes through a stream segment (Bartholow 2002). The predicted temperature values are compared to actual thermograph readings measured in the field in order to calibrate the model. The SSTEMP model identifies current stream and/or watershed characteristics that control stream temperatures. The model also quantifies the maximum loading capacity of the stream to meet water quality criteria for temperature. This model is important for estimating the effect of changing controls, or constraints, (such as riparian grazing, stream channel alteration, and reduced streamflow) on stream temperature. The model can also be used to help identify possible implementation activities to improve stream temperature by targeting those factors causing impairment to the stream.

55
6.3 Waste Load Allocations and Load Allocations
6.3.1 Waste Load Allocation
There are no permitted point source contributions associated with these TMDLs.
6.3.2 Load Allocation
Water temperature can be expressed as heat energy per unit volume. SSTEMP provides a daily estimate of heat energy expressed in joules per square meter per second (j/m2/s). Please refer to the SSTEMP User’s Manual for complete text relevant to the model runs used to determine temperature TMDLs taken from the SSTEMP documentation (Bartholow 2002). Appendix D details the specific data used in the model as well as the sources of the data. The program will predict the minimum, mean, and maximum daily water temperature for the set of variables you provide. The theoretical basis for the model is strongest for the mean daily temperature. The maximum is largely an estimate and likely to vary widely with the maximum daily air temperature. The minimum is computed by subtracting the difference between maximum and mean from the mean; but the minimum is always positive. (Bartholow 2002).
Figure 6.3 Example of SSTEMP input and output for Bluewater Creek (NM-2107.A_01)

56
SSTEMP may be used to compute a one-at-a-time sensitivity of a set of input values. This simply increases and decreases most active input (i.e., non-grayed out values) by 10% and displays a screen for changes to mean and maximum temperatures. The schematic graph that accompanies the display gives an indication of which variables most strongly influence the results. (Bartholow 2002). See Figure 6.4 for an example of a sensitivity analysis.
6.3.2.1 Temperature Allocations as Determined by % Total Shade and Width-to-Depth Ratios
Table 6.2 details model run outputs for segments on Bluewater Creek and Rio Moquino. SSTEMP was first calibrated against thermograph data to determine the standard error of the model. Initial conditions were determined. As the percent total shade was increased and the Width’s A term was decreased, the maximum 24-hour temperature decreased until the segment-specific standard of 20ºC was achieved. The calculated 24-hour solar radiation component is the maximum solar load that can occur in order to meet the WQS (i.e., the target capacity). In order to calculate the actual LA, the WLA and MOS were subtracted from the target capacity (TMDL) following Equation 2.
WLA + LA + MOS = TMDL (Eq. 2) The allocations for each assessment unit requiring a temperature TMDL are provided in the following tables.
57
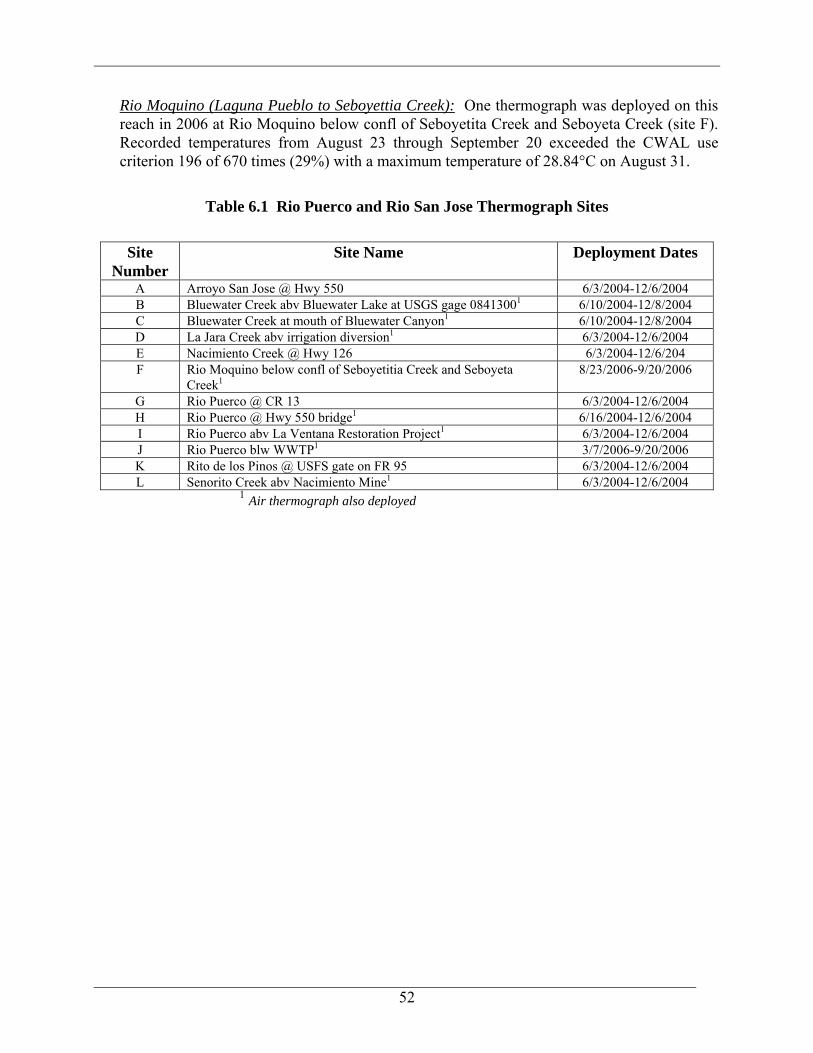
Temperature Load Allocation for Bluewater Creek (Bluewater Reservoir to headwaters) For Bluewater Creek (Bluewater Reservoir to headwaters), the WQS for temperature is achieved when the percent total shade is increased to 72%. According to the SSTEMP model, the actual LA of 24.80 j/m2/s is achieved when the shade is further increased to 75.5% (Table 6.2).
Table 6.2 SSTEMP Model Results for Bluewater Creek (Bluewater Reservoir to headwaters),
Rosgen
Channel Type
WQS
(HQCW Aquatic
Life)
Model Run
Dates
Segment Length (miles)
Solar Radiation Component per
24-Hours (+/-)
%
Total Shade
Width’s A Term
Modeled
Temperature °C (24 hour)
n/a
20°C
(68°F)
7/13/04
17.1
Current Field
Condition +93.49 j/m2/s
5
8.53
Minimum: 15.62 Mean: 19.01 Maximum: 22.41
Run 1
+73.81
j/m2/s
25
8.53
Minimum: 15.79 Mean: 18.75 Maximum: 21.71
Run 2
+27.56 (a) j/m2/s
72
8.53
Minimum: 16.25 Mean: 18.13 Maximum: 20.00
TEMPERATURE ALLOCATIONS FOR Bluewater Creek (Bluewater Reservoir to headwaters) (a) 24-HOUR ACHIEVEMENT OF
SURFACE WQS FOR TEMPERATURE (b) 24-HOUR LOAD ALLOCATION (LA)
NEEDED TO ACHIEVE SURFACE WQS WITH A 10% MARGIN OF SAFETY
Actual LA
24.80 (b) j/m2/s
75.5
8.53
Minimum: 16.29 Mean: 18.08 Maximum: 19.87
Actual reduction in solar radiation necessary to meet surface WQS for temperature: Current Condition – Load Allocation = 93.49 j/m2/s – 24.80 j/m2/s =68.69 j/m2/s

58
Temperature Load Allocation for Bluewater Creek (non-tribal Rio San Jose to Bluwater Rsrv) For Bluewater Creek (non-tribal Rio San Jose to Bluwater Rsrv), the WQS for temperature is achieved when the percent total shade is increased to 14%. According to the SSTEMP model, the actual LA of 85.89 j/m2/s is achieved when the shade is further increased to 23% (Table 6.3).
Table 6.3 SSTEMP Model Results for Bluewater Creek (non-tribal Rio San Jose to Bluwater Rsrv)
Rosgen
Channel Type
WQS
(HQCW Aquatic
Life)
Model Run
Dates
Segment Length (miles)
Solar Radiation Component per
24-Hours (+/-)
%
Total Shade
Width’s A Term
Modeled
Temperature °C (24 hour)
n/a
20°C
(68°F)
7/16/04
2.4
Current Field
Condition +102.09
j/m2/s
8
6.56
Minimum: 11.76 Mean: 16.02 Maximum: 20.29
Run 1
+99.87
j/m2/s
10
6.56
Minimum: 11.78 Mean: 15.99 Maximum: 20.19
Run 2
+95.43 (a) j/m2/s
14
6.56
Minimum: 11.82 Mean: 15.91 Maximum: 20.00
TEMPERATURE ALLOCATIONS FOR Bluewater Creek (non-tribal Rio San Jose to Bluwater Rsrv (a) 24-HOUR ACHIEVEMENT OF
SURFACE WQS FOR TEMPERATURE (b) 24-HOUR LOAD ALLOCATION (LA)
NEEDED TO ACHIEVE SURFACE WQS WITH A 10% MARGIN OF SAFETY
Actual LA
85.89 (b) j/m2/s
23
6.56
Minimum: 11.91 Mean: 15.74 Maximum: 19.57
Actual reduction in solar radiation necessary to meet surface WQS for temperature: Current Condition – Load Allocation = 102.09 j/m2/s – 85.89 j/m2/s =16.2 j/m2/s

59
Temperature Load Allocation for Rio Moquino (Laguna Pueblo to Seboyettia Creek) For Rio Moquino (Laguna Pueblo to Seboyettia Creek), the WQS for temperature is achieved when the percent total shade is increased to 40.5%. According to the SSTEMP model, the actual LA of 71.06 j/m2/s is achieved when the shade is further increased to 46.5% (Table 6.4).
Table 6.4 SSTEMP Model Results for Rio Moquino (Laguna Pueblo to Seboyettia Creek)
Rosgen
Channel Type
WQS
(HQCW Aquatic
Life)
Model Run
Dates
Segment Length (miles)
Solar Radiation Component per
24-Hours (+/-)
%
Total Shade
Width’s A Term
Modeled
Temperature °C (24 hour)
n/a
20°C
(68°F)
8/31/06
3
Current Field
Condition +92.88 j/m2/s
30
5.64
Minimum: 13.30 Mean: 16.98 Maximum: 20.64
Run 1
+86.24
j/m2/s
35
5.64
Minimum: 13.38 Mean: 16.86 Maximum: 20.33
Run 2
+78.95 (a) j/m2/s
40.5
5.64
Minimum: 13.43 Mean: 16.72 Maximum: 20.00
TEMPERATURE ALLOCATIONS FOR Rio Moquino (Laguna Pueblo to Seboyetita Creek) (a) 24-HOUR ACHIEVEMENT OF
SURFACE WQS FOR TEMPERATURE (b) 24-HOUR LOAD ALLOCATION (LA)
NEEDED TO ACHIEVE SURFACE WQS WITH A 10% MARGIN OF SAFETY
Actual LA
71.06 (b) j/m2/s
46.5
5.64
Minimum: 13.48 Mean: 16.56 Maximum: 19.64
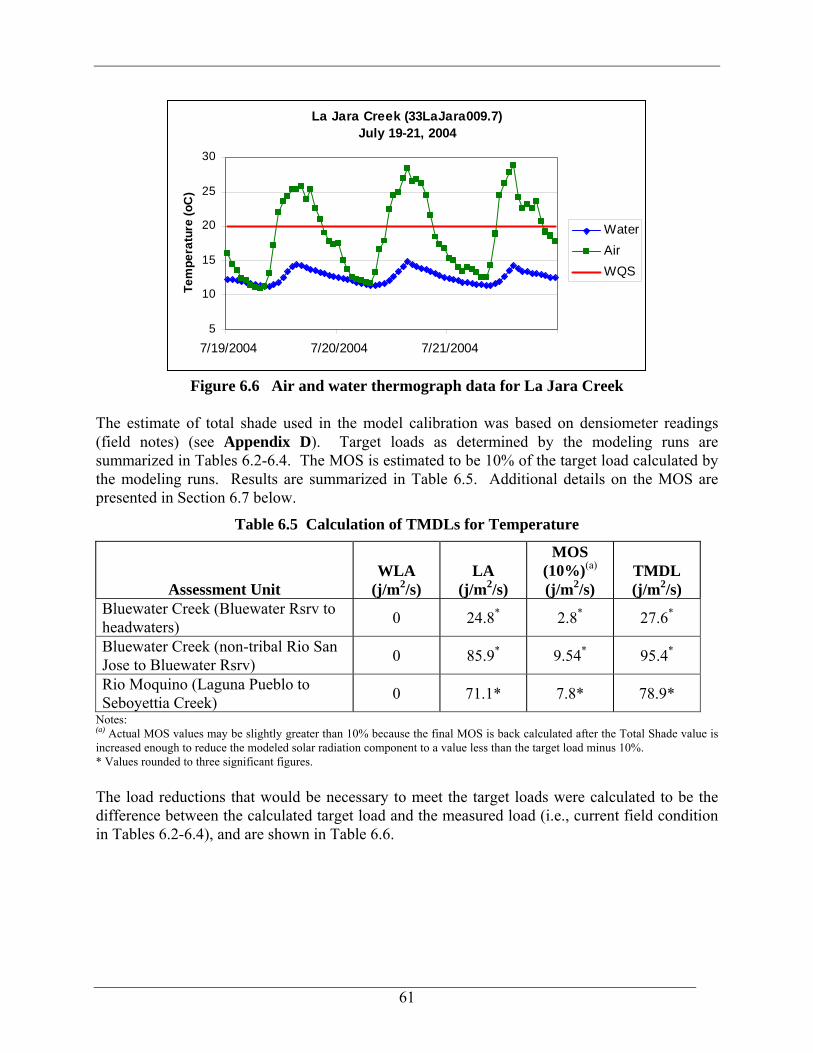
According to the Sensitivity Analysis feature of the model runs (Figure 6.4), mean daily air temperature and inflow temperature had the greatest influence on the predicted outflow temperatures. However, reducing Width’s A term had an insignificant effect on the predicted maximum temperature. The relationship between air and water temperature can be seen in Figures 6.5 and 6.6. The figures display the air and water thermograph readings on the day with the highest recorded water temperature (as well as the day before and the day after) at sites in both an impaired (Figure 6.5) and unimpaired assessment unit (Figure 6.6). The impaired reach experienced diurnal swings of approximately 12ºC while the unimpaired reach only experienced a diurnal swing of less than 5ºC.
Actual reduction in solar radiation necessary to meet surface WQS for temperature: Current Condition – Load Allocation = 92.88 j/m2/s – 71.06 j/m2/s =21.82 j/m2/s

60
Figure 6.4 Example of SSTEMP sensitivity analysis for Rio Moquino
Rio Moquino (36RMoqui006.4) August 30-September 1, 2006
5
10
15
20
25
30
35
40
8/30/2006 8/31/2006 9/1/2006
Tem
pera
ture
(oC
)
WaterAirWQS
Figure 6.5 Air and water thermograph data for Rio Moquino
61
La Jara Creek (33LaJara009.7)July 19-21, 2004
5
10
15
20
25
30
7/19/2004 7/20/2004 7/21/2004
Tem
pera
ture
(oC
)
WaterAirWQS
Figure 6.6 Air and water thermograph data for La Jara Creek
The estimate of total shade used in the model calibration was based on densiometer readings (field notes) (see Appendix D). Target loads as determined by the modeling runs are summarized in Tables 6.2-6.4. The MOS is estimated to be 10% of the target load calculated by the modeling runs. Results are summarized in Table 6.5. Additional details on the MOS are presented in Section 6.7 below.
Table 6.5 Calculation of TMDLs for Temperature
Assessment Unit WLA
(j/m2/s) LA
(j/m2/s)
MOS (10%)(a) (j/m2/s)
TMDL (j/m2/s)
Bluewater Creek (Bluewater Rsrv to headwaters) 0 24.8* 2.8* 27.6*
Bluewater Creek (non-tribal Rio San Jose to Bluewater Rsrv) 0 85.9* 9.54* 95.4*
Rio Moquino (Laguna Pueblo to Seboyettia Creek) 0 71.1* 7.8* 78.9*
Notes: (a) Actual MOS values may be slightly greater than 10% because the final MOS is back calculated after the Total Shade value is increased enough to reduce the modeled solar radiation component to a value less than the target load minus 10%. * Values rounded to three significant figures. The load reductions that would be necessary to meet the target loads were calculated to be the difference between the calculated target load and the measured load (i.e., current field condition in Tables 6.2-6.4), and are shown in Table 6.6.

62
Table 6.6 Calculation of Load Reduction for Temperature
Location
Target Load(a) (j/m2/s)
Measured Load
(j/m2/s)
Load Reduction
(j/m2/s)
Percent Reduction(b)
Bluewater Creek (Bluewater Rsrv to headwaters) 24.8* 93.5* 68.7* 73
Bluewater Creek (non-tribal Rio San Jose to Bluewater Rsrv) 85.9* 102* 16.1* 16
Rio Moquino (Laguna Pueblo to Seboyettia Creek) 71.1 92.9 21.8 23
Notes: The MOS is not included in the load reduction calculations because it is a set aside value which accounts for any uncertainty, or variability, in TMDL calculations and therefore should not be subtracted from the measured load. (a) Target Load = LA + WLA (b) Percent reduction is the percent the existing measured load must be reduced to achieve the target load, and is calculated as follows: (Measured Load – Target Load) / Measured Load x 100. * Values rounded to three significant figures.
6.4 Identification and Description of pollutant source(s)
Pollutant sources that could contribute to each segment are listed in Table 6.7.
Table 6.7 Pollutant source summary for Temperature
Pollutant Sources Magnitude(a) Location Potential Sources(b) (% from each)
Point: None 0 -------- 0%
Nonpoint: 93.5 Bluewater Creek
(Bluewater Rsrv to headwaters)
100% Forest Roads (Road Construction and Use) Loss of Riparian Habitat Rangeland Grazing Silviculture Harvesting Streambank Modifications/destabilization
102 Bluewater Creek (non-tribal Rio San Jose to Bluewater Rsrv)
100% Loss of Riparian Habitat Rangeland Grazing Streambank Modifications/destabilization
92.9 Rio Moquino (Laguna Pueblo to Seboyettia Creek)
100% Loss of Riparian Habitat Mine Tailings Rangeland Grazing Surface Mining
Notes: (a) Measured Load as j/m2/s. Expressed as solar radiation. (b) From the 2006-2008 Integrated CWA §303(d)/305(b) list unless otherwise noted.

63
6.5 Linkage of Water Quality and Pollutant Sources
Water temperature influences the metabolism, behavior, and mortality of fish and other aquatic organisms. Natural temperatures of a waterbody fluctuate daily and seasonally. These natural fluctuations do not eliminate indigenous populations, but may affect existing community structure and geographical distribution of species. In fact, such temperature cycles are often necessary to induce reproductive cycles and may regulate other aspects of life history (Mount 1969). Behnke and Zarn (1976) in a discussion of temperature requirements for endangered western native trout recognized that populations cannot persist in waters where maximum temperatures consistently exceed 21-22°C, but they may survive brief daily periods of higher temperatures (25.5-26.7°C). Anthropogenic impacts can lead to modifications of these natural temperature cycles, often leading to deleterious impacts on the fishery. Such modifications may contribute to changes in geographical distribution of species and their ability to persist in the presence of introduced species. Of all the environmental factors affecting aquatic organisms in a waterbody, temperature is always a factor. Heat, which is a quantitative measure of energy of molecular motion that is dependent on the mass of an object or body of water is fundamentally different than temperature, which is a measure (unrelated to mass) of energy intensity. Organisms respond to temperature, not heat. Temperature increases, as observed in SWQB thermograph data, show temperatures that exceed the State water quality criterion for the protection of aquatic habitat, namely the CWAL designated use. Through monitoring, and pollutant source documentation, it has been observed that the most probable causes for these temperature exceedences are removal of riparian vegetation, streambank modification, livestock grazing, and natural causes. Alterations can be historical or current in nature. A variety of factors impact stream temperature (Figure 6.5). Decreased effective shade levels result from reduction of riparian vegetation. When canopy densities are compromised, thermal loading increases in response to the increase in incident solar radiation. Likewise, it is well documented that many past hydromodification activities have lead to channel widening. Wider stream channels also increase the stream surface area exposed to sunlight and heat transfer. Riparian area and channel morphology disturbances are attributed to past and to some extent current rangeland grazing practices that have resulted in reduction of riparian vegetation and streambank destabilization. These nonpoint sources of pollution primarily affect the water temperature through increased solar loading by: (1) increasing stream surface solar radiation and (2) increasing stream surface area exposed to solar radiation. Riparian vegetation, stream morphology, hydrology, climate, geographic location, and aspect influence stream temperature. Although climate, geographic location, and aspect are outside of human control, the condition of the riparian area, channel morphology and hydrology can be affected by land use activities. Specifically, the elevated summertime stream temperatures attributable to anthropogenic causes in Bluewater Creek and Rio Moquino basins can result from the following conditions:

64
1. Channel widening (i.e., increased width to depth ratios) that has increased the stream surface area exposed to incident solar radiation,
2. Riparian vegetation disturbance that has reduced stream surface shading, riparian vegetation height and density, and
3. Reduced summertime base flows that result from instream withdrawals and/or inadequate riparian vegetation. Base flows are maintained with a functioning riparian system so that loss of a functioning riparian system may lower and sometimes eliminate baseflows. Although removal of upland vegetation has been shown to increase water yield, studies show that removal of riparian vegetation along the stream channel subjects the water surface and adjacent soil surfaces to wind and solar radiation, partially offsetting the reduction in transpiration with evaporation. In losing stream reaches, increased temperatures can result in increased streambed infiltration, which can result in lower base flow (Constantz et al. 1994).
Analyses presented in these TMDLs demonstrate that defined loading capacities will ensure attainment of New Mexico WQS. Specifically, the relationship between shade, channel dimensions, solar radiation, and water quality attainment was demonstrated. Vegetation density increases will provide necessary shading, as well as encourage bank-building processes in severe hydrologic events. Where available data are incomplete or where the level of uncertainty in the characterization of sources is large, the recommended approach to TMDL assignments requires the development of allocations based on estimates utilizing the best available information. SWQB fieldwork includes a determination of the potential sources of impairment (NMED/SWQB 1999). The completed Pollutant Source(s) Documentation Protocol forms in Appendix A provide documentation of a visual analysis of probable sources along an impaired reach. Although this procedure is subjective, SWQB feels that it provides the best available information for the identification of potential sources of impairment in this watershed. Table 6.7 identifies probable sources of nonpoint source impairments along each reach as determined by field reconnaissance and assessment. It is important to consider not only the land directly adjacent to the stream, but also to consider upland and upstream areas in a more holistic watershed approach to implementing this TMDL.

65
Percent Effective Shade
Solar Radiation
Riparian Vegetation
due to high water surfacearea from increased
Sediment
Width Depth Ratio
Hillslope & StreambankFailures, Reduced
Riparian Vegetation
Water Temperature
result in rise above natural conditions a result of increased
from lack of
leads to
due to increased
due to reduced
leads to
Figure 6.7 Factors That Impact Water Temperature
6.6 Margin of Safety (MOS)
The Federal CWA requires that each TMDL be calculated with a MOS. This statutory requirement that TMDLs incorporate a MOS is intended to account for uncertainty in available data or in the actual effect controls will have on loading reductions and receiving water quality. A MOS may be expressed as unallocated assimilative capacity or conservative analytical assumptions used in establishing the TMDL (e.g., derivation of numeric targets, modeling assumptions or effectiveness of proposed management actions). The MOS may be implicit, utilizing conservative assumptions for calculation of the loading capacity, WLAs, and LAs. The MOS may also be explicitly stated as an added separate quantity in the TMDL calculation. For this TMDL, there were no MOS adjustments for point sources since there are none. In order to develop this temperature TMDL, the following conservative assumptions were used to parameterize the model:

66
• Data from the warmest time of the year were used in order to capture the seasonality of temperature exceedences.
• Critical upstream and downstream low flows were used because assimilative capacity of the stream to absorb and disperse solar heat is decreased during these flow conditions.
• Low flow was modeled using formulas developed by the USGS. One formula (Thomas et al. 1997) is recommended when the ratio between the gaged watershed area and the ungaged watershed area is between 0.5 and 1.5. When the ratio is outside of this range, a different regression formula is used (Waltemeyer 2002). See Appendix D for details.
As detailed in Appendix D, a variety of high quality hydrologic, geomorphologic, and meteorological data were used to parameterize the SSTEMP model. Because of the high quality of data and information that was put into this model and the continuous field monitoring data used to verify these model outputs, an explicit MOS of 10% is assigned to this TMDL.
6.7 Consideration of seasonal variation
Section 303(d)(1) of the CWA requires TMDLs to be “established at a level necessary to implement the applicable WQS with seasonal variation.” Both stream temperature and flow vary seasonally and from year to year. Water temperatures are coolest in winter and early spring months. Thermograph records show that temperatures exceed State of New Mexico WQS in summer and early fall. Warmest stream temperatures corresponded to prolonged solar radiation exposure, warmer air temperature, and low flow conditions. These conditions occur during late summer and early fall and promote the warmest seasonal instream temperatures. It is assumed that if critical conditions are met, coverage of any potential seasonal variation will also be met.
6.8 Future Growth
Estimations of future growth are not anticipated to lead to a significant increase for temperature that cannot be controlled with BMP implementation in this watershed.