usefulness of industry risk factors to internal auditors documents/usefulness of industry... ·...
TRANSCRIPT
Usefulness of Industry Risk Factors to Internal Auditors
Phillip Perry, CIA Senior Internal Auditor
Raymond Jeffords, Ph.D., CPA*
Professor of Accounting
both at Chattanooga Area Chapter Institute of Internal Auditors
Department of Accounting and Finance University of Tennessee at Chattanooga 615 McCallie Avenue Chattanooga, TN 37403 Tel: 423-425-4156 Email: [email protected]
Copyright 2003, Institute of Internal Auditors-Research Foundation

2
Introduction
Internal auditing professionals work in an environment that offers both daily challenges and constant change. Regardless of whether the audit engagement is financial or non-financial, routine or nonroutine review, an internal auditor must focus on the assigned task while also staying alert to his/her surroundings. An auditor should possess the skills necessary to identify both the problems and the symptoms that could lead to problems. Included in this overall responsibility is the identification of fraudulent activities and the ability to evaluate those environmental characteristics that allow fraudulent activities to occur. Several common risk factors have been identified through the years to assist the internal auditor with this task. These risk factors have proven useful in the past and have remained constant in an ever-changing audit environment.
Common Industry Risk Factors In 1987 the Commission on Fraudulent Financial Reporting (Treadway Commission) issued specific recommendations for all business professionals to consider as deterrents to fraudulent financial reporting. The risk factors identified by the Treadway Commission provide a variety of issues for internal auditors to take into consideration when evaluating business. The risk factors from the Treadway study were divided into two categorical environments, internal and external. The internal environment represents business activities that are under direct control of internal management. Categories in the internal environment are general internal controls, financial characteristics, operations, management characteristics, and accounting policies and procedures. The external environment is more focused on the industry characteristics and includes categories for industry conditions, business environment, and legal/regulatory conditions.
These factors were established as the industry standard for a ten-year span
between 1987 and 1997. Effective December 1997, the American Institute of Certified Public Accountants (AICPA) issued the Statement of Auditing Standards - #82 (SAS 82) – Consideration of Fraud in a Financial Statement Audit. Industry analysts agree that this SAS is of particular importance because it was the first auditing standard that specifically addresses fraud. Previously published auditing standards only hinted at fraudulent activities and only referred to errors or irregularities. SAS 82 does not recognize the internal or external environment previously discussed by the Treadway Commission report. Instead, SAS 82 focuses on two types of misstatements that internal auditors should consider while conducting a financial statement audit. These two types of misstatements relate to intentional fraudulent financial reporting and the misappropriation/theft of assets.
When first observed, the risk factor categories utilized in the Treadway Commission and SAS 82 appear to differ in nature. However, further review of the specifics and examples provided by each of these two documents indicate the intent of both is to provide similar risk factors that help identify and deter fraudulent activities. The contents of each document can be easily interchanged and classified into similar
3
categories. For example, SAS 82 lists the following three sub-categories as risk factors relating to misstatements of fraudulent financial reporting - management characteristics and influence over the control environment, operating characteristics and financial stability, and industry conditions. These same three classifications are included in the Treadway Commission report: two are related to the internal environment (management characteristics and operating characteristics), and one is considered part of the external environment (industry conditions).
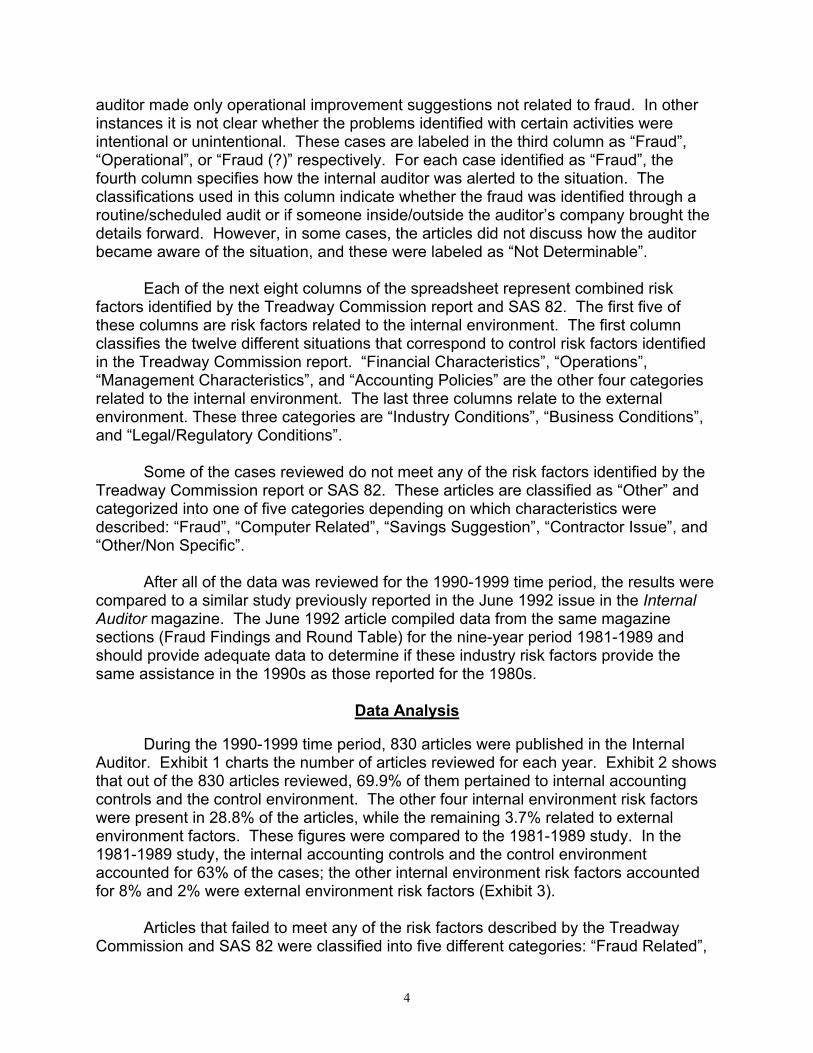
Purpose of Study The initial purpose of this study was to determine if these combined risk factors were adequate tools to guide the internal auditor in detecting fraudulent activity. This portion of the review will be restricted to and based upon industry cases reported during the 1990s. A second purpose of this report is to compare results from this study to a similar study reported in June 1992, which was based on industry cases report during the 1980s. (See "How Useful Are the Treadway Risk Factors?," by Raymond Jeffords, et al., Internal Auditor, Volume 49, Number 3, pages 60-61, June 1992). The role and responsibilities of the internal audit function has changed since the Treadway Commission report was first issued in 1987. This study should provide insight for the continued usefulness that these published risk factors (Treadway Commission in 1987 and SAS 82 in 1997) provided to internal auditors in the 1990s, as opposed to the results reported in a similar study that focused on industry cases from the 1980s.
Methodology
To determine the overall effectiveness that the combined risk factors identified by the Treadway Commission and SAS 82 have on the internal auditing function, an analysis was conducted of articles published in past issues of the Internal Auditor magazine. The cases identified in “The Round Table” and “Fraud Findings” sections of the magazine during the time period 1990 through 1999 were the basis for the total sample used to compile the comparison data. These two sections of the magazine are used to describe internal auditing issues and circumstances submitted for publication by the Institute of Internal Auditor (IIA) chapters all over the world. The ten-year period provided a wide variety of issues experienced during the day-to-day activities of internal auditors. Each case was reviewed for specific control weaknesses and environmental risk factors identified in both the Treadway Commission report and SAS 82.
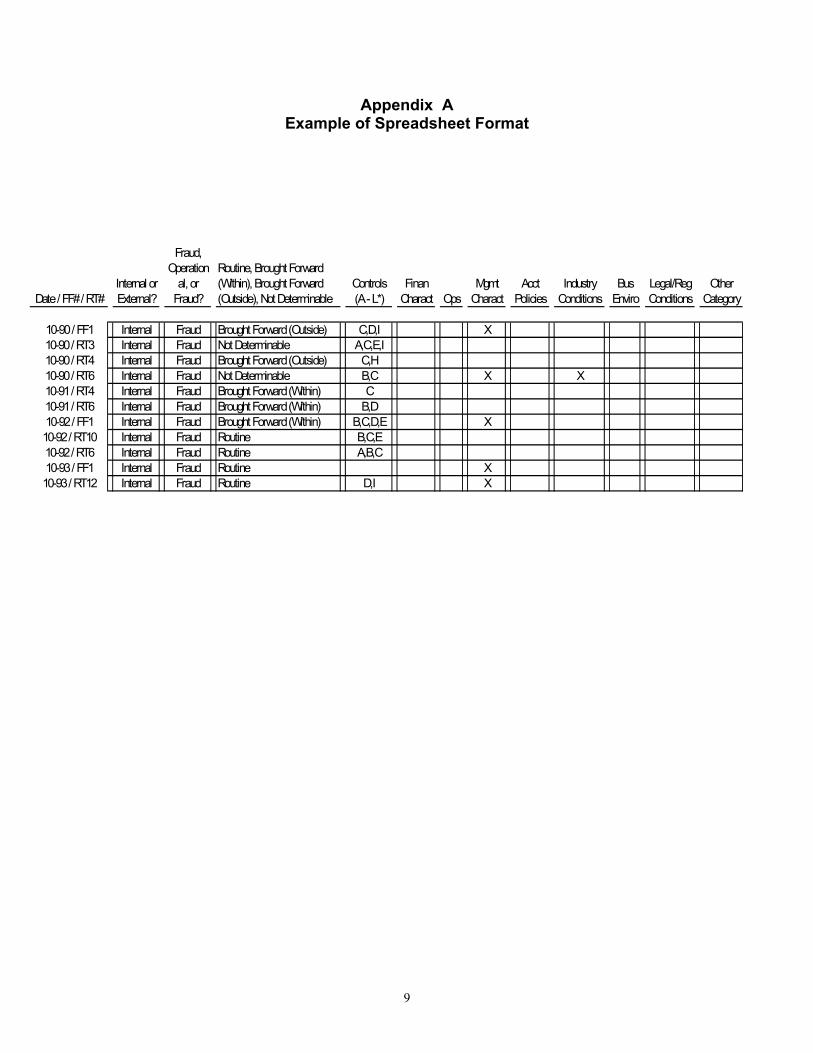
See Appendix A for an example of the spreadsheet developed to separate each of these cases into categories corresponding to the combined risk factors from Treadway and SAS 82. The first column identifies the month and year of the magazine reviewed and the type (e.g., RT or FF) of case within that magazine. For example, a location of RT4 corresponds to Round Table case number 4; whereas, FF1 would equate to Fraud Findings case number 1. The second column identifies whether or not the issues related to the case were within or outside the control of auditor’s company. The next or third column categorizes each case based on the topic discussed. In some instances, the case described fraudulent activity, while in other cases, the investigating
4
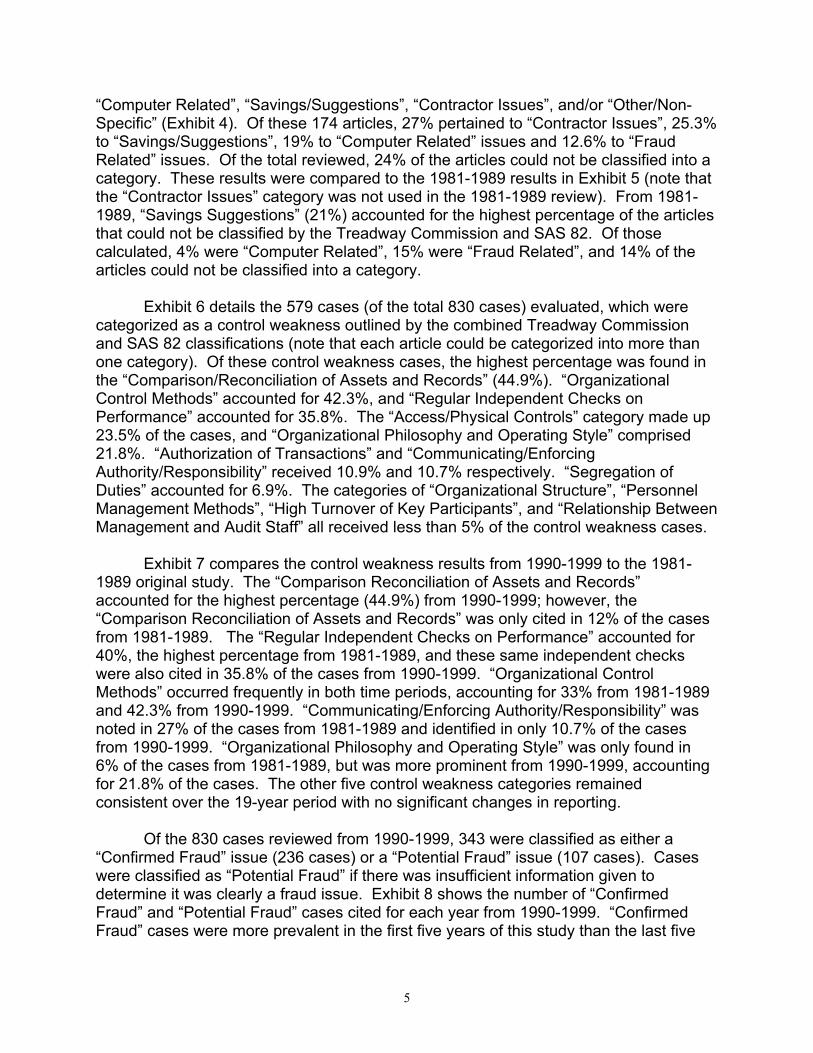
auditor made only operational improvement suggestions not related to fraud. In other instances it is not clear whether the problems identified with certain activities were intentional or unintentional. These cases are labeled in the third column as “Fraud”, “Operational”, or “Fraud (?)” respectively. For each case identified as “Fraud”, the fourth column specifies how the internal auditor was alerted to the situation. The classifications used in this column indicate whether the fraud was identified through a routine/scheduled audit or if someone inside/outside the auditor’s company brought the details forward. However, in some cases, the articles did not discuss how the auditor became aware of the situation, and these were labeled as “Not Determinable”.
Each of the next eight columns of the spreadsheet represent combined risk
factors identified by the Treadway Commission report and SAS 82. The first five of these columns are risk factors related to the internal environment. The first column classifies the twelve different situations that correspond to control risk factors identified in the Treadway Commission report. “Financial Characteristics”, “Operations”, “Management Characteristics”, and “Accounting Policies” are the other four categories related to the internal environment. The last three columns relate to the external environment. These three categories are “Industry Conditions”, “Business Conditions”, and “Legal/Regulatory Conditions”.
Some of the cases reviewed do not meet any of the risk factors identified by the
Treadway Commission report or SAS 82. These articles are classified as “Other” and categorized into one of five categories depending on which characteristics were described: “Fraud”, “Computer Related”, “Savings Suggestion”, “Contractor Issue”, and “Other/Non Specific”.
After all of the data was reviewed for the 1990-1999 time period, the results were compared to a similar study previously reported in the June 1992 issue in the Internal Auditor magazine. The June 1992 article compiled data from the same magazine sections (Fraud Findings and Round Table) for the nine-year period 1981-1989 and should provide adequate data to determine if these industry risk factors provide the same assistance in the 1990s as those reported for the 1980s.
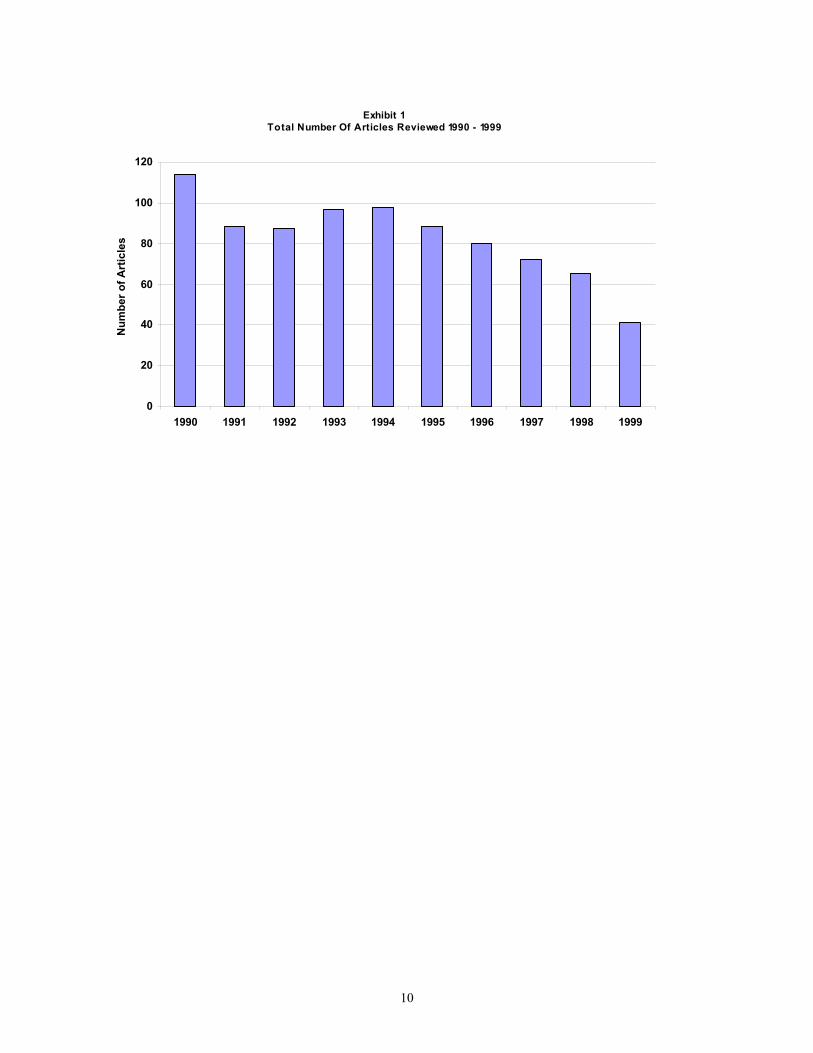
Data Analysis During the 1990-1999 time period, 830 articles were published in the Internal Auditor. Exhibit 1 charts the number of articles reviewed for each year. Exhibit 2 shows that out of the 830 articles reviewed, 69.9% of them pertained to internal accounting controls and the control environment. The other four internal environment risk factors were present in 28.8% of the articles, while the remaining 3.7% related to external environment factors. These figures were compared to the 1981-1989 study. In the 1981-1989 study, the internal accounting controls and the control environment accounted for 63% of the cases; the other internal environment risk factors accounted for 8% and 2% were external environment risk factors (Exhibit 3). Articles that failed to meet any of the risk factors described by the Treadway Commission and SAS 82 were classified into five different categories: “Fraud Related”,
5
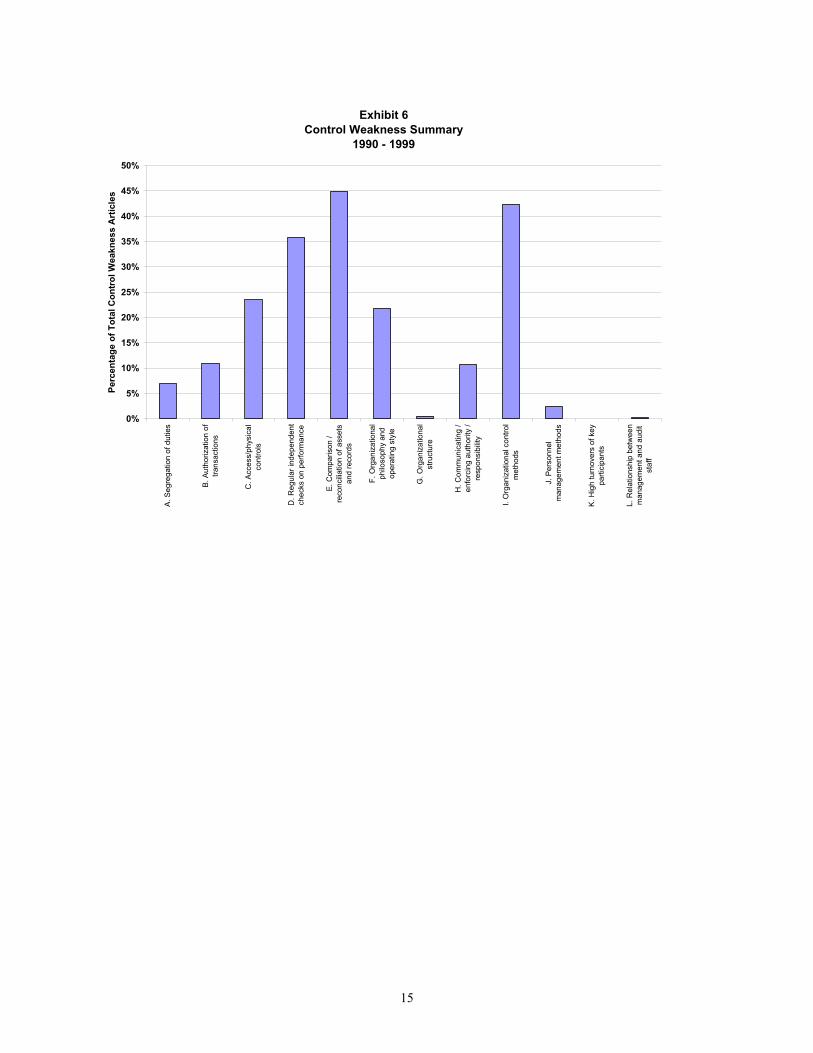
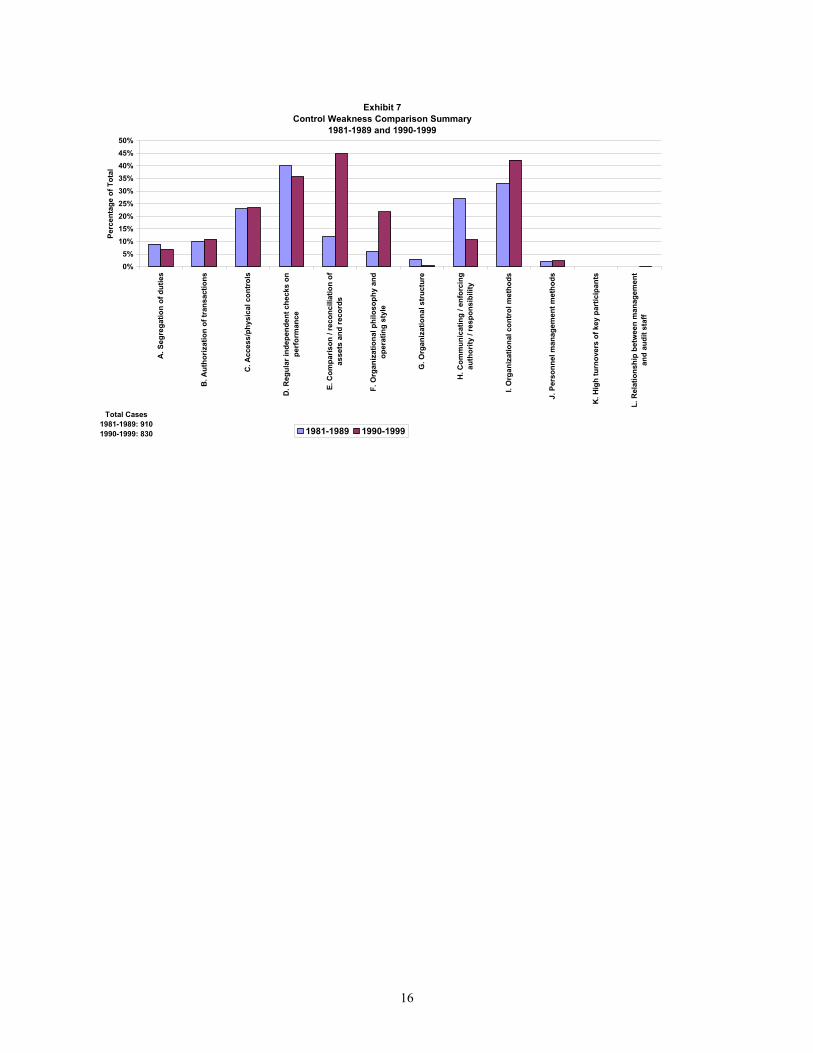
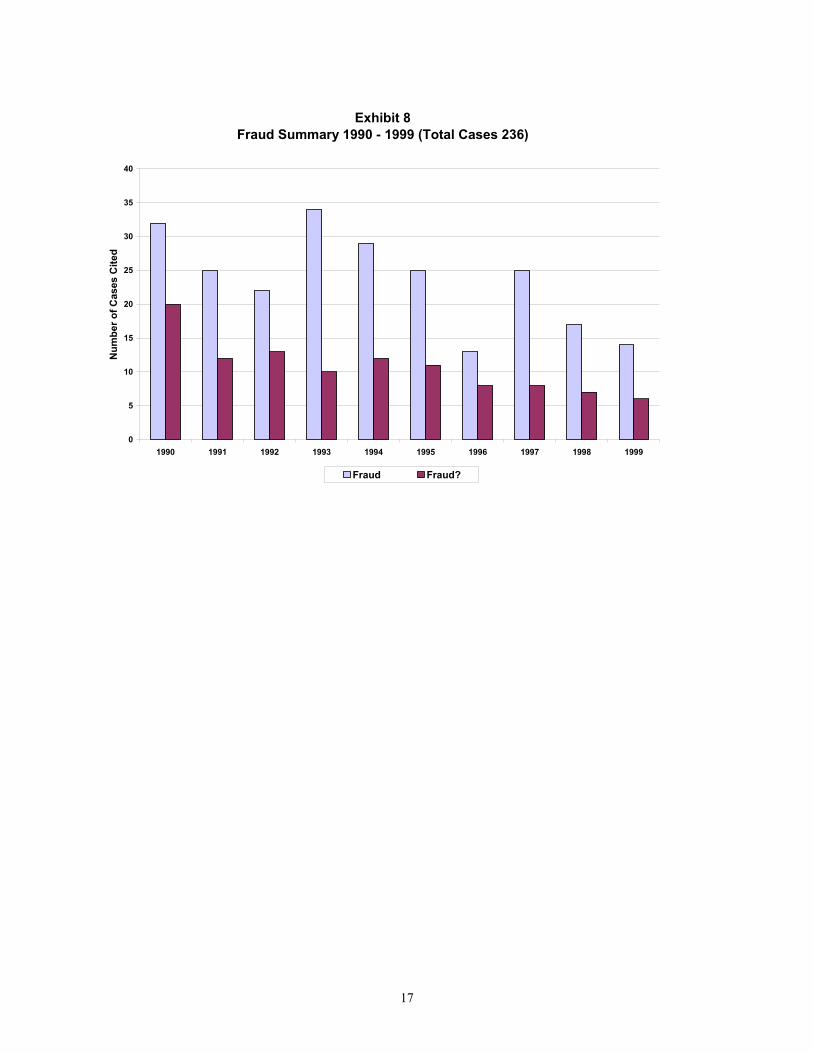
“Computer Related”, “Savings/Suggestions”, “Contractor Issues”, and/or “Other/Non-Specific” (Exhibit 4). Of these 174 articles, 27% pertained to “Contractor Issues”, 25.3% to “Savings/Suggestions”, 19% to “Computer Related” issues and 12.6% to “Fraud Related” issues. Of the total reviewed, 24% of the articles could not be classified into a category. These results were compared to the 1981-1989 results in Exhibit 5 (note that the “Contractor Issues” category was not used in the 1981-1989 review). From 1981-1989, “Savings Suggestions” (21%) accounted for the highest percentage of the articles that could not be classified by the Treadway Commission and SAS 82. Of those calculated, 4% were “Computer Related”, 15% were “Fraud Related”, and 14% of the articles could not be classified into a category. Exhibit 6 details the 579 cases (of the total 830 cases) evaluated, which were categorized as a control weakness outlined by the combined Treadway Commission and SAS 82 classifications (note that each article could be categorized into more than one category). Of these control weakness cases, the highest percentage was found in the “Comparison/Reconciliation of Assets and Records” (44.9%). “Organizational Control Methods” accounted for 42.3%, and “Regular Independent Checks on Performance” accounted for 35.8%. The “Access/Physical Controls” category made up 23.5% of the cases, and “Organizational Philosophy and Operating Style” comprised 21.8%. “Authorization of Transactions” and “Communicating/Enforcing Authority/Responsibility” received 10.9% and 10.7% respectively. “Segregation of Duties” accounted for 6.9%. The categories of “Organizational Structure”, “Personnel Management Methods”, “High Turnover of Key Participants”, and “Relationship Between Management and Audit Staff” all received less than 5% of the control weakness cases. Exhibit 7 compares the control weakness results from 1990-1999 to the 1981-1989 original study. The “Comparison Reconciliation of Assets and Records” accounted for the highest percentage (44.9%) from 1990-1999; however, the “Comparison Reconciliation of Assets and Records” was only cited in 12% of the cases from 1981-1989. The “Regular Independent Checks on Performance” accounted for 40%, the highest percentage from 1981-1989, and these same independent checks were also cited in 35.8% of the cases from 1990-1999. “Organizational Control Methods” occurred frequently in both time periods, accounting for 33% from 1981-1989 and 42.3% from 1990-1999. “Communicating/Enforcing Authority/Responsibility” was noted in 27% of the cases from 1981-1989 and identified in only 10.7% of the cases from 1990-1999. “Organizational Philosophy and Operating Style” was only found in 6% of the cases from 1981-1989, but was more prominent from 1990-1999, accounting for 21.8% of the cases. The other five control weakness categories remained consistent over the 19-year period with no significant changes in reporting. Of the 830 cases reviewed from 1990-1999, 343 were classified as either a “Confirmed Fraud” issue (236 cases) or a “Potential Fraud” issue (107 cases). Cases were classified as “Potential Fraud” if there was insufficient information given to determine it was clearly a fraud issue. Exhibit 8 shows the number of “Confirmed Fraud” and “Potential Fraud” cases cited for each year from 1990-1999. “Confirmed Fraud” cases were more prevalent in the first five years of this study than the last five

6
years. Of the 960 cases studied from 1981-1989, 135 were “Confirmed Fraud” issues, while “Potential Fraud” issue were not included in the original study.
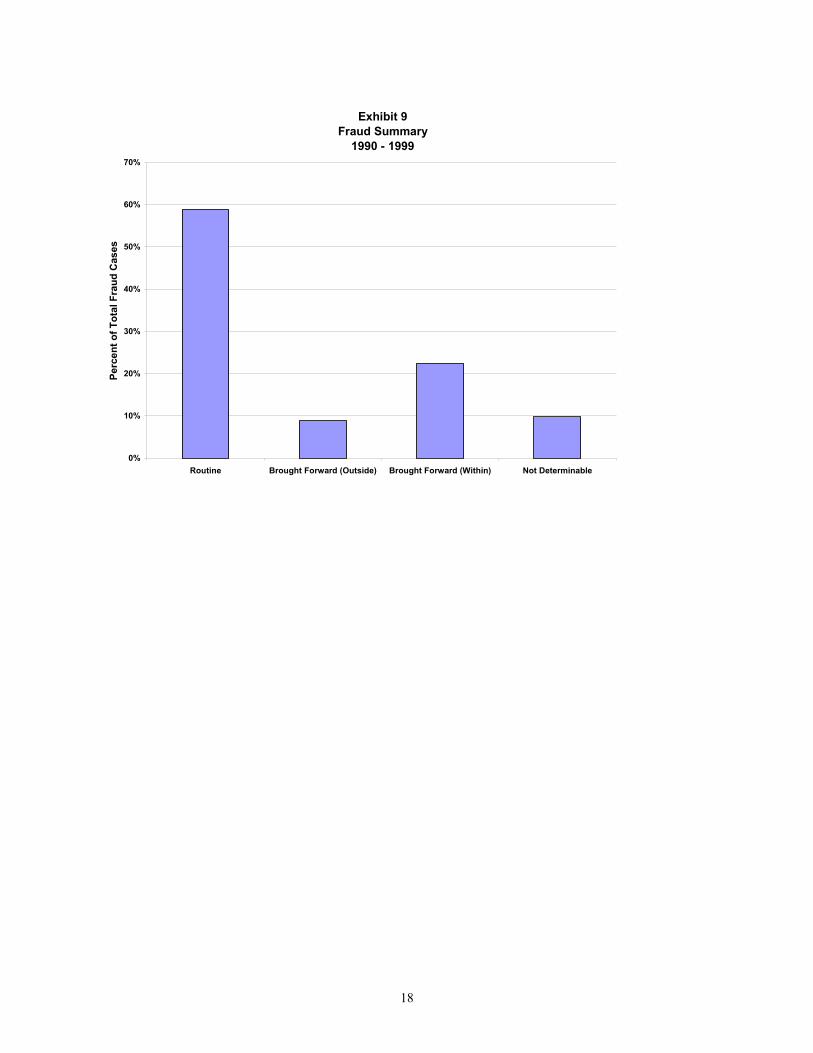
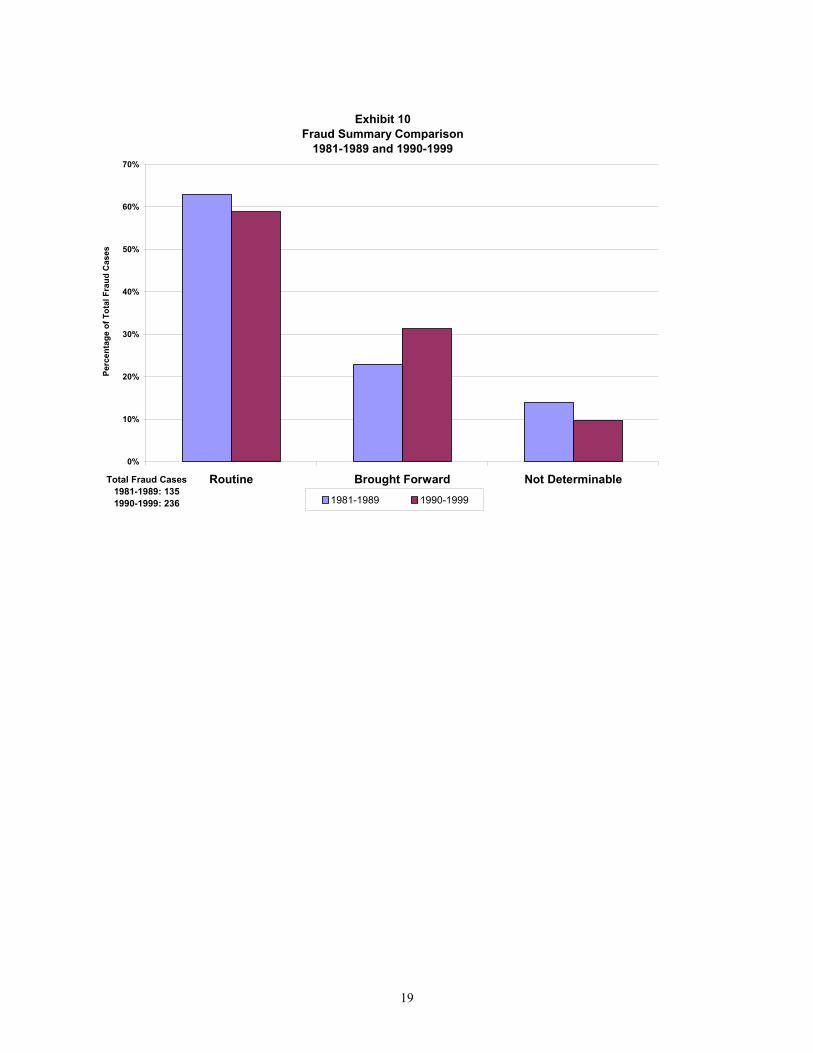
Each of the 236 fraud cases from 1990-1999 was labeled according to how the fraud issue was identified (Exhibit 9). “Routine Audits” accounted for 58.9% of the fraud identifications. A combined total of 31.4% of the fraud issues were brought to the attention of the auditor, with 22.5% coming from within the company, and only 8.9% were brought to he auditor’s attention from an outside source. In almost 10% of the fraud cases reviewed, there was not sufficient information given to determine how the fraudulent activity was detected. Exhibit 10 compares how the fraud findings were identified from 1990-1999 to the fraud cases identified in the study from 1981-1989. Fraud issues found through routine audits in the 1981-1989 study also accounted for the highest percentage of fraud detection at 63%. Twenty-three percent of the fraud findings were brought to the attention of the auditor in the 1981-1989 study. The 1981-1989 review did not identify whether or not the fraud findings were brought to the attention of the auditor from an inside or outside source, which was done with the 1990-1999 review. Therefore, these two categories were combined for the 1990-1999 cases for a total percentage of 31.4%. Fourteen percent of the fraud cases reviewed in the 1981-1989 study did not contain information about who brought the fraudulent activity to the attention of the auditor.
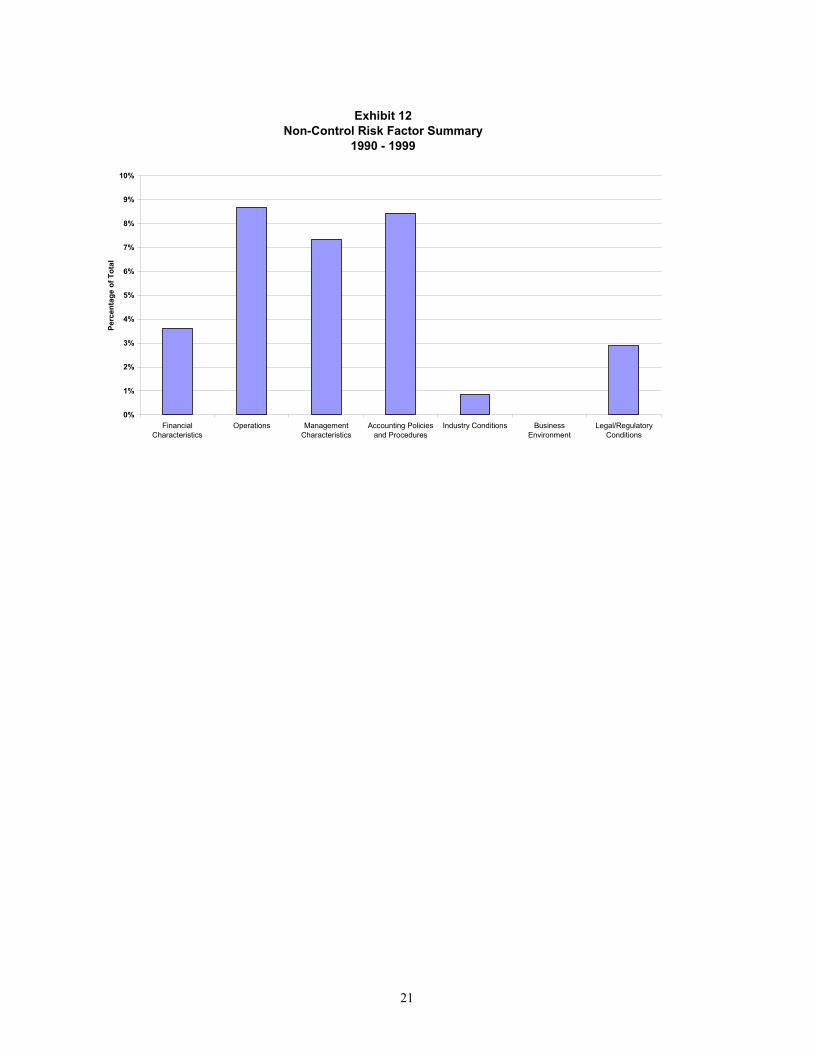
Exhibit 11 illustrates the number of all other non-control risk factors in the internal
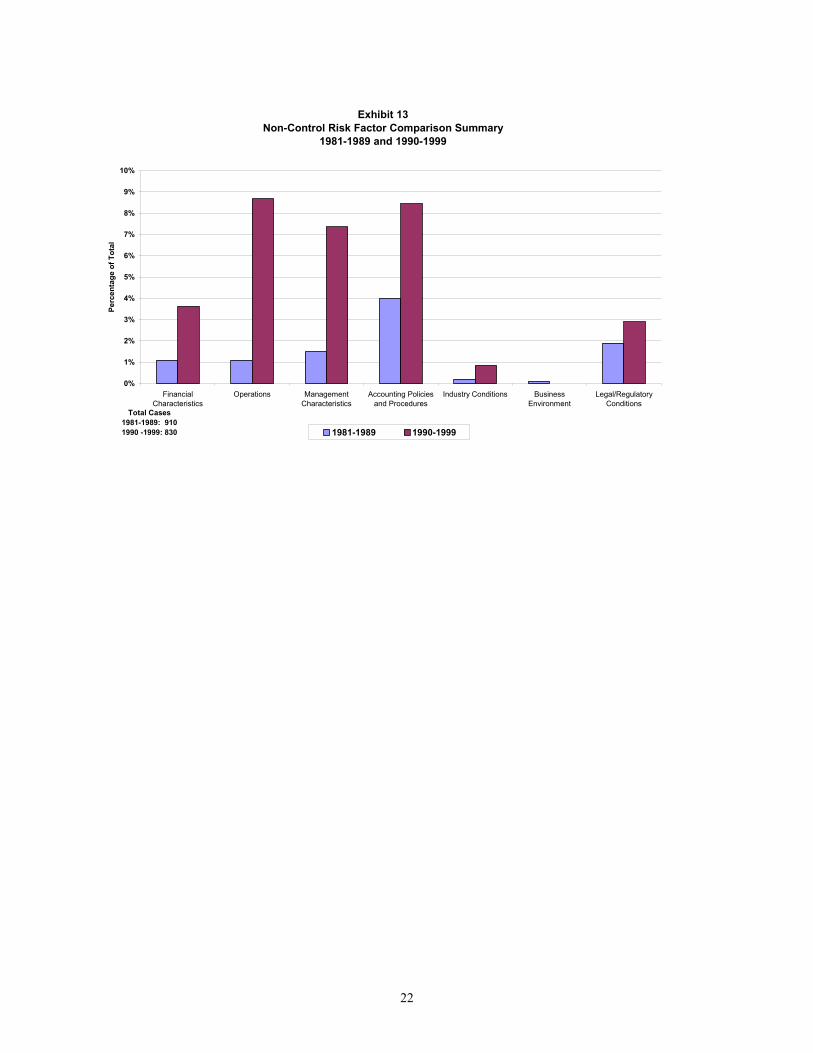
and external environment each year from 1990-1999. Of these non-control risk factors, the highest percentages related to “Operations” (8.7%), “Accounting Policies and Procedures” (8.4%), and “Management Characteristics” (7.3%). “Financial Characteristics”, “Industry Conditions”, “Business Environment”, and “Legal/Regulatory Conditions” accounted for less than 4% each (Exhibit 12). These non-control risk factors identified in the 1990-1999 study were compared to the non-control risk factor findings in the 1981-1989 study (Exhibit 13). “Accounting Policies and Procedures” (4%), “Operations” (1.1%), “Management Characteristics” (1.5%), and “Legal/Regulatory Conditions” (1.9%) were the highest non-control risk factors identified in the 1981-1989 study. “Industry Conditions” and “Business Environment” were insignificant non-control risk factors in both studies.
Conclusion
The Treadway Commission and the SAS 82 provide a beneficial outline of issues internal auditors can use to detect both fraudulent activity and operational improvement recommendations. Of the 830 articles reviewed from 1990-1999, 79% of the cases could be classified into one of the categories identified in the combined Treadway Commission report and SAS 82. Almost 70% of these articles were identified as an internal control risk, with the most frequent occurring issues being “Comparison/ Reconciliation of Assets and Records” (44.9%), “Organizational Control Methods” (42.3%), and “Regular Checks on Performance” (35.8%). The other 9% of the cases identified in the study fell into the category of “Other” internal environment risk factors (28.8%) and external environment risk factors (3.7%). Only 21% of the articles could

7
not be classified using the guidelines of the combined Treadway Commission and SAS 82. The majority of these unclassifiable articles fall into three different situations. Of the total, 24% of these articles could not be classified because of insufficient information given in the case description, and 27% of the remaining cases related to contractor issues, which are out of the management control of the internal auditor’s organization. There were several different scenarios where the auditor found that errors existed in the way a contractor was billing his/her organization. Another 19% of the articles detailed some type computer related activity, most of which dealt with the preparation and potential problems related to the Year 2000 computer conversion. Savings suggestions made by the internal auditor accounted for another 25.3%. In the 1981-1989 study, approximately 63% of the 910 cases reviewed could be classified under one or more of the internal control risk factors identified in the Treadway report. At the time this study was done, the standards for the SAS were not yet available. While the internal accounting controls and control environment category was relatively consistent over the past nineteen years, there was a 20% increase in the number of other internal environment risk factors recorded in the 1990-1999 study. Of the articles classified as “Other”, there was a 15% increase in the 1990-1999 study of computer related cases. This may be attributed to the potential problems arising from the Year 2000 computer conversion. Of the internal control risk factors, there was a 33% increase in the “Comparison/Reconciliation of Assets and Records” category and a 16% increase in the “Organizational Philosophy and Operating Style” category in the 1990-1999 study. There was an 18% decrease in cases involving “Communication/Enforcing Authority/Responsibility” in the 1990-1999 study. In the1990-1999 study, fraudulent or potentially fraudulent activities were detected in 41.3% of the 830 cases reviewed. Of the 236 confirmed cases of fraud, 58.9% were identified during routine audits. An additional 31.3% of the fraud cases were brought to the auditor’s attention. Although only 14.8% of the cases reviewed in the 1981-1989 study were classified as “Confirmed Fraud”, there does not appear to be a great difference in how the fraudulent activities were detected by the auditor. The risk factors identified by the Treadway Commission and SAS 82 prove to be very useful to auditors in detecting and identifying fraudulent activity within their organization. Only one significant area, contractor related issues, was noted where fraudulent or potentially fraudulent issues were not discussed in either documented guideline report. Many times auditors found in routine audits that contractors were double billing their organization or overcharging for items specified by an established contract. It is difficult to determine if a contractor is purposely acting with fraudulent intent or if he/she had just made an error. However, because the daily operations and intent of contractors are out of the control of internal auditor’s company, it would be difficult to gauge the effectiveness of risk factor guidelines directed towards contracted relationships. In the wake of the fraudulent financial statement scandals that have recently occurred (for example Enron), the governing bodies of the accounting industry are
8
currently developing new standards to assist the auditors in identifying fraudulent activity. The initial steps were taken by the Auditing Standards Board (ASB) in November 2002 when Statement of Auditing Standards (SAS) No. 99, entitled Consideration of Fraud in a Financial Statement Audit, was issued. SAS 99 supersedes SAS 82, which provided the risk factors used in this review. Included in the newly issued SAS is a section devoted to risk factors related to misstatements from fraudulent financial reporting. These risk factors provide virtually the same intent and theory as those previously described in both the Treadway Commission report and SAS 82, although the wording and examples have been modified. This provides further support to the conclusion that the risk factors originally identified in the Treadway Commission report (1987) should provide an adequate guide to assist the internal auditor in detecting fraudulent activity.
9
Appendix A Example of Spreadsheet Format
Date / FF# / RT#Internal or External?
Fraud, Operation
al, or Fraud?
Routine, Brought Forward (Within), Brought Forward (Outside), Not Determinable
Controls (A - L*)
Finan Charact Ops
Mgmt Charact
Acct Policies
Industry Conditions
Bus Enviro
Legal/Reg Conditions
Other Category
10-90 / FF1 Internal Fraud Brought Forward (Outside) C,D,I X10-90 / RT3 Internal Fraud Not Determinable A,C,E,I10-90 / RT4 Internal Fraud Brought Forward (Outside) C,H10-90 / RT6 Internal Fraud Not Determinable B,C X X10-91 / RT4 Internal Fraud Brought Forward (Within) C10-91 / RT6 Internal Fraud Brought Forward (Within) B,D10-92 / FF1 Internal Fraud Brought Forward (Within) B,C,D,E X10-92 / RT10 Internal Fraud Routine B,C,E10-92 / RT6 Internal Fraud Routine A,B,C10-93 / FF1 Internal Fraud Routine X10-93 / RT12 Internal Fraud Routine D,I X
10
Exhibit 1 Total Number Of Articles Reviewed 1990 - 1999
0
20
40
60
80
100
120
1990 1991 1992 1993 1994 1995 1996 1997 1998 1999
Num
ber o
f Art
icle
s

11
Exhibit 2 Summary of Spreadsheet Classifications
0%
10%
20%
30%
40%
50%
60%
70%
80%
Internal Accounting Controlsand Control Environment
Other Internal EnvironmentRisk Factors
External Environment RiskFactors
Perc
enta
ge o
f Art
icle
s R
evie
wed

12
Exhibit 3Summary Comparison of Spreadsheet Classifications
1981-1989 and 1990-1999
0%
10%
20%
30%
40%
50%
60%
70%
80%
Internal Accounting Controls andControl Environment
Other Internal Environment RiskFactors
External Environment RiskFactors
Total Cases: 1981-1989: 910 1990-1999: 830
Perc
enta
ge o
f Tot
al C
ases
1981-1989 1990-1999

13
Exhibit 4Summary of Other Classification
1990 - 1999
0%
5%
10%
15%
20%
25%
30%
Fraud Related Computer Related Savings / Suggestions Contractor Issues Other / Non Specific
Perc
enta
ge o
f Tot
al O
ther
Art
icle
s

14
Exhibit 5 Summary Comparison of Other Classifications
1981-1999 and 1990-1999
0%
5%
10%
15%
20%
25%
30%
Fraud Related Computer Related Savings / Suggestions Contractor Issues(Category Not Used In
1981-1989 Review)
Other / Non Specific
Total Cases1981-1989: 9101990-1999: 830
Perc
enta
ge o
f Tot
al C
ases
1981-1989 1990-1999
15
Exhibit 6Control Weakness Summary
1990 - 1999
0%
5%
10%
15%
20%
25%
30%
35%
40%
45%
50%A.
Seg
rega
tion
of d
utie
s
B. A
utho
rizat
ion
oftra
nsac
tions
C. A
cces
s/ph
ysic
alco
ntro
ls
D. R
egul
ar in
depe
nden
tch
ecks
on
perfo
rman
ce
E. C
ompa
rison
/re
conc
iliatio
n of
ass
ets
and
reco
rds
F. O
rgan
izat
iona
lph
iloso
phy
and
oper
atin
g st
yle
G. O
rgan
izat
iona
lst
ruct
ure
H. C
omm
unic
atin
g /
enfo
rcin
g au
thor
ity /
resp
onsi
bilit
y
I. O
rgan
izat
iona
l con
trol
met
hods
J. P
erso
nnel
man
agem
ent m
etho
ds
K. H
igh
turn
over
s of
key
parti
cipa
nts
L. R
elat
ions
hip
betw
een
man
agem
ent a
nd a
udit
staf
f
Perc
enta
ge o
f Tot
al C
ontr
ol W
eakn
ess
Art
icle
s
16
Exhibit 7Control Weakness Comparison Summary
1981-1989 and 1990-1999
0%5%
10%15%20%25%30%35%40%45%50%
A. S
egre
gatio
n of
dut
ies
B. A
utho
rizat
ion
of tr
ansa
ctio
ns
C. A
cces
s/ph
ysic
al c
ontr
ols
D. R
egul
ar in
depe
nden
t che
cks
onpe
rfor
man
ce
E. C
ompa
rison
/ re
conc
iliat
ion
ofas
sets
and
reco
rds
F. O
rgan
izat
iona
l phi
loso
phy
and
oper
atin
g st
yle
G. O
rgan
izat
iona
l str
uctu
re
H. C
omm
unic
atin
g / e
nfor
cing
auth
ority
/ re
spon
sibi
lity
I. O
rgan
izat
iona
l con
trol
met
hods
J. P
erso
nnel
man
agem
ent m
etho
ds
K. H
igh
turn
over
s of
key
par
ticip
ants
L. R
elat
ions
hip
betw
een
man
agem
ent
and
audi
t sta
ff
Total Cases 1981-1989: 910 1990-1999: 830
Perc
enta
ge o
f Tot
al
1981-1989 1990-1999
17
Exhibit 8Fraud Summary 1990 - 1999 (Total Cases 236)
0
5
10
15
20
25
30
35
40
1990 1991 1992 1993 1994 1995 1996 1997 1998 1999
Num
ber o
f Cas
es C
ited
Fraud Fraud?
18
Exhibit 9Fraud Summary
1990 - 1999
0%
10%
20%
30%
40%
50%
60%
70%
Routine Brought Forward (Outside) Brought Forward (Within) Not Determinable
Perc
ent o
f Tot
al F
raud
Cas
es
19
Exhibit 10Fraud Summary Comparison
1981-1989 and 1990-1999
0%
10%
20%
30%
40%
50%
60%
70%
Routine Brought Forward Not DeterminableTotal Fraud Cases 1981-1989: 135 1990-1999: 236
Perc
enta
ge o
f Tot
al F
raud
Cas
es
1981-1989 1990-1999

20
Exhibit 11Total Non-Control Risk Factors By Year 1990 - 1999
0
10
20
30
40
50
60
1990 1991 1992 1993 1994 1995 1996 1997 1998 1999
Num
ber o
f Cas
es
21
Exhibit 12Non-Control Risk Factor Summary
1990 - 1999
0%
1%
2%
3%
4%
5%
6%
7%
8%
9%
10%
FinancialCharacteristics
Operations ManagementCharacteristics
Accounting Policiesand Procedures
Industry Conditions BusinessEnvironment
Legal/RegulatoryConditions
Perc
enta
ge o
f Tot
al
22
Exhibit 13Non-Control Risk Factor Comparison Summary
1981-1989 and 1990-1999
0%
1%
2%
3%
4%
5%
6%
7%
8%
9%
10%
FinancialCharacteristics
Operations ManagementCharacteristics
Accounting Policiesand Procedures
Industry Conditions BusinessEnvironment
Legal/RegulatoryConditions
Total Cases 1981-1989: 9101990 -1999: 830
Perc
enta
ge o
f Tot
al
1981-1989 1990-1999