usefulness of eeg techniques in distinguishing ...downloads.hindawi.com › journals › dm › 2018...
TRANSCRIPT
Review ArticleUsefulness of EEG Techniques in Distinguishing FrontotemporalDementia from Alzheimer’s Disease and Other Dementias
Raffaele Nardone ,1,2,3 Luca Sebastianelli ,4,5 Viviana Versace,4,5 Leopold Saltuari,4,5,6
Piergiorgio Lochner ,7 Vanessa Frey,2 Stefan Golaszewski ,2,3 Francesco Brigo ,1,8
Eugen Trinka,2,9,10 and Yvonne Höller 2
1Department of Neurology, Franz Tappeiner Hospital, Merano, Italy2Department of Neurology, Christian Doppler Klinik, Paracelsus Medical University, Salzburg, Austria3Karl Landsteiner Institut für Neurorehabilitation und Raumfahrtneurologie, Salzburg, Austria4Department of Neurorehabilitation, Hospital of Vipiteno, Vipiteno, Italy5Research Department for Neurorehabilitation South Tyrol, Bolzano, Italy6Department of Neurology, Hochzirl Hospital, Zirl, Austria7Department of Neurology, Saarland University Medical Center, Homburg, Germany8Department of Neurosciences, Biomedicine, and Movement Sciences, University of Verona, Verona, Italy9Centre for Cognitive Neuroscience, Paracelsus Medical University, Salzburg, Austria10University for Medical Informatics and Health Technology (UMIT), Hall in Tirol, Austria
Correspondence should be addressed to Raffaele Nardone; [email protected]
Received 17 March 2018; Revised 14 June 2018; Accepted 30 July 2018; Published 3 September 2018
Academic Editor: Donald H. Chace
Copyright © 2018 Raffaele Nardone et al. This is an open access article distributed under the Creative Commons AttributionLicense, which permits unrestricted use, distribution, and reproduction in any medium, provided the original work isproperly cited.
The clinical distinction of frontotemporal dementia (FTD) and Alzheimer’s disease (AD) may be difficult. In this narrative reviewwe summarize and discuss the most relevant electroencephalography (EEG) studies which have been applied to demented patientswith the aim of distinguishing the various types of cognitive impairment. EEG studies revealed that patients at an early stage of FTDor AD displayed different patterns in the cortical localization of oscillatory activity across different frequency bands and infunctional connectivity. Both classical EEG spectral analysis and EEG topography analysis are able to differentiate the differentdementias at group level. The combination of standardized low-resolution brain electromagnetic tomography (sLORETA) andpower parameters seems to improve the sensitivity, but spectral and connectivity biomarkers able to differentiate single patientshave not yet been identified. The promising EEG findings should be replicated in larger studies, but could represent anadditional useful, noninvasive, and reproducible diagnostic tool for clinical practice.
1. Introduction
Alzheimer’s disease (AD) and frontotemporal dementia(FTD) are the most common causes of dementia. However,the differential diagnosis is challenging due to their overlap-ping clinical symptoms and involved brain regions. Currentclinical criteria identify distinct phenotypes of FTD on thebasis of presenting clinical features; these include thebehavioral variant of FTD (bvFTD), the agrammatic variantof primary progressive aphasia, and the semantic variant of
primary progressive aphasia [1, 2]. The bvFTD is character-ized by changes in social behavior and conduct, with loss ofsocial awareness, poor impulse control, hyperorality, and die-tary changes, as well as apathy and impaired performance inexecutive tasks [3]. Even if diagnostic criteria exist [4], thedisease remains poorly recognized. Other less frequent causesof dementia, such as dementia with Lewy bodies (DLB) andParkinson’s disease dementia (PDD), are probably stillunderdiagnosed in the clinical setting, and also sometimesdifficult to differentiate from AD and FTD.
HindawiDisease MarkersVolume 2018, Article ID 6581490, 9 pageshttps://doi.org/10.1155/2018/6581490
Some neuroimaging techniques, such as positron emissiontomography (PET), single photon emission computerizedtomography (SPECT), and functional magnetic resonance(MRI) have been used in order to identify affected brainregions in dementias and to improve diagnostic accuracy.However, these imaging tools are invasive, expensive, andoften not clinically feasible.
In contrast, the electroencephalogram (EEG) repre-sents a noninvasive technique that is cheap, highly avail-able, and sensitive to changes in the functional state of thehuman brain.
We aimed in this narrative review to summarize anddiscuss the most relevant studies dealing with EEG tech-niques in order to distinguish FTD from AD, other demen-tias, and healthy subjects.
2. Methods
The MEDLINE, accessed by PubMed (1966–February2018) and EMBASE (1980–February 2018) electronic data-bases, was searched using the following medical subjectheadings (MeSH) and free terms: “Frontotemporal demen-tia,” “Frontotemporal lobar degeneration,” “Alzheimer’s dis-ease,” “Dementia with Lewy bodies,” “Lewy body dementia,”“Parkinson’s disease dementia,” “Electroencephalography,”“Spectral analysis,” and “Connectivity.”
Only original articles written in English were consid-ered eligible for inclusion. Review articles were excluded.For the selected titles, full-text articles were retrieved andtheir reference lists were searched for additional publica-tions. In the case of missing or incomplete data, principalinvestigators of included trials were contacted and additionalinformation requested. The titles and abstracts of the initiallyidentified studies were screened to determine if they satisfiedthe selection criteria. Two reviewers independently assessedthe methodological quality of each study and risk of bias,focusing on blinding. The search strategy described aboveyielded 10 results, two of which were excluded after readingthe full paper, thereby leaving 8 studies which contributedto this review.
3. Electroencephalography (EEG)
3.1. EEG Analysis. The EEG represents an old and inexpen-sive method that has been employed for many years indementia research. EEG has been examined in dementedpatients in order to differentiate individuals with varioustypes and severity of cognitive impairment from healthysubjects. While visual EEG analysis still prevails in routineclinical practice, the differential diagnosis of the varioussubtypes of dementia relies on quantitative EEG (qEEG),where extensive technical knowledge is needed in the fieldof digital signal processing. One of the most frequently usedresearch methods is the spectral analysis, and thereforesometimes the term qEEG is used to indicate quantitativespectral analysis. However, qEEG offers a wider spectrumof possible applications. By means of computational algo-rithms, such as fast Fourier transform (FFT) or autoregres-sive (AR) models [5–10], the characteristics of the EEG can
be documented in an objective and quantitative way. More-over, the EEG analysis is not restricted to the predefined sur-face localizations of the international electrode systems suchas the 10-20 system. Advanced methods of EEG analysishave been applied to the study of neural activity sources in3-D models of the brain, and different techniques knownas solutions for the EEG inverse problem have been pro-posed throughout the years [11–14]. Furthermore, low-resolution brain electromagnetic tomography (LORETA)allowing 3-D localization of cortical EEG generators bothin the time and frequency domains [15, 16], has been suc-cessfully applied to study EEG changes across normalelderly, mild cognitive impairment, and dementia [17–19].In addition, standardized LORETA (sLORETA) [12], allowsobtaining images of standardized current density with theso-called “0 localization error”.
3.2. EEG Studies. Generalized EEG slowing has beenobserved in a number of studies in AD during rest. This slow-ing can thus be assessed visually by qualitative EEG assess-ment as decreased frequency of the dominant backgroundrhythm, or by spectral analysis as increased power of slowrhythms (δ and θ frequency bands) and reduced power offaster rhythms (upper α and β bands) [10, 20, 21]. Indeed,the peak frequency in the power spectrum, which is normallylocated between 8 and 12Hz, shifts in AD to a lower range of6–8Hz. However, only a few studies have investigated EEGchanges in FTD. Qualitative evaluation of EEG recordingstypically shows no abnormal slowing in FTD patients [22].We could like to point out that pathological slowing of theEEG can be seen as a more extreme form of the general slow-ing of the background rhythm that can be found also inhealthy ageing. Thus, age-matched control groups are a nec-essary prerequisite for these studies; otherwise, the EEG-slowing effect will be overestimated.
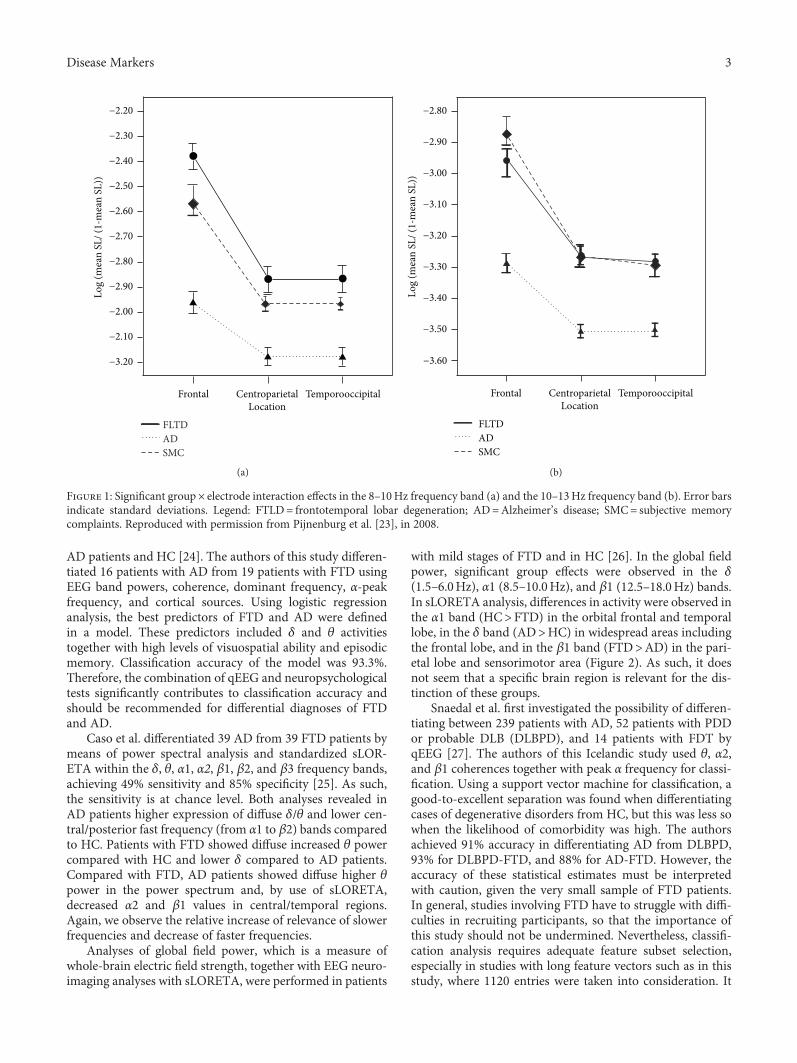
Mild to moderate FTD and AD patients have been com-pared with healthy controls (HC) using a so-called visualgrand total EEG score and the synchronization likelihoodas a measure of functional connectivity [23]. No significantdifferences were found in the visual grand total EEG scorebetween FTD and HC. AD patients show significant EEGslowing and a loss of reactivity compared with FTD and HCby means of the visual grand total EEG. AD patients exhibitdecreased synchronization likelihood compared with bothFTD and HC in fast frequencies, whereas no differences canbe found between FTD and HC (Figure 1). Thus, the changesin synchronization likelihood parallel the pattern of slowing.The characteristics of the higher frequencies—be it power orsynchronization—are reduced in AD, but not in FTD.
Several studies have investigated differences in qEEGamong patients with FTD and those with AD, PDD,and DLB. For qEEG, the global field power was calculatedfor six frequency bands: δ (1.0–3.5Hz), θ (4.0–7.5Hz), α(8.0–11.0Hz), β1 (12.0–15.5Hz), β2 (16.0–19.5Hz), and β3(20.0–23.5Hz). The spectral ratio was calculated as the ratioof the sum of fast frequency bands α+β1+β2+β3 and slowfrequency bands δ+ θ.
The spectral profile of cortical EEG sources has beenanalyzed in patients with probable FTD compared with
2 Disease Markers
AD patients and HC [24]. The authors of this study differen-tiated 16 patients with AD from 19 patients with FTD usingEEG band powers, coherence, dominant frequency, α-peakfrequency, and cortical sources. Using logistic regressionanalysis, the best predictors of FTD and AD were definedin a model. These predictors included δ and θ activitiestogether with high levels of visuospatial ability and episodicmemory. Classification accuracy of the model was 93.3%.Therefore, the combination of qEEG and neuropsychologicaltests significantly contributes to classification accuracy andshould be recommended for differential diagnoses of FTDand AD.
Caso et al. differentiated 39 AD from 39 FTD patients bymeans of power spectral analysis and standardized sLOR-ETA within the δ, θ, α1, α2, β1, β2, and β3 frequency bands,achieving 49% sensitivity and 85% specificity [25]. As such,the sensitivity is at chance level. Both analyses revealed inAD patients higher expression of diffuse δ/θ and lower cen-tral/posterior fast frequency (from α1 to β2) bands comparedto HC. Patients with FTD showed diffuse increased θ powercompared with HC and lower δ compared to AD patients.Compared with FTD, AD patients showed diffuse higher θpower in the power spectrum and, by use of sLORETA,decreased α2 and β1 values in central/temporal regions.Again, we observe the relative increase of relevance of slowerfrequencies and decrease of faster frequencies.
Analyses of global field power, which is a measure ofwhole-brain electric field strength, together with EEG neuro-imaging analyses with sLORETA, were performed in patients
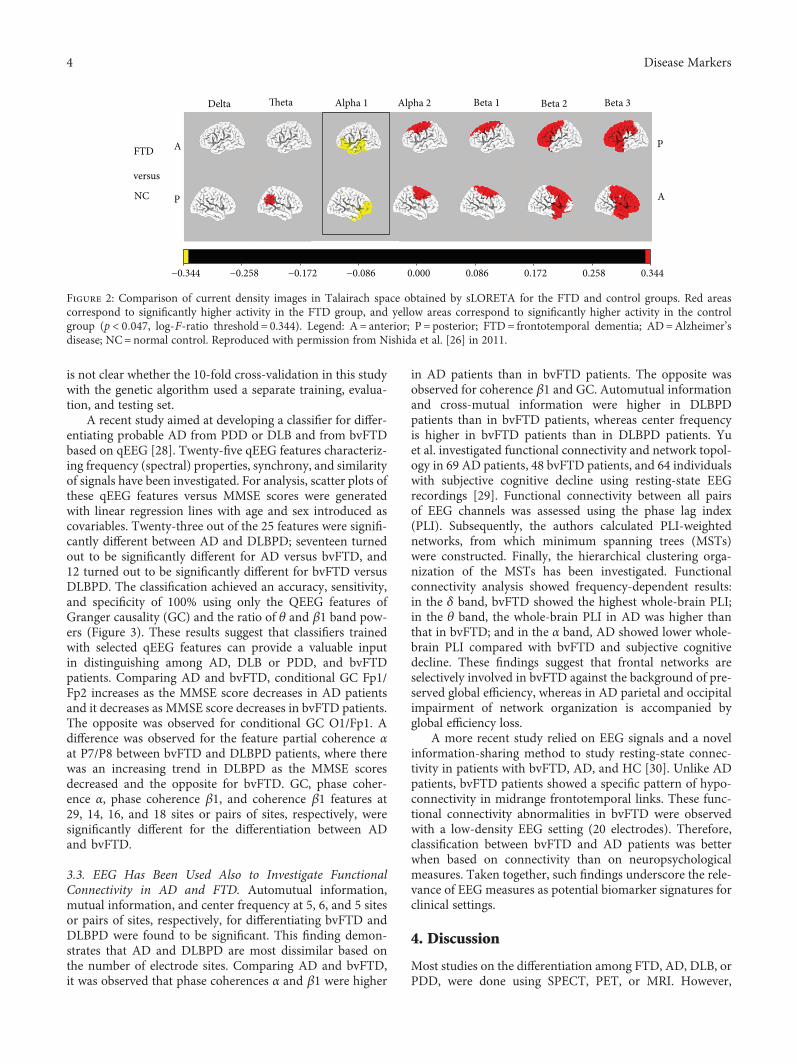
with mild stages of FTD and in HC [26]. In the global fieldpower, significant group effects were observed in the δ(1.5–6.0Hz), α1 (8.5–10.0Hz), and β1 (12.5–18.0Hz) bands.In sLORETA analysis, differences in activity were observed inthe α1 band (HC>FTD) in the orbital frontal and temporallobe, in the δ band (AD>HC) in widespread areas includingthe frontal lobe, and in the β1 band (FTD>AD) in the pari-etal lobe and sensorimotor area (Figure 2). As such, it doesnot seem that a specific brain region is relevant for the dis-tinction of these groups.
Snaedal et al. first investigated the possibility of differen-tiating between 239 patients with AD, 52 patients with PDDor probable DLB (DLBPD), and 14 patients with FDT byqEEG [27]. The authors of this Icelandic study used θ, α2,and β1 coherences together with peak α frequency for classi-fication. Using a support vector machine for classification, agood-to-excellent separation was found when differentiatingcases of degenerative disorders from HC, but this was less sowhen the likelihood of comorbidity was high. The authorsachieved 91% accuracy in differentiating AD from DLBPD,93% for DLBPD-FTD, and 88% for AD-FTD. However, theaccuracy of these statistical estimates must be interpretedwith caution, given the very small sample of FTD patients.In general, studies involving FTD have to struggle with diffi-culties in recruiting participants, so that the importance ofthis study should not be undermined. Nevertheless, classifi-cation analysis requires adequate feature subset selection,especially in studies with long feature vectors such as in thisstudy, where 1120 entries were taken into consideration. It
Frontal CentroparietalLocation
Temporooccipital
FLTDADSMC
−3.20
−2.10
−2.00
−2.90
−2.80
−2.70
−2.60
−2.50
−2.40
−2.30
−2.20Lo
g (m
ean
SL/ (
1-m
ean
SL))
(a)
Frontal CentroparietalLocation
Temporooccipital
FLTDADSMC
−3.60
−3.50
−3.40
−3.30
−3.20
−3.10
−3.00
−2.90
−2.80
Log
(mea
n SL
/ (1-
mea
n SL
))
(b)
Figure 1: Significant group× electrode interaction effects in the 8–10Hz frequency band (a) and the 10–13Hz frequency band (b). Error barsindicate standard deviations. Legend: FTLD= frontotemporal lobar degeneration; AD=Alzheimer’s disease; SMC= subjective memorycomplaints. Reproduced with permission from Pijnenburg et al. [23], in 2008.
3Disease Markers
is not clear whether the 10-fold cross-validation in this studywith the genetic algorithm used a separate training, evalua-tion, and testing set.
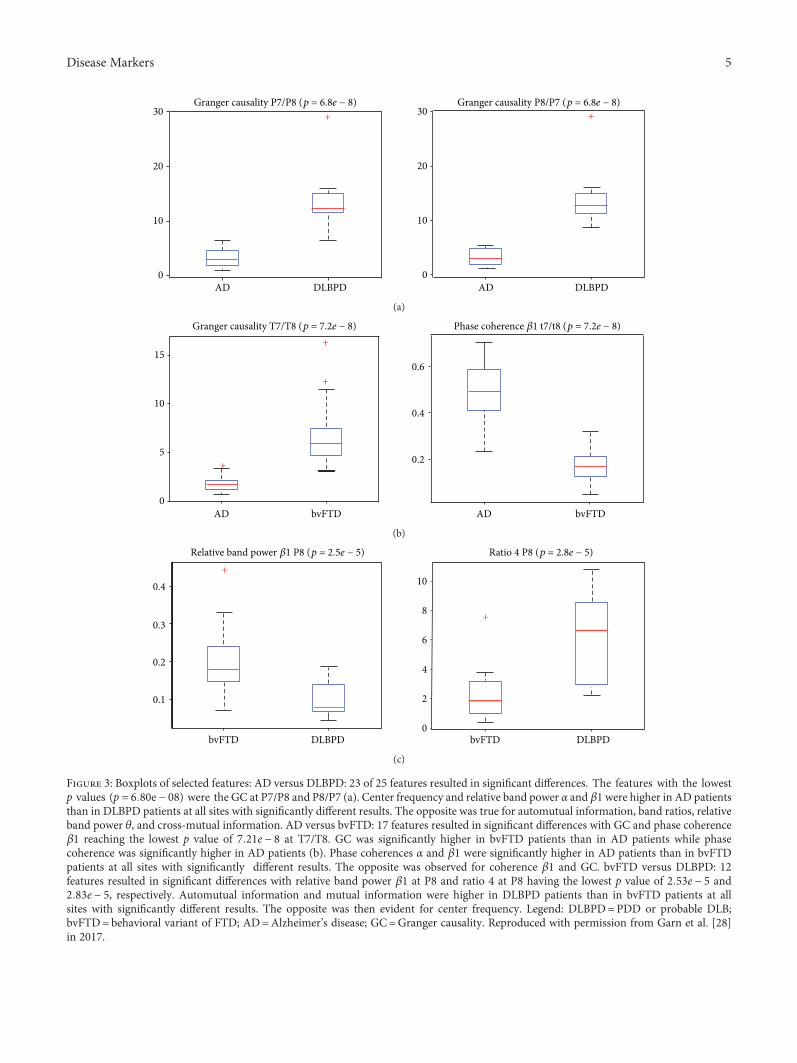
A recent study aimed at developing a classifier for differ-entiating probable AD from PDD or DLB and from bvFTDbased on qEEG [28]. Twenty-five qEEG features characteriz-ing frequency (spectral) properties, synchrony, and similarityof signals have been investigated. For analysis, scatter plots ofthese qEEG features versus MMSE scores were generatedwith linear regression lines with age and sex introduced ascovariables. Twenty-three out of the 25 features were signifi-cantly different between AD and DLBPD; seventeen turnedout to be significantly different for AD versus bvFTD, and12 turned out to be significantly different for bvFTD versusDLBPD. The classification achieved an accuracy, sensitivity,and specificity of 100% using only the QEEG features ofGranger causality (GC) and the ratio of θ and β1 band pow-ers (Figure 3). These results suggest that classifiers trainedwith selected qEEG features can provide a valuable inputin distinguishing among AD, DLB or PDD, and bvFTDpatients. Comparing AD and bvFTD, conditional GC Fp1/Fp2 increases as the MMSE score decreases in AD patientsand it decreases as MMSE score decreases in bvFTD patients.The opposite was observed for conditional GC O1/Fp1. Adifference was observed for the feature partial coherence αat P7/P8 between bvFTD and DLBPD patients, where therewas an increasing trend in DLBPD as the MMSE scoresdecreased and the opposite for bvFTD. GC, phase coher-ence α, phase coherence β1, and coherence β1 features at29, 14, 16, and 18 sites or pairs of sites, respectively, weresignificantly different for the differentiation between ADand bvFTD.
3.3. EEG Has Been Used Also to Investigate FunctionalConnectivity in AD and FTD. Automutual information,mutual information, and center frequency at 5, 6, and 5 sitesor pairs of sites, respectively, for differentiating bvFTD andDLBPD were found to be significant. This finding demon-strates that AD and DLBPD are most dissimilar based onthe number of electrode sites. Comparing AD and bvFTD,it was observed that phase coherences α and β1 were higher
in AD patients than in bvFTD patients. The opposite wasobserved for coherence β1 and GC. Automutual informationand cross-mutual information were higher in DLBPDpatients than in bvFTD patients, whereas center frequencyis higher in bvFTD patients than in DLBPD patients. Yuet al. investigated functional connectivity and network topol-ogy in 69 AD patients, 48 bvFTD patients, and 64 individualswith subjective cognitive decline using resting-state EEGrecordings [29]. Functional connectivity between all pairsof EEG channels was assessed using the phase lag index(PLI). Subsequently, the authors calculated PLI-weightednetworks, from which minimum spanning trees (MSTs)were constructed. Finally, the hierarchical clustering orga-nization of the MSTs has been investigated. Functionalconnectivity analysis showed frequency-dependent results:in the δ band, bvFTD showed the highest whole-brain PLI;in the θ band, the whole-brain PLI in AD was higher thanthat in bvFTD; and in the α band, AD showed lower whole-brain PLI compared with bvFTD and subjective cognitivedecline. These findings suggest that frontal networks areselectively involved in bvFTD against the background of pre-served global efficiency, whereas in AD parietal and occipitalimpairment of network organization is accompanied byglobal efficiency loss.
A more recent study relied on EEG signals and a novelinformation-sharing method to study resting-state connec-tivity in patients with bvFTD, AD, and HC [30]. Unlike ADpatients, bvFTD patients showed a specific pattern of hypo-connectivity in midrange frontotemporal links. These func-tional connectivity abnormalities in bvFTD were observedwith a low-density EEG setting (20 electrodes). Therefore,classification between bvFTD and AD patients was betterwhen based on connectivity than on neuropsychologicalmeasures. Taken together, such findings underscore the rele-vance of EEG measures as potential biomarker signatures forclinical settings.
4. Discussion
Most studies on the differentiation among FTD, AD, DLB, orPDD, were done using SPECT, PET, or MRI. However,
Delta Theta Alpha 1 Alpha 2 Beta 1 Beta 2 Beta 3
P
A
A
P
FTD
versus
NC
−0.344 −0.258 −0.172 −0.086 0.000 0.086 0.172 0.258 0.344
Figure 2: Comparison of current density images in Talairach space obtained by sLORETA for the FTD and control groups. Red areascorrespond to significantly higher activity in the FTD group, and yellow areas correspond to significantly higher activity in the controlgroup (p < 0 047, log-F-ratio threshold = 0.344). Legend: A= anterior; P = posterior; FTD= frontotemporal dementia; AD=Alzheimer’sdisease; NC=normal control. Reproduced with permission from Nishida et al. [26] in 2011.
4 Disease Markers
Granger causality P7/P8 (p = 6.8e − 8) Granger causality P8/P7 (p = 6.8e − 8)30
20
10
0
30
20
10
0AD DLBPD AD DLBPD
+ +
(a)
Granger causality T7/T8 (p = 7.2e − 8)
15
10
5
0
+
+
+
Phase coherence 𝛽1 t7/t8 (p = 7.2e − 8)
0.6
0.4
0.2
AD bvFTD AD bvFTD
(b)
Relative band power 𝛽1 P8 (p = 2.5e − 5)
0.4
0.3
0.1
0.2
+
bvFTD DLBPD
Ratio 4 P8 (p = 2.8e − 5)
10
8
6
4
2
0
+
bvFTD DLBPD
(c)
Figure 3: Boxplots of selected features: AD versus DLBPD: 23 of 25 features resulted in significant differences. The features with the lowestp values (p = 6 80e − 08) were the GC at P7/P8 and P8/P7 (a). Center frequency and relative band power α and β1 were higher in AD patientsthan in DLBPD patients at all sites with significantly different results. The opposite was true for automutual information, band ratios, relativeband power θ, and cross-mutual information. AD versus bvFTD: 17 features resulted in significant differences with GC and phase coherenceβ1 reaching the lowest p value of 7 21e − 8 at T7/T8. GC was significantly higher in bvFTD patients than in AD patients while phasecoherence was significantly higher in AD patients (b). Phase coherences α and β1 were significantly higher in AD patients than in bvFTDpatients at all sites with significantly different results. The opposite was observed for coherence β1 and GC. bvFTD versus DLBPD: 12features resulted in significant differences with relative band power β1 at P8 and ratio 4 at P8 having the lowest p value of 2 53e − 5 and2 83e − 5, respectively. Automutual information and mutual information were higher in DLBPD patients than in bvFTD patients at allsites with significantly different results. The opposite was then evident for center frequency. Legend: DLBPD=PDD or probable DLB;bvFTD=behavioral variant of FTD; AD=Alzheimer’s disease; GC=Granger causality. Reproduced with permission from Garn et al. [28]in 2017.
5Disease Markers
besides their expensiveness, these imaging techniques are notsufficient to provide information on the pathophysiologicalmechanisms of dementia, in particular in the early stages.We summarized in this narrative review the most relevantstudies which aimed to distinguish FTD from AD and otherdementias by using various types of EEG analyses.
It is well known that EEG activity can be influenced bythe severity of dementia [24, 25, 27].
Indeed, the impairment of cortical neuronal networksrelated to cognitive functions is partially reflected by theabnormal mechanisms of cortical neural synchronizationand by dysfunctional neuroplasticity of the neural transmis-sion that generate resting EEG rhythms [31].
Since the likelihood of abnormal EEG findings seems toincrease late in FTD compared to AD [15], Caso et al. aimedto evaluate whether also at an early stage of FTD EEG differ-ences can be found in comparison to mild AD and HC, usinga combined spectral and sLORETA approach. In AD patientscompared to HC, EEG spectral analysis showed a significantoccipital power increase within the δ band but a significantparietooccipital α1 and temporal α2 power decrease andwidespread β1 and β2 power decrease [25]. Notably, thesefindings are consistent with those of many previous quantita-tive EEG studies [20, 21, 32–34]. On the other hand, the spec-tral pattern of EEG recordings in FTD patients did notsignificantly differ from HC except for a widespread increaseof θ power, as previously reported [5, 35–37]. Compared withAD, FTD patients showed in the study of Caso et al. (differ-ently from a previous work of Lindau et al. [24]) a decreaseof δ power and higher α2 and β1 values over the posteriorregions. Moreover, using classical spectral analysis theauthors failed to find highly significant differences betweenFTD and AD in fast activities. sLORETA results were similarto those obtained by classical spectral analysis comparing ADpatients with HC and FTD with HC. This is in agreementwith previous studies using LORETA in AD [38–40]. Nota-bly, θ band values seem to be more critical in differentiatingHC from patients which are in a very early stage of mildAD [38]. Both spectral and sLORETA analysis for α activityin AD patients compared with HC were well preserved overthe frontal areas. This finding may be explained by the so-called “anteriorization” of α rhythm in AD. In normal sub-jects, α generators are localized over the posterior regions ofthe brain while in AD the decrease of posterior α activity pro-duces a shift to more anterior regions [17, 41, 42]. Compar-ing sLORETA results in the AD and FTD groups, adecreased δ power over the posterior regions was detectedin FTD patients, in line with the findings of spectral analysis.Moreover, lower values within the posterior α2 and centro-temporal β1 bands were detected in AD compared withFTD patients. EEG cortical activity depends on a complexbalance between cholinergic pathways and other neurotrans-mitters systems [43]. It is known that α rhythms are mainlymodulated by thalamocortical interactions, which modulatethe transmission of sensorimotor and cognitive informationamong subcortical and cortical pathways [44–46]. Therefore,it can be speculated that the magnitude reduction of fastcortical rhythms in mild AD is related to the impairment ofcholinergic pathways, resulting in an abnormal increase of
cortical excitation or disinhibition in the resting state. InFTD, the intracortical disconnection seems to be related tothe neuronal loss in the frontal/frontotemporal area, along-side with the preserved cholinergic system. These character-istics may explain EEG differences in comparison to HCand AD patients. However, the results of Caso et al. [25]are only partially in agreement with the recent findings ofNishida et al. [26], showing a decrease of α band comparedto HC and an increase of β band in comparison with AD inFTD patients. Moreover, no significant differences werefound between AD and FTD in slow frequency bands or inthe α band [26]. The different sample sizes of patients, andthus, the statistical power, of the two studies may explain thisdiscrepancy. In addition, the different lengths of the analyzedEEG signals for each subject might also contribute to the dif-ferences between the two studies. Indeed, in the study ofNishida et al., only 40 seconds of EEG were analyzed in eachparticipant. This weakly consistent spectral estimation mightnot be a fully representative interval and could provide astatistical correlation between cortical powers, sources ofEEG rhythms, and cognitive functions of patients. As such,α1 power over frontal areas correlated positively with MMSEand Token Test scores, confirmed by both spectral andsLORETA analysis. It may be hypothesized that the intensityof α1 power changes in pathological aging is a function of theglobal cognitive level [47].
Even if the combination of sLORETA and spectral char-acterization seems to improve the sensitivity, the validity ofspectral biomarkers for differentiation of single patients hasnot yet been confirmed. Nevertheless, the reviewed studiesshowed that both classical EEG spectral analysis and EEGsource analysis were able to differentiate AD, FTD, and HCat group level. In fact, spectral analysis and sLORETA pro-vided information that their combination can improve thecharacterization of EEG rhythmic activities in patients withthe AD and FTD group. Further studies with larger samplesizes and considering the combination of spectral and sLOR-ETA analysis with imaging techniques, such as brain MRIand/or PET/SPECT, could be useful in order to improvethe classification of single subjects.
One additional problem in several of the presented EEGstudies should be mentioned. Machine learning techniqueshave emerged over the past two decades and are now anintegral part of clinical neuroscientific research. However,older studies have failed to clearly separate the training fromthe testing data, so that most of the older results include aconsiderable amount of overfitting. Today, the standard isthe separation of the data into three sets: training, evalua-tion, and testing sets. Without this clear separation, thereported results must be interpreted with caution. As arough estimate, a result of 100% accuracy with only two setscould be 80% or less, when overfitting is avoided by clearseparation into three sets.
Slowing of the EEG frequency spectrum, which has longbeen known to be a hallmark in dementia, was confirmedto represent one of the two most significant features for dif-ferential diagnosis. This is well in line with the results of pre-vious studies [48]. Interestingly, qEEG features correlatedwith the severity of disease measured by MMSE scores.
6 Disease Markers
EEG variability in DLBmay be associated with the fluctu-ating cognition seen in these patients. This might have clini-cal implications for the diagnosis of DLB. Despite thatmodern techniques of qEEG analysis can be quite sophisti-cated, spectral EEG analysis is simple enough to be incorpo-rated into clinical software, which would pave the way for theimplementation of qEEG into clinical practice.
It is necessary to conduct further studies with largersample sizes in order to confirm the reviewed findings. It isalso of interest to validate the hypotheses by adding furthercomparisons to HC, although this would not affect the dif-ferentiation among AD, DLBPD, and bvFTD patients withMMSE scores less than 30. However, the comparison toHC would establish a more solid knowledge about the base-line, and thus, allow drafting the course of pathologicalchanges from healthy aging, to early and more severe stagesof the examined diseases.
Notably, genetic factors are often associated with FTD; inparticular, the microtubule-associated protein tau (MAPT),the chromosome 9 open reading frame 72 (c9orf72), andgranulin/progranulin have been identified as common FTDgenes. Future studies should also take into account geneticdifferences in a sample population. Neurophysiological tech-niques are able to detect distinct and peculiar abnormalitiesassociated with different genetic features that are the expres-sion of precise FTD phenotypes. Indeed, in healthy humansubjects EEG measures were able to identify some differencesin genetically different groups [49].
One of the drawbacks of most studies is that they rely onclinical features instead of definite diagnoses. Indeed, themost EEG studies did not have any postmortem confirma-tion. The diagnoses were clinically based on MRI/CT and/or SPECT/PET imaging, in order to avoid the inclusion ofphenocopies in the FTD sample. However, Knopman et al.[50] demonstrated that an accurate FTD antemortem diag-nosis is possible by combining clinical, neuropsychological,and imaging features (MRI scan), giving a sensitivity of85% and a specificity of 99%. Moreover, in McNeill’s report[51] the percentages of correct diagnoses using the associa-tion of SPECT results and clinical data were 92% for FTDand 90.3% for AD patients.
In future studies, the possible impact of combining EEGwith other neurophysiological techniques, such as transcra-nial magnetic stimulation (TMS), should also be carefullyaddressed. TMS-EEG has been demonstrated to be a suitable,reliable, and affordable tool for detecting changes in corticalexcitability, connectivity, and functional synchronization ofEEG activity both in normal aging [52, 53] and in AD [54].The analysis of TMS-evoked oscillations could possibly allowdetecting subtle and area-specific alterations of natural oscil-latory activities [55] with good sensitivity and specificity fordifferent types of dementia.
Some systems do already allow for a quantitative spectralanalysis, but further processing of the signal is highly war-ranted for clinical decision making. Modern qEEG scoringsystems such as, for instance the dementia index SIGLA(http://www.mentiscura.com), give an exact answer to thequestion whether a patient suffers from DLB or whether hewill develop AD. We anticipate that such systems will enter
the clinical arena within the next 10 years and ease the useof qEEG for clinicians tremendously.
In conclusion, application of EEG techniques in neurode-generative diseases has provided important pathophysiologi-cal insights, leading to the development of pathogenic anddiagnostic biomarkers that could be used in the clinical set-ting and therapeutic trials.
Conflicts of Interest
The authors declare no conflict of interest.
References
[1] M. M. Mesulam, “Slowly progressive aphasia without general-ized dementia,” Annals of Neurology, vol. 11, no. 6, pp. 592–598, 1982.
[2] M. L. Gorno-Tempini, A. E. Hillis, S. Weintraub et al., “Clas-sification of primary progressive aphasia and its variants,”Neurology, vol. 76, no. 11, pp. 1006–1014, 2011.
[3] K. Rascovsky, J. R. Hodges, D. Knopman et al., “Sensitivity ofrevised diagnostic criteria for the behavioural variant of fron-totemporal dementia,” Brain, vol. 134, no. 9, pp. 2456–2477,2011.
[4] K. Rascovsky and M. Grossman, “Clinical diagnostic criteriaand classification controversies in frontotemporal lobardegeneration,” International Review of Psychiatry, vol. 25,no. 2, pp. 145–158, 2013.
[5] B. Stigsby, G. Jóhannesson, and D. H. Ingvar, “Regional EEGanalysis and regional cerebral blood flow in Alzheimer’s andPick’s diseases,” Electroencephalography and Clinical Neuro-physiology, vol. 51, no. 5, pp. 537–547, 1981.
[6] L. A. Coben, W. Danziger, and M. Storandt, “A longitudinalEEG study of mild senile dementia of Alzheimer type: changesat 1 year and at 2.5 years,” Electroencephalography and ClinicalNeurophysiology, vol. 61, no. 2, pp. 101–112, 1985.
[7] S. Giaquinto and G. Nolfe, “The EEG in the normal elderly:a contribution to the interpretation of aging and dementia,”Electroencephalography and Clinical Neurophysiology, vol. 63,no. 6, pp. 540–546, 1986.
[8] A. F. Leuchter, I. A. Cook, T. F. Newton et al., “Regional differ-ences in brain electrical activity in dementia: use of spectralpower and spectral ratio measures,” Electroencephalographyand Clinical Neurophysiology, vol. 87, no. 6, pp. 385–393, 1993.
[9] T. Locatelli, M. Cursi, D. Liberati, M. Franceschi, and G. Comi,“EEG coherence in Alzheimer’s disease,” Electroencephalogra-phy and Clinical Neurophysiology, vol. 106, no. 3, pp. 229–237,1998.
[10] U. Schreiter-Gasser, T. Gasser, and P. Ziegler, “QuantitativeEEG analysis in early onset Alzheimer’s disease: a controlledstudy,” Electroencephalography and Clinical Neurophysiology,vol. 86, no. 1, pp. 15–22, 1993.
[11] M. Scherg and P. Berg, “Use of prior knowledge in brain elec-tromagnetic source analysis,” Brain Topography, vol. 4, no. 2,pp. 143–150, 1991.
[12] J. Z. Wang, S. J. Williamson, and L. Kaufman, “Magneticsource images determined by a lead-field analysis: the uniqueminimum-norm least squares estimation,” IEEE Transactionson Biomedical Engineering, vol. 39, no. 7, pp. 665–675, 1992.
7Disease Markers
[13] Z. J. Koles, “Trends in EEG source localization,” Electroenceph-alography and Clinical Neurophysiology, vol. 106, no. 2,pp. 127–137, 1998.
[14] R. D. Pascual-Marqui, M. Esslen, K. Kochi, and D. Lehmann,“Functional imaging with low resolution brain electromag-netic tomography (LORETA): review, new comparisons, andnew validation,” Japanese Journal of Clinical Neurophysiology,vol. 30, pp. 81–94, 2002.
[15] R. D. Pascual-Marqui, “Review of methods for solving the EEGinverse problem,” International Journal of Bioelectromagnet-ism, vol. 1, no. 1, pp. 75–86, 1999.
[16] E. Frei, A. Gamma, R. Pascual-Marqui, D. Lehmann, D. Hell,and F. X. Vollenweider, “Localization of MDMA-inducedbrain activity in healthy volunteers using low resolution brainelectromagnetic tomography (LORETA),” Human BrainMapping, vol. 14, no. 3, pp. 152–165, 2001.
[17] T. Dierks, V. Jelic, R. D. Pascual-Marqui et al., “Spatial patternof cerebral glucose metabolism (PET) correlates with localiza-tion of intracerebral EEG-generators in Alzheimer’s disease,”Clinical Neurophysiology, vol. 111, no. 10, pp. 1817–1824, 2000.
[18] C. Babiloni, G. Binetti, E. Cassetta et al., “Sources of corticalrhythms change as a function of cognitive impairment in path-ological aging: a multicenter study,” Clinical Neurophysiology,vol. 117, no. 2, pp. 252–268, 2006.
[19] L. R. R. Gianotti, G. Künig, D. Lehmann et al., “Correlationbetween disease severity and brain electric LORETA tomogra-phy in Alzheimer’s disease,” Clinical Neurophysiology, vol. 118,no. 1, pp. 186–196, 2007.
[20] C. Huang, L.-O. Wahlund, T. Dierks, P. Julin, B. Winblad,and V. Jelic, “Discrimination of Alzheimer’s disease and mildcognitive impairment by equivalent EEG sources: a cross-sectional and longitudinal study,” Clinical Neurophysiology,vol. 111, no. 11, pp. 1961–1967, 2000.
[21] D. Mattia, F. Babiloni, A. Romigi et al., “Quantitative EEGand dynamic susceptibility contrast MRI in Alzheimer’s dis-ease: a correlative study,” Clinical Neurophysiology, vol. 114,no. 7, pp. 1210–1216, 2003.
[22] P. Julin, L. O. Wahlund, H. Basun, A. Persson, K. Måre, andU. Rudberg, “Clinical diagnosis of frontal lobe dementia andAlzheimer’s disease: relation to cerebral perfusion, brain atro-phy and electroencephalography,” Dementia, vol. 6, no. 3,pp. 142–147, 1995.
[23] Y. A. L. Pijnenburg, R. L. M. Strijers, Y. v. Made, W. M. van derFlier, P. Scheltens, and C. J. Stam, “Investigation of resting-state EEG functional connectivity in frontotemporal lobardegeneration,” Clinical Neurophysiology, vol. 119, no. 8,pp. 1732–1738, 2008.
[24] M. Lindau, V. Jelic, S. E. Johansson, C. Andersen, L. O.Wahlund, and O. Almkvist, “Quantitative EEG abnormalitiesand cognitive dysfunctions in frontotemporal dementia andAlzheimer’s disease,” Dementia and Geriatric Cognitive Disor-ders, vol. 15, no. 2, pp. 106–114, 2003.
[25] F. Caso, M. Cursi, G. Magnani et al., “Quantitative EEG andLORETA: valuable tools in discerning FTD from AD?,” Neu-robiology of Aging, vol. 33, no. 10, pp. 2343–2356, 2012.
[26] K. Nishida, M. Yoshimura, T. Isotani et al., “Differences inquantitative EEG between frontotemporal dementia andAlzheimer’s disease as revealed by LORETA,” Clinical Neuro-physiology, vol. 122, no. 9, pp. 1718–1725, 2011.
[27] J. Snaedal, G. H. Johannesson, T. E. Gudmundsson et al.,“Diagnostic accuracy of statistical pattern recognition of
electroencephalogram registration in evaluation of cognitiveimpairment and dementia,” Dementia and Geriatric CognitiveDisorders, vol. 34, no. 1, pp. 51–60, 2012.
[28] H. Garn, C. Coronel, M. Waser, G. Caravias, andG. Ransmayr, “Differential diagnosis between patients withprobable Alzheimer's disease, Parkinson's disease dementia,or dementia with Lewy bodies and frontotemporal demen-tia, behavioral variant, using quantitative electroencephalo-graphic features,” Journal of Neural Transmission, vol. 124,no. 5, pp. 569–581, 2017.
[29] M. Yu, A. A. Gouw, A. Hillebrand et al., “Different functionalconnectivity and network topology in behavioral variant offrontotemporal dementia and Alzheimer's disease: an EEGstudy,” Neurobiology of Aging, vol. 42, pp. 150–162, 2016.
[30] M. Dottori, L. Sedeño, M. Martorell Caro et al., “Towardsaffordable biomarkers of frontotemporal dementia: a classifi-cation study via network's information sharing,” ScientificReports, vol. 7, no. 1, p. 3822, 2017.
[31] C. Babiloni, R. Lizio, N. Marzano et al., “Brain neural synchro-nization and functional coupling in Alzheimer's disease asrevealed by resting state EEG rhythms,” International Journalof Psychophysiology, vol. 103, pp. 88–102, 2016.
[32] F. Pasquier, F. Lebert, I. Lavenu, and B. Guillaume, “Theclinical picture of frontotemporal dementia: diagnosis andfollow-up,” Dementia and Geriatric Cognitive Disorders,vol. 10, no. 1, pp. 10–14, 1999.
[33] R. J. Buchan, K. Nagata, E. Yokoyama et al., “Regional correla-tions between the EEG and oxygen metabolism in dementia ofAlzheimer’s type,” Electroencephalography and Clinical Neuro-physiology, vol. 103, no. 3, pp. 409–417, 1997.
[34] D. Giannitrapani, J. Collins, and D. Vassiliadis, “The EEGspectra of Alzheimer’s disease,” International Journal of Psy-chophysiology, vol. 10, no. 3, pp. 259–269, 1991.
[35] C. Besthorn, H. Sattel, F. Hentschel, S. Daniel, R. Zerfaβ, andH. Förstl, “Quantitative EEG in frontal lobe dementia,” Journalof Neural Transmission, vol. 47, pp. 169–181, 1996.
[36] U. Passant, I. Rosén, L. Gustafson, and E. Englund, “The het-erogeneity of frontotemporal dementia with regard to initialsymptoms, qEEG and neuropathology,” International Journalof Geriatric Psychiatry, vol. 20, no. 10, pp. 983–988, 2005.
[37] G. G. Yener, A. F. Leuchter, D. Jenden, S. L. Read, J. L.Cummings, and B. L. Miller, “Quantitative EEG in frontotem-poral dementia,” Clinical Electroencephalography, vol. 27,no. 2, pp. 61–68, 1996.
[38] C. Babiloni, G. Binetti, E. Cassetta et al., “Mapping distributedsources of cortical rhythms in mild Alzheimer’s disease. Amulticentric EEG study,” Neuroimage, vol. 22, no. 1, pp. 57–67, 2004.
[39] C. Babiloni, G. B. Frisoni, M. Pievani et al., “White-mattervascular lesions correlate with alpha EEG sources in mild cog-nitive impairment,”Neuropsychologia, vol. 46, no. 6, pp. 1707–1720, 2008.
[40] C. Babiloni, G. B. Frisoni, M. Pievani et al., “Hippocampalvolume and cortical sources of EEG alpha rhythms in mildcognitive impairment and Alzheimer disease,” NeuroImage,vol. 44, no. 1, pp. 123–135, 2009.
[41] J. J. Claus, V. I. H. Kwa, S. Teunisse et al., “Slowing onquantitative spectral EEG is a marker for rate of subsequentcognitive and functional decline in early Alzheimer disease,”Alzheimer Disease & Associated Disorders, vol. 12, no. 3,pp. 167–174, 1998.
8 Disease Markers
[42] R. Ihl, T. Dierks, E.-M. Martin, L. Frölich, and K. Maurer,“Topography of the maximum of the amplitude of EEG fre-quency bands in dementia of the Alzheimer type,” BiologicalPsychiatry, vol. 39, no. 5, pp. 319–325, 1996.
[43] N. R. Selden, D. R. Gitelman, N. Salamon-Murayama, T. B.Parrish TB, and M. M. Mesulam, “Trajectories of cholinergicpathways within the cerebral hemispheres of the humanbrain,” Brain, vol. 121, no. 12, pp. 2249–2257, 1998.
[44] C. H. M. Brunia, “Neural aspects of anticipatory behavior,”Acta Psychologica, vol. 101, no. 2-3, pp. 213–242, 1999.
[45] G. Pfurtscheller and F. H. Lopes da Silva, “Event-relatedEEG/MEG synchronization and desynchronization: basic prin-ciples,” Clinical Neurophysiology, vol. 110, no. 11, pp. 1842–1857, 1999.
[46] M. Steriade and R. R. Llinás, “The functional states of the thal-amus and the associated neuronal interplay,” PhysiologicalReviews, vol. 68, no. 3, pp. 649–742, 1988.
[47] C. Babiloni, G. Binetti, A. Cassarino et al., “Sources of corticalrhythms in adults during physiological aging: a multicentricEEG study,” Human Brain Mapping, vol. 27, no. 2, pp. 162–172, 2006.
[48] J. Jeong, “EEG dynamics in patients with Alzheimer’s disease,”Clinical Neurophysiology, vol. 115, no. 7, pp. 1490–1505, 2004.
[49] L. De Gennaro, C. Marzano, F. Fratello et al., “The electroen-cephalographic fingerprint of sleep is genetically determined:a twin study,” Annals of Neurology, vol. 64, no. 4, pp. 455–460, 2008.
[50] D. S. Knopman, B. F. Boeve, J. E. Parisi et al., “Antemortemdiagnosis of frontotemporal lobar degeneration,” Annals ofNeurology, vol. 57, no. 4, pp. 480–488, 2005.
[51] R. McNeill, G. M. Sare, M. Manoharan et al., “Accuracy ofsingle-photon emission computed tomography in differenti-ating frontotemporal dementia from Alzheimer’s disease,”Journal of Neurology, Neurosurgery & Psychiatry, vol. 78,no. 4, pp. 350–355, 2006.
[52] F. Ferreri, A. Guerra, L. Vollero et al., “Age-related changes ofcortical excitability and connectivity in healthy humans: non-invasive evaluation of sensorimotor network by means ofTMS-EEG,” Neuroscience, vol. 357, pp. 255–263, 2017.
[53] F. Ferreri, F. Vecchio, A. Guerra et al., “Age related differencesin functional synchronization of EEG activity as evaluated bymeans of TMS-EEG coregistrations,” Neuroscience Letters,vol. 647, pp. 141–146, 2017.
[54] F. Ferreri, F. Vecchio, L. Vollero et al., “Sensorimotor cortexexcitability and connectivity in Alzheimer's disease: a TMS-EEG co-registration study,” Human Brain Mapping, vol. 37,no. 6, pp. 2083–2096, 2016.
[55] M. Rosanova, A. Casali, V. Bellina, F. Resta, M. Mariotti, andM. Massimini, “Natural frequencies of human corticothalamiccircuits,” Journal of Neuroscience, vol. 29, no. 24, pp. 7679–7685, 2009.
9Disease Markers

Stem Cells International
Hindawiwww.hindawi.com Volume 2018
Hindawiwww.hindawi.com Volume 2018
MEDIATORSINFLAMMATION
of
EndocrinologyInternational Journal of
Hindawiwww.hindawi.com Volume 2018
Hindawiwww.hindawi.com Volume 2018
Disease Markers
Hindawiwww.hindawi.com Volume 2018
BioMed Research International
OncologyJournal of
Hindawiwww.hindawi.com Volume 2013
Hindawiwww.hindawi.com Volume 2018
Oxidative Medicine and Cellular Longevity
Hindawiwww.hindawi.com Volume 2018
PPAR Research
Hindawi Publishing Corporation http://www.hindawi.com Volume 2013Hindawiwww.hindawi.com
The Scientific World Journal
Volume 2018
Immunology ResearchHindawiwww.hindawi.com Volume 2018
Journal of
ObesityJournal of
Hindawiwww.hindawi.com Volume 2018
Hindawiwww.hindawi.com Volume 2018
Computational and Mathematical Methods in Medicine
Hindawiwww.hindawi.com Volume 2018
Behavioural Neurology
OphthalmologyJournal of
Hindawiwww.hindawi.com Volume 2018
Diabetes ResearchJournal of
Hindawiwww.hindawi.com Volume 2018
Hindawiwww.hindawi.com Volume 2018
Research and TreatmentAIDS
Hindawiwww.hindawi.com Volume 2018
Gastroenterology Research and Practice
Hindawiwww.hindawi.com Volume 2018
Parkinson’s Disease
Evidence-Based Complementary andAlternative Medicine
Volume 2018Hindawiwww.hindawi.com
Submit your manuscripts atwww.hindawi.com