usefulness of activated carbon prepared from industrial...
TRANSCRIPT
ISSN: 0973-4945; CODEN ECJHAO
E-Journal of Chemistry http://www.e-journals.net 2009, 6(2), 361-370
Usefulness of Activated Carbon Prepared from
Industrial Wastes in the Removal of
Nickel from Aqueous Solution
R.RAJALAKSHMI, S.SUBHASHINI and P.LALITHA*
Department of Chemistry, Avinashilingam University for Women, Coimbatore-641043, Tamilnadu, India.
Received 7 August 2008; Accepted 10 October 2008
Abstract: Elimination of heavy metals like nickel from waste water is an important subject in view of public health. In the present study, an attempt has been made to study the applicability of industrial by-products as potential metal adsorbents to remove nickel from aqueous solutions and polluted water. A direct proportionality between the percentage of Ni(II) removal and adsorbent dosage was noted. Maximum removal / recovery of nickel was achieved at pH range of 10-12 for all adsorbents. An optimum temperature of 40 0C for efficient removal of Ni(II) was observed. The effect of nickel adsorption was affected by salinity. The adsorption isotherm data confirmed to Freundlich and Langmuir isotherms. Conformation of data to the Lagergren’s rate equation indicated first order kinetics. The suitability of the industrial by-products in the successful removal of nickel from aqueous solution is quite obvious from the study.
Keywords: Water pollution, Adsorption, Nickel pollution, Activated carbon.
Introduction
Large scale extraction of metals presents hazardous waste management problems worldwide. High concentrations of heavy metals in rivers resulting from metal extraction have adversely affected fisheries in more than 21,000 km of rivers1. The metals often cited for their impact on the environment are nickel, cadmium and selenium2. Elimination of heavy metals like nickel from waste water is an important subject in view of public health. According to some surveys from the public health services of different countries, a significant number of people have been exposed to the hazards of nickel in different ways3.
The widespread concern over the cumulative toxicity and environmental impact of heavy metals like nickel, chromium, cadmium etc., has led to extensive research in
362 P. LALITHA et al.
developing effective, economic, alternative technologies for the removal of these potentially damaging substances from effluents and waste water. Conventional treatment technologies like precipitation and coagulation have become less effective and more expensive. High costs, process complexity and low removal efficiency of membrane processes have limited their use in heavy metal removal4. Several workers have tried nickel adsorption using different adsorbents5-11.
Adsorption on activated carbon is a recognized method for the removal of heavy metals from waste water. The high cost of activated carbon limits its use in adsorption. In the present study, an attempt has been made for the study of industrial by-products as potential metal adsorbents to remove nickel from aqueous solutions and polluted water.
Experimental Adsorbents
i. Lignin prepared from kraft black liquor obtained from a pulp and paper industry. ii. Activated lignin
Collection of kraft black liquor and preparation of lignin from black liquor
Kraft black liquor was collected from a nearby pulp and paper industry where significant proportions of solid and liquid wastes are generated. The use of lignin until recent times from spent liquor was to burn in recovery boilers. This cheaply available resource can be utilized for the uptake of heavy metals.
Characterization of kraft black liquor before and after lignin recovery
Physicochemical analysis of black liquor before and after the recovery of lignin was carried out in the laboratory. The methodology for the various estimations are: iodimetric method for estimation of biological oxygen demand, reflux method for estimation of chemical oxygen demand and filtration method for estimation of total soluble salts and total dissolved solids.
Preparation of lignin
The black liquor was precipitated by titration with 1N sulphuric acid at pH 2 and filtered. The precipitate was washed with 0.01N H2SO4, redissolved in 1N NaOH and filtered to remove solids. The black solution thus obtained was again precipitated by titration with 1N H2SO4 and finally washed with deionised water twice and dried.
Preparation of activated lignin
For every 10 g of lignin obtained from kraft black liquid, 5 mL of conc. sulphuric acid was added, washed several times with distilled water, filtered and dried at a temperature of 120 0C for 5 h and stored in air tight containers.
Reagents
All the reagents used were of analytical grade. To assess the performance of the adsorbents individually and to avoid interference by other elements, synthetic stock solution was prepared by dissolving 447.9 mg of NiSO4.6H2O in one litre of distilled water. The stock solution was diluted to 100 ppm.
Equipments
The BOD and COD were analyzed using a water analyzer and estimation of nickel was made through Digital Systronics colorimeter 112.
Usefulness of Activated Carbon Prepared from Industrial Wastes 363
Batch experiments
To compare and assess the adsorption capacities of the adsorbents batch experiments were carried out. Usually batch experiments are simpler and effective for evaluating the basic parameters affecting the adsorption process. Though industrial operations are not carried out batch wise, suggestions can be given for industrial applications.
Procedure for optimization of adsorption parameters
Effect of adsorbent dosage
From the synthetic stock solution (1000 ppm) of nickel sulphate, 100 ppm solutions were prepared. 100 mL of the solution was equilibrated thoroughly on a horizontal bench shaker at room temperature for 90 min with the adsorbent at pH 6. The weight of the adsorbent was varied from 20 to 200 mg. After adsorption the suspensions were filtered and analysed colorimetrically at 470 nm λ by complexing with dimethyl glyoxime.
Effect of pH
Variation of pH (1 to 12) with constant dosage of adsorbents was studied. The pH of the solution was adjusted using diluted HCl and sodium hydroxide and measured using pH meter with glass electrode. 100 mL sample containing 100 ppm Ni with optimum dosage of adsorbents was shaken for 1 h at different pH conditions.
Effect of time
The effect of time was conducted by varying the contact time. 100 mL of 100 ppm synthetic Ni solution containing the optimum adsorbent dosage were shaken for a time interval of 15, 30, 45, 60, 75, 90 and 105 min.
Effect of temperature
100 mL of samples containing 100 ppm of nickel with an optimum adsorbent dosage was kept in the temperature controlled shaker for 90 min. The temperature was altered from 30-70 0C.
Effect of time at optimum temperature
Nickel solution (100 mL) was shaken with optimum dosage adsorbent at optimum temperature for a time interval of 15, 30, 45 and 60 min. The suspensions were filtered and analysed colorimetrically.
Effect of NaCl (Salinity)
1 g of NaCl was dissolved in 50 mL of distilled water. To determine the effect of salinity on adsorption of Ni(II), 100 mL of 100 ppm nickel solution was mixed with the optimum dosage of the adsorbents and the contact time was fixed as 90 min and the amount of NaCl was varied from 1 to 5 mL. Filtered the solution and analysed for the content of Ni(II).
Application of kinetic studies of adsorption to nickel electroplating pollute waters
The nickel plating waste water was diluted 10 times to get a Ni(II) concentration of 100 mg/litre and utilized to testify the applicability of adsorption kinetic studies. For the evaluation of adsorption potentially of the adsorbents to be utilized for industrial purposes, the same experimental condition of adsorbent dosage and nickel(II) concentration were applied to the plating waste water and a contact time of 3 h at an alkaline pH (8 to 10) was maintained. The solution was then filtered and analysed for Ni(II).

364 P.LALITHA et al.
Physicochemical properties of electroplating effluent
The physicochemical properties of Ni plating water was analysed using the methodology given below. The total solids were analyzed by filtration method, turbidity by using a nephelometer, COD by reflux method, chloride content by titrimetric method, sulphate by titrimetric method, Ni by DMG method, Fe by colorimetric method and Na, Ca by flame photometric method.
Kinetic studies
The following equations were studied to interpret the kinetics of the reaction. i) Langmuir ii) Freundlich iii) Lagergren equation and intraparticle diffusion model for I order kinetics
Results and Discussion
Systematic laboratory batch mode studies were carried out with potential adsorbents obtained from industrial wastes like lignin and activated lignin to evaluate the optimum conditions for the removal and recovery of Ni(II) to examine their potentially for the treatment of water and waste water containing Ni(II).
Characteristics of pulp and paper mill effluent (Black liquor) before and after lignin
precipitation
The characteristics of paper mill effluent collected from a nearby pulp and paper industry before and after the precipitation of lignin are presented in Table 1. The pH of the solution before treatment was recorded to be very high. An enormous decline in the value of pH, BOD, COD, TSS and TDS was observed before and after precipitation. Lignin could be separated only at a very low pH. Chlorides could not be determined at very low pH after treatment with sulphuric acid. Turbidity method could not be applied for the determination of sulphates since the colour of the solution before treatment was very dark.
Table 1. Characterization of black liquor before and after treatment.
Parameters Before treatment After treatment pH 13.87 1.97
BOD 56,400 mg/L 8,100 mg/L COD 86,400 mg/L 11,680 mg/L TSS 8,833 2,308 TDS 1,54,506 69,536
Condition: m ‘mg’ of adsorbent shaken with 100 mL of synthetic effluent containing 100
ppm Ni[II] ; Contact time= 90 min; pH = 7; temperature : 32±1OC Ce - concentration of Ni[II] at equilibrium
Optimization of adsorption parameters
Dependence of efficiency of Ni(II) adsorption on adsorption dosage
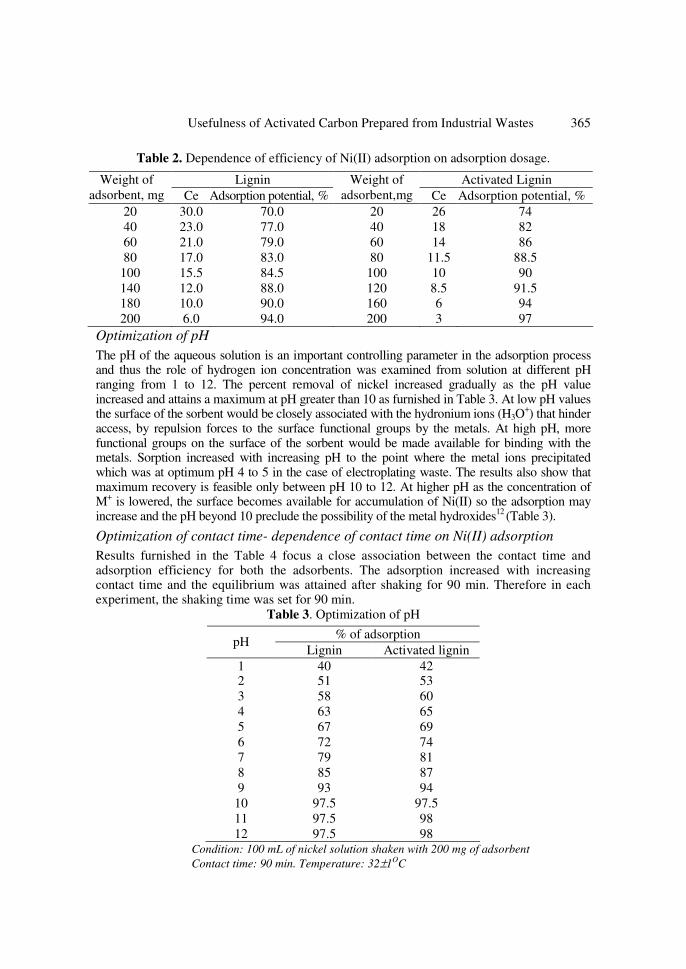
Batch adsorption studies were conducted at room temperature to determine the effect of variation of adsorbent dosage and the potentially of the adsorbents on the removal of Ni(II) at the same sorbate concentration (100 ppm) and contact time of 90 min, varying the dosage of adsorbents. It was noted from the results that nearly 94-97% removal of nickel could be obtained at 200 mg of adsorbent (Table 2). The observations could reveal a direct proportionality between the adsorbent dosage and percent of removal of nickel. The increase in the percentage of adsorption with increase in adsorbent dosage could be attributed to the increase in the surface area of the adsorbent making more sites available for adsorption.
Usefulness of Activated Carbon Prepared from Industrial Wastes 365
Table 2. Dependence of efficiency of Ni(II) adsorption on adsorption dosage.
Optimization of pH
The pH of the aqueous solution is an important controlling parameter in the adsorption process and thus the role of hydrogen ion concentration was examined from solution at different pH ranging from 1 to 12. The percent removal of nickel increased gradually as the pH value increased and attains a maximum at pH greater than 10 as furnished in Table 3. At low pH values the surface of the sorbent would be closely associated with the hydronium ions (H3O
+) that hinder access, by repulsion forces to the surface functional groups by the metals. At high pH, more functional groups on the surface of the sorbent would be made available for binding with the metals. Sorption increased with increasing pH to the point where the metal ions precipitated which was at optimum pH 4 to 5 in the case of electroplating waste. The results also show that maximum recovery is feasible only between pH 10 to 12. At higher pH as the concentration of M+ is lowered, the surface becomes available for accumulation of Ni(II) so the adsorption may increase and the pH beyond 10 preclude the possibility of the metal hydroxides12 (Table 3).
Optimization of contact time- dependence of contact time on Ni(II) adsorption
Results furnished in the Table 4 focus a close association between the contact time and adsorption efficiency for both the adsorbents. The adsorption increased with increasing contact time and the equilibrium was attained after shaking for 90 min. Therefore in each experiment, the shaking time was set for 90 min.
Table 3. Optimization of pH
% of adsorption pH
Lignin Activated lignin 1 40 42 2 51 53 3 58 60 4 63 65 5 67 69 6 72 74 7 79 81 8 85 87 9 93 94
10 97.5 97.5 11 97.5 98 12 97.5 98
Condition: 100 mL of nickel solution shaken with 200 mg of adsorbent Contact time: 90 min. Temperature: 32±1OC
Lignin Activated Lignin Weight of adsorbent, mg Ce Adsorption potential, %
Weight of adsorbent,mg Ce Adsorption potential, %
20 30.0 70.0 20 26 74 40 23.0 77.0 40 18 82 60 21.0 79.0 60 14 86 80 17.0 83.0 80 11.5 88.5
100 15.5 84.5 100 10 90 140 12.0 88.0 120 8.5 91.5 180 10.0 90.0 160 6 94 200 6.0 94.0 200 3 97
366 P.LALITHA et al.
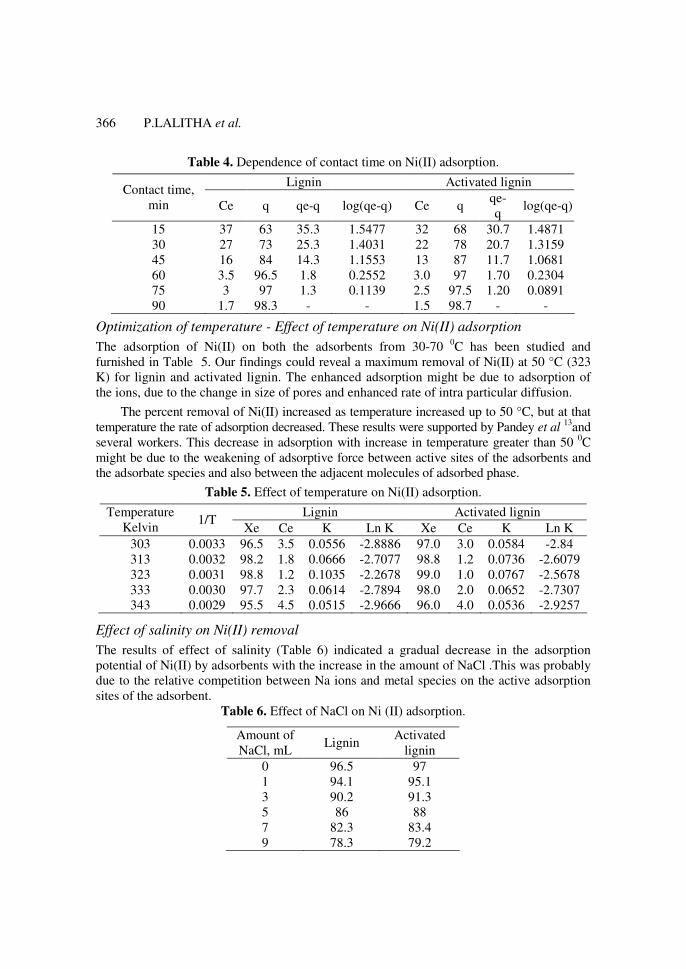
Table 4. Dependence of contact time on Ni(II) adsorption.
Lignin Activated lignin Contact time,
min Ce q qe-q log(qe-q) Ce q qe-q
log(qe-q)
15 37 63 35.3 1.5477 32 68 30.7 1.4871 30 27 73 25.3 1.4031 22 78 20.7 1.3159 45 16 84 14.3 1.1553 13 87 11.7 1.0681 60 3.5 96.5 1.8 0.2552 3.0 97 1.70 0.2304 75 3 97 1.3 0.1139 2.5 97.5 1.20 0.0891 90 1.7 98.3 - - 1.5 98.7 - -
Optimization of temperature - Effect of temperature on Ni(II) adsorption
The adsorption of Ni(II) on both the adsorbents from 30-70 0C has been studied and furnished in Table 5. Our findings could reveal a maximum removal of Ni(II) at 50 °C (323 K) for lignin and activated lignin. The enhanced adsorption might be due to adsorption of the ions, due to the change in size of pores and enhanced rate of intra particular diffusion.
The percent removal of Ni(II) increased as temperature increased up to 50 °C, but at that temperature the rate of adsorption decreased. These results were supported by Pandey et al
13and several workers. This decrease in adsorption with increase in temperature greater than 50 0C might be due to the weakening of adsorptive force between active sites of the adsorbents and the adsorbate species and also between the adjacent molecules of adsorbed phase.
Table 5. Effect of temperature on Ni(II) adsorption.
Lignin Activated lignin Temperature Kelvin
1/T Xe Ce K Ln K Xe Ce K Ln K
303 0.0033 96.5 3.5 0.0556 -2.8886 97.0 3.0 0.0584 -2.84 313 0.0032 98.2 1.8 0.0666 -2.7077 98.8 1.2 0.0736 -2.6079 323 0.0031 98.8 1.2 0.1035 -2.2678 99.0 1.0 0.0767 -2.5678 333 0.0030 97.7 2.3 0.0614 -2.7894 98.0 2.0 0.0652 -2.7307 343 0.0029 95.5 4.5 0.0515 -2.9666 96.0 4.0 0.0536 -2.9257
Effect of salinity on Ni(II) removal
The results of effect of salinity (Table 6) indicated a gradual decrease in the adsorption potential of Ni(II) by adsorbents with the increase in the amount of NaCl .This was probably due to the relative competition between Na ions and metal species on the active adsorption sites of the adsorbent.
Table 6. Effect of NaCl on Ni (II) adsorption.
Amount of NaCl, mL
Lignin Activated
lignin 0 96.5 97 1 94.1 95.1 3 90.2 91.3 5 86 88 7 82.3 83.4 9 78.3 79.2
Usefulness of Activated Carbon Prepared from Industrial Wastes 367
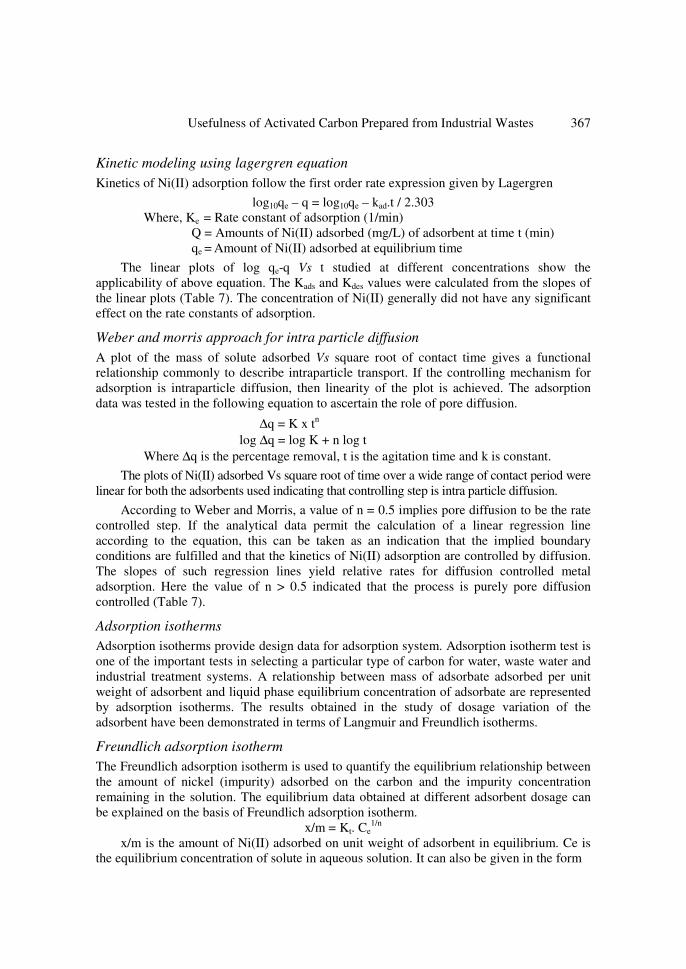
Kinetic modeling using lagergren equation
Kinetics of Ni(II) adsorption follow the first order rate expression given by Lagergren
log10qe – q = log10qe – kad.t / 2.303 Where, Ke = Rate constant of adsorption (1/min) Q = Amounts of Ni(II) adsorbed (mg/L) of adsorbent at time t (min) qe = Amount of Ni(II) adsorbed at equilibrium time
The linear plots of log qe-q Vs t studied at different concentrations show the applicability of above equation. The Kads and Kdes values were calculated from the slopes of the linear plots (Table 7). The concentration of Ni(II) generally did not have any significant effect on the rate constants of adsorption.
Weber and morris approach for intra particle diffusion
A plot of the mass of solute adsorbed Vs square root of contact time gives a functional relationship commonly to describe intraparticle transport. If the controlling mechanism for adsorption is intraparticle diffusion, then linearity of the plot is achieved. The adsorption data was tested in the following equation to ascertain the role of pore diffusion.
∆q = K x tn log ∆q = log K + n log t
Where ∆q is the percentage removal, t is the agitation time and k is constant.
The plots of Ni(II) adsorbed Vs square root of time over a wide range of contact period were linear for both the adsorbents used indicating that controlling step is intra particle diffusion.
According to Weber and Morris, a value of n = 0.5 implies pore diffusion to be the rate controlled step. If the analytical data permit the calculation of a linear regression line according to the equation, this can be taken as an indication that the implied boundary conditions are fulfilled and that the kinetics of Ni(II) adsorption are controlled by diffusion. The slopes of such regression lines yield relative rates for diffusion controlled metal adsorption. Here the value of n > 0.5 indicated that the process is purely pore diffusion controlled (Table 7).
Adsorption isotherms
Adsorption isotherms provide design data for adsorption system. Adsorption isotherm test is one of the important tests in selecting a particular type of carbon for water, waste water and industrial treatment systems. A relationship between mass of adsorbate adsorbed per unit weight of adsorbent and liquid phase equilibrium concentration of adsorbate are represented by adsorption isotherms. The results obtained in the study of dosage variation of the adsorbent have been demonstrated in terms of Langmuir and Freundlich isotherms.
Freundlich adsorption isotherm
The Freundlich adsorption isotherm is used to quantify the equilibrium relationship between the amount of nickel (impurity) adsorbed on the carbon and the impurity concentration remaining in the solution. The equilibrium data obtained at different adsorbent dosage can be explained on the basis of Freundlich adsorption isotherm.
x/m = Kt. Ce1/n
x/m is the amount of Ni(II) adsorbed on unit weight of adsorbent in equilibrium. Ce is the equilibrium concentration of solute in aqueous solution. It can also be given in the form
368 P.LALITHA et al.
log x/m = log K + 1/n log Ce
Freundlich parameters k and 1/n are indicators of adsorption capacity and intensity respectively. Slopes, intercepts and k values are displayed in Table (Table 7). The value of correlation co-efficient that was used as a main criterion for judging the fitness of the adsorption data showed. The straight line obtained in Freundlich model indicated that the average energy of adsorption decreased with increasing adsorption density. Since 1/n is less than 1, it indicated favourable adsorption. Mc Kay et al. (1998) observed that the value of ‘n’ between 1-10 represented efficient adsorption. Our experimental results were in accordance with the investigator for the adsorbent lignin.
Table 7. Interpretation of data in terms of equations.
Langmuir adsorption isotherm
Langmuir adsorption isotherm is based on the assumption that points of valency exist on the surface of the adsorbent and that; each of these sites is capable of adsorbing one molecule. Thus the adsorbed layer will be one molecule thick. Further it is assumed that all the adsorption sites have equal affinities for molecules of the adsorbent and that the presence of adsorbed molecules at one site will not affect the adsorption of molecules at an adjacent site. It is given by,
x K11Ce Ce 1Ce
m =
1+K1Ceqe or
Qob =
Qo
Qo = Langmuir constant (adsorption capacity) b = Langmuir constant (energy of adsorption) x = Amount of Ni(II) adsorbent m = Weight of adsorbent Ce = Concentration of Ni(II) at equilibrium. On rearranging
1 1 1 x/m
= K1
1/K1 +
K11Ce
The plots of 1 / x/m Vs 1/Ce is linear with slope equal to 1/K1 and intercept 1/K1. The slope, intercept and regression co-efficients were calculated from the linear regression for adsorption (Table 7) studies. The validity of the Langmuir adsorption isotherm was verified by
Equation Lignin Activated lignin Lagergren Kinetic Modelling Rate Constants -0.0614 -0.0599 Values of n in Weber and Morris Approach nads -0.7560 -0.7362
Freundlich adsorption isotherm K 0.1151 0.1219 n 1.1973 0.0494 1/n 0.8352 20.2429 r 0.8433 0.9470
Langmuir adsorption isotherm Slope 0.5665 0.5871 Intercept 0.6184 0.3565 b 10.6269 16.4744 RL 9.401 x10⁻⁴ 6.066 x10⁻⁴ r 0.7952 0.9113

Usefulness of Activated Carbon Prepared from Industrial Wastes 369
linear regression co-efficients. The linear plots of m/x Vs 1/Ce shows the applicability coverage of adsorbate on the surface of the adsorbent. The essential character of Langmuir isotherm can be represented in terms of dimensionless parameter, RL called as the separation factor.
1 RL =
1 + bCo
Co = Initial metal ion concentration (mg/l). b = Langmuir Constant (L/mg) This parameter indicates the shape of isotherm
RL - Type of isotherm RL > 1 - Unfavourable RL = 1 - Linear 0 < RL < 1 - Favourable RL = 0 - Irreversible
Recorded data emphasized that the type of isotherm for ads of Ni(II) using potential adsorbent was favourable (0< RL < 1).
Physicochemical characteristics of nickel plating industry
For the purpose of effective discussion about physicochemical characteristics of Ni plating, the experimental data were consolidated, tabulated and analysed. Table 8 portrayed the physicochemical characteristics of the effluent before treatment with the adsorbents. The pH of the effluent was found to be 1.53 which was not within the tolerance limits prescribed by the Bureau of Indian Standards (5.5 – 9.0).
Randall et al14 suggested that heavy metal ions attach themselves to two adjacent
hydroxyl groups thereby releasing two hydrogen ions into the solution. This should, theoretically lower the pH in the effluent solution, an effect which was observed in all column experiments. Phenolic OH groups and / or carboxyl groups might be the active sites responsible for the binding of heavy metals to the straw.
Tabulation revealed a higher value of Electrical Conductivity which was probably attributed to the load off cations and anions discharged in the rinse water. This trend was expressed by several workers. Effluent recorded higher levels of chlorides, and sulphates. In the electroplating industries for the purpose of anodizing operations, 30-75 g of chloride salts and 250 g of sulphate salts were added which may be the cause for higher values of chlorides and sulphates.
Table 8. Physicochemical characteristics of electroplating industry effluents
Parameters Effluent pH 1.53 Conductivity, ms/cm 14.83 Total solids, mg/L 8650 Turbidity 1 COD, mg/L Nil Chlorides, mg/L 414 Sulphate, mg/L 4400 Nickel, mg/L 1000 Fe (II), mg/L 56 Total Fe, mg/L 157 Sodium, mg/L 250 Calcium, mg/L 50
370 P.LALITHA et al.
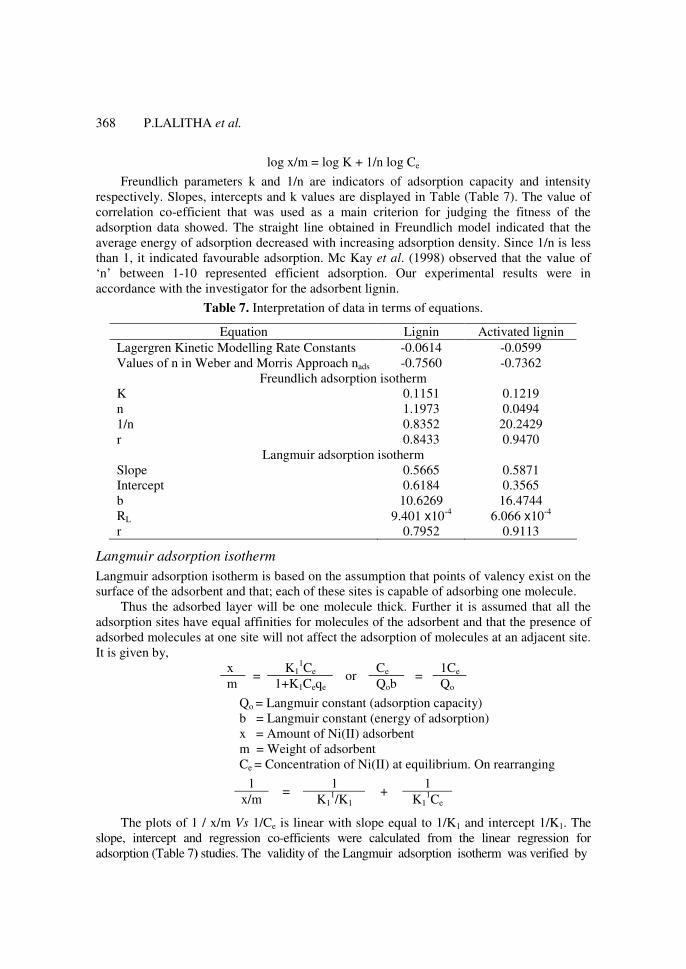
The quantity of sodium was found to be higher (250 mg/L) than the quantity of calcium (50 mg/l) in the electroplating industrial wastes. This might be due to the usage of sodium salts in the excess amounts than the amount of calcium usage. The values of total solids (8650 mg/L) and Ni(II) (1000 mg/L) was found to be greater than the tolerance limits for total solids and Ni(II) in the effluent collected from electroplating industry. In the present investigation, the high nickel content of electroplating industry effluent emphasized an imminent need to remove Ni(II) present in the effluent.
Conclusion
A direct proportionality between the percentage of Ni(II) removal and adsorbent dosage was noted. Maximum removal / recovery of nickel was achieved at pH range of 10-12 for all adsorbents. An optimum temperature of 40 0C for efficient removal of Ni(II) was observed. The effect of nickel adsorption was affected by salinity. The adsorption isotherm data confirmed to Freundlich and Langmuir isotherms. Conformation of data to the Lagergren’s rate equation indicated first order kinetics. The suitability of the industrial by-products in the successful removal of nickel from aqueous solution is quite obvious from the study.
Acknowledgement
The authors thank the concerned authorities of the Avinashilingam University for Women, Coimbatore for providing facilities to carry out this work.
References
1. Moore J N and Luoma S N, Hazardous wastes from large scale metal extraction, Environ Sci Technol., 1990, 24.
2. Peterson P J and Girling C A, Other trace metals. In: Effect of heavy metal pollution on plants. Edited by N.W. Lepp. Applied Science Publishers, London. 1981, Vol. 1. pp. 213-278.
3. WHO, Environmental health criterial, 101, Methyl mercury, 1971, Geneva. 4. Beszedits, Heavy metal removal from waste waters, Engng.Dig, 1983, March,18-25. 5. Aurora Seco, Paula Marzal, Carmen Gabaldón and José Ferrer, J Chem Technol
Biotechnol., 1999, 68(1), 23 - 30. 6. Kadirvelu K, Thamaraiselvi K and Namasivayam C, Separ Purif Tech., 2001, 24,
497-505. 7. Hasar H, J Hazard Mater., 2003, 28, 97(1-3), 49-57. 8. Awasthi. M, Rai L C, Ann Microbiol., 2004, 54, 257-267. 9. Erdoğan S, Önal Y, Akmil-Başar C, Bilmez-Erdemoğlu S, Sarıcı-Özdemir C,
Köseoğlu E and İçduygu G, Appl Surface Science, 2005, 15, 1324-1331. 10. Nityanandi D, Subbhuraam C V and Kadirvelu K, Environ Technol., 2006, 27(1),15-24. 11. Madhavakrishnan S, Manickavasagam K, Rasappan K, .Syed Shabudeen P S,
Venkatesh R, and S. Pattabhi, E J Chem., 2008, 5(4), 761-769. 12. Rao A L, Neelam Verma and Amarjeet Kaur, Indian J Environ Health, 1990,
32(3),280-283. 13. Pandey K K, Prasad G and Singh V N, Wallastonite Tech Bio-Tech.,1986, 34, 367-374. 14. Randall J M, Reuter J M, Waiss A C, J Appl Polyn Sci., 1974, 22:379-389.
Submit your manuscripts athttp://www.hindawi.com
Hindawi Publishing Corporationhttp://www.hindawi.com Volume 2014
Inorganic ChemistryInternational Journal of
Hindawi Publishing Corporation http://www.hindawi.com Volume 2014
International Journal ofPhotoenergy
Hindawi Publishing Corporationhttp://www.hindawi.com Volume 2014
Carbohydrate Chemistry
International Journal of
Hindawi Publishing Corporationhttp://www.hindawi.com Volume 2014
Journal of
Chemistry
Hindawi Publishing Corporationhttp://www.hindawi.com Volume 2014
Advances in
Physical Chemistry
Hindawi Publishing Corporationhttp://www.hindawi.com
Analytical Methods in Chemistry
Journal of
Volume 2014
Bioinorganic Chemistry and ApplicationsHindawi Publishing Corporationhttp://www.hindawi.com Volume 2014
SpectroscopyInternational Journal of
Hindawi Publishing Corporationhttp://www.hindawi.com Volume 2014
The Scientific World JournalHindawi Publishing Corporation http://www.hindawi.com Volume 2014
Medicinal ChemistryInternational Journal of
Hindawi Publishing Corporationhttp://www.hindawi.com Volume 2014
Chromatography Research International
Hindawi Publishing Corporationhttp://www.hindawi.com Volume 2014
Applied ChemistryJournal of
Hindawi Publishing Corporationhttp://www.hindawi.com Volume 2014
Hindawi Publishing Corporationhttp://www.hindawi.com Volume 2014
Theoretical ChemistryJournal of
Hindawi Publishing Corporationhttp://www.hindawi.com Volume 2014
Journal of
Spectroscopy
Analytical ChemistryInternational Journal of
Hindawi Publishing Corporationhttp://www.hindawi.com Volume 2014
Journal of
Hindawi Publishing Corporationhttp://www.hindawi.com Volume 2014
Quantum Chemistry
Hindawi Publishing Corporationhttp://www.hindawi.com Volume 2014
Organic Chemistry International
Hindawi Publishing Corporationhttp://www.hindawi.com Volume 2014
CatalystsJournal of
ElectrochemistryInternational Journal of
Hindawi Publishing Corporation http://www.hindawi.com Volume 2014