use of vegetable oils as processing aid in dry spice...
TRANSCRIPT

Use of Vegetable Oils as Processing Aid in
Dry Spice Mixtures
Effect on Rancidity, Separation, Dusting and Caking
Master of Science Thesis in the Master Degree Program Biotechnology
SOFIA ANDERSSON
Department of Chemical and Biological Engineering
Division of Food Science
CHALMERS UNIVERSITY OF TECHNOLOGY
Gothenburg, Sweden, 2012


i
Use of Vegetable Oils as Processing Aid in
Dry Spice Mixtures
Effect on Rancidity, Separation, Dusting and Caking
Master of Science Thesis in the Master Degree Program Biotechnology
SOFIA ANDERSSON
Department of Chemical and Biological Engineering
Division of Food Science
CHALMERS UNIVERSITY OF TECHNOLOGY
Gothenburg, Sweden, 2012

ii
Use of Vegetable Oils as Processing Aid in
Dry Spice Mixtures
Effect on Rancidity, Separation, Dusting and Caking
Master of Science Thesis in the Master Degree Program Biotechnology
SOFIA ANDERSSON
© Sofia Andersson, 2012
Department of Chemical and Biological Engineering
Division of Food Science
CHALMERS UNIVERSITY OF TECHNOLOGY
SE-412 96 Gothenburg
Sweden
Telephone +46 (0)31-772 1000
Department of Chemical and Biological Engineering
Gothenburg, Sweden, 2012

iii
Use of Vegetable Oils as Processing Aid in Dry Spice Mixtures
Effect on Rancidity, Separation, Dusting and Caking
SOFIA ANDERSSON
Department of Chemical and Biological Engineering
Division of Food Science
Chalmers University of Technology
Abstract
Santa Maria AB is the leading seasoning company on the Nordic market. Spice mixtures are
the basis for several products among the five flavouring product concepts; Tex Mex, Thai,
India, Barbeque and Spices. During the manufacturing process of spice mixtures, palm oil is
used as processing aid in order to reduce dusting and caking, and to make the seasoning more
homogenous by preventing separation of particles of different sizes. Due to health concerns
and environmental aspects, Santa Maria AB aims to reduce the use of palm oil. The purpose
of this Master’s Thesis is to substitute the palm oil used as processing aid in the
manufacturing of spice mixtures produced at Santa Maria AB, Mölndal, for a vegetable oil
that promote health and that is produced under environmental-friendly and sustainable
conditions.
The stability of ten different vegetable oils was investigated using accelerated shelf life tests
evaluated by sensory analysis. All oils were stable enough not to deteriorate during storage for
twelve weeks at room temperature and 31°C. The intensity of rancidity perceived during
storage at 40°C and 60°C was plotted versus time, in order to retain an Arrhenius plot to
determine the temperature dependence for each oil.
The results showed that the oil included in the spice mixtures does not have to be as stable as
an oil intended for high temperatures, for example for frying. This is mainly due to that the
seasonings are stored in a dry place, not above room temperature, and that it is unlikely that
the spice mixtures will become rancid during the expected storage time. Rapeseed oil and
sunflower oil were selected for further analysis to investigate their effect on separation,
dusting and caking of spice mixtures, compared to palm oil and samples without addition of
oil. These parameters were evaluated by visual analysis and measurements of angle of repose.
The results showed that addition of oil as processing aid is important to maintain spice
mixtures of high quality. However, the type of oil did not affect the results.
The recommendation to Santa Maria AB is to replace the palm oil used as processing aid in
dry spice mixtures for Swedish cultivated rapeseed oil. This would result in several
advantages, such as reduction of the environmental impact, healthier products and reduced
costs.
Keywords
Accelerated shelf life testing, Angle of repose, Caking, Dusting, Oxidation, Processing aid,
Rancidity, Sensory evaluation, Separation, Spice mixture, Vegetable oil

iv
Acknowledgements
This report is a Master’s Thesis project for the degree of Master of Science in Biotechnology
at Chalmers University of Technology in Gothenburg. The project was conducted at Santa
Maria AB in Mölndal.
I would like to express my gratitude to my supervisors Gunilla Kjellmer and Anette
Zetterquist at Santa Maria AB for all help, support and guidance throughout the project. I
would like to thank Ulf Svanberg for being my examiner and answering questions.
I would like to thank all employees at the R&D department and at the Spice Plant of Santa
Maria AB for being helpful, kind and forthcoming. A special thanks to Torbjörn Lilliebjelke,
Annika Robertson and Anette Zetterquist for enduring the oil testing, and to Jonn Forsell for
help of planning the test runs.
I am grateful to Annette Almgren and Nils-Gunnar Carlsson at Chalmers for conducting the
analysis of metal ion content of spice mixtures, and to Karin Bringsarve at AarhusKarlshamn
AB for answering questions and providing oil samples and analyses.
Last but not least I would like to thank my family and friends for supporting and encouraging
me during the project.
v
Table of Contents
Abstract ......................................................................................................................................... iii
Acknowledgements ........................................................................................................................ iv
1 Introduction ................................................................................................................................. 1
1.1 Purpose and Objective ............................................................................................................ 2
1.2 Limitations .............................................................................................................................. 2
2 Theoretical Background ............................................................................................................. 3
2.1 Spices and Spice Mixtures ...................................................................................................... 3
2.1.1 Manufacturing Process of Spice Mixtures ....................................................................... 3
2.1.2 Food Powders ................................................................................................................... 4
2.1.3 Separation and Dusting .................................................................................................... 4
2.1.4 Caking Phenomena and Flowability ................................................................................ 4
2.1.5 Methods to Evaluate Caking ............................................................................................ 5
2.1.6 Ingredients ........................................................................................................................ 6
2.2 Shelf Life of Foods ................................................................................................................. 8
2.2.1 Packaging ......................................................................................................................... 8
2.2.2 Accelerated Shelf Life Testing ........................................................................................ 9
2.2.3 Arrhenius Model ............................................................................................................ 10
2.3 Vegetable Oils ...................................................................................................................... 11
2.3.1 Coconut Oil .................................................................................................................... 12
2.3.2 Palm Oil ......................................................................................................................... 13
2.3.3 Rapeseed Oil .................................................................................................................. 13
2.3.4 Shea Fat .......................................................................................................................... 13
2.3.5 Sunflower Oil ................................................................................................................. 14
2.3.6 Lipids and Health ........................................................................................................... 14
2.3.7 Production and Processing ............................................................................................. 15
2.3.8 Environmental Aspects .................................................................................................. 16
2.4 Lipid Oxidation ..................................................................................................................... 16
2.4.1 Mechanism of Lipid Oxidation ...................................................................................... 17
2.4.2 Pro-oxidants ................................................................................................................... 18
2.4.3 Antioxidants ................................................................................................................... 19
2.4.4 Formation of Lipid Oxidation Decomposition Products ............................................... 20
2.4.5 Sensory Evaluation of Lipid Oxidation Products .......................................................... 20
2.4.6 Analytical Measurements of Lipid Oxidation Products ................................................. 22
3 Methods ...................................................................................................................................... 24
3.1 Vegetable Oils ...................................................................................................................... 24
3.1.1 Accelerated Shelf Life Test ........................................................................................... 25
3.1.2 Sensory Analysis ............................................................................................................ 25
3.1.3 Measurement of Peroxide Value and para-Anisidine Value ......................................... 27
3.2 Spice Mixtures ...................................................................................................................... 28
3.2.1 Selected Spice Mixtures ................................................................................................. 28
3.2.2 Preparation of Spice Mixtures ....................................................................................... 29
vi
3.2.3 Accelerated Shelf Life Test ........................................................................................... 30
3.2.4 Analysis of Angle of Repose ......................................................................................... 30
3.2.5 Further Evaluation Methods .......................................................................................... 32
3.3.6 Metal Ion Content .......................................................................................................... 33
3.3.7 Test Run in Spice Plant .................................................................................................. 34
4 Results and Discussion .............................................................................................................. 35
4.1 Vegetable Oils ...................................................................................................................... 35
4.1.1 Accelerated Shelf Life Test and Sensory Analysis ........................................................ 36
4.1.2 Comparative Discussion ................................................................................................ 48
4.2.3 Measurement of Peroxide Value and para-Anisidine Value ......................................... 51
4.2.4 Selection of Oils for Further Evaluation ........................................................................ 51
4.3 Spice Mixtures ...................................................................................................................... 52
4.3.1 Analysis of Angle of Repose ......................................................................................... 53
4.3.2 Further Evaluation Methods .......................................................................................... 57
4.3.3 Metal Ion Content .......................................................................................................... 59
4.3.4 Test Run in Factory ........................................................................................................ 59
5 Conclusions and Future Work ................................................................................................. 60
References ..................................................................................................................................... 63

1
1 Introduction
Santa Maria AB started as a small spice shop in Gothenburg in the beginning of the twentieth
century and is today the leading flavouring company in the Nordic region. The company, with
more than 1400 employees, is a part of the Finnish food corporation Paulig Group. Santa
Maria AB has developed several flavouring product concepts, such as Tex Mex, Thai, India,
Barbeque and Spices, which are sold in more than 30 European countries. The spice selection
consists of almost 100 different spices which make the basis for all seasoning products of the
remaining food concepts. The production of spices and spice mixtures is located in Mölndal,
Sweden and Saue, Estonia, while the Mexican range of products are manufactured in
additional production sites in Sweden, England and Belgium (Santa Maria AB, 2012).
When producing spice mixtures, addition of oil is necessary as processing aid. The oil has a
significant impact on the properties of spice mixtures, especially to reduce dusting and caking
and to prevent separation of particles of different sizes (Kjellmer, 2012). Today fractionated
palm oil, palm olein, is used as this processing aid, as it has the appropriate properties and is a
stable oil (Bringsarve, 2012). When discussing the palm oil used in the spice mixtures, it is
the palm olein fraction that is referred to.
Compared with other oil crops, the oil palm gives a very high yield per hectare. This has led
to a rapidly expanding world industry of oil production in the tropical areas of Asia, Africa
and America, especially Malaysia and Indonesia (Corley & Tinker, 2003; WWF UK, 2011).
As the request for palm oil increases, new plantations develop to meet the demand. This
causes conversion of large areas of tropical forests with high biological diversity, leading to
threat of extinction for several species. The last twenty years, the area for oil palm cultivation
has increased almost eightfold, and the demand is expected to double again by 2020 (WWF,
2010). To promote the growth and use of sustainable palm oil, the organisation Roundtable of
Sustainable Palm Oil (RSPO) was formed in 2004 by the initiative of World Wide Fund for
Nature (WWF). RSPO has developed and supports global environmental, social and
economic viable principles and criteria in the oil palm industry, in order to supply the world
with enough sustainable palm oil without harming the planet and its people (RSPO, 2009;
WWF, 2010). Santa Maria AB is one of the supporting members of RSPO (RSPO, 2009;
Santa Maria AB, 2012).
Santa Maria AB aims to reduce the use of palm oil partly due to environmental aspects, but
also of health concerns, since palm oil consists mainly of saturated fatty acids. The company
is working to replace the palm oil in the Mexican food selection, in products containing high
amounts of oil. Therefore it is natural to take the step to replace the palm oil also in the
manufacturing process of spice mixtures.

2
1.1 Purpose and Objective
The purpose of this Master’s Thesis is to replace the palm oil used as processing aid in the
manufacturing of spice mixtures produced at Santa Maria AB, Mölndal, for a vegetable oil
that promote health and that is produced under environmental-friendly and sustainable
conditions.
It is important that the oil fulfills several demands to be suitable as a processing aid, including
stability during the shelf life, and inhibition of separation, dusting and caking of spice
mixtures during manufacturing. Appropriate methods to control these parameters are to be
elaborated, as well as evaluation of practical experiments. This is done by investigation of a
number of possible alternative vegetable oils, and how these different oils affect dusting,
separation, agglomeration and caking in four chosen spice mixtures. The stability and
rancidity of the vegetable oils will be examined using accelerated shelf life testing, and
evaluated by sensory analysis. In order to evaluate caking and dusting of spice mixtures a
method of measuring the angle of repose of seasonings will be conducted.
Another important aspect to consider when choosing new oil as processing aid is to avoid
increasing costs.
1.2 Limitations
This Master’s Thesis will focus on the parameters taste, appearance, rancidity, dusting,
separation and caking of spice mixtures when possible alternative vegetable oils as a
replacement for palm oil are to be investigated. Other parameters will not be studied.
A limited number of oils will be tested, whereas all will be of vegetable origin. By practical
reasons, the tests will be performed using only four of the spice mixtures containing palm oil
today. Due to limited time, accelerated tests will be performed and not real time trials.
The stability and rancidity of the chosen vegetable oils will be evaluated by sensory analysis
performed by a panel at Santa Maria AB. This evaluation will be performed as a screening
test and not a complete sensory profiling. Some samples are to be analysed also by the
analytical measurements peroxide value and para-anisidine value. Other evaluation methods,
such as investigation of which flavour compounds that are formed during the deterioration,
will not be performed. The properties of dusting, caking and separation will be studied using
only the method angle of repose, and visual analysis.
3
2 Theoretical Background
The following parts will cover the theoretical background of the project, divided in the areas
Spices and Spice Mixtures, Shelf Life of Foods, Vegetable Oils and Lipid Oxidation.
2.1 Spices and Spice Mixtures
Spices are used to stimulate the appetite and to add flavour, colour and texture to food. The
word spice originates from the Latin word species, meaning specific kind. This refers to that
all parts of a plant, including the seed, berry, leaf, stem or root, may be used to add aroma,
fragrance or pungency (Raghavan, 2000).
Spices are not only used as flavourings and colourings, but have for long been known for their
preservative and health properties as antimicrobials and antioxidants (Kalemba & Wajs, 2011;
Takemasa & Hirasa, 1998). Even though spices constitute a very small part of a meal, they
may make an important contribution to our daily antioxidant intake. The antioxidant capacity
of spices is thought to be the result of the presence of phenolic compounds (Lu et al., 2011).
Currently, rosemary and sage are used as natural antioxidant additives in foods (Reische et al.,
2008).
Spices are used in several different forms; fresh or dried, whole, crushed, ground or powdered
(Kalemba & Wajs, 2011; Raghavan, 2000). Using dried spices entails advantages such as easy
handling, longer shelf life and higher taste intensity compared to fresh ones. However, the
aroma of dried spices is less than for fresh, and the flavours can be oxidised resulting in losses
during milling and storage (Raghavan, 2000).
Spices provide a wide range of different tastes to foods, and by combining different spices
and other flavourings in a spice mixture or seasoning, a vast spectrum of flavours can be
created (Raghavan, 2000; Takemasa & Hirasa, 1998). The usage of ready-to-use spice blends
are becoming more and more popular since these kinds of products are easy to use, saves time
in the kitchen and gives the possibility of experiencing new flavours from different parts of
the world (Kalemba & Wajs, 2011).
Spice mixtures are an important part of the wide variety of products of Santa Maria AB and
are available in all five flavouring product concepts; Tex Mex, Thai, India, Barbeque and
Spices. Santa Maria AB works a lot with improving existing products and the company focus
strongly on new concepts and trends when developing new products. A core in the
developmental process is to create high quality products with irresistible taste sensations,
making the control of the manufacturing process of spice mixtures important.
2.1.1 Manufacturing Process of Spice Mixtures
The raw materials for the spice mixtures produced at Santa Maria AB are grown all over the
world. The spices are washed, dried, peeled, crushed or grinded in different fractions in order
to suit as components in different products. This is made either at the spice factory of Santa
Maria AB or by the suppliers. All raw materials are controlled for quality testing of flavour
and appearance and absence of microorganisms before blending and packaging. As a safety
precaution and to protect the spices from microorganisms, most ingredients are heat treated by
hot steam (Snickert, 2012). The seasonings are mixed in a large blender and the ingredients
are added one by one. When all dry ingredients are added, the mixture is released to the
4
blender where liquid ingredients, such as oleoresin and the processing aid palm oil are added.
The spice mixture is blended for ten minutes before it is filled in large sacks, in order to be
packed in the appropriate consumer packaging. The palm oil used in the spice mixtures has a
melting point of 24°C and therefore it has to be heated prior addition. This is made by storing
the container with oil on a heat plate (Blomstrand, 2012).
2.1.2 Food Powders
Spices and salt are examples of food powders, which are defined as dried and comminuted
ingredients of biological origin consumed by humans and animals (Cuq et al., 2011;
Fitzpatrick & Ahrné, 2005). Production of food in powdered form prolongs the shelf life of
the product by reducing the water content and thereby reducing the degradation and
deterioration of the product. The advantage of using food in powdered form is consequently to
maintain the stability of the product during time, from production until it is to be utilised
(Fitzpatrick & Ahrné, 2005). The low water activity ensures physiochemical and
microbiological stability, preserving the safety and functionality of the food powder until use.
Water elimination also reduces the total mass of the product, reducing the costs for transport
(Cuq et al., 2011).
Food powders have many industrial applications but are also marketed directly to the
consumers, making food powders present in everyday life and appreciated for being easy to
store and use. Typically, food powders are not consumed in the powdered form but in a wet
formulation, mixed with water and other added ingredients to the actual product being
consumed (Cuq et al., 2011; Fitzpatrick & Ahrné, 2005).
2.1.3 Separation and Dusting
Mixtures of different food powders containing several ingredients of different particle
properties and sizes can be segregated or separated after the mixing process. This problem can
be limiting for the creation of food powder mixtures. Handling of food powders may cause
dust generation, which can lead to health problems and allergy, or contamination due to dust
settling and sticking onto equipment. Therefore prevention and control of dusting is important
when handling food powders (Fitzpatrick & Ahrné, 2005).
The cohesiveness, and thereby also the dustiness of a powder, is determined by the particle
size, particle shape, electrostatic charge and surface properties of the powder. A powder may
release dust particles in many repeated pourings and not necessarily in a single handling
(Wells & Alexander, 1978).
2.1.4 Caking Phenomena and Flowability
The agricultural origin of food powders results in a natural variability of the technological
behaviour of food powders, due to variations in species and varieties, seasonal effects and
differences in growth conditions and location. Food powders consist of chemically complex
molecules containing mainly carbon, hydrogen, oxygen and nitrogen atoms. These molecules
have the capacity to form different interactions, such as hydrogen bonds, hydrophobic
interactions, ionic interactions and disulphide bonds. These different interactions contribute to
the technological behaviour of a food powder such as hydration properties and the contact
mechanism between particles, such as adhesion, agglomeration, caking and flowability (Cuq
et al., 2011).
5
Caking is a continuous and complex, time-dependent phenomenon where a low-moisture,
free-flowing powder adheres to form clumps and eventually large agglomerates. It is a
deleterious problem in the food industry and results in loss of functionality and lowered
quality of the food powder. Caking contains several stages, and in the beginning of the
process inter-particle bridges start to form as a result of surface deformation. These
interactions may disintegrate under mild shaking, conversely to the particle clumps formed
during the later stages of agglomeration, having structural integrity. During the caking
process, clumps of different sizes and varying degree of hardness may be present. Caking
depend both on internal factors, such as particle size, charge and hygroscopic behaviour, as
well as external factors such as relative humidity, temperature, applied mechanical stress and
the presence of moisture barriers (Aguilera et al., 1995).
Powders consisting of large particles have better flowability compared to powders with small
particles. The cohesiveness increases as the particle size decreases, making small particle
powders possible to cause handling problems (Janjatović et al., 2011). The cohesiveness of a
powder also increases with increased water content, and high moisture content affects its
flowability and caking properties negatively (Aguilera et al., 1995; Janjatović et al., 2011).
A dry powder can absorb water from the moist air in the headspace, or through the package
material or seal, when it is packed. The extent of absorption depends on the powder
components’ capability to establish interactions with water (Aguilera et al., 1995; Cuq et al.,
2011). Ingredients with hydrophilic properties cause the hygroscopic character of food
powders, which can lead to caking problems during storage. Some examples of these kinds of
components are sugars, polysaccharides, protein hydrolysates, salts, powdered vegetables and
yeast and meat extracts (Aguilera et al., 1995; Cuq et al., 2011; Hartmann & Palzer, 2011).
To minimise the caking of food powders it is important to have a strict control of moisture
content and to store the products at low temperatures. In order to improve the flowability and
inhibit caking, anti-caking agents can be added to hygroscopic food powders. The anti-caking
mechanism is achieved by several different actions, for example by competing with the host
powder for available moisture, by acting as a physical surface barrier between particles, or by
forming a moisture-protective barrier on the surface of otherwise hygroscopic particles. Many
spice mixtures produced at Santa Maria AB contain the anti-caking agent silicon dioxide that
acts as a physical surface barrier between particles by interfering with the liquid bridging
mechanism (Aguilera et al., 1995).
2.1.5 Methods to Evaluate Caking
Some methods used to characterise caking phenomena are flowability, cohesion, caking index
and angle of repose (Aguilera et al., 1995). The angle of repose is a well-known powder
property and one of the most important parameters to characterise the behaviour of granular
materials (Geldart et al., 2006; Zhou et al., 2002).
There are several methods of measuring the angle of repose and due to the different values
maintained from each method, published values of the angle of repose are seldom comparable.
The two most common techniques are based on pouring the powder into a funnel, either held at
a fixed height above a flat base, or raised gradually to allow the sample to flow out, as visualised
in figure 2.1. Commonly, angles of repose below 30° indicate good flowability, 30°- 45° some
cohesiveness, 45°- 55° true cohesiveness, and above 55° very high cohesiveness and very
limited flowability. A more general classification is based on an angle of repose of 40°, where
values below 40° indicate a free-flowing powder and above 40° a cohesive powder (Geldart et

6
al., 2006). The angle of repose decreases with increased particle size and increases with
increasing friction coefficients, as well as if the particles deviate from the shape of a sphere
(Zhou et al., 2002).
2.1.6 Ingredients
The spice mixtures produced at Santa Maria AB contain a wide range of different ingredients,
such as salt, sugars, spices, herbs, aromas, extracts, bouillons and other functional
components. They all behave differently regarding stability and shelf life. The most
commonly occurring ingredients in the four spice mixtures used in this thesis are described
below. Several of these ingredients have hygroscopic properties which may cause
agglomeration and caking.
Salt
Salt, NaCl, is a major component of many spice mixtures added to improve the flavour of the
product. It also has preservative and antimicrobial capacity by reducing the water activity of
the product (Coultate, 2009). Additionally, salt can be used as a carrying agent for dry
ingredients (Igoe, 2011). Salts have hygroscopic behaviour and have the ability to interact
with other components in the food, affecting the hydrophobic/hydrophilic interactions
between molecules (Aguilera et al., 1995; Calligaris & Nicoli, 2006; Cuq et al., 2011).
Contradictory literature data has existed whether NaCl would have a pro-oxidative or
antioxidative effect, but it is concluded that NaCl has no effect on lipid oxidation (Calligaris
& Nicoli, 2006).
Sugar
To add sweetness and to improve the flavour of seasonings, sugars such as sucrose or
dextrose are used. Ordinary sugar, the disaccharide sucrose, consists of the monosaccharides
glucose and fructose and is obtained from cane or beet sugar. Dextrose, also named glucose,
is a reducing sugar commercially produced by enzymatic hydrolysis of starch (Igoe, 2011).
The perception of sweetness is somewhat less for glucose compared to sucrose (Coultate,
2009). Sugars can be granulated or powdered, and are hydrophilic, causing hygroscopic
properties (Aguilera et al., 1995; Cuq et al., 2011).
Garlic and Onion
Garlic, Allium sativum, and onion, Allium cepa, are widely used to provide a characteristic
pungent flavour to several types of food. Both onion and garlic can be used fresh or dried, and
the dehydrated forms can be chopped, granulated or powdered (Kalemba & Wajs, 2011;
Raghavan, 2000). The flavour of onion and garlic ranges from mild and sweet to strongly
pungent depending on the variety and origin, and becomes sweeter when cooked. The sulfuric
Figure 2.1: Measurement of angle of repose, α, using a fixed height (left)
and fixed base (right). (Adapted for use from Geldart et al., 2006.)

7
flavour compounds are formed enzymatically only when the cells are cut or damaged
(Raghavan, 2000) and in dehydrated form the flavour enzyme is released only in contact with
water (Igoe, 2011). Garlic and onion powder are highly hygroscopic (Hartmann & Palzer,
2011).
Chili and Paprika
There are five species of the genus Capsicum, whereas most pungent chili peppers and the
more sweet paprika belong to the species Capsicum annum. The chili peppers have different
size, shape, colour, flavour and degree of pungency (Raghavan, 2000). The pungency evolves
from a group of molecules called capsaicinoids with capsaicin having the most pungent
flavour (Coultate, 2009; Raghavan, 2000). The colouring components of chili and paprika are
carotenoids, with capsanthin being the most common one (Coultate, 2009; Takemasa &
Hirasa, 1998). These carotenoids are sensitive to degradation through oxidation catalysed by
light and high temperature, causing loss of colour of paprika powder during storage
(Raghavan, 2000). Paprika oleoresin is an extract isolated from paprika used as a colouring
agent in several food products, being more stable to heat and light (Kalemba & Wajs, 2011;
Raghavan, 2000). Paprika extract and dried paprika and chili in powdered or chopped form
are used to add both flavour and colour to many spice mixtures produced by Santa Maria AB.
Tomato
Tomato is used both as a powder and dried in pieces as a component in spice mixtures. The
red colour of tomatoes originates from the carotenoid lycopene, being relatively resistant to
thermal degradation. However, the processing conditions to manufacture tomato powder
cause degradation of lycopene, as well as oxidation, leading to loss of red colour during
storage. Tomato powder has hygroscopic properties, leading to increased cohesiveness and
caking problems during storage (Liu et al., 2010).
Pepper
Different varieties of pepper are important components in spice mixtures, giving aroma and
pungency to the products. Black, white and green peppers are the berries from the plant Piper
nigrum, picked at different stages of growth and processed at different ways. Green pepper is
picked when the berries are unripe, whereas black and white peppers are ripe berries with the
difference that white peppercorns are peeled before drying (Raghavan, 2000). The aroma,
flavour and pungency vary between the different peppers, depending not only on variety but
also on growth location (Kalemba & Wajs, 2011; Raghavan, 2000). Peppers are used ground
in coarse or fine fractions in several of the spice mixtures of Santa Maria AB.
Herbs
Different dried herbs are used either crushed or ground in the majority of the spice mixtures,
to add herbaceous and aromatic flavours to the products. Oregano, parsley, thyme, basil, sage
and tarragon are components of the four seasonings included in this project. Other herbs
frequently used in Santa Maria products are coriander, marjoram, dill and rosemary. Each
herb has its specific aroma and flavour, giving each of these spices its own characteristics
(Kalemba & Wajs, 2011; Raghavan, 2000). Spices from the Labiatae family, including
rosemary, sage, oregano, basil and thyme, has shown to possess very high antioxidant
capacity and high levels of phenolics, whereas spices in the family Umbelliferae, such as dill,
coriander, and parsley, have low antioxidant capacity (Lu et al., 2011).

8
Anti-caking Agent
The anti-caking agent silicon dioxide is added to many of the spice mixtures produced by
Santa Maria AB in order to ensure better flowability and to prevent agglomeration and caking
of the dried ingredients (Igoe, 2011; Raghavan, 2000). Silicon dioxide has the ability to
absorb approximately 120 % of its weight still remaining free flowing, and is added to many
food products to prevent caking caused by moisture (Igoe, 2011).
Oil
Palm oil is added to the spice mixtures as a processing aid to make the blend more
homogenous in order to prevent separation of particles of different sizes, and to reduce
dusting and caking during manufacturing and packaging (Kjellmer, 2012). Processing aids
like these, not having a function in the finished product and which will not cause a
hypersensitivity reaction does not have to be declared as an ingredient (Livsmedelsföretagen
Li, 2006).
2.2 Shelf Life of Foods
Handling, processing and storage of foods lead to alterations and deterioration of the food
product over time. Several chemical and biochemical reactions, for example oxidation and
hydrolysis, cause alteration of quality attributes such as texture, flavour and colour of the
food. The nutritive value and the occurrence of toxic substances will also be influenced
(Fennema et al., 2008). A number of simultaneous processes like these, often with complex
kinetics, result in the deterioration of a food during storage (Hough, 2010).
One of the most significant quality deteriorating factors indicating the end of shelf life of a
food product is lipid oxidation. Oxidation of lipids occurs when oxidation products react with
several different kinds of other constituents in the food product, and alters the texture, flavour,
colour and nutritive value of the food. There is also a possibility for toxic substances to be
generated (Fennema et al., 2008).
The shelf life of a food product is defined as the time the product will remain safe, preserve
the desired sensory, chemical, physical and microbiological characteristics and maintain the
nutritional values declared, when it is stored under the recommended conditions (Kilcast &
Subramaniam, 2000).
2.2.1 Packaging
In order to preserve a food product and maximise or extent its shelf life, correct packaging of
food products are important. To avoid both biotic and abiotic spoilage of a food product the
packaging has to make a barrier to moisture, oxygen and light. For products such as herbs and
spices it is also desirable to prevent loss of volatile substances, in order to preserve the aroma
and flavour of the product and inhibit contamination of adjacent products. The packaging is
intended to deliver safe and attractive products in a convenient way to the market, as well as
providing information to the costumer and selling the product. These requirements must be
fulfilled at a tolerable economical level and within environmental acceptability (Emblem,
2000).
The most used packaging materials for herbs and spice products produced for retail
consumers at Santa Maria AB are glass jars and laminate bags. The jars are made of

9
transparent glass making a total barrier to moisture and oxygen, while the lid made of plastic
not composes a complete barrier. The laminate bags have a protective barrier made of
polyethylene (PE) and ethylene vinyl alcohol (EVOH) in three layers, PE/EVOH/PE. The PE
layers protect against moisture while EVOH makes an oxygen barrier (Yhlen, 2012).
Generally the spice mixtures intended to be consumed all at once are sold in laminate bags,
while products being consumed during a longer period of time are packed in jars, to make the
product as convenient as possible for the consumer (Zetterquist, 2012).
The spices and spice mixtures produced by Santa Maria AB have a shelf life of between one
and three years, in conformity with the guidelines conducted by Livsmedelsföretagen Li
(2006). This relatively long shelf life is possible as a result of spices being regarded as non-
perishable, only having fading colour and fading flavour intensity during storage (Zetterquist,
2012).
2.2.2 Accelerated Shelf Life Testing
To establish the shelf life of a food product, accelerated storage tests can be made to
considerably shorten the time needed to obtain enough experimental data. This is of great
importance especially when the predicted shelf life of the food product is expected to be long.
Accelerated shelf life testing (ASLT) refers to any method evaluating the long-term stability
of a product based on short-term tests (Hough, 2010; Mizrahi, 2000). The principle of ASLT
is to expose the food product to a selected abuse condition, such as temperature, humidity or
light at high levels, evaluate its quality commonly by sensory analysis, and extrapolate the
results to normal storage conditions (Hough, 2010; Taoukis & Labuza 1996). Compared to
storage during normal conditions, this test procedure saves both time and money (Hough,
2010).
By a systematic study of the deterioration process of a food product it is possible to determine
the shelf life of the food product and ASLT is applicable to any deterioration process with a
valid kinetic model. The process may be chemical, physical, biochemical or microbial
(Mizrahi, 2000; Taoukis & Labuza, 1996).
Change of food quality can be characterised either by the loss of a quantifiable quality
attribute , or by the formation of an undesirable attribute . The rate of degradation of , for
example a nutrient or a flavour, and formation of , for example an off-flavour or
discolouration, can be expressed by equations 2.1 and 2.2, respectively.
[ ]
[ ]
[ ]
[ ]
The constants and are the reaction rate constants and and represents the order of
reaction (Taoukis & Labuza, 1996). Equations 2.1 or 2.2 can be integrated to express or
as a linear function of time , as in equation 2.3.

10
The function is defined as the quality function of the food and is expressed depending
on the order of the reaction (Taoukis & Labuza, 1996). Note that is the attribute which can
be described as a function of time.
Most chemical or microbial reactions causing shelf life loss follow zero order or first order
kinetics. A reaction is following zero order kinetics if the concentration plotted versus time
results in a straight line, that is when . A first order reaction obtains a linear
relationship when logarithmic coordinates of the concentration is plotted against time, when
. If the inverse concentration is plotted versus time and a straight line is
obtained, the reaction follow second order kinetics and
. This denotes that the
order of a reaction can be defined based on a few measurements by the plot maintaining the
best linear relationship, and the quality function of the food, , can be determined
(Taoukis & Labuza, 1996).
There are several environmental factors influencing the shelf life of a food product, for
example temperature, relative humidity, light and mechanical stresses. The factor most
commonly used to accelerate reaction rates and to incorporate in shelf life models is
temperature (Taoukis & Labuza, 1996).
2.2.3 Arrhenius Model
One model widely used to relate the rate of a chemical reaction to temperature is the
Arrhenius relation, denoted in equation 2.4.
(
)
The constant represents the reaction rate constant (kJ/mol K), denotes the Arrhenius
equation constant, is the activation energy (kJ/mol), is the absolute temperature (K) and
represents the universal gas constant (8.3144 J/mol K) (Taoukis & Labuza, 1996).
To estimate the temperature effect on the reaction rate of a specific change of food quality,
values of are estimated at different temperatures and the natural logarithm is plotted
versus inverse temperature . This obtains a straight line with the slope , from
which it is possible to calculate the activation energy. The activation energy represents the
barrier of energy to overcome in order for the reaction to occur. The Arrhenius approach
enables collection of data at high temperatures, during relatively short time, to extrapolate for
the reaction rate constant at lower temperatures. To ensure the confidence limits for the
Arrhenius parameters are narrow, an optimum number of five or six experimental
temperatures are required. If only three experimental temperatures is used it is possible to use
statistical methods to increase the accuracy (Taoukis & Labuza, 1996).
Using too high temperatures when conducting ASLT experiments may induce changes of a
food product which would not occur during normal storage conditions, such as formation of
other deterioration products or change of phase (Hough, 2010).
11
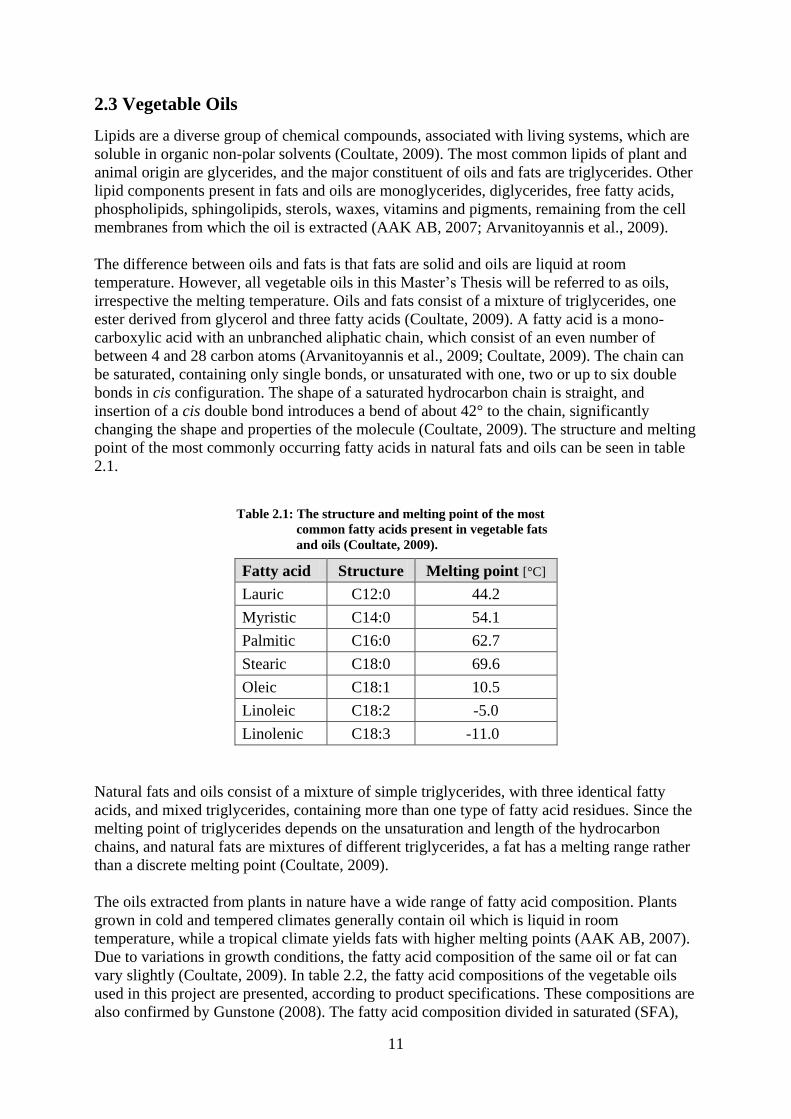
Table 2.1: The structure and melting point of the most
common fatty acids present in vegetable fats
and oils (Coultate, 2009).
2.3 Vegetable Oils
Lipids are a diverse group of chemical compounds, associated with living systems, which are
soluble in organic non-polar solvents (Coultate, 2009). The most common lipids of plant and
animal origin are glycerides, and the major constituent of oils and fats are triglycerides. Other
lipid components present in fats and oils are monoglycerides, diglycerides, free fatty acids,
phospholipids, sphingolipids, sterols, waxes, vitamins and pigments, remaining from the cell
membranes from which the oil is extracted (AAK AB, 2007; Arvanitoyannis et al., 2009).
The difference between oils and fats is that fats are solid and oils are liquid at room
temperature. However, all vegetable oils in this Master’s Thesis will be referred to as oils,
irrespective the melting temperature. Oils and fats consist of a mixture of triglycerides, one
ester derived from glycerol and three fatty acids (Coultate, 2009). A fatty acid is a mono-
carboxylic acid with an unbranched aliphatic chain, which consist of an even number of
between 4 and 28 carbon atoms (Arvanitoyannis et al., 2009; Coultate, 2009). The chain can
be saturated, containing only single bonds, or unsaturated with one, two or up to six double
bonds in cis configuration. The shape of a saturated hydrocarbon chain is straight, and
insertion of a cis double bond introduces a bend of about 42° to the chain, significantly
changing the shape and properties of the molecule (Coultate, 2009). The structure and melting
point of the most commonly occurring fatty acids in natural fats and oils can be seen in table
2.1.
Fatty acid Structure Melting point [°C]
Lauric C12:0 44.2
Myristic C14:0 54.1
Palmitic C16:0 62.7
Stearic C18:0 69.6
Oleic C18:1 10.5
Linoleic C18:2 -5.0
Linolenic C18:3 -11.0
Natural fats and oils consist of a mixture of simple triglycerides, with three identical fatty
acids, and mixed triglycerides, containing more than one type of fatty acid residues. Since the
melting point of triglycerides depends on the unsaturation and length of the hydrocarbon
chains, and natural fats are mixtures of different triglycerides, a fat has a melting range rather
than a discrete melting point (Coultate, 2009).
The oils extracted from plants in nature have a wide range of fatty acid composition. Plants
grown in cold and tempered climates generally contain oil which is liquid in room
temperature, while a tropical climate yields fats with higher melting points (AAK AB, 2007).
Due to variations in growth conditions, the fatty acid composition of the same oil or fat can
vary slightly (Coultate, 2009). In table 2.2, the fatty acid compositions of the vegetable oils
used in this project are presented, according to product specifications. These compositions are
also confirmed by Gunstone (2008). The fatty acid composition divided in saturated (SFA),
12
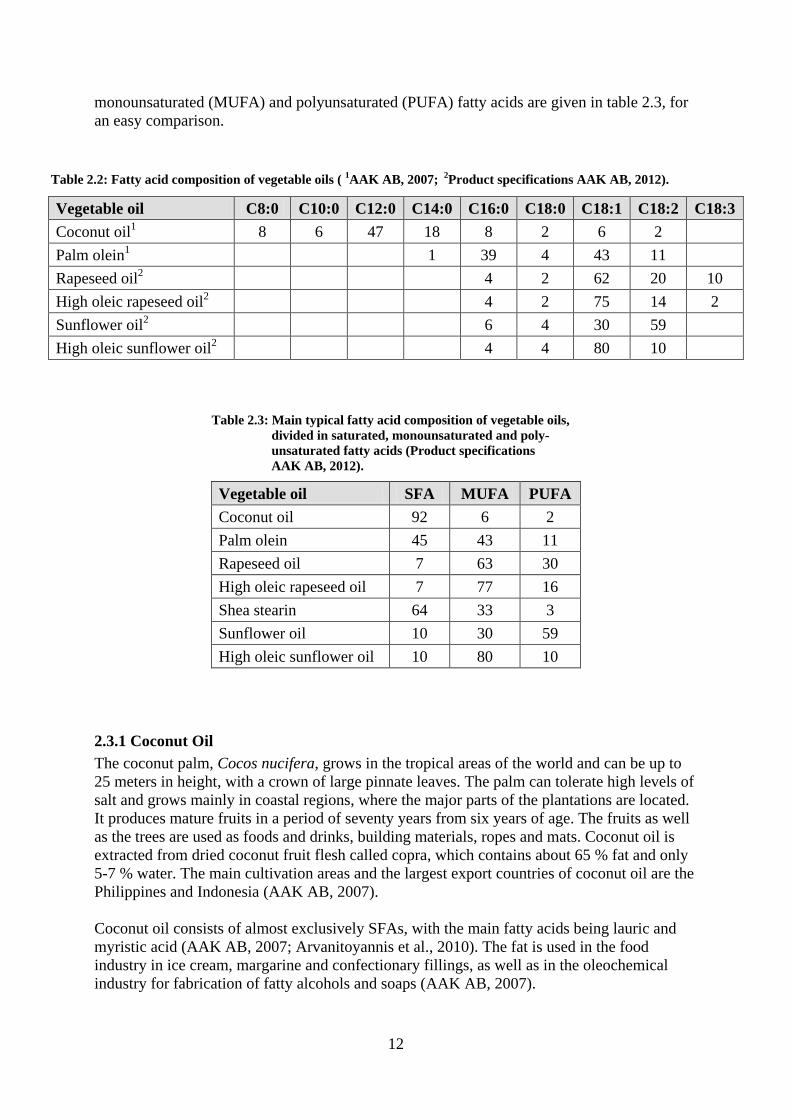
Table 2.2: Fatty acid composition of vegetable oils ( 1AAK AB, 2007;
2Product specifications AAK AB, 2012).
Table 2.3: Main typical fatty acid composition of vegetable oils,
divided in saturated, monounsaturated and poly-
unsaturated fatty acids (Product specifications
AAK AB, 2012).
monounsaturated (MUFA) and polyunsaturated (PUFA) fatty acids are given in table 2.3, for
an easy comparison.
Vegetable oil C8:0 C10:0 C12:0 C14:0 C16:0 C18:0 C18:1 C18:2 C18:3
Coconut oil1
8 6 47 18 8 2 6 2
Palm olein1 1
39 4 43 11
Rapeseed oil2 4 2 62 20 10
High oleic rapeseed oil2
4 2 75 14 2
Sunflower oil2 6 4 30 59
High oleic sunflower oil2 4 4 80 10
Vegetable oil SFA MUFA PUFA
Coconut oil 92 6 2
Palm olein 45 43 11
Rapeseed oil 7 63 30
High oleic rapeseed oil 7 77 16
Shea stearin 64 33 3
Sunflower oil 10 30 59
High oleic sunflower oil 10 80 10
2.3.1 Coconut Oil
The coconut palm, Cocos nucifera, grows in the tropical areas of the world and can be up to
25 meters in height, with a crown of large pinnate leaves. The palm can tolerate high levels of
salt and grows mainly in coastal regions, where the major parts of the plantations are located.
It produces mature fruits in a period of seventy years from six years of age. The fruits as well
as the trees are used as foods and drinks, building materials, ropes and mats. Coconut oil is
extracted from dried coconut fruit flesh called copra, which contains about 65 % fat and only
5-7 % water. The main cultivation areas and the largest export countries of coconut oil are the
Philippines and Indonesia (AAK AB, 2007).
Coconut oil consists of almost exclusively SFAs, with the main fatty acids being lauric and
myristic acid (AAK AB, 2007; Arvanitoyannis et al., 2010). The fat is used in the food
industry in ice cream, margarine and confectionary fillings, as well as in the oleochemical
industry for fabrication of fatty alcohols and soaps (AAK AB, 2007).

13
2.3.2 Palm Oil
The oil palm, Elaeis guineensis, originates from West Africa and is a large pinnate-leaved
palm that can become 30 meters high and 200 years old in the wild. At plantations the trees
are usually replanted when the height has reached 10 meters, which occurs when the palms
are about 25 years of age (Corley & Tinker, 2003). The oil palm produces fruit from the third
year until it is sixty years old, with full production from its twelfth year (AAK AB, 2007).
The small fruits vary between 2 and 5 cm in length and are spherical to ovoid in shape
(Corley & Tinker, 2003). The fruits, that are orange-brown in colour when ripe, grow in
infructescences with each bunch containing up to 2000 fruits and weighing 50-60 kg (AAK
AB, 2007). The fruit consists of a central hard-shelled nut surrounded by an outer pulp, from
which the palm oil is extracted. The fruit flesh of the pulp has an oil content of 40 % that is
extracted by pressing and centrifugation within days of harvest. Another type of oil, palm
kernel oil, is extracted from the nut containing the palm kernel. The main producing and
exporting countries of palm oil are Malaysia and Indonesia, where large plantations for
systematic cultivation have developed (AAK AB, 2007; Corley & Tinker, 2003).
Palm oil contains almost equal proportions of saturated and unsaturated fatty acids, with
palmitic and oleic acid as the most common ones, making the fat semi-solid at room
temperature (AAK AB, 2007; Arvanitoyannis et al. 2010). Palm oil is often used in a wide
range of food products and often processed into different fractions to maintain the requested
properties. The stearin fraction, with high melting point, is mainly used as solid component in
margarine, bakery and confectionary, whereas the lower melting point fraction, olein,
primarily is used for cooking and salad oils, and for deep fat frying (AAK AB, 2007; Corley
& Tinker, 2003).
2.3.3 Rapeseed Oil
Rapeseed, Brassica napus, is a bright yellow-flowering member of the Brassicaceae, or
mustard, family that grows to a height of 75-175 cm. It originates from India and are today
cultivated in large parts of the world for the production of animal feed, vegetable oil for
human consumption and biodiesel (AAK AB, 2007; Arvanitoyannis et al., 2010). The small,
round seeds are black-red in colour and have an oil content of just above 40 %, which is
commonly extracted by pressing. Rapeseed is frequently cultivated in Europe, but also in
China, India, Canada and Australia (AAK AB, 2007).
Rapeseed oil is nutritionally well balanced, with a very low content of saturated fatty acids
and a high content of the unsaturated fatty acids oleic, linoleic and linolenic acid. The content
of sterols and tocopherols are relatively high in rapeseed oil. A variety of rapeseed oil with
alternating fatty acid composition has been developed by conventional breeding techniques
(AAK AB, 2007). High oleic rapeseed oil is consisting of mainly oleic acid and linoleic acid.
Due to the low content of linolenic acid, high oleic rapeseed oil is considered a high stability
oil compared to normal rapeseed oil, and it is suitable to use in high temperatures (Product
specifications AAK AB, 2012).
2.3.4 Shea Fat
The shea tree, Butyrospermum parkii, grows wild in West Africa in the savannah region. It is
a drought resistant long-lived tree that can be 25 meters in height and produce nuts up to an
age of 200 years, and is most productive between 50 to 100 years of age. The fruits are
elliptical to round-shaped and about 4 cm long. When ripening, it changes colour from green
to yellow-brown and falls to the ground. The work of collecting and preparing the nuts, as
14
well as kneading the shea butter, is performed mainly by the women in the native countries
where the shea trees grow, and the nut has been of great importance for the people of these
parts of Africa for a long time when used in food, as lamp fuel and for soap production.
Today, the main cultivation and exporting countries of shea fat are Ghana, Burkina Faso and
the Ivory Coast (AAK AB, 2007).
Shea fat is composed mainly of stearic and oleic acid, but also to a small extent of palmitic
and linoleic acid. The triglyceride stearic-oleic-stearic, is very common in shea fat and by
fractionation these triglycerides can be concentrated to be used as cocoa butter equivalence in
chocolate. Shea butter is also used in skin care products, as it contains high amounts of non-
glyceride components (AAK AB, 2007).
2.3.5 Sunflower Oil
The sunflower, Heliantus annuus, originates from the tropical parts of Central and South
America and grows today in parts of the world with warm and sunny summer months. The
annual crop has a stem that can grow to a height of 2-4 meters and a yellow inflorescence to a
diameter of 15-50 cm. Up to 2000 seeds develop in the middle of each flower, and the shape
and colour differ depending on variety. The oil content in the seeds is about 40 % and the oil
is extracted by crushing or pressing. The main cultivation and exporting areas of sunflower oil
are Argentina, Russia, Southern and Eastern Europe and the US (AAK AB, 2007).
Sunflower oil consists mainly of linoleic acid and also oleic acid, and is commonly used in
mayonnaise and salad dressings (AAK AB, 2007). Through conventional breeding
techniques, several types of sunflower oil with different fatty acid composition have been
developed (AAK AB, 2007; Arvanitoyannis et al. 2010). High oleic sunflower oil consists of
80 % oleic acid and only 10 % linoleic acid, making it suitable in applications with high
demands on oxidative stability (AAK AB, 2007).
2.3.6 Lipids and Health
Fat is an important part of our diet that gives us more energy per unit weight than other
nutrients (9 kcal/g). Lipids make up a major part in our cell membranes and are necessary for
the body to make and repair cells, as well as to produce hormones and other hormone like
compounds. Fat enables uptake of the fat-soluble vitamins A, D, E and K and are involved in
controlling our blood pressure, blood coagulation and immune system (SLV, 2011).
To enable transport of lipids such as triglycerides and cholesterol in the blood, these
molecules are combined with proteins to make spherical, water soluble lipoproteins. The
lipoproteins consist of an outer shell of proteins, phospholipids and cholesterol molecules
surrounding an inner core of triglycerides and other lipids. They transport lipids in the body
and are named according to their size and density. The smallest lipoproteins, Chylomicrons,
are formed in the absorptive epithelial cells of the small intestine and transport dietary lipids
to adipose tissue for storage. Very low-density lipoproteins (VLDLs) transport triglycerides
made in the liver cells to adipose cells for storage. VLDLs are converted to Low-density
lipoproteins (LDLs) after some of their triglycerides have been deposited in adipose cells.
LDLs carry about 75 % of the total cholesterol in blood and deliver it to cells throughout the
body for use in repair of cell membranes and synthesis of steroid hormones and bile salts.
Excess cholesterol is removed from body cells by High-density lipoproteins (HDLs) and
transported to the liver for elimination (Tortora & Derrickson, 2010).
15
LDLs deposit cholesterol in and around smooth muscle fibers in arteries when existing in
excessive numbers. This forms fatty plaques that increase the risk of coronary artery disease,
making the cholesterol in LDLs known as the bad cholesterol. On the contrary, HDL
cholesterol is known as the good cholesterol, since it prevents accumulation of cholesterol in
the blood. Consequently, high levels of LDLs are associated with increased risk of
atherosclerosis and coronary artery diseases, whereas high levels of HDLs are associated with
decreased risk (Tortora & Derrickson, 2010).
The composition of the fat we are eating influences the concentration of plasma lipoprotein
cholesterol fractions at different ways. The saturated fatty acids lauric (C12:0), myristic
(C14:0) and palmitic (C16:0) acids increase the levels of LDL, whereas stearic (C18:0) acid
has no effect (FAO, 2010). The Food and Agriculture Organization of the United Nations,
FAO, has concluded that there is convincing evidence that replacing SFAs (C12:0-C16:0)
with unsaturated fatty acids, specifically PUFAs, reduces LDL cholesterol concentration and
the total/HDL cholesterol ratio. A high intake of SFAs leads to a possible increased risk of
diabetes, while increased intake of PUFAs possibly reduces the risk of diabetes. Replacing
SFAs with PUFAs has shown to decreases the risk of coronary heart diseases. Very high
consumption of PUFAs may increase lipid oxidation, especially when tocopherol intake is
low. However, there is insufficient evidence for establishing any relationship of PUFA
consumption with cancer (FAO, 2010).
The Swedish National Food Agency recommends that the total energy intake from fat should
be 25-30 %, whereof the consumption of SFAs should be limited and contribute to maximum
10 energy percent (E%). MUFAs should contribute to 10-15 E% and PUFAs to 5-10 E%, of
which 1 E% from n-3 fatty acids. Linoleic acid and alpha-linolenic acid are essential fatty
acids that cannot be synthesised by humans and therefore 3 E% needs to be consumed daily.
Higher intake than 10 E% of PUFA is not recommended, since there are no health benefits
with higher consumption, but it could possibly increase the risk of peroxidation of fatty acids
(SNR, 2005).
2.3.7 Production and Processing
Vegetable oils are used in a wide variety of food products, putting many requirements to the
finished oil in order to guarantee a high quality product. Some of the most important
properties are bland taste, long shelf life, bright colour and suitable crystallisation and melting
behaviour. This is achieved by multiple refining steps when the oil has been extracted from
the plant. Extraction is performed commonly by pressing, a physical separation method
applied to seeds with an oil content exceeding 25 %. Seeds containing less fat, such as
soybeans, needs addition of a solvent, normally hexane, in order to enable fat separation from
the solid matters of the seed (AAK AB, 2007).
The refining processes are performed in order to remove unwanted components from the oil,
such as free fatty acids, phospholipids, oxidation products, solid particles, coloured
compounds and substances with strong taste and odour (AAK AB, 2007; Corley & Tinker,
2003). Neutralisation, bleaching and deodorisation steps make the refined oil pure and bright,
with a bland taste and a good shelf life, while sterols and tocopherols are still intact (AAK
AB, 2007).
Additional modification procedures, such as fractionation, can also be used to maintain the
functionality of an oil needed for a specific application. During fractionation the oil is
separated into different parts called fractions, consisting of different triglycerides with

16
different melting properties. The triglycerides are separated by partial crystallisation as a
result of the proportions of more or less saturated triglycerides. The two most common
fractions are stearin, consisting of more saturated triglycerides, and olein with lower melting
point and more unsaturated triglycerides (AAK AB, 2007; Coultate, 2009; Corley & Tinker,
2003).
2.3.8 Environmental Aspects
According to a life cycle analysis performed by SIK 2008, the main environmental effects
from vegetable oils come from the cultivation stage, while transports and industrial
processing have less impact. The analysis compared the effects of palm oil, soybean oil and
rapeseed oil, and it was shown that rapeseed oil cultivated in Sweden is a better choice for the
climate, compared to palm oil and soybean oil. In calculations of greenhouse gas emissions,
rapeseed oil contributes to about 1500 kg CO2 equivalents per tonne oil, whereas the same
amount for palm oil is almost 2500 kg. An earlier life cycle analysis has shown that palm oil
is the best alternative, but the greenhouse gas emissions from palm oil may vary up to five
times depending on cultivation area and processing steps. The study also showed that the
emission of greenhouse gases was considerably less for rapeseed oil cultivated in Sweden
compared to rapeseed oil cultivated in Germany. This difference is due to the intense use of
fertilisers in Germany (AAK AB, 2010).
The net environmental impact of palm oil depends on where it is planted. It often grows in
areas with high biodiversity and large carbon-storage values. Forest loss at conversion to oil
palm plantations may cause increased risk of fire, erosion, soil degradation and greenhouse
gas emissions (WWF UK, 2011). To prevent these negative consequences of palm oil
cultivation, future oil palm expansion has to be made without deforestation, and according to
Fitzherbert et al. (2008), there is enough non-forest land suitable for plantation development
to avoid further deforestation, but often it is cheaper and easier to clear forests. Many species
are not able to survive in the degraded and fragmented forests left at conversion of land to
palm oil cultivations. This is true for the orangutans living on the islands of Boneo and
Sumatra, where they have undergone a tenfold loss in population size (WWF UK, 2011).
Other examples of species extinction are reported by Fitzherbert et al. (2008), and show that a
mean of only 15 % of the species recorded in primary forest were found also in palm oil
plantations. As mentioned in the introduction, RSPO work to support production of
sustainable palm oil, and Santa Maria AB is one of the supporting members of RSPO (RSPO,
2009; Santa Maria AB, 2012).
2.4 Lipid Oxidation
Rancidity is a chemical deterioration of fats and oils leading to unpleasant odours and
flavours. This decomposition can occur by two different mechanism, oxidative rancidity or
hydrolytic rancidity (Coultate, 2009; Kristott, 2000).
Oxidative rancidity, or lipid oxidation, is the process where unsaturated fatty acids are
degraded in the presence of oxygen, and the products decompose to produce unpleasant off-
flavours. Lipid oxidation of foods causes loss of shelf life, palatability and nutritional quality
(Kristott, 2000; McClements & Decker, 2008; Reische et al., 2008).
Hydrolytic rancidity occurs when fatty acids are cleaved off from a triglyceride in the
presence of water. The liberated free fatty acids results in the development of off-flavours
17
(McClements & Decker, 2008; Kristott, 2000). The hydrolysis resulting in rancidity can be a
spontaneous chemical reaction or catalysed by enzymes. If the reaction is caused by lipases it
is called lipolytic rancidity. Short carbon chain fatty acids of the length C4:0-C12:0 cause
particularly unpleasant off-flavours with low threshold values. One example is the liberation
of lauric acid from coconut oil having soapy flavour (Johansson, 1976; Kristott, 2000).
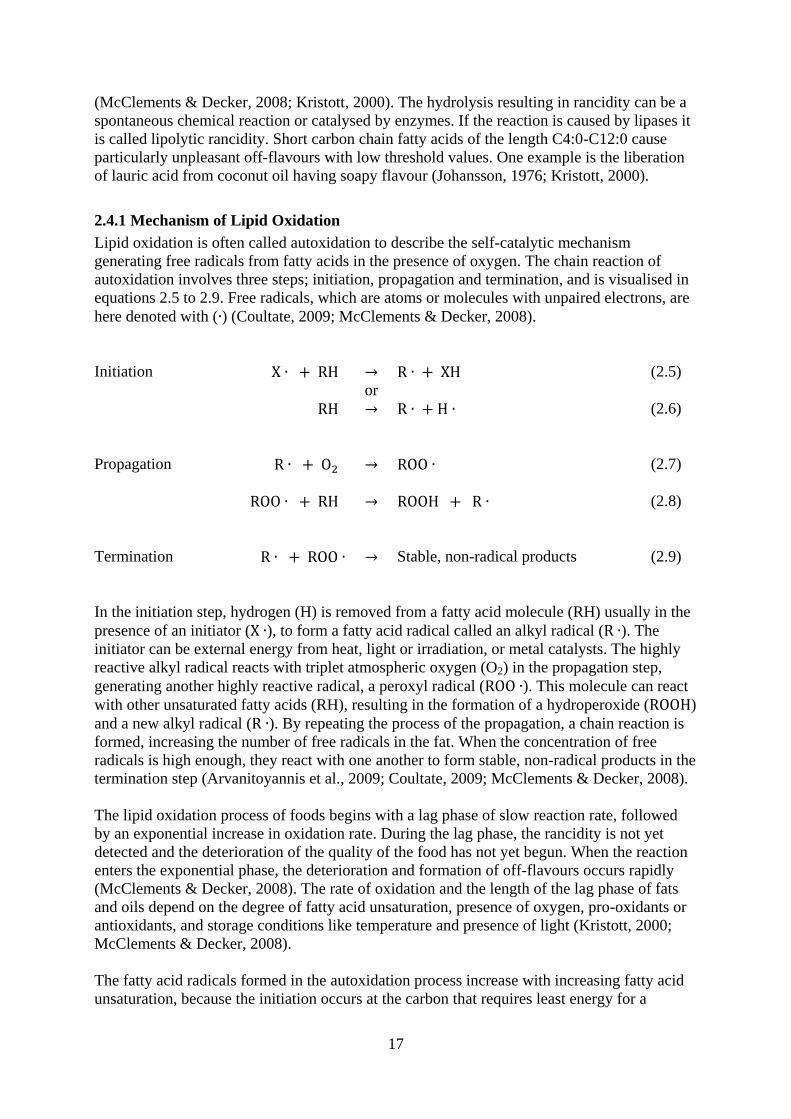
2.4.1 Mechanism of Lipid Oxidation
Lipid oxidation is often called autoxidation to describe the self-catalytic mechanism
generating free radicals from fatty acids in the presence of oxygen. The chain reaction of
autoxidation involves three steps; initiation, propagation and termination, and is visualised in
equations 2.5 to 2.9. Free radicals, which are atoms or molecules with unpaired electrons, are
here denoted with ( ) (Coultate, 2009; McClements & Decker, 2008).
Initiation
(2.5)
or
(2.6)
Propagation
(2.7)
(2.8)
Termination
Stable, non-radical products
(2.9)
In the initiation step, hydrogen (H) is removed from a fatty acid molecule (RH) usually in the
presence of an initiator ( ), to form a fatty acid radical called an alkyl radical ( ). The
initiator can be external energy from heat, light or irradiation, or metal catalysts. The highly
reactive alkyl radical reacts with triplet atmospheric oxygen (O2) in the propagation step,
generating another highly reactive radical, a peroxyl radical ( ). This molecule can react
with other unsaturated fatty acids (RH), resulting in the formation of a hydroperoxide ( )
and a new alkyl radical ( ). By repeating the process of the propagation, a chain reaction is
formed, increasing the number of free radicals in the fat. When the concentration of free
radicals is high enough, they react with one another to form stable, non-radical products in the
termination step (Arvanitoyannis et al., 2009; Coultate, 2009; McClements & Decker, 2008).
The lipid oxidation process of foods begins with a lag phase of slow reaction rate, followed
by an exponential increase in oxidation rate. During the lag phase, the rancidity is not yet
detected and the deterioration of the quality of the food has not yet begun. When the reaction
enters the exponential phase, the deterioration and formation of off-flavours occurs rapidly
(McClements & Decker, 2008). The rate of oxidation and the length of the lag phase of fats
and oils depend on the degree of fatty acid unsaturation, presence of oxygen, pro-oxidants or
antioxidants, and storage conditions like temperature and presence of light (Kristott, 2000;
McClements & Decker, 2008).
The fatty acid radicals formed in the autoxidation process increase with increasing fatty acid
unsaturation, because the initiation occurs at the carbon that requires least energy for a

18
hydrogen atom removal. A carbon atom next to an electron-rich double bond has a weaker
carbon-hydrogen covalent bond compared to a saturated carbon without a neighbouring
double bond. In polyunsaturated fatty acids, the carbon-hydrogen bond of the atom in between
two double bonds is even further weakened by withdrawing electrons. With decreased carbon-
hydrogen bond dissociation energy, hydrogen abstraction becomes easier and oxidation
occurs faster. This explains the increased oxidation rates of oleic, linoleic and linolenic acids,
respectively (Kim & Min 2008; McClements & Decker, 2008).
2.4.2 Pro-oxidants
Pro-oxidants are substances or factors that cause or accelerate lipid oxidation, either by direct
interaction with unsaturated fatty acids to form lipid hydroperoxides, or by promoting the
formation of free radicals. Some pro-oxidants present in food systems are transition metals,
singlet oxygen, light and increased temperature (McClements & Decker, 2008).
Transition Metals
Transition metals are metals with two or more valence states, for example iron, copper,
manganese, nickel and zinc. They are one of the most important pro-oxidants in foods since
they exist in all biological materials and are common constituents of packaging material. They
have the ability to abstract a hydrogen atom from fatty acids, thereby forming alkyl radicals
and initiating lipid oxidation. Transition metals also have the ability to decompose
hydroperoxides into free radicals through a reduction-oxidation reaction. The most common
transition metals present in foods causing these reactions are iron and copper. The pro-
oxidative ability of metals depend on their redox state, and generally the reduced state is more
reactive than the oxidised state (McClements & Decker, 2008).
The content of metal ions, and enzymes and pigments also being identified as lipid oxidation
catalysts, can be reduced in fats and oils by bleaching and refining processes. To avoid metal
contamination it is also important to avoid processing equipment and packaging materials
containing metals (Kristott, 2000).
Singlet Oxygen
Singlet oxygen (1O2) is a short-lived, highly reactive and highly energetic form of oxygen that
can react directly with the double bonds of unsaturated fatty acids in the formation of
hydroperoxides, without the formation of free radicals (Coultate, 2009; Kim & Min, 2008). In
this way, singlet oxygen can cause and accelerate lipid oxidation (Coultate, 2009;
McClements & Decker, 2008). Singlet oxygen is produced from ordinary triplet oxygen (3O2)
by photosensitisation in the presence of light. A photosensitiser present in the food, such as
chlorophyll, riboflavin or myoglobin, can absorb energy from light and transfer it to convert
triplet oxygen into singlet oxygen (Kim & Min, 2008; McClements & Decker, 2008). The
reaction rate of singlet oxygen is related to the number of double bonds in the molecules, and
occurs much faster than triplet oxygen lipid oxidation (Kim & Min, 2008).
Light and Elevated Temperature
The presence of light as well as increased temperature can initiate autoxidation and promote
decomposition of hydroperoxides to produce free radicals. Therefore it is important to store
foods cool and in the absence of light (McClements & Decker, 2008).

19
2.4.3 Antioxidants
Antioxidants are substances able to delay the initiation or reduce the rate of oxidation
reactions (Kristott, 2000; Nawar, 1996; Reische et al., 2008). Antioxidants can be naturally
present in foods or intentionally added in order to maintain the quality and extend the shelf
life of a food product. Antioxidants can be classified by their mechanism of action in two
groups; primary and secondary antioxidants (Reische et al., 2008).
Primary Antioxidants
Primary antioxidants are also called chain-breaking antioxidants and have the most commonly
occurring antioxidant mechanism. These antioxidants delay or inhibit the initiation of
oxidation by interfering with the propagation phase of autoxidation (equation 2.8) (Reische et
al., 2008). The primary antioxidants react with lipid radicals and peroxyl radicals, thereby
inhibiting the free radical chain reaction. This is done by abstraction of the unpaired electrons
of the fatty acid radical ( ) and by donation of a hydrogen atom from the antioxidant
molecule (AH), as described in equation 2.10.
(2.10)
The antioxidant radical produced ( ) is stabilised by delocalisation of the unpaired electron,
thus preventing it from react to form new fatty acid radicals (Kristott, 2000; Nawar, 1996;
Reische et al., 2008).
Primary antioxidants are compounds containing one or more phenolic groups, with the
molecular structure of the phenolic ring forming stable resonance intermediates, without
positions suitable for attack by molecular oxygen (Nawar, 1996; Reische et al., 2008).
The most common primary antioxidants are the tocopherols, containing various methylated
phenols, present in various amounts in vegetable fats and oils. Tocopherols are retained in the
refining process, but some are lost during the deodorisation, making a careful process
important in order to preserve the antioxidants (Kristott, 2000; Reische et al., 2008).
Tocopherols are used commercially as a natural antioxidant, being derived from the soybean
oil refining industry (Reische et al., 2008).
Secondary Antioxidants
Secondary antioxidants are preventive antioxidants which inactivate oxidation catalysts by a
number of different methods, for example as metal chelating agents or as singlet oxygen
quenchers (Reische et al., 2008). Chelating agents, such as citric acid, form a complex with a
transition metal ion catalyst, thereby decreasing the pro-oxidative effect of the metal by
reducing the redox potential and stabilising the oxidised state of the metal (Kristott, 2000;
Reische et al., 2008).
Other antioxidants, such as beta-carotene, lycopene and other carotenoids, reduce oxidation
by reaction with singlet oxygen (1O2). The exchange energy of the singlet oxygen is
transferred to the carotenoid, returning the highly reactive molecule to its inactivated triplet
state (3O2), while the carotenoid releases the energy as heat (Coultate, 2009; Reische et al.,
2008).
Secondary antioxidants can act synergistically to promote the antioxidant activity of primary
antioxidants (Reische et al., 2008).
20
2.4.4 Formation of Lipid Oxidation Decomposition Products
The hydroperoxides formed at autoxidation are generally colourless, odourless and tasteless,
not directly contributing to rancidity. However being relatively unstable, particularly at
elevated temperatures, these primary oxidation products decompose to form small, volatile
compounds causing the off-aromas of oxidative rancidity. These secondary oxidation products
contain a wide range of compounds, such as hydrocarbons, aldehydes, ketones, alcohols,
esters and acids, due to the many different possible reaction pathways (McClements &
Decker, 2008; Min, 2000).
The complex mixture of produced volatile compounds acts individually or in combination to
generate unique tastes and aromas, and the same compounds can generate different sensory
impressions in different food products (Jacobsen, 2010; Min, 2000). Each flavour compound has a different flavour threshold value. Unsaturated aldehydes and
ketones have the lowest sensory thresholds and are therefore the major contributors to the
undesirable and unpleasant odours and flavours in oxidised food products (Min, 2000). The
compounds with the highest thresholds are hydrocarbons such as alkanes and alkenes, with
threshold values thousand-folds the ones of ketones (Jacobsen, 2010; Min, 2000). This wide
range of sensory thresholds makes it important to consider not only the concentration of a
volatile compound present, but also the threshold values, when studying the overall flavour of
oxidised oil. A compound with a low threshold value can have a significant influence on the
flavour perception even in small quantities, in opposite to a compound present in larger
quantities but with a higher sensory threshold value (Kim & Min, 2008; Min, 2000).
Lipid oxidation of fats and oils can give rise to several different off-flavours and off-aromas
caused by a wide range of volatile oxidation compounds. They can range from cardboard,
green, grassy, beany and nutty to tallow, metallic, rancid, synthetic and painty. Other flavours
can be oily, fishy, deep-fried, lemon, fruity, soapy and bitter (Jacobsen, 2010; Min, 2000;
Reineccius, 2006; Ridgway & Lalljie, 2011).
2.4.5 Sensory Evaluation of Lipid Oxidation Products
The various and complex substances formed as lipid oxidation products can be evaluated and
measured in many different ways. The primary oxidation products are colourless and
flavourless whereas the secondary decomposition products give rise to both flavours and
odours, and are therefore a distinct indication of lipid oxidation and food deterioration. These
processes can be assessed by sensory evaluation or by several analytical methods (Shahidi &
Wanasundara, 2008).
Sensory evaluation is considered the most appropriate and best suitable method to assess the
quality of fats and oils. This is due to that the human senses are very sensitive and are able to
detect the off-aromas and off-flavours produced by lipid oxidation directly and at very low
concentrations (Gordon, 2001; Kristott, 2000; McClements & Decker, 2008). However,
sensory analysis needs to be performed with a trained panel able to detect small changes in
rancidity, and the training is usually product specific due to that the wide range of oxidation
products generates different sensory profiles depending of the fatty acid composition. This
makes sensory analysis a time consuming and often costly technique (Kristott, 2000;
McClements & Decker, 2008). The reproducibility of sensory evaluation is not as good as that

21
of analytical methods and combining these two types of evaluation techniques would give the
best results (Gordon, 2001; McClements & Decker, 2008).
Sensory analysis evaluates the attributes appearance, aroma, texture and flavour of a food
item and how they are perceived. This technique is usually applied in the fields of quality
control, product development and research, to conduct valid and reliable information in order
to make good decisions about the perceived sensory properties of the product (Meilgaard et
al., 1999).
Sensory analysis can be divided into two parts, consumer tests and analytical tests. The
consumer tests intend to determine the consumers’ approval of a product and can be either
qualitative or quantitative. The qualitative tests include a small number of respondents and
consist of focus groups, interviews or questionnaires. The quantitative tests demand a larger
number of respondents and are often designed as a nine grade hedonic scale, with the
alternatives “like extremely” to “dislike extremely” (Lundgren, 1981; Wendin, 2011). From
the received data it is then possible to calculate which product the consumers prefer. In
consumer testing it is important that the respondents are representative to a certain group of
consumers, and not trained in judging food products. A consumer test can also be designed as
a preference test where the preferred of two different samples are to be chosen (Lundgren,
1981).
Analytical tests demand selected and trained panelists able to detect small differences, and
can be divided into difference tests and descriptive tests (Lundgren, 1981; Wendin, 2011).
With a difference test it is possible to detect if there exist a sensory difference between
samples or not. The three most common methods to investigate this are triangle test, pairwise
test and duo-trio test. A triangle test contains three samples from which two are identical, and
the panelists are to decide which sample that differs from the others. In a pairwise difference
test the task is to decide if two different samples differ in a certain sensory attribute, for
example which sample that has the saltiest taste. A duo-trio test aims to select which of two
samples that is identical to a presented reference sample, in order to decide if there exists a
difference between two products (Lundgren, 1981). A descriptive test may conclude which
differences that exist between samples, and how significant these differences are. The test is
performed by making a list of the products’ sensory attributes of interest and to select a scale
to be able to measure the intensity of each attribute (Lundgren, 1981). This gives the sensory
profile of the product, a description of the sensory properties of a sample assigned with
intensity values of each attribute. A profile obtained by agreement after discussion by a group
of assessors, after each assessor has evaluated the product by themselves before the
discussion, is called a consensus sensory profile (ISO 13299, 2010).
To obtain the best evaluation, the sensory analysis is performed individually with the
assessors seated in booths in a quiet, well ventilated room (Lundgren, 1981). However, at a
consensus profiling, the assessors are seated around a table. The main advantage with
consensus profiling is that it is possible to test many samples at a relatively low cost in both
samples and assessors’ time. Usually a descriptor panel consists of eight to twelve assessors,
but in consensus profiling the number of panelists may be as few as four (ISO 13299, 2010).
The intensity of a perceived attribute can be expressed by numbers or words using a response
scale, which can be either continuous or discrete. A continuous scale allows the assessor to
register a response anywhere on a straight line scale, whereas a discrete scale is composed by
a certain number of predefined steps (ISO 4121, 2003; Lundgren, 1981). The discrete
22
response scale has to be broad enough to cover the full range of intensities, with enough
scaling steps for the assessors to express small differences. However, the steps have to be few
enough to avoid that the assessors perceive the task as too difficult (Lundgren, 1981;
Meilgaard et al., 1999). Usually the scales have five to nine points which can reach from
”nothing” to ”very strong” when describing the intensity of an attribute. The variety of food
products require that a new formulary, with specific attributes and response scale is made for
every product evaluation to be performed (Lundgren, 1981).
Sensory evaluation is widely used in the food industry to determine whether product
differences result from the effects of processing conditions, storage time, different packaging
materials or a change in ingredients (Meilgaard et al., 1999; Min, 2000). When there are
several samples to evaluate and to control during a product or process development, it can be
suitable to perform a screening test, a preliminary selection procedure, in order to decide
which samples are to be included in a complete sensory profiling (ISO 5492, 2009).
2.4.6 Analytical Measurements of Lipid Oxidation Products
There are several different analytical methods to measure lipid oxidation in foods. Because of
the complexity of the lipid oxidation decomposition products there is no uniform or standard
method to detect the oxidative changes in a food system. Each test method detects a single
group of chemical compounds, and due to the wide range of the oxidation products formed, it
is important to decide which components to observe. To maintain a characterisation of the
degree of oxidation of an oil, at least two chemical tests have to be performed (Gordon, 2001;
Kristott, 2000; Shahidi & Wanasundara, 2008). The most commonly used chemical tests to
evaluate the quality of oils are peroxide value, para-anisidine value, thiobarbituric acid value
and chromatographic methods (Kristott, 2000).
Peroxide Value
The content of primary products of lipid oxidation, hydroperoxides, can be measured by the
peroxide value (PV). The PV is determined by measuring the amount of iodine formed when
the hydroperoxides liberate iodine ions from potassium iodide. The amount of iodine is
proportional to the concentration of hydroperoxides in the sample. PV is expressed in
milliequivallents of oxygen per kilogram of fat or oil, meq/kg, and the method is appropriate
to use in the beginning of the oxidation process, since the content of hydroperoxides will
increase to reach a peak and then decline when they decompose to secondary oxidation
products (Nawar, 1996; Shahidi & Wanasundara, 2008). For this reason the PV may be low
even though the oil is very rancid, and a PV measurement should therefore be combined with
a technique detecting secondary oxidation products to maintain a more correct representation
of the oxidation process (Gordon, 2001; Kristott, 2000).
para-Anisidine Value
The para-anisidine value (AV) is a measurement of the content of aldehydes in fats and oils,
formed as secondary products in lipid oxidation. para-Anisidine is a reagent that reacts with
aldehydes in the presence of acetic acid to form yellowish products with an absorption
maximum of 350 nm (Gordon, 2001; Nawar, 1996; Shahidi & Wanasundara, 2008). The AV
is defined as the absorbance of a solution containing 1 gram oil in 100 ml of a mixture of the
solvent isooctane with para-anisidine in 0.25 % acetic acid (Gordon, 2001).
23
Thiobarbituric Acid Value
A common method to evaluate lipid oxidation in foods is the thiobarbituric acid (TBA) test.
One of the secondary products of lipid oxidation is malonaldehyde, and this molecule can
react with TBA to form a pink-coloured complex with an absorption maximum of 530 nm.
This reaction is however not specific and other aldehydes may also react with TBA, forming
complexes with other absorption maximum. To emphasise the variety of products detected in
this test, the TBA value is often expressed as TBA reactive substances (TBARS) or as
malonaldehyde equivalents per kilogram sample (Gordon, 2001; Nawar, 1996; Shahidi &
Wanasundara, 2008).
Chromatographic Methods
Several different chromatographic techniques, including high-performance liquid
chromatography (HPLC) and gas chromatography (GC) can be used to detect oxidation
products in fats, oils and foods. These methods are based on separation and measurements of
relative quantities of different fractions, such as volatile compounds or individual substances
(Nawar, 1996). Coupling the chromatograph with mass spectrometry (MS) enables direct
characterisation of both primary and secondary oxidation products, with high sensitivity
(Shahidi & Wanasundara 2008). It has been shown that it is possible to compare sensory
evaluations and analysis using GC with high correlation (Min, 2000). These kinds of methods
requiring high-technological equipment are however not suited for routine quality assessment
of oils but for research purposes (Kristott, 2000).

24
Table 3.1: The ten vegetable oils included in the
accelerated stability tests.
3 Methods
The following sections contain the methodology used in this project. The chapter is divided in
two parts; Vegetable Oils and Spice Mixtures, each section being subdivided to enhance the
understanding of the arrangements of the different methods used.
3.1 Vegetable Oils
Nine different vegetable oils were chosen to be investigated as possible replacement to palm
oil as processing aid in the manufacturing of spice mixtures. Palm oil was also included in all
experiments as a reference. The ten oils included in this Master’s Thesis are presented in table
3.1.
Vegetable oils included in the stability tests
Palm oil
Rapeseed oil
Rapeseed oil + antioxidant
High oleic rapeseed oil
High oleic rapeseed oil + antioxidant
Sunflower oil
High oleic sunflower oil
Rapeseed + sunflower oil
Coconut oil
Shea stearin
The examined rapeseed oil is a Swedish product with good nutritional composition, as
described in section 2.3.3. The disadvantage with rapeseed oil is that it is not very stable due
to a high content of polyunsaturated fatty acids, therefore a more stable variety of rapeseed
oil, high oleic rapeseed oil was included in the tests. In order to investigate whether these oils
would be better preserved with the addition of an antioxidant, they were also tested with the
addition of a mixture of tocopherols and gallic acid. Gallic acid origins from leaves, fruits and
galls of several different plants (Reische et al., 2008).
Sunflower oil and high oleic sunflower oil were also part of the test, since sunflower oil is
nutritionally well balanced and has shown to be somewhat more stable compared to rapeseed
oil (Bringsarve, 2012). A mixture of rapeseed oil and sunflower oil is used in the
manufacturing of tortilla chips at Santa Maria AB, and this oil was also part of the test.
Coconut oil is a stable oil and in similarity with palm oil it is semi-solid at room temperature.
Shea stearin, a solid fraction of shea butter, was included with the intention to be mixed with
high oleic rapeseed oil to maintain a mixture with higher melting point. Due to that this
combination would require an extra mixing step performed in the spice factory, this
alternative was early being rejected. However, shea stearin was a part of the stability test
throughout the testing period.
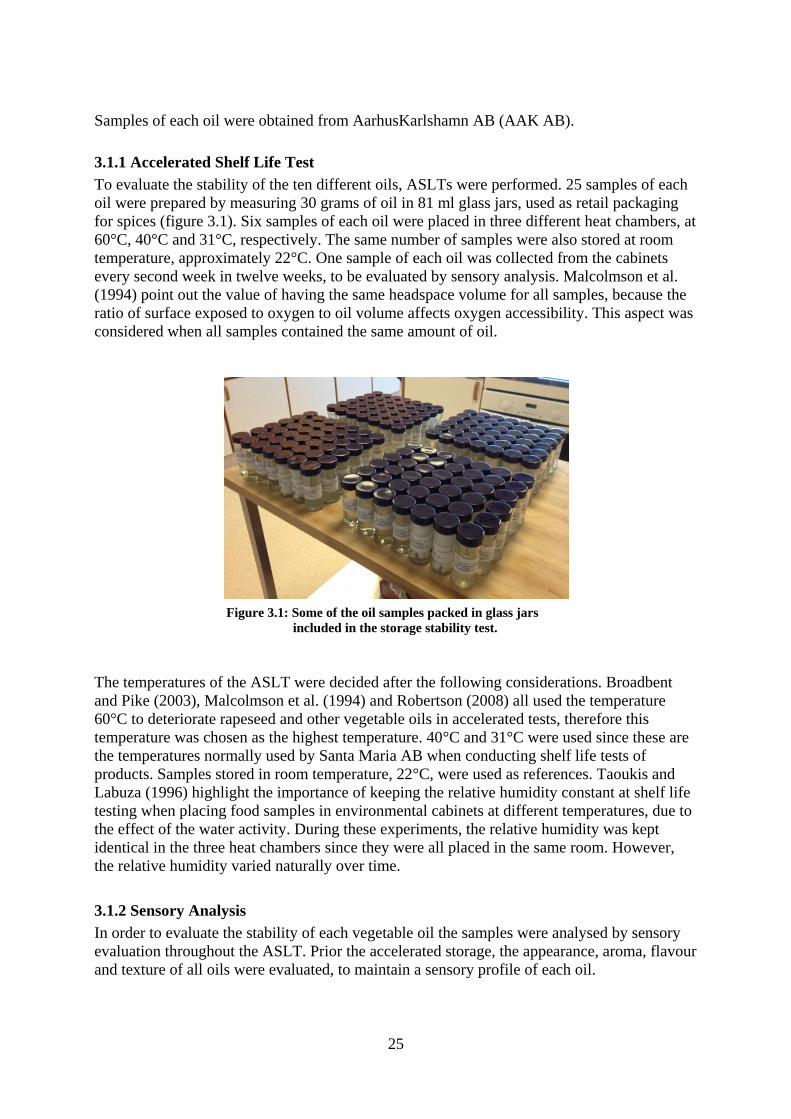
25
Figure 3.1: Some of the oil samples packed in glass jars
included in the storage stability test.
Samples of each oil were obtained from AarhusKarlshamn AB (AAK AB).
3.1.1 Accelerated Shelf Life Test
To evaluate the stability of the ten different oils, ASLTs were performed. 25 samples of each
oil were prepared by measuring 30 grams of oil in 81 ml glass jars, used as retail packaging
for spices (figure 3.1). Six samples of each oil were placed in three different heat chambers, at
60°C, 40°C and 31°C, respectively. The same number of samples were also stored at room
temperature, approximately 22°C. One sample of each oil was collected from the cabinets
every second week in twelve weeks, to be evaluated by sensory analysis. Malcolmson et al.
(1994) point out the value of having the same headspace volume for all samples, because the
ratio of surface exposed to oxygen to oil volume affects oxygen accessibility. This aspect was
considered when all samples contained the same amount of oil.
The temperatures of the ASLT were decided after the following considerations. Broadbent
and Pike (2003), Malcolmson et al. (1994) and Robertson (2008) all used the temperature
60°C to deteriorate rapeseed and other vegetable oils in accelerated tests, therefore this
temperature was chosen as the highest temperature. 40°C and 31°C were used since these are
the temperatures normally used by Santa Maria AB when conducting shelf life tests of
products. Samples stored in room temperature, 22°C, were used as references. Taoukis and
Labuza (1996) highlight the importance of keeping the relative humidity constant at shelf life
testing when placing food samples in environmental cabinets at different temperatures, due to
the effect of the water activity. During these experiments, the relative humidity was kept
identical in the three heat chambers since they were all placed in the same room. However,
the relative humidity varied naturally over time.
3.1.2 Sensory Analysis
In order to evaluate the stability of each vegetable oil the samples were analysed by sensory
evaluation throughout the ASLT. Prior the accelerated storage, the appearance, aroma, flavour
and texture of all oils were evaluated, to maintain a sensory profile of each oil.

26
Table 3.2: The discrete intensity scale used in the sensory analysis.
The sensory evaluation was performed by an internal panel at Santa Maria AB consisting of
mostly four assessors. Due to the numerous amounts of samples to be analysed, the sensory
evaluation was performed as a screening test evaluating the attributes of rancidity of each
sample, and not as a complete sensory profiling. The scale used was a discrete scale
consisting of five steps, described both by numbers and a descriptive text, as presented in
table 3.2.
1 None When you have the sample in your mouth you cannot perceive the
attribute at all
2 Weak You have to try hard to perceive and find the attribute, and when it is
there the intensity is weak
3 Distinct You perceive the attribute immediately when you have the sample in
your mouth and the intensity is distinct
4 Strong You perceive the attribute immediately and the intensity is strong
5 Very strong You perceive the attribute immediately and the intensity is very
strong
Before starting the evaluation, the assessor panel was trained to analyse other oil samples of
different intensity to declare which intensity corresponding to each step of the scale. This was
made for the properties of appearance, aroma and flavour, using different commercial oils,
including crude linseed oil and palm oil taken from the factory accelerated in 60°C for three
days. The sensory attributes obtained by evaluating these oils were listed and used as a basis
when performing the sensory evaluation of each oil sample. Attributes of aroma and flavour
were added with time when the character of the oils changed. The attributes obtained
throughout the sensory assessment are listed in table 3.3.
About one hour prior evaluation the samples of liquid oils were put in room temperature,
whereas shea stearin, coconut oil, and palm oil being solid at room temperature were put in
heat chamber. Samples of shea stearin were put in 60°C about one hour to become liquid,
whereas samples of coconut oil and palm oil were put in 40°C. About fifteen minutes prior
evaluation all samples were put in a water bath of 37°C and this temperature was kept
constant throughout the test session. Sometimes it was not possible to evaluate the samples in
connection to the collection from the heat chambers. At these occasions the samples were put
in refrigerator (4°C) until evaluation.
The assessment was performed in a well-ventilated room intended for taste testing at Santa
Maria AB, around a table. The attributes and the intensity of each sample were obtained after
discussion in the group of assessors, after each assessor had evaluated the product by
themselves before the discussion. To obtain results independent of each other, it is important
to get rid of the taste of a sample before testing the next (Lundgren, 1981). This was achieved
by drinking warmish water or sparkling water, and eating wheat wafers between each sample.

27
Table 3.3: The attributes perceived during the sensory analysis, with explanation to intensity.
Appearance
Yellow Range from light, almost transparent to very strong yellow colour
Opaque Range from transparent and clear via cloudy to opaque and white
Aroma
Cardboard Range from no aroma to very strong aroma of cardboard
Cereals Range from no aroma to very strong aroma of cereals
Citrus Range from no aroma to very strong aroma of citrus
Linseed oil Range from no aroma to very strong aroma of linseed oil
Maize Range from no aroma to very strong aroma of maize
Nutty Range from no aroma to very strong nutty aroma
Stearin Range from no aroma to very strong aroma of stearin
Flavour
Bitter Range from no flavour to very strong bitter flavour
Cardboard Range from no flavour to very strong flavour of cardboard
Cereals Range from no flavour to very strong flavour of cereals
Citrus Range from no flavour to very strong flavour of citrus
Linseed oil Range from no flavour to very strong flavour of linseed oil
Maize Range from no flavour to very strong flavour of maize
Nutty Range from no flavour to very strong nutty flavour
Stearin Range from no flavour to very strong flavour of stearin
The results of the attributes from the consensus sensory profiling of each oil were translated to
intensity of rancidity. Since studies have indicated that odour and flavour intensity scores of
sensory analysis are equally effective in depicting differences in rapeseed oil stability
(Malcolmson et al., 1994), the results of each oil were plotted as an average of the attributes
of both aroma and flavour versus time. Further, an Arrhenius plot was made for each oil to
maintain the activation energy as a measure of the temperature dependence of the oil.
3.1.3 Measurement of Peroxide Value and para-Anisidine Value
To compare the results of the extent of deterioration of vegetable oils performed by sensory
analysis with analytical measurements, samples of rapeseed oil and palm oil were analysed by
PV and AV. Samples of rapeseed oil and palm oil kept in refrigerator, and stored for two,
four, six and eight weeks at room temperature and 40°C, respectively, were sent to Aarhus
Karlshamn AB for analysis of PV using the AOCS Offical Method Cd 8b-90. The samples
kept in refrigerator and those stored eight weeks were also analysed by AV using the methods
IUPAC Method 2.504 and AOCS Official Method Cd 18-90.
28
3.2 Spice Mixtures
The following section includes presentation of the selected spice mixtures and the performed
methods for analysis.
3.2.1 Selected Spice Mixtures
Four different spice mixtures were chosen for the experiments in this project in order to
investigate if addition of different vegetable oils as processing aid had an influence on
separation, dusting and caking. The four spice mixtures were Barbeque Honey Seasoning,
Fajita Spice Mix, Italian Salad Seasoning and Taco Spice Mix. Each of these products was
chosen on different premises and because they have had shown different types of problems,
such as dusting and caking. All these four spice mixtures have a shelf life of three years and
should be stored in a cool and dry place. Below follows a description of the spice mixtures,
with ingredient declarations and sensory profiles described by internal product datasheets.
Barbeque Honey Seasoning
This is a barbeque seasoning with a rich flavour of honey, suitable to add to pork, chicken or
salmon at the end of barbequing. This product was chosen due to the relatively high content of
oil as a processing aid. The ingredients are salt, paprika, onion, sugar, garlic, tomato, yeast
extract, other spices, cayenne pepper, honey flavouring, chili pepper, citric acid, anti-caking
agent (E551), maltodextrin and smoke flavouring.
Sensory profile:
Appearance: Orange powder with red and black pieces.
Aroma: Star anise, onion and weak honey.
Flavour: Honey, chili, onion, star anise, salty and sweet with chili heat.
Texture: Flocculated spice mix of salt and larger particles.
Fajita Spice Mix
This is a seasoning mix for tortilla filling intended to be used with chicken to make a fajita. It
was selected due to earlier problems of caking. The ingredients are chili pepper, salt, onion,
sugar, cumin, garlic, oregano, lime extract, lemon powder, anti-caking agent (E551),
cinnamon, nutmeg, coriander leaf and flavour.
Sensory profile:
Appearance: Red powder with herb flakes and filaments.
Aroma: Citrus, smoky and herbaceous.
Flavour: Salt, citrus and herbaceous with medium heat.
Texture: Free-flowing, granular powder.
Italian Salad Seasoning
This salad seasoning has a flavour of Italian herbs and garlic and is suitable in salad dressings.
It was chosen as a test blend due to its tendency of caking and dusting. The ingredients are
salt, onion, dextrose, garlic, leek, other herbs, parsley, oregano and anti-caking agent (E551).
29
Sensory profile:
Appearance: Light green powder of herbs and salt.
Aroma: Herbaceous, aromatic and salt.
Flavour: Salt, onion, herbaceous, tarragon, sweet.
Texture: Fine powder of grinded herbs. Salt and herbs are slightly separated.
Taco Spice Mix
This spice mixture is a part of the Santa Maria Tex Mex concept, and is an important product
for the company. It is a product to be mixed with minced meat to make tortilla and taco
fillings. It was selected because it is an important and high selling product. Taco Spice Mix
contains dextrose, salt, onion, modified starch (potato), chili pepper, cumin, garlic, potato
fiber, oregano, paprika extract, flavour, anti-caking agent (E551), citric acid, maltodextrin and
yeast extract.
Sensory profile:
Appearance: Light orange-brown powder with slightly larger light orange flecks.
Aroma: Distinct cumin, chili powder and paprika.
Flavour: Very sweet, a bit sour taste of cumin, mild chili and garlic. Moderate
saltiness.
Texture: Homogenous, free-flowing powder.
3.2.2 Preparation of Spice Mixtures
In order to evaluate if different oils have an effect on caking, dusting and separation of the
four spice mixtures, the seasonings were mixed with three different oils. Rapeseed oil and
sunflower oil were chosen mainly due to the convenience of handling and low costs, and palm
oil was used as a reference. During the work with this Master’s Thesis it was found that the
spice plant of Santa Maria AB in Saue, Estonia, use rapeseed oil as processing aid in the spice
mixtures produced there (Tammel, 2012). This knowledge also made it interesting to include
rapeseed oil as a part of the oils tested in spice mixtures.
Three kilogrammes of each of the four seasonings were manually mixed to ensure that all
ingredients were treated in the same way. Each spice blend was divided into four parts, and
palm oil, rapeseed oil and sunflower oil was added to three of them, respectively. No oil was
added to the last part, to maintain samples functioning as references, to be able to separate
differences caused by the different oils and other factors such as the surrounding temperature
and relative humidity.
To make the accelerated storage trials as realistic as possible, the mixed spice blends were
packed in glass jars or in laminate bags. Barbeque Honey Seasoning and Italian Salad
Seasoning are commercially packed and retailed in glass jars, whereas Fajita Spice Mix and
Taco Spice Mix are sold in laminate bags. Hence these packaging materials were chosen for
each spice mixture, respectively. 40 grams of each seasoning was weighed and packed. The
Fajita Spice Mix and Taco Spice Mix were packed in laminate bags having a protective
barrier consisting of PE/EVOH/PE, sealed with a manual weld. The Barbeque Honey
Seasoning and Italian Salad Seasoning were packed in 81 ml glass jars sealed with a sprinkler
cap and a plastic lid.
To investigate the majority of the tested oils, they were mixed with a test mixture consisting
only of hygroscopic ingredients. 19.8 % each of the ingredients salt, sugar, onion powder,

30
tomato powder and yeast extract were mixed with 1 % oil. The test mixtures were packed in
laminate bags.
3.2.3 Accelerated Shelf Life Test
To accelerate the shelf life of the spice mixtures containing different oils, ASLT was used.
The four spice mixtures were put in heating chambers of 40°C and 60°C and room
temperature (22°C) as reference. The same temperatures as during the ASLT for the vegetable
oils were used, with the exception of 31°C, to reduce the number of samples and because this
temperature did not show any noteworthy acceleration of the oil samples. All samples,
including the ones packed in laminate bags, were stored standing to avoid pressure from the
weight of other bags if stored on top of each other.
All samples were evaluated after four and eight weeks in all temperatures, with the exception
of Taco Spice Mix being evaluated after two weeks instead of four at storage in 60°C. This
was due to that the seasoning started caking after only a few days in the high temperature, and
therefore was evaluated earlier. Barbeque Honey Seasoning and Italian Salad Seasoning were
additionally evaluated after two and six weeks at storage in 40°C. The reason for this was that
these spice mixtures was shown to be relatively agglomerated at the first evaluation, and it
was decided to perform two additional sample series.
The test mixture consisting of hygroscopic ingredients was stored in room temperature (22°C)
and at 40°C. The samples were evaluated after four and eight weeks.
3.2.4 Analysis of Angle of Repose
The method used to evaluate clump formation and flowability was angle of repose measured
by a fixed height cone. There are no general descriptions on how to perform the measures of
angle of repose. Geldart et al. (2006) have developed a piece of equipment in which the
powder is made to flow by a vibrator, letting the powder pour through a funnel forming a
semi-cone, whose height and average radius are easy to measure and from which the angle of
repose may be calculated or read from a table. The experimental setup used in this project,
shown in figure 3.1, is based on pouring the powder into a funnel held at a fixed height above
a flat base.

31
Figure 3.1: Experimental setup to enable measurement of
angle of repose of spice piles.
The vibrations necessary to make a cohesive powder pour through the funnel were obtained
by gently tapping on the top of the edges of the funnel. The pouring height used in this
Master’s Thesis was 15 cm, decided from the experiment of Ghazavi et al. (2008), measuring
the angle of repose of sand piles using three different pouring heights of 15, 25 and 35 cm.
The funnel used for the angle of repose analysis had a height of 7 cm. The diameter at the top
was 7 cm and the diameter at the bottom was 1.5 cm. The sample of 40 grams was poured in
the funnel while the end was blocked. The sample was poured through the funnel onto a
scoreboard, enabling read of radius. If the cohesiveness of the powder made tapping
necessary, the number of taps was counted. Each combination of spice mix, oil and storage
conditions were present twice, hence there were double samples. Each sample was poured
four times through the funnel, producing four different spice piles of one sample. Each pile
was photographed from above to enable estimation of the radius and twice from the side, as
shown in figure 3.2. Between each photograph, the pile was turned 90° in order to enable
estimation of four different angles equally distributed around the pile. The angle of repose
was measured using a protractor from the photographs taken, visualised in figure 3.3. If the
pile was not symmetrically formed, the initial angle of repose was measured. The grid was
used to read the height of each pile.
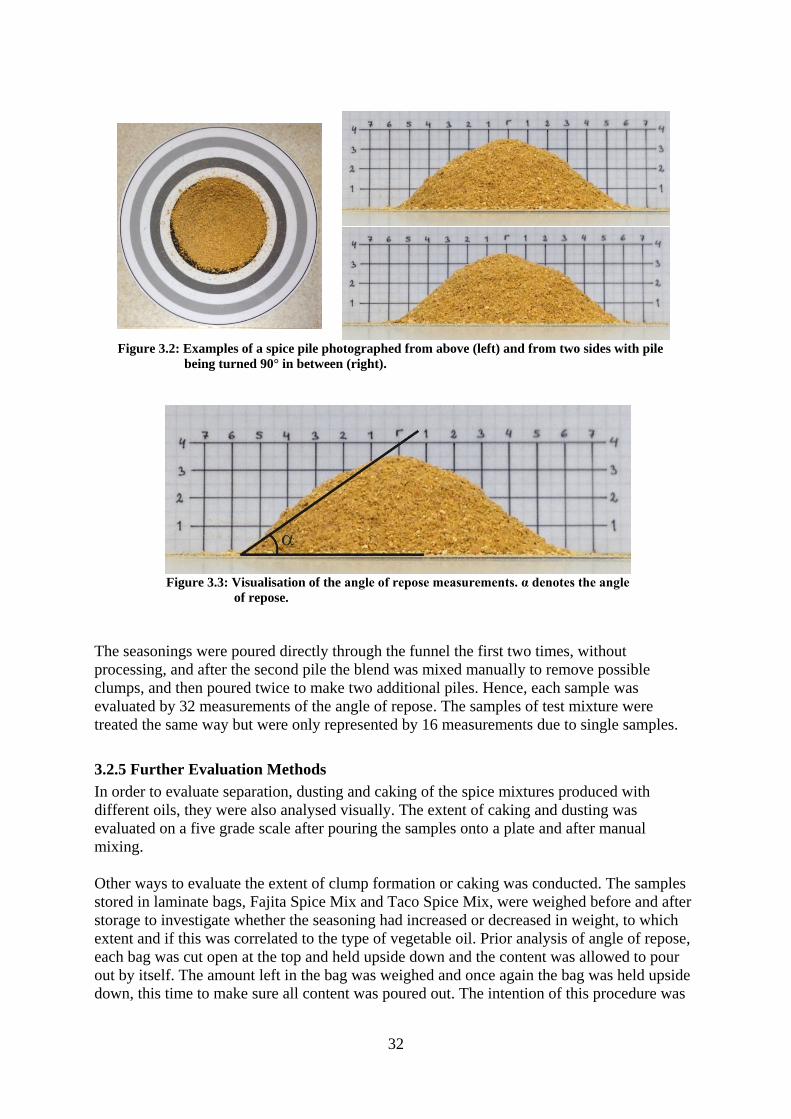
32
Figure 3.2: Examples of a spice pile photographed from above (left) and from two sides with pile
being turned 90° in between (right).
Figure 3.3: Visualisation of the angle of repose measurements. α denotes the angle
of repose.
The seasonings were poured directly through the funnel the first two times, without
processing, and after the second pile the blend was mixed manually to remove possible
clumps, and then poured twice to make two additional piles. Hence, each sample was
evaluated by 32 measurements of the angle of repose. The samples of test mixture were
treated the same way but were only represented by 16 measurements due to single samples.
3.2.5 Further Evaluation Methods
In order to evaluate separation, dusting and caking of the spice mixtures produced with
different oils, they were also analysed visually. The extent of caking and dusting was
evaluated on a five grade scale after pouring the samples onto a plate and after manual
mixing.
Other ways to evaluate the extent of clump formation or caking was conducted. The samples
stored in laminate bags, Fajita Spice Mix and Taco Spice Mix, were weighed before and after
storage to investigate whether the seasoning had increased or decreased in weight, to which
extent and if this was correlated to the type of vegetable oil. Prior analysis of angle of repose,
each bag was cut open at the top and held upside down and the content was allowed to pour
out by itself. The amount left in the bag was weighed and once again the bag was held upside
down, this time to make sure all content was poured out. The intention of this procedure was
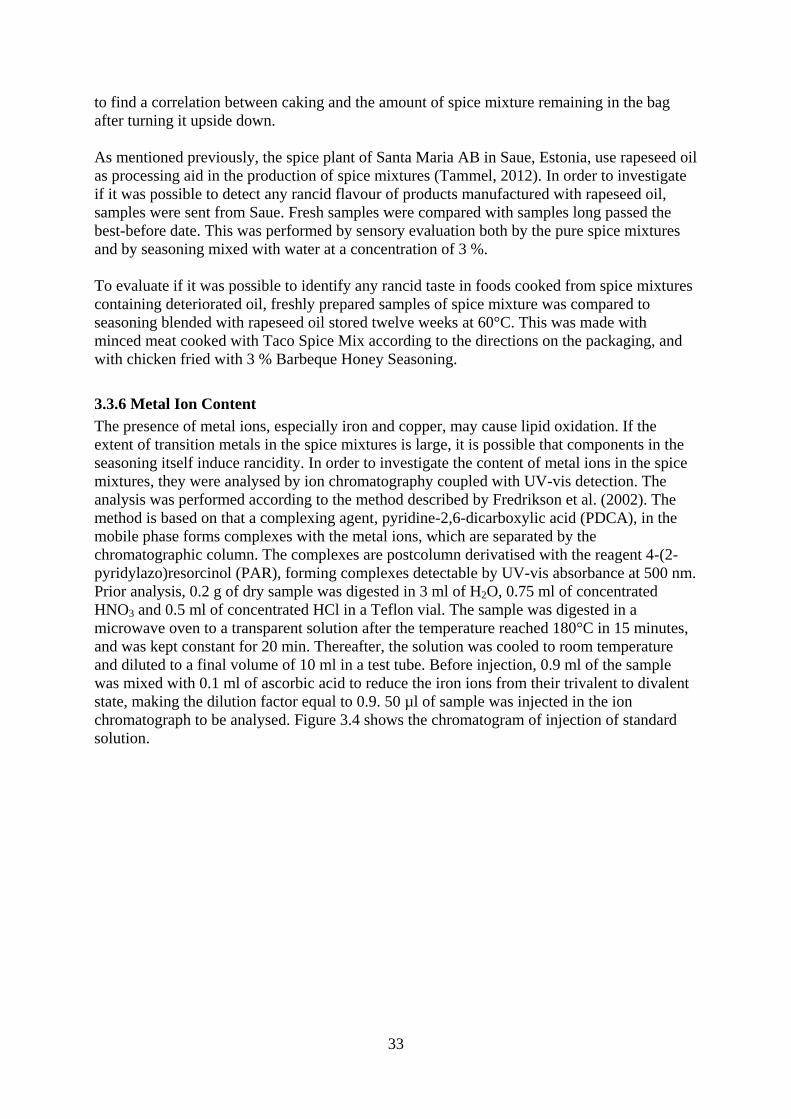
33
to find a correlation between caking and the amount of spice mixture remaining in the bag
after turning it upside down.
As mentioned previously, the spice plant of Santa Maria AB in Saue, Estonia, use rapeseed oil
as processing aid in the production of spice mixtures (Tammel, 2012). In order to investigate
if it was possible to detect any rancid flavour of products manufactured with rapeseed oil,
samples were sent from Saue. Fresh samples were compared with samples long passed the
best-before date. This was performed by sensory evaluation both by the pure spice mixtures
and by seasoning mixed with water at a concentration of 3 %.
To evaluate if it was possible to identify any rancid taste in foods cooked from spice mixtures
containing deteriorated oil, freshly prepared samples of spice mixture was compared to
seasoning blended with rapeseed oil stored twelve weeks at 60°C. This was made with
minced meat cooked with Taco Spice Mix according to the directions on the packaging, and
with chicken fried with 3 % Barbeque Honey Seasoning.
3.3.6 Metal Ion Content
The presence of metal ions, especially iron and copper, may cause lipid oxidation. If the
extent of transition metals in the spice mixtures is large, it is possible that components in the
seasoning itself induce rancidity. In order to investigate the content of metal ions in the spice
mixtures, they were analysed by ion chromatography coupled with UV-vis detection. The
analysis was performed according to the method described by Fredrikson et al. (2002). The
method is based on that a complexing agent, pyridine-2,6-dicarboxylic acid (PDCA), in the
mobile phase forms complexes with the metal ions, which are separated by the
chromatographic column. The complexes are postcolumn derivatised with the reagent 4-(2-
pyridylazo)resorcinol (PAR), forming complexes detectable by UV-vis absorbance at 500 nm.
Prior analysis, 0.2 g of dry sample was digested in 3 ml of H2O, 0.75 ml of concentrated
HNO3 and 0.5 ml of concentrated HCl in a Teflon vial. The sample was digested in a
microwave oven to a transparent solution after the temperature reached 180°C in 15 minutes,
and was kept constant for 20 min. Thereafter, the solution was cooled to room temperature
and diluted to a final volume of 10 ml in a test tube. Before injection, 0.9 ml of the sample
was mixed with 0.1 ml of ascorbic acid to reduce the iron ions from their trivalent to divalent
state, making the dilution factor equal to 0.9. 50 µl of sample was injected in the ion
chromatograph to be analysed. Figure 3.4 shows the chromatogram of injection of standard
solution.

34
Figure 3.4: Ion chromatogram of the standard solution showing the peaks corresponding to copper,
nickel, zinc, cobalt, manganese and iron at different and increasing retention times,
respectively.
The metal ion concentration is obtained from the area below the curve, and calculated
according to equation 3.1.
3.3.7 Test Run in Spice Plant
The experiments and evaluations of this Master’s Thesis resulted in the resolution that the
best alternative for palm oil used as processing aid would be rapeseed oil. To confirm this,
two full-scale test runs were performed in the spice plant. Two batches each of Taco Spice
Mix and Italian Salad Seasoning were produced, with rapeseed oil instead of palm oil as
processing aid. All ingredients were added as usual, with the only difference of rapeseed oil
being manually added instead of automatic addition of palm oil. After mixing for ten minutes,
the spice mixtures were packed in large sacks and stored upon retail packaging. Taco Spice
Mix and Italian Salad Seasoning were packed at consumer laminate bags and glass jars,
respectively. The test run made it possible to evaluate dusting and agglomeration in real
production scale.
35
Table 4.1: Sensory profile of all vegetable oils included in the stability test, performed on fresh samples before
storage, at liquid state.
4 Results and Discussion
This chapter contains the results obtained during this Master’s Thesis, as well as a discussion
of the outcomes. The chapter is mainly divided in the sections Vegetable Oils and Spice
Mixtures, with the result of each experiment presented separately. The first section contains
the most relevant and interesting results of each oil presented one by one, and at the end of the
section a more comparative and thorough discussion is given.
4.1 Vegetable Oils
To maintain a sensory profile of all vegetable oils included in the stability test, a sensory
evaluation was performed on fresh samples at liquid state of a testing temperature of 37°C.
The sensory profiles are listed in table 4.1, but due to that the texture of the oil is not relevant
for this project, this part of the sensory profile is excluded from the profile.
Sample Appearance Aroma Flavour
Palm oil Transparent,
yellow None None
Rapeseed oil Transparent,
slightly yellow None None
Rapeseed oil + antioxidant Transparent,
slightly yellow None None
High oleic rapeseed oil Transparent,
slightly yellow None None
High oleic rapeseed oil + antioxidant Transparent,
slightly yellow None None
Sunflower oil Transparent,
slightly yellow None None
High oleic sunflower oil Slightly opaque,
slightly yellow None None
Rapeseed + Sunflower oil Slightly opaque,
slightly yellow None None
Coconut oil Transparent None None
Shea stearin Transparent Weak cardboard
or stearin
Weak cardboard
or stearin
Almost all oils are odourless and flavourless, hence they are bland. The exception is shea
stearin, having a weak aroma and flavour of cardboard or stearin. The appearance of most oils
at liquid state are the same, being transparent and with a weak yellow colour. The exception is
palm oil, being more yellow due to relatively high amounts of carotenoids, and coconut oil
and shea stearin, lacking yellow colour. High oleic sunflower oil and the mixture of rapeseed
and sunflower oils are slightly opaque instead of transparent. This is due to that the waxes
naturally present in the oils are not removed during the refining processes (Bringsarve, 2012).
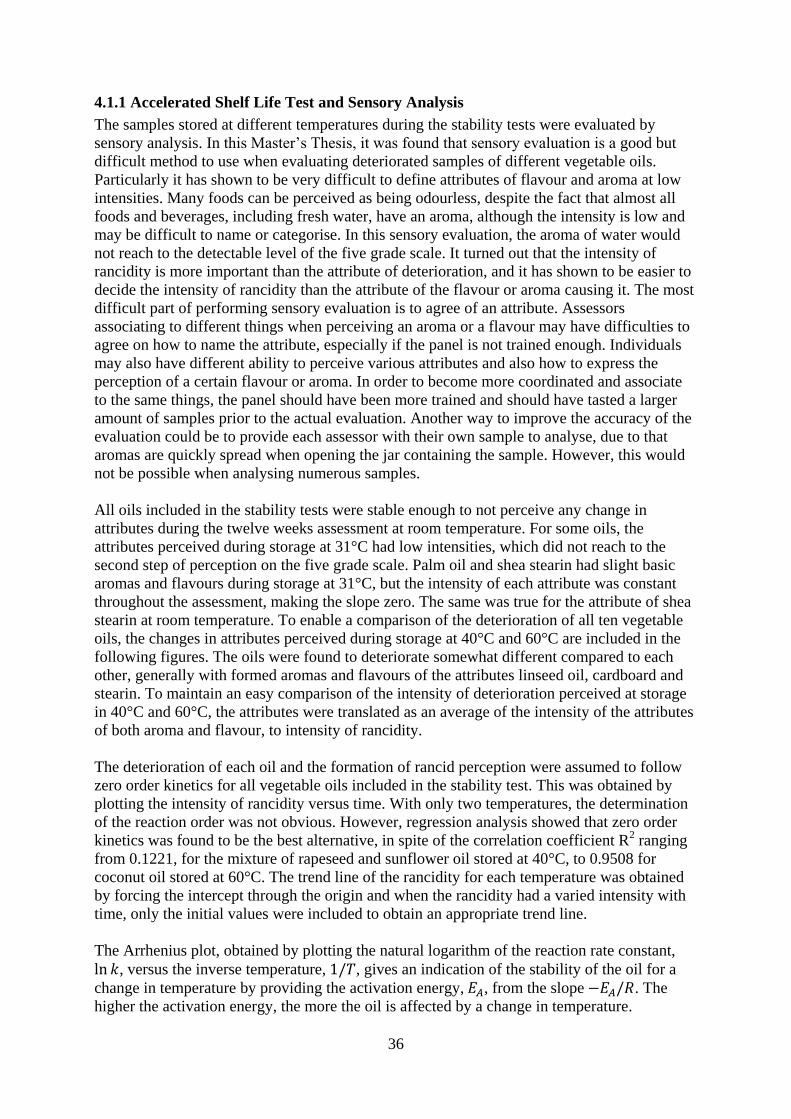
36
4.1.1 Accelerated Shelf Life Test and Sensory Analysis
The samples stored at different temperatures during the stability tests were evaluated by
sensory analysis. In this Master’s Thesis, it was found that sensory evaluation is a good but
difficult method to use when evaluating deteriorated samples of different vegetable oils.
Particularly it has shown to be very difficult to define attributes of flavour and aroma at low
intensities. Many foods can be perceived as being odourless, despite the fact that almost all
foods and beverages, including fresh water, have an aroma, although the intensity is low and
may be difficult to name or categorise. In this sensory evaluation, the aroma of water would
not reach to the detectable level of the five grade scale. It turned out that the intensity of
rancidity is more important than the attribute of deterioration, and it has shown to be easier to
decide the intensity of rancidity than the attribute of the flavour or aroma causing it. The most
difficult part of performing sensory evaluation is to agree of an attribute. Assessors
associating to different things when perceiving an aroma or a flavour may have difficulties to
agree on how to name the attribute, especially if the panel is not trained enough. Individuals
may also have different ability to perceive various attributes and also how to express the
perception of a certain flavour or aroma. In order to become more coordinated and associate
to the same things, the panel should have been more trained and should have tasted a larger
amount of samples prior to the actual evaluation. Another way to improve the accuracy of the
evaluation could be to provide each assessor with their own sample to analyse, due to that
aromas are quickly spread when opening the jar containing the sample. However, this would
not be possible when analysing numerous samples.
All oils included in the stability tests were stable enough to not perceive any change in
attributes during the twelve weeks assessment at room temperature. For some oils, the
attributes perceived during storage at 31°C had low intensities, which did not reach to the
second step of perception on the five grade scale. Palm oil and shea stearin had slight basic
aromas and flavours during storage at 31°C, but the intensity of each attribute was constant
throughout the assessment, making the slope zero. The same was true for the attribute of shea
stearin at room temperature. To enable a comparison of the deterioration of all ten vegetable
oils, the changes in attributes perceived during storage at 40°C and 60°C are included in the
following figures. The oils were found to deteriorate somewhat different compared to each
other, generally with formed aromas and flavours of the attributes linseed oil, cardboard and
stearin. To maintain an easy comparison of the intensity of deterioration perceived at storage
in 40°C and 60°C, the attributes were translated as an average of the intensity of the attributes
of both aroma and flavour, to intensity of rancidity.
The deterioration of each oil and the formation of rancid perception were assumed to follow
zero order kinetics for all vegetable oils included in the stability test. This was obtained by
plotting the intensity of rancidity versus time. With only two temperatures, the determination
of the reaction order was not obvious. However, regression analysis showed that zero order
kinetics was found to be the best alternative, in spite of the correlation coefficient R2 ranging
from 0.1221, for the mixture of rapeseed and sunflower oil stored at 40°C, to 0.9508 for
coconut oil stored at 60°C. The trend line of the rancidity for each temperature was obtained
by forcing the intercept through the origin and when the rancidity had a varied intensity with
time, only the initial values were included to obtain an appropriate trend line.
The Arrhenius plot, obtained by plotting the natural logarithm of the reaction rate constant,
, versus the inverse temperature, , gives an indication of the stability of the oil for a
change in temperature by providing the activation energy, , from the slope . The
higher the activation energy, the more the oil is affected by a change in temperature.

37
Figure 4.1: Palm oil stored twelve weeks at room temperature
(22°C), 31°C, 40°C and 60°C, from left to right,
respectively. Notice the appearance of the semi-solid
sample stored at room temperature.
The results from the accelerated shelf life tests and sensory evaluations performed to evaluate
the samples are presented below, separately for each oil. First, the appearance of the oil at
different temperatures during the ASLT is described, and if it was changed throughout the
session. The intensity of rancidity, with a discussion of which attributes being perceived as
rancid for each oil, is followed by visualisation of the Arrhenius plot. These results give an
indication of the temperature stability of the oil.
Palm oil
Palm oil is semi-solid at room temperature, hence completely opaque. The colour is slightly
yellow. At higher temperatures; 31°C, 40°C and 60°C, the oil is liquid and strongly yellow
without being opaque, as visualised in figure 4.1.
Palm oil has a bland aroma and flavour at room temperature. During storage at 31°C, it has a
slight aroma and flavour of cardboard. At 40°C the perception of cardboard is somewhat more
intense and the character changes to linseed oil after twelve weeks. At 60°C the rancidity has
the attribute of linseed oil, with the flavour also becoming fairly nutty at ten and twelve
weeks. The intensity of these attributes, translated to intensity of rancidity, plotted versus
time, and the equation of the trend line of the rancidity of each temperature, are shown in
figure 4.2.

38
Figure 4.2: The intensity of rancidity of palm oil plotted versus time. The equation of the trend line of each
data set can be seen in the figure, as well as the correlation coefficient R2 (left). Arrhenius plot of
palm oil (right).
Due to the fact that only two temperatures could be used to compose the Arrhenius plot, the
correlation of the data points is perfect. This does not demonstrate a good correlation with the
reality, but in contrast that an increased number of data points are necessary to obtain accurate
results. The Arrhenius plot in figure 4.2 enables calculation of the activation energy, , of
palm oil to 30 kJ/mol. Extrapolation of the slope of the graph to K-1
gives the natural
logarithm of the reaction rate constant of the rancidity reaction in room temperature.
Exponentiation of this term yields an approximation of the reaction rate constant at room
temperature to 0.0656 kJ/mol K. This reaction constant is about 4.0 times smaller compared
to the reaction constant of 60°C (0.2647 kJ/mol K), and 2.0 times less than the reaction rate
constant of 40°C (0.1325 kJ/mol K) (figure 4.2). This indicates that to reach the same level of
rancidity at room temperature as during storage at 60°C and 40°C, it would take four times
longer compared to 60°C and twice the time compared to storage at 40°C. Hence, perceiving
the rancidity of the same intensity at room temperature as in 60°C and 40°C in twelve weeks,
would take twelve months and six months, respectively.
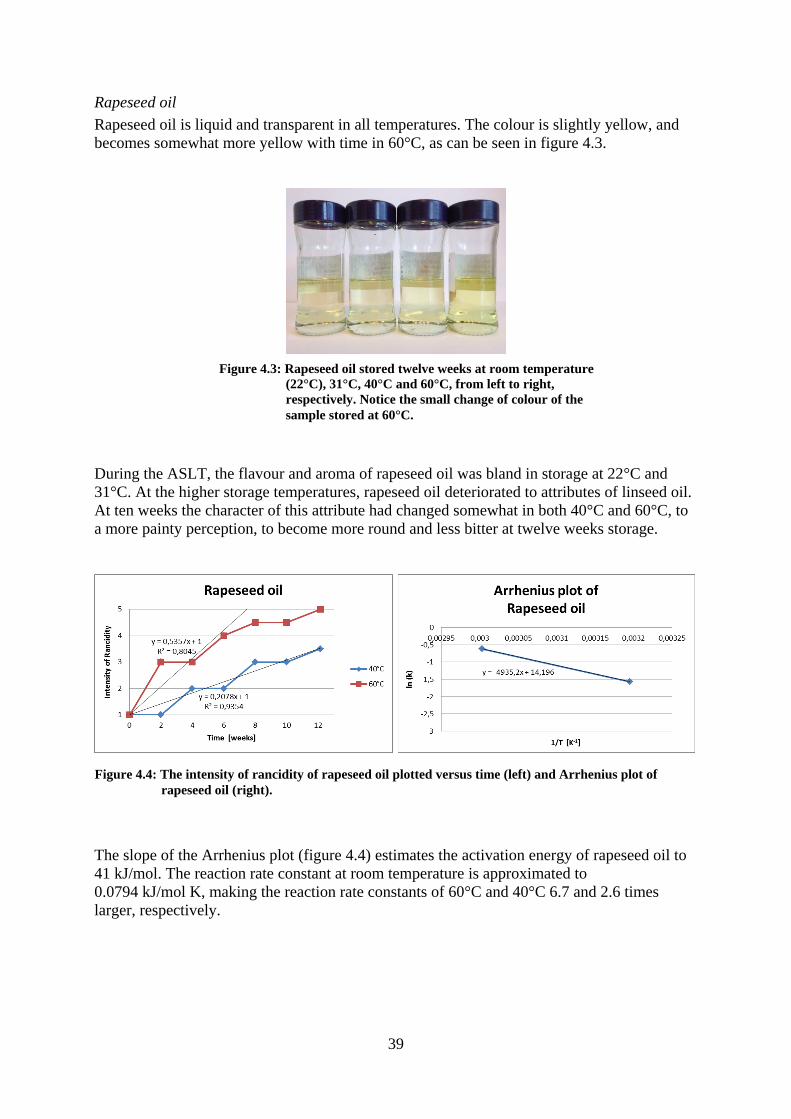
39
Figure 4.3: Rapeseed oil stored twelve weeks at room temperature
(22°C), 31°C, 40°C and 60°C, from left to right,
respectively. Notice the small change of colour of the
sample stored at 60°C.
Figure 4.4: The intensity of rancidity of rapeseed oil plotted versus time (left) and Arrhenius plot of
rapeseed oil (right).
Rapeseed oil
Rapeseed oil is liquid and transparent in all temperatures. The colour is slightly yellow, and
becomes somewhat more yellow with time in 60°C, as can be seen in figure 4.3.
During the ASLT, the flavour and aroma of rapeseed oil was bland in storage at 22°C and
31°C. At the higher storage temperatures, rapeseed oil deteriorated to attributes of linseed oil.
At ten weeks the character of this attribute had changed somewhat in both 40°C and 60°C, to
a more painty perception, to become more round and less bitter at twelve weeks storage.
The slope of the Arrhenius plot (figure 4.4) estimates the activation energy of rapeseed oil to
41 kJ/mol. The reaction rate constant at room temperature is approximated to
0.0794 kJ/mol K, making the reaction rate constants of 60°C and 40°C 6.7 and 2.6 times
larger, respectively.

40
Figure 4.5: Rapeseed oil with addition of antioxidant stored
twelve weeks at room temperature (22°C), 31°C,
40°C and 60°C, from left to right, respectively.
Figure 4.6: The intensity of rancidity of rapeseed oil with addition of antioxidant plotted versus time (left).
Arrhenius plot of rapeseed oil with addition of antioxidant (right).
Rapeseed oil + antioxidant
Rapeseed oil with addition of antioxidant is liquid in all temperatures. It is not opaque and has
slightly yellow colour (figure 4.5). During storage at 40°C and 60°C, the oil became more
yellow but at twelve weeks storage the colour had faded.
Rapeseed oil with addition of antioxidant has a bland aroma and flavour when stored twelve
weeks in room temperature. At storage in 31°C there are very weak intensities of citrus or
bloomy aroma, however not reaching to the second step of the intensity scale. During storage
at 40°C and 60°C, the deterioration has a slightly nutty perception before the attributes
changes to linseed oil. After six weeks storage at the highest temperature, the character of the
oil becomes more painty, to increase in intensity and become very sharp at ten weeks. At
twelve weeks the intensity of linseed oil had decreased considerably. This could be explained
by the complex reactions of compounds formed and decomposed during lipid oxidation.
The Arrhenius plot of rapeseed oil mixed with antioxidant (figure 4.6) enables approximation
of the activation energy of this oil to 46 kJ/mol. The reaction rate constant at room
temperature is calculated to 0.0633 kJ/mol K. The rate constants of 60°C and 40°C are 8.5
and 2.9 times greater, respectively.

41
Figure 4.7: High oleic rapeseed oil stored twelve weeks at room
temperature (22°C), 31°C, 40°C and 60°C, from left
to right, respectively.
Figure 4.8: The intensity of rancidity of high oleic rapeseed oil plotted versus time (left) and Arrhenius
plot of high oleic rapeseed oil (right).
High oleic rapeseed oil
High oleic rapeseed oil is liquid in all temperatures, it is transparent and slightly yellow, as
can be seen in figure 4.7.
The aroma and flavour of high oleic rapeseed oil is bland at twelve weeks storage in room
temperature and 31°C. During storage at 40°C, the oil deteriorates with some perception of
citrus flavour before the attribute of both aroma and flavour turns to linseed oil. At 60°C the
attribute of linseed oil has a somewhat bitter character.
The activation energy of high oleic rapeseed oil, obtained from the slope of the Arrhenius plot
in figure 4.8, is approximated to 75 kJ/mol. Extrapolation estimates the reaction rate constant
of 22°C to 0.0141 kJ/mol K. The reaction rate constants of 60°C and 40°C are 33 and 5.8
times larger compared to this value, respectively. The high activation energy indicates that
high oleic rapeseed oil is temperature dependent, which can be seen in the large difference
between the reaction rate constants at different temperatures.

42
Figure 4.10: The intensity of rancidity of high oleic rapeseed oil with addition of antioxidant plotted versus
time (left). Arrhenius plot of high oleic rapeseed oil with addition of antioxidant (right).
Figure 4.9: High oleic rapeseed oil with addition of antioxidant
stored twelve weeks at room temperature (22°C), 31°C,
40°C and 60°C, from left to right, respectively.
High oleic rapeseed oil + antioxidant
In conformity with the other rapeseed oils, high oleic rapeseed oil with addition of antioxidant
is transparent and liquid in all temperatures. The colour is slightly yellow (figure 4.9). During
storage at 60°C, the colour became more yellow with time, but the intensity had faded after
twelve weeks.
At room temperature and 31°C, high oleic rapeseed oil with addition of antioxidant has bland
aroma and flavour. At 40°C and 60°C the rancidity has the attribute of linseed oil for both
aroma and flavour. After eight weeks storage at 60°C the oil change character to become
more painty, still with the attribute of linseed oil.
From the Arrhenius plot (figure 4.10) the activation energy of high oleic rapeseed oil mixed
with antioxidant is estimated to 78 kJ/mol. The rate constant of the deterioration reaction
occurring in room temperature is approximated by extrapolation to 0.0131 kJ/mol K.
Compared to the reaction rate constants of 60°C and 40°C, this value is 38.3 and 6.3 times
smaller, respectively. The large difference in k-values and the high activation energy indicate
a high temperature dependence.

43
Figure 4.11: Sunflower oil stored twelve weeks at room
temperature (22°C), 31°C, 40°C and 60°C,
from left to right, respectively.
Figure 4.12: The intensity of rancidity of sunflower oil plotted versus time (left) and Arrhenius plot of
sunflower oil (right).
Sunflower oil
Sunflower oil is transparent and liquid in all temperatures and the colour is slightly yellow, as
can be seen in figure 4.11.
The flavour and aroma of sunflower oil is bland during storage at the lower temperatures. At
40°C the arising attributes are linseed oil and cardboard and at 60°C the linseed oil has a
slightly bitter and qualmy character.
The activation energy of sunflower oil is calculated to 44 kJ/mol from the Arrhenius relation
shown in figure 4.12. The reaction rate constants of 60°C and 40°C is approximated to 0.3929
kJ/mol K and 0.1429 kJ/mol K, respectively, being about 7.7 and 2.8 times greater than the
estimated reaction rate constant of 22°C approximated to 0.0511 kJ/mol K.
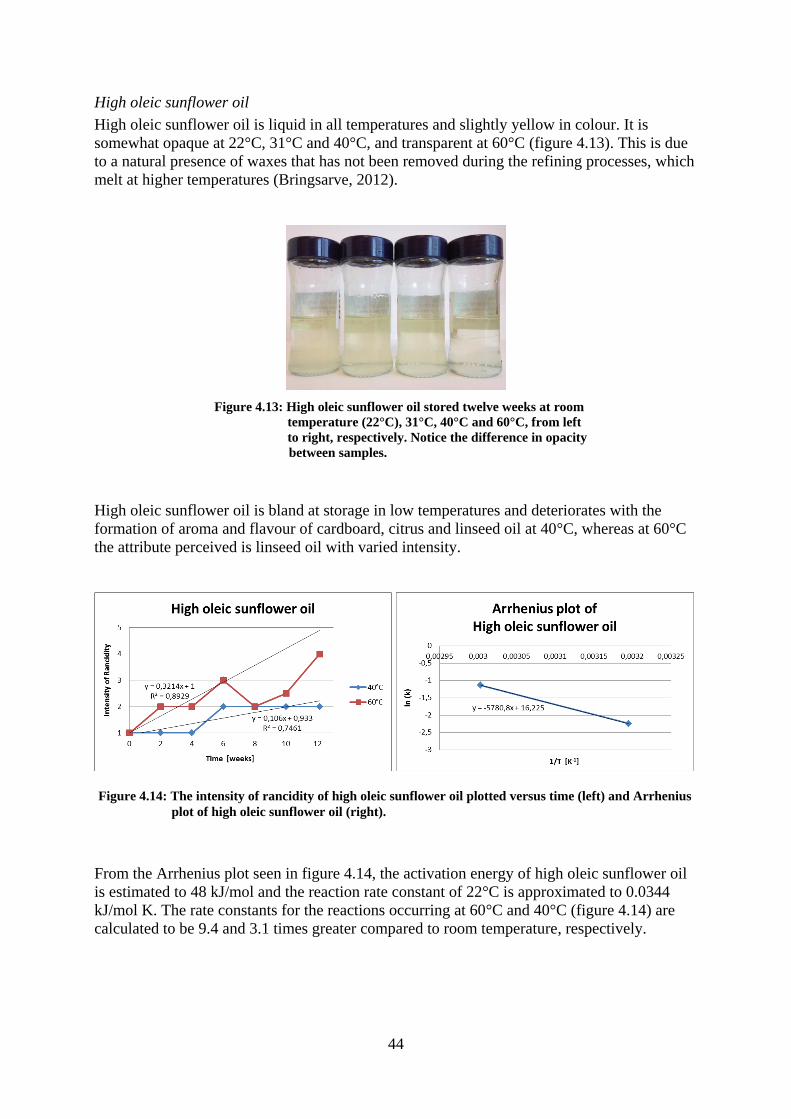
44
Figure 4.13: High oleic sunflower oil stored twelve weeks at room
temperature (22°C), 31°C, 40°C and 60°C, from left
to right, respectively. Notice the difference in opacity
between samples.
Figure 4.14: The intensity of rancidity of high oleic sunflower oil plotted versus time (left) and Arrhenius
plot of high oleic sunflower oil (right).
High oleic sunflower oil
High oleic sunflower oil is liquid in all temperatures and slightly yellow in colour. It is
somewhat opaque at 22°C, 31°C and 40°C, and transparent at 60°C (figure 4.13). This is due
to a natural presence of waxes that has not been removed during the refining processes, which
melt at higher temperatures (Bringsarve, 2012).
High oleic sunflower oil is bland at storage in low temperatures and deteriorates with the
formation of aroma and flavour of cardboard, citrus and linseed oil at 40°C, whereas at 60°C
the attribute perceived is linseed oil with varied intensity.
From the Arrhenius plot seen in figure 4.14, the activation energy of high oleic sunflower oil
is estimated to 48 kJ/mol and the reaction rate constant of 22°C is approximated to 0.0344
kJ/mol K. The rate constants for the reactions occurring at 60°C and 40°C (figure 4.14) are
calculated to be 9.4 and 3.1 times greater compared to room temperature, respectively.
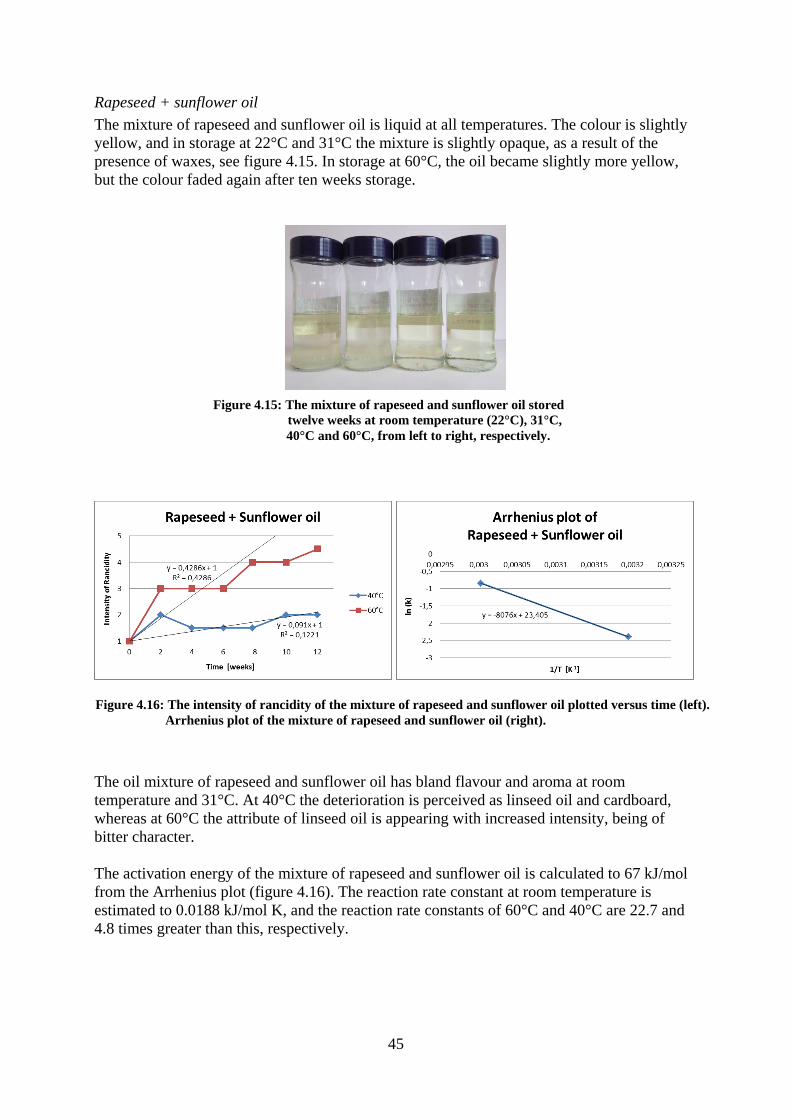
45
Figure 4.15: The mixture of rapeseed and sunflower oil stored
twelve weeks at room temperature (22°C), 31°C,
40°C and 60°C, from left to right, respectively.
Figure 4.16: The intensity of rancidity of the mixture of rapeseed and sunflower oil plotted versus time (left).
Arrhenius plot of the mixture of rapeseed and sunflower oil (right).
Rapeseed + sunflower oil
The mixture of rapeseed and sunflower oil is liquid at all temperatures. The colour is slightly
yellow, and in storage at 22°C and 31°C the mixture is slightly opaque, as a result of the
presence of waxes, see figure 4.15. In storage at 60°C, the oil became slightly more yellow,
but the colour faded again after ten weeks storage.
The oil mixture of rapeseed and sunflower oil has bland flavour and aroma at room
temperature and 31°C. At 40°C the deterioration is perceived as linseed oil and cardboard,
whereas at 60°C the attribute of linseed oil is appearing with increased intensity, being of
bitter character.
The activation energy of the mixture of rapeseed and sunflower oil is calculated to 67 kJ/mol
from the Arrhenius plot (figure 4.16). The reaction rate constant at room temperature is
estimated to 0.0188 kJ/mol K, and the reaction rate constants of 60°C and 40°C are 22.7 and
4.8 times greater than this, respectively.

46
Figure 4.18: The intensity of rancidity of coconut oil plotted versus time (left) and Arrhenius plot of coconut
oil (right).
Figure 4.17: Coconut oil stored twelve weeks at room temperature
(22°C), 31°C, 40°C and 60°C, from left to right,
respectively. Note the change of state between storage
at room temperature and 31°C.
Coconut oil
Coconut oil is semi-solid and strongly opaque at room temperature. During storage at 31°C,
40°C and 60°C, coconut oil is liquid and transparent, which is visualised in figure 4.17.
Coconut oil has a slight flavour and aroma of citrus during storage at the lower temperatures,
but the intensity does not reach the grade “weak” on the scale. In storage at 40°C and 60°C,
the perception of citrus is mixed with cardboard and linseed oil, to develop into only linseed
oil after eight weeks at 60°C.
The Arrhenius relation of coconut oil is plotted in figure 4.18. From the slope, the activation
energy of the oil is calculated to 23 kJ/mol. Extrapolation obtains an approximated value of
the reaction rate constant at room temperature to 0.0515 kJ/mol K. The values of the rate
constants for reactions in 60°C and 40°C are 2.9 and 1.7 times greater compared to this value,
respectively. The low activation energy indicates that lipid oxidation of coconut oil is not
influenced by temperature.
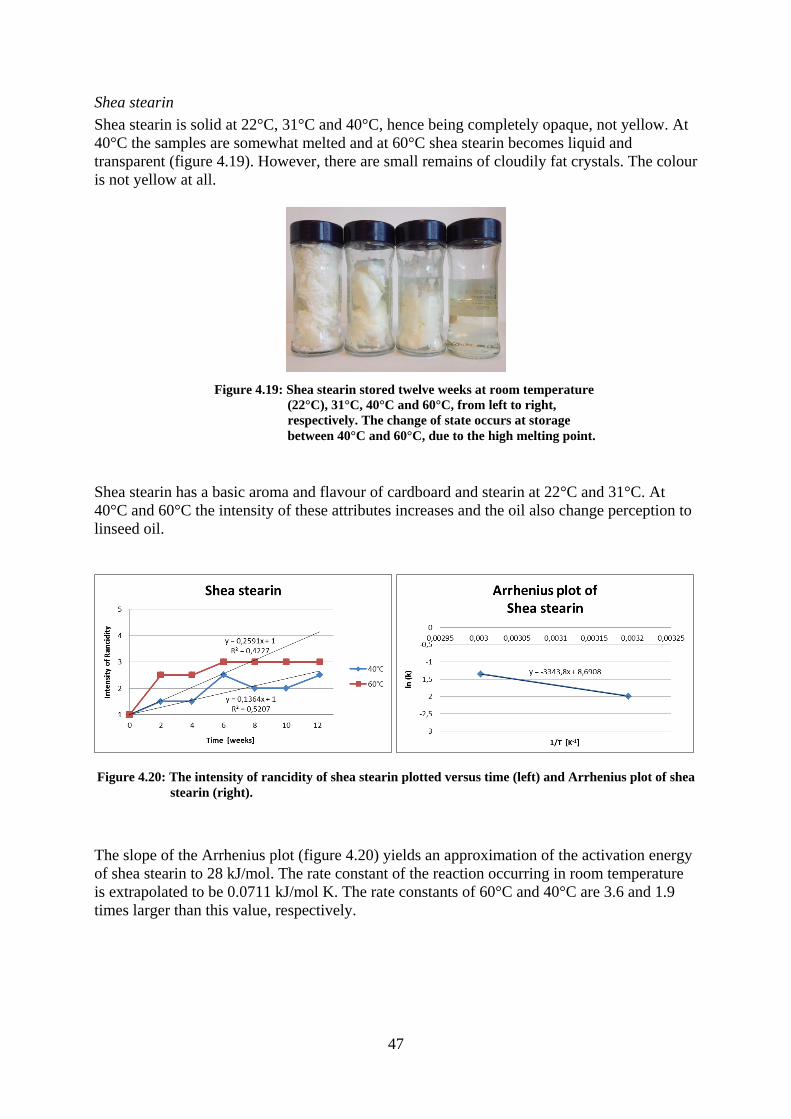
47
Figure 4.19: Shea stearin stored twelve weeks at room temperature
(22°C), 31°C, 40°C and 60°C, from left to right,
respectively. The change of state occurs at storage
between 40°C and 60°C, due to the high melting point.
Figure 4.20: The intensity of rancidity of shea stearin plotted versus time (left) and Arrhenius plot of shea
stearin (right).
Shea stearin
Shea stearin is solid at 22°C, 31°C and 40°C, hence being completely opaque, not yellow. At
40°C the samples are somewhat melted and at 60°C shea stearin becomes liquid and
transparent (figure 4.19). However, there are small remains of cloudily fat crystals. The colour
is not yellow at all.
Shea stearin has a basic aroma and flavour of cardboard and stearin at 22°C and 31°C. At
40°C and 60°C the intensity of these attributes increases and the oil also change perception to
linseed oil.
The slope of the Arrhenius plot (figure 4.20) yields an approximation of the activation energy
of shea stearin to 28 kJ/mol. The rate constant of the reaction occurring in room temperature
is extrapolated to be 0.0711 kJ/mol K. The rate constants of 60°C and 40°C are 3.6 and 1.9
times larger than this value, respectively.
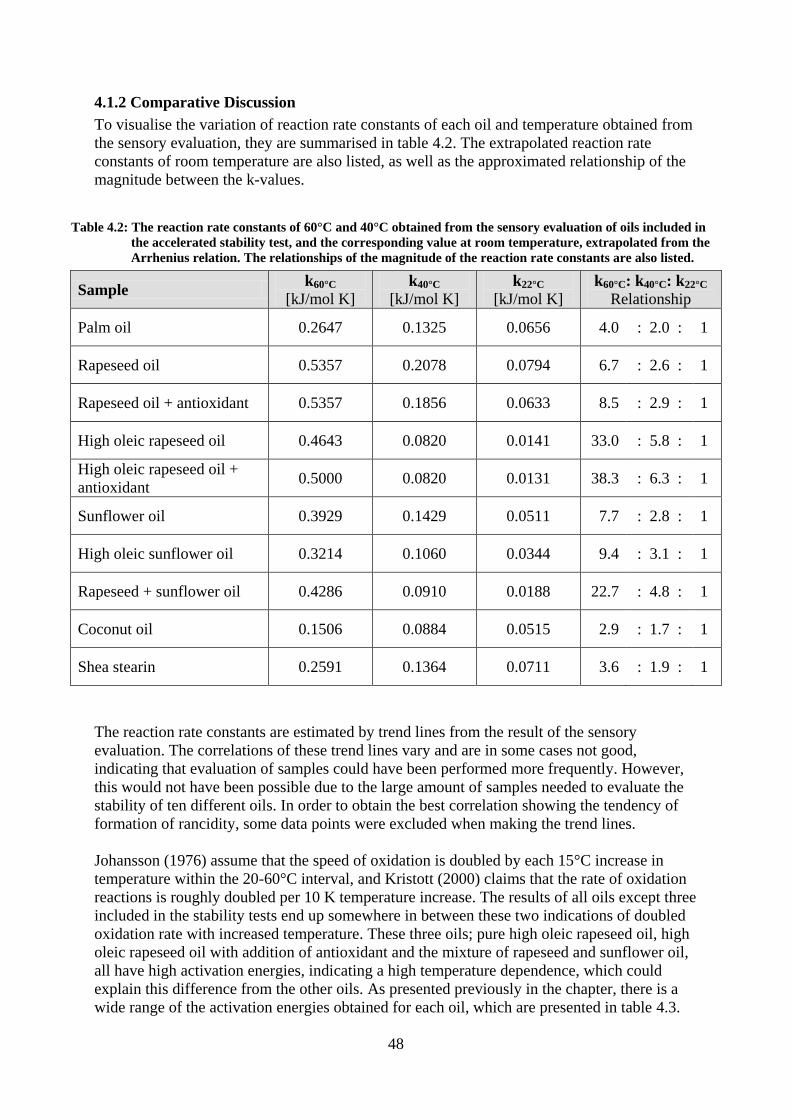
48
Table 4.2: The reaction rate constants of 60°C and 40°C obtained from the sensory evaluation of oils included in
the accelerated stability test, and the corresponding value at room temperature, extrapolated from the
Arrhenius relation. The relationships of the magnitude of the reaction rate constants are also listed.
4.1.2 Comparative Discussion
To visualise the variation of reaction rate constants of each oil and temperature obtained from
the sensory evaluation, they are summarised in table 4.2. The extrapolated reaction rate
constants of room temperature are also listed, as well as the approximated relationship of the
magnitude between the k-values.
Sample k60°C
[kJ/mol K]
k40°C
[kJ/mol K]
k22°C
[kJ/mol K]
k60°C: k40°C: k22°C
Relationship
Palm oil 0.2647 0.1325 0.0656 4.0 : 2.0 : 1
Rapeseed oil 0.5357 0.2078 0.0794 6.7 : 2.6 : 1
Rapeseed oil + antioxidant 0.5357 0.1856 0.0633 8.5 : 2.9 : 1
High oleic rapeseed oil 0.4643 0.0820 0.0141 33.0 : 5.8 : 1
High oleic rapeseed oil +
antioxidant 0.5000 0.0820 0.0131 38.3 : 6.3 : 1
Sunflower oil 0.3929 0.1429 0.0511 7.7 : 2.8 : 1
High oleic sunflower oil 0.3214 0.1060 0.0344 9.4 : 3.1 : 1
Rapeseed + sunflower oil 0.4286 0.0910 0.0188 22.7 : 4.8 : 1
Coconut oil 0.1506 0.0884 0.0515 2.9 : 1.7 : 1
Shea stearin 0.2591 0.1364 0.0711 3.6 : 1.9 : 1
The reaction rate constants are estimated by trend lines from the result of the sensory
evaluation. The correlations of these trend lines vary and are in some cases not good,
indicating that evaluation of samples could have been performed more frequently. However,
this would not have been possible due to the large amount of samples needed to evaluate the
stability of ten different oils. In order to obtain the best correlation showing the tendency of
formation of rancidity, some data points were excluded when making the trend lines.
Johansson (1976) assume that the speed of oxidation is doubled by each 15°C increase in
temperature within the 20-60°C interval, and Kristott (2000) claims that the rate of oxidation
reactions is roughly doubled per 10 K temperature increase. The results of all oils except three
included in the stability tests end up somewhere in between these two indications of doubled
oxidation rate with increased temperature. These three oils; pure high oleic rapeseed oil, high
oleic rapeseed oil with addition of antioxidant and the mixture of rapeseed and sunflower oil,
all have high activation energies, indicating a high temperature dependence, which could
explain this difference from the other oils. As presented previously in the chapter, there is a
wide range of the activation energies obtained for each oil, which are presented in table 4.3.

49
Table 4.3: List of the activation energies for each vegetable
oil, calculated from the corresponding Arrhenius
plots.
Sample EA [kJ/mol]
Palm oil 30
Rapeseed oil 41
Rapeseed oil + antioxidant 46
High oleic rapeseed oil 75
High oleic rapeseed oil + antioxidant 78
Sunflower oil 44
High oleic sunflower oil 48
Rapeseed + sunflower oil 67
Coconut oil 23
Shea stearin 28
The wide range of activation energies can be explained by that they are based on the reaction
rate constants of the temperatures included in the stability test. If there is a large difference
between the rate constants of the two temperatures, the slope of the Arrhenius plot is large,
making the activation energy of the oil high. This is an indication that the oil is temperature
dependent, and that elevated temperature is demanded to increase the rate of the deterioration
of the oil. If the difference of the reaction rate constants of 60°C and 40°C is small, the slope
of the Arrhenius plot is small, hence the estimation of the activation energy is small. As
previously mentioned, pure high oleic rapeseed oil, high oleic rapeseed oil with addition of
antioxidant and the mixture of rapeseed and sunflower oil have high activation energies, as
can be seen in table 4.3. The reason for this is that the intensity of rancidity increases much
more during storage at 60°C compared to at 40°C, and this indicates that these oils are
temperature dependent, hence highly affected by a change in temperature. This explains the
wide range in relationship of reaction rate constants (table 4.2), when an increase from room
temperature to 60°C significantly influence the deterioration of the oil and formation of
rancidity.
The intensity of rancidity varies among the different vegetable oils tested. The main reason
for this is that the fatty acid composition varies between the different oils. Coconut oil and
shea stearin, having a very high amount of saturated fatty acids (see table 2.3) were expected
to be stable against rancidity. Also palm oil, consisting of mainly saturated fatty acids, was
expected to be relatively stable. When comparing the results of the sensory evaluation
performed for each oil included in the accelerated stability test, coconut oil, shea stearin and
palm oil were shown to have the least degree of rancidity and also among the smallest
reaction rate constants of 60°C and 40°C (table 4.2). This results in that these three oils have
low activation energies (table 4.3), indicating that an increase in storage temperature does not
affect the deterioration of the oil. Rapeseed oil was shown to be the least stable oil with the
highest perception of rancidity in both 60°C and 40°C, and considering the fatty acid
composition of almost exclusively unsaturated fatty acids with a high amount of
polyunsaturated fatty acids, this was expected. The rapeseed oil with addition of antioxidant
showed similar deterioration at 60°C compared to pure rapeseed oil, but had somewhat less
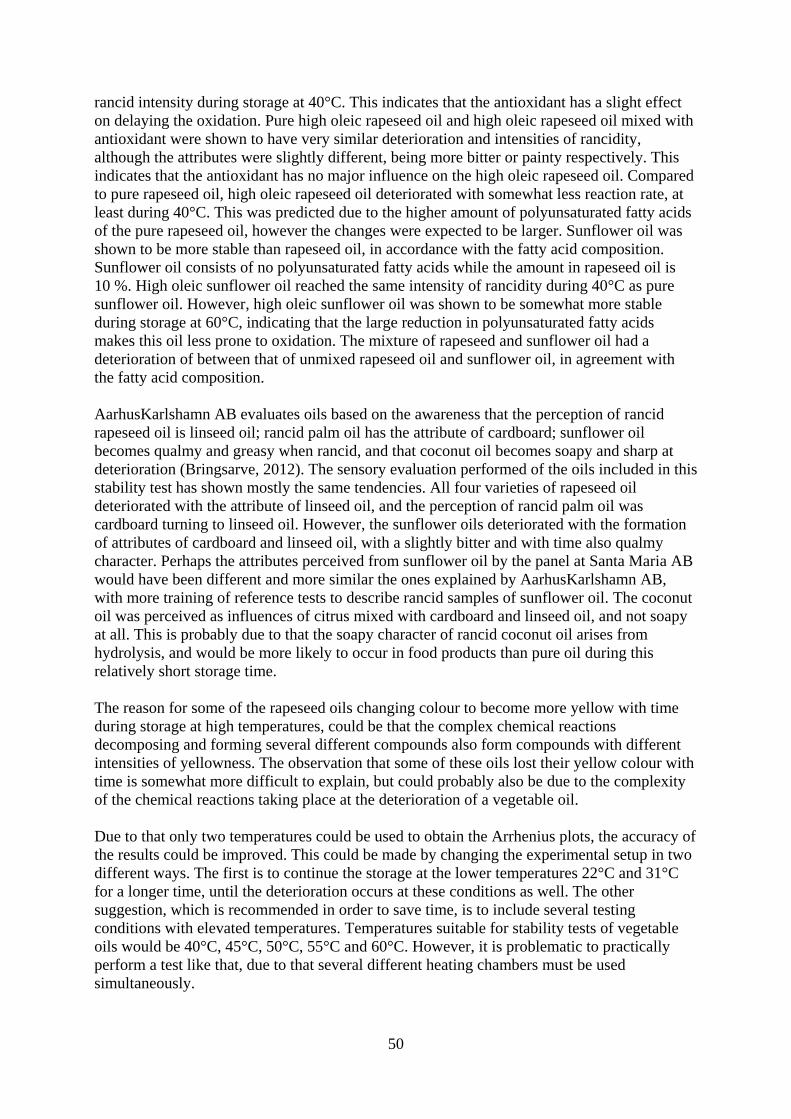
50
rancid intensity during storage at 40°C. This indicates that the antioxidant has a slight effect
on delaying the oxidation. Pure high oleic rapeseed oil and high oleic rapeseed oil mixed with
antioxidant were shown to have very similar deterioration and intensities of rancidity,
although the attributes were slightly different, being more bitter or painty respectively. This
indicates that the antioxidant has no major influence on the high oleic rapeseed oil. Compared
to pure rapeseed oil, high oleic rapeseed oil deteriorated with somewhat less reaction rate, at
least during 40°C. This was predicted due to the higher amount of polyunsaturated fatty acids
of the pure rapeseed oil, however the changes were expected to be larger. Sunflower oil was
shown to be more stable than rapeseed oil, in accordance with the fatty acid composition.
Sunflower oil consists of no polyunsaturated fatty acids while the amount in rapeseed oil is
10 %. High oleic sunflower oil reached the same intensity of rancidity during 40°C as pure
sunflower oil. However, high oleic sunflower oil was shown to be somewhat more stable
during storage at 60°C, indicating that the large reduction in polyunsaturated fatty acids
makes this oil less prone to oxidation. The mixture of rapeseed and sunflower oil had a
deterioration of between that of unmixed rapeseed oil and sunflower oil, in agreement with
the fatty acid composition.
AarhusKarlshamn AB evaluates oils based on the awareness that the perception of rancid
rapeseed oil is linseed oil; rancid palm oil has the attribute of cardboard; sunflower oil
becomes qualmy and greasy when rancid, and that coconut oil becomes soapy and sharp at
deterioration (Bringsarve, 2012). The sensory evaluation performed of the oils included in this
stability test has shown mostly the same tendencies. All four varieties of rapeseed oil
deteriorated with the attribute of linseed oil, and the perception of rancid palm oil was
cardboard turning to linseed oil. However, the sunflower oils deteriorated with the formation
of attributes of cardboard and linseed oil, with a slightly bitter and with time also qualmy
character. Perhaps the attributes perceived from sunflower oil by the panel at Santa Maria AB
would have been different and more similar the ones explained by AarhusKarlshamn AB,
with more training of reference tests to describe rancid samples of sunflower oil. The coconut
oil was perceived as influences of citrus mixed with cardboard and linseed oil, and not soapy
at all. This is probably due to that the soapy character of rancid coconut oil arises from
hydrolysis, and would be more likely to occur in food products than pure oil during this
relatively short storage time.
The reason for some of the rapeseed oils changing colour to become more yellow with time
during storage at high temperatures, could be that the complex chemical reactions
decomposing and forming several different compounds also form compounds with different
intensities of yellowness. The observation that some of these oils lost their yellow colour with
time is somewhat more difficult to explain, but could probably also be due to the complexity
of the chemical reactions taking place at the deterioration of a vegetable oil.
Due to that only two temperatures could be used to obtain the Arrhenius plots, the accuracy of
the results could be improved. This could be made by changing the experimental setup in two
different ways. The first is to continue the storage at the lower temperatures 22°C and 31°C
for a longer time, until the deterioration occurs at these conditions as well. The other
suggestion, which is recommended in order to save time, is to include several testing
conditions with elevated temperatures. Temperatures suitable for stability tests of vegetable
oils would be 40°C, 45°C, 50°C, 55°C and 60°C. However, it is problematic to practically
perform a test like that, due to that several different heating chambers must be used
simultaneously.
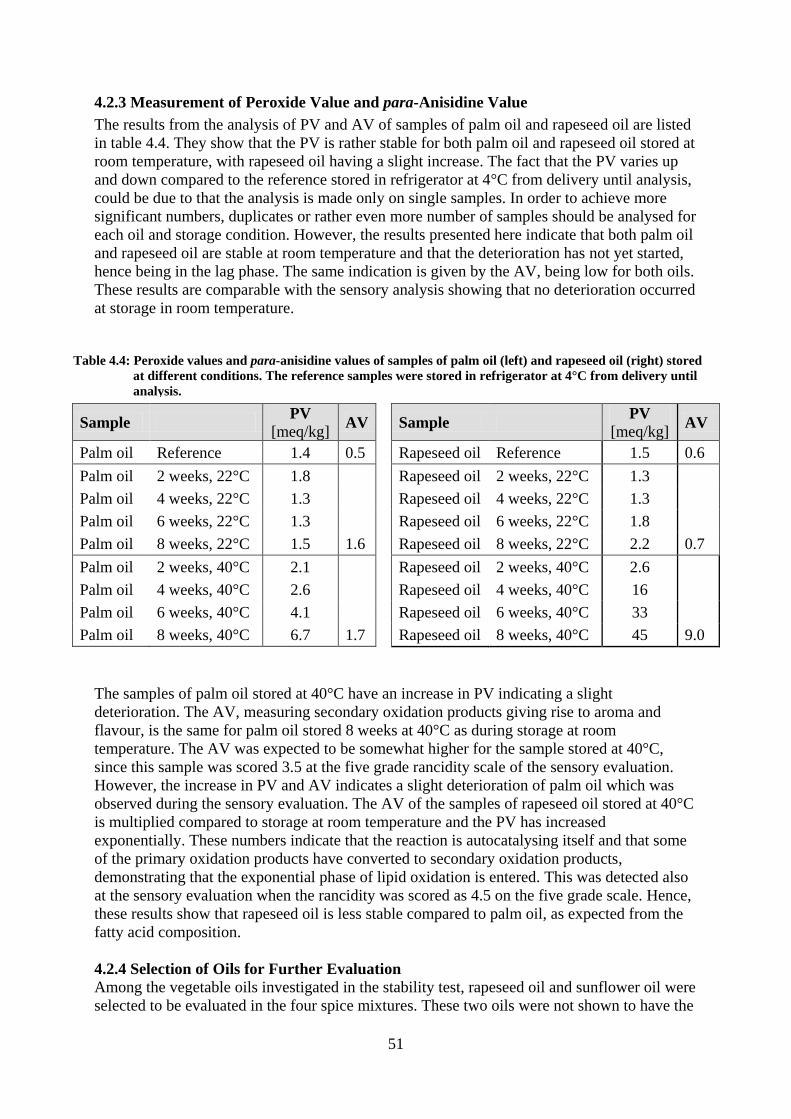
51
Table 4.4: Peroxide values and para-anisidine values of samples of palm oil (left) and rapeseed oil (right) stored
at different conditions. The reference samples were stored in refrigerator at 4°C from delivery until
analysis.
4.2.3 Measurement of Peroxide Value and para-Anisidine Value
The results from the analysis of PV and AV of samples of palm oil and rapeseed oil are listed
in table 4.4. They show that the PV is rather stable for both palm oil and rapeseed oil stored at
room temperature, with rapeseed oil having a slight increase. The fact that the PV varies up
and down compared to the reference stored in refrigerator at 4°C from delivery until analysis,
could be due to that the analysis is made only on single samples. In order to achieve more
significant numbers, duplicates or rather even more number of samples should be analysed for
each oil and storage condition. However, the results presented here indicate that both palm oil
and rapeseed oil are stable at room temperature and that the deterioration has not yet started,
hence being in the lag phase. The same indication is given by the AV, being low for both oils.
These results are comparable with the sensory analysis showing that no deterioration occurred
at storage in room temperature.
Sample PV
[meq/kg] AV Sample
PV
[meq/kg] AV
Palm oil Reference 1.4 0.5 Rapeseed oil Reference 1.5 0.6
Palm oil 2 weeks, 22°C 1.8 Rapeseed oil 2 weeks, 22°C 1.3
Palm oil 4 weeks, 22°C 1.3 Rapeseed oil 4 weeks, 22°C 1.3
Palm oil 6 weeks, 22°C 1.3 Rapeseed oil 6 weeks, 22°C 1.8
Palm oil 8 weeks, 22°C 1.5 1.6 Rapeseed oil 8 weeks, 22°C 2.2 0.7
Palm oil 2 weeks, 40°C 2.1 Rapeseed oil 2 weeks, 40°C 2.6
Palm oil 4 weeks, 40°C 2.6 Rapeseed oil 4 weeks, 40°C 16
Palm oil 6 weeks, 40°C 4.1 Rapeseed oil 6 weeks, 40°C 33
Palm oil 8 weeks, 40°C 6.7 1.7 Rapeseed oil 8 weeks, 40°C 45 9.0
The samples of palm oil stored at 40°C have an increase in PV indicating a slight
deterioration. The AV, measuring secondary oxidation products giving rise to aroma and
flavour, is the same for palm oil stored 8 weeks at 40°C as during storage at room
temperature. The AV was expected to be somewhat higher for the sample stored at 40°C,
since this sample was scored 3.5 at the five grade rancidity scale of the sensory evaluation.
However, the increase in PV and AV indicates a slight deterioration of palm oil which was
observed during the sensory evaluation. The AV of the samples of rapeseed oil stored at 40°C
is multiplied compared to storage at room temperature and the PV has increased
exponentially. These numbers indicate that the reaction is autocatalysing itself and that some
of the primary oxidation products have converted to secondary oxidation products,
demonstrating that the exponential phase of lipid oxidation is entered. This was detected also
at the sensory evaluation when the rancidity was scored as 4.5 on the five grade scale. Hence,
these results show that rapeseed oil is less stable compared to palm oil, as expected from the
fatty acid composition.
4.2.4 Selection of Oils for Further Evaluation
Among the vegetable oils investigated in the stability test, rapeseed oil and sunflower oil were
selected to be evaluated in the four spice mixtures. These two oils were not shown to have the

52
best temperature stability, therefore they are best to be used at low temperatures. Spice
mixtures produced at Santa Maria AB are intended to be stored in a cool and dry place, not
above room temperature, hence it was concluded that there is no need for use of a high
stability oil as processing aid when manufacturing spice mixtures. This statement was
additionally substantiated when it was found that the spice factory of Santa Maria AB in Saue,
Estonia, use rapeseed oil as processing aid in the spice mixtures produced there. Another
aspect of selecting proper oil as replacement for palm oil is that it might be better to have an
oil being liquid at room temperature. There is a risk that the heat treatment of palm oil in the
production process induces some deterioration of the oil prior the addition to the spice
mixtures. The elevated temperature could also affect the ingredients in the spice mixture in a
negative way, for example by affecting the components of biological origin being responsible
for colour and flavour.
Rapeseed oil and sunflower oil were also selected due to their low price and easy handling.
Due to that the oil used as processing aid are consumed in relatively small amounts, it is
important that the oil can be delivered in small quantities with short intervals. Sunflower oil
and rapeseed oil can be provided in several different amounts (Blomdahl, 2012).
4.3 Spice Mixtures
The four different spice mixtures produced with and without addition of oil are shown in
figure 4.21. The effect of adding oil in the production process is clear when looking at Honey
Barbeque Seasoning. No difference in appearance of samples containing the three different
oils could be detected for any of the seasonings.
Figure 4.21: Barbeque Honey Seasoning, Fajita Spice Mix, Italian Salad Seasoning and Taco Spice Mix
without addition of oil (above) and with oil added (below).
Evaluation of the spice mixture samples stored at 60°C during eight weeks showed that
various seasonings react differently to high temperatures and that the temperature was too
high when evaluating spices. All four spice mixtures became very dry and dark during
storage, as can be seen in figure 4.22.

53
Figure 4.22: Barbeque Honey Seasoning, Fajita Spice Mix, Italian Salad Seasoning and Taco Spice Mix
stored eight weeks at 60°C.
The samples of Barbeque Honey Seasoning were agglomerated and caked. The colour of the
seasoning was very dark and brown, compared to samples stored at lower temperatures. The
flavour had lost character to taste salt and stale honey with growing heat. The samples of
Fajita Spice Mix had not changed much compared to samples stored at lower temperatures.
The red colour and lustre was lost, but there were no agglomeration or caking. The flavour
was salt and somewhat sweet with growing heat. The samples of Italian Salad Seasoning were
similar to those of Barbeque Honey Seasoning in agglomeration and caking. The colour was
darker and more brown compared to storage at low temperatures and the flavour had changed
to taste almost only of salt, with no more than tendencies of herbs and onion. Taco Spice Mix
was shown to agglomerate after just a few days at 60°C. After eight weeks storage the
hardness of all caked samples was the same, and it was not possible to decide whether any
samples were different from the others, however the samples without addition of oil could
have been somewhat stiffer. The quick caking of Taco Spice Mix could be explained by that
certain ingredients, such as yeast extract, melt at high temperatures. There was no difference
in taste among the samples containing different oils but the flavour had changed to taste
sweet, salt and cumin. No rancid taste was detectable among any of the samples stored eight
weeks at 60°C.
4.3.1 Analysis of Angle of Repose
Angle of repose measurements were made on all four spice mixtures at storage in room
temperature and 40°C after four and eight weeks. Due to the seasonings stored in glass jars
being agglomerated very early, Barbeque Honey Seasoning was additionally evaluated after
two and six weeks at storage in 40°C, and Italian Salad Seasoning was additionally evaluated
after six weeks. During storage at 60°C, the seasonings stored in glass jars became very
agglomerated and dry, therefore being unsuitable for angle of repose measurements. These
spice mixtures were shown to be quite free-flowing when mixed to reduce the clumps,
because of the dryness of the powder. Therefore it was concluded to be inappropriate to
perform angle of repose measurements as an indication on clump formation and cohesiveness
for these two spice blends stored at 60°C. Taco Spice Mix was found to cake after just a few
days in 60°C, hence neither these samples were a part of the angle of repose analysis.
To make the cohesive powders Barbeque Honey Seasoning, Taco Spice Mix and the test
mixture pour through the funnel, vibrations were obtained by gently tapping on the top of the
edges of the funnel. The number of taps was counted, but no correlations of the added oil and
the number of taps demanded could be made for any of the spice mixtures or oils. Italian
Salad Seasoning and Fajita Spice Mix were free-flowing enough at all storage conditions not
to need the vibrations obtained by tapping.
54
Figure 4.23: Results of angle of repose measurements of samples of Barbeque Honey Seasoning stored at
different conditions.
The size of angles of repose varied a lot both between the different spice mixtures and within
each seasoning. There is a variation between the samples without added oil and with the
sample containing oil. The most significant example of this is the samples of Barbeque Honey
Seasoning, where all samples without addition of oil are significantly different from all
samples containing oil, which can be seen in figure 4.23. This indicates that the amount of
added oil affects the cohesiveness of the powder. Note that it is the mean value and the
standard deviation of each mean value of angle of repose that is shown in all the figures
regarding angle of repose.
Comparison of the angles of repose of the three different oils within each storage condition
show that the angles are similar and not differ from each other. This is true for all four spice
mixtures, but the angles of repose vary with different magnitudes, see figures 4.23, 4.24, 4.25
and 4.26. Note that the scales on the y-axes are not the same.

55
Figure 4.24: Results of angle of repose measurements of samples of Italian Salad Seasoning stored at
different conditions.
Figure 4.25: Results of angle of repose measurements of samples of Taco Spice Mix stored at different
conditions.
A possible explanation for the variety of magnitude of the angle of repose during different
storage conditions, as can be seen for Taco Spice Mix (figure 4.25), would be that the

56
Figure 4.26: Results of angle of repose measurements of samples of Fajita Spice Mix stored at different
conditions.
surrounding temperature changes the properties of the powder. Storage at 40°C could make
the spice mixture somewhat dryer compared to storage at room temperature, thereby making
it less cohesive, explaining the slight reduction of angle of repose. However, this explanation
does not hold for Fajita Spice Mix (figure 4.26), where the angles of repose are somewhat
increased for all samples stored eight weeks, irrespective of the storage temperature. This
behaviour could be due to that these two spice mixtures contain different ingredients that react
to storage in different ways. Generally, the angles of repose of Taco Spice Mix are larger
compared to Fajita Spice Mix, showing that the latter seasoning is less cohesive. The angles
of repose for almost all samples of the four spice mixtures containing the three different oils
are in the range of 30 to 45°, indicating some cohesiveness. If following the classification of
angles of repose of 40°, most samples are classified as free-flowing.
The spice mixtures produced at the test run in the factory were also analysed by angle of
repose (see figures 4.24 and 4.25). The results indicate that the angle of repose of Italian Salad
Seasoning produced with both palm oil and rapeseed oil are similar to the rest of the results.
Taco Spice Mix with addition of palm oil and rapeseed oil, produced in the factory, have
somewhat larger angles of repose compared to earlier results of different storage conditions,
as can be seen in figure 4.25. This could be due to that they were manufactured later in the
year when the relative humidity were higher, making the samples somewhat more cohesive.
The results of the angles of repose of the test mixture, consisting of hygroscopic ingredients,
mixed with eight of the oils included in the stability test can be seen in figure 4.27. At mixing,
the test mixture containing sunflower oil had slightly lower angle of repose compared to the
other samples. However, after four and eight weeks of storage, no difference between the oils
could be detected. There was a slight tendency that the angle of repose increased with storage
time. The samples without addition of oil are shown to have a smaller angle of repose
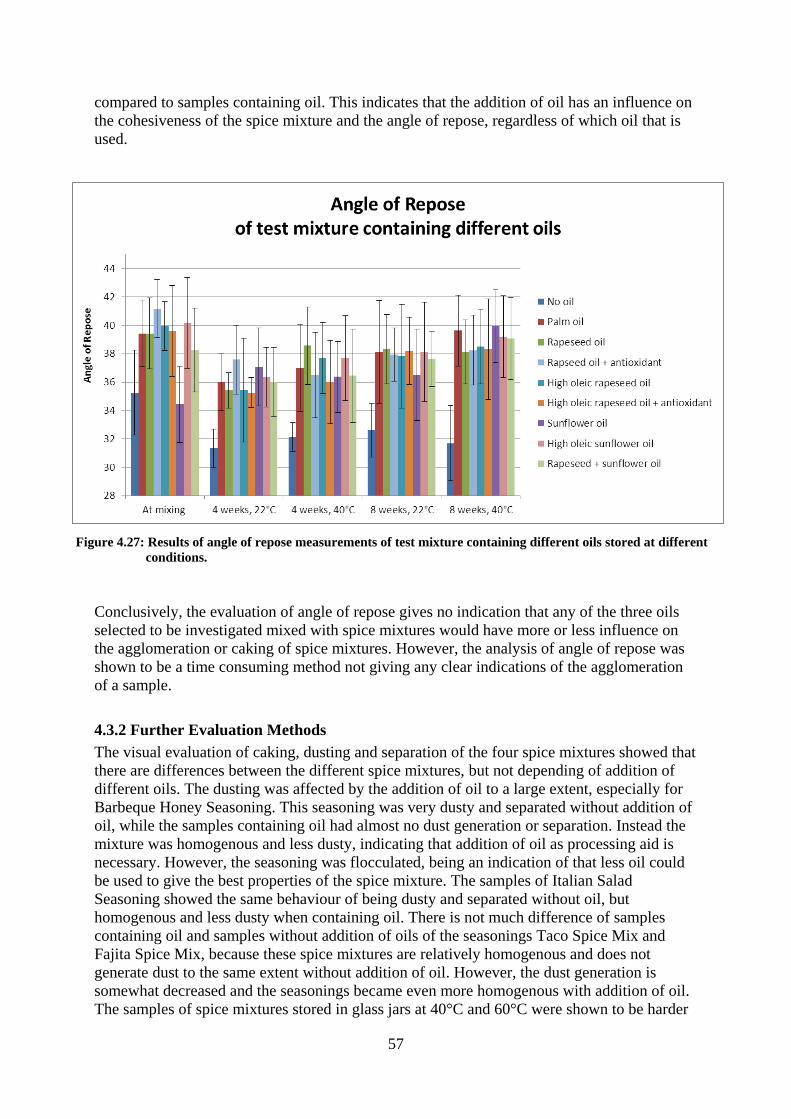
57
Figure 4.27: Results of angle of repose measurements of test mixture containing different oils stored at different
conditions.
compared to samples containing oil. This indicates that the addition of oil has an influence on
the cohesiveness of the spice mixture and the angle of repose, regardless of which oil that is
used.
Conclusively, the evaluation of angle of repose gives no indication that any of the three oils
selected to be investigated mixed with spice mixtures would have more or less influence on
the agglomeration or caking of spice mixtures. However, the analysis of angle of repose was
shown to be a time consuming method not giving any clear indications of the agglomeration
of a sample.
4.3.2 Further Evaluation Methods
The visual evaluation of caking, dusting and separation of the four spice mixtures showed that
there are differences between the different spice mixtures, but not depending of addition of
different oils. The dusting was affected by the addition of oil to a large extent, especially for
Barbeque Honey Seasoning. This seasoning was very dusty and separated without addition of
oil, while the samples containing oil had almost no dust generation or separation. Instead the
mixture was homogenous and less dusty, indicating that addition of oil as processing aid is
necessary. However, the seasoning was flocculated, being an indication of that less oil could
be used to give the best properties of the spice mixture. The samples of Italian Salad
Seasoning showed the same behaviour of being dusty and separated without oil, but
homogenous and less dusty when containing oil. There is not much difference of samples
containing oil and samples without addition of oils of the seasonings Taco Spice Mix and
Fajita Spice Mix, because these spice mixtures are relatively homogenous and does not
generate dust to the same extent without addition of oil. However, the dust generation is
somewhat decreased and the seasonings became even more homogenous with addition of oil.
The samples of spice mixtures stored in glass jars at 40°C and 60°C were shown to be harder

58
and more agglomerated if no oil was added, compared to samples with addition of any of the
three oils. For the other spice mixtures, there were no detectable differences in caking
between samples containing oil or not. These visual results can be related to the results of the
analysis of angle of repose, showing relatively large differences in angles of repose between
spice mixtures containing oil compared to samples without addition of oil, especially for
Italian Salad Seasoning and Barbeque Honey Seasoning.
All samples packed in laminate bags were weighed before and after storage. Almost all
samples decreased in weight during storage. The decrease ranged from about 0.2 % for Taco
Spice Mix stored at room temperature in four weeks, to about 5 % for Taco Spice Mix stored
eight weeks at 60°C. The decrease was similar for all samples of the same seasoning stored at
the same conditions, regardless of the type of oil or if oil was added at all, indicating that the
change in weight had nothing to do with the oil but with the composition of the spice mixture
and the storage conditions. One explanation for the weight decrease could be that the relative
humidity was comparatively low at the time when the test was made. The samples increasing
in weight during storage were the test mixture stored in room temperature. This could be due
to the hygroscopic properties of the ingredients of the test mixture. The fact that the samples
of test mixture stored at 40°C decreased in weight could be explained by that the fan in the
heating chamber increased the exchange of air, removing more moisture.
The agglomeration and caking of spice mixtures is highly related to the relative humidity
during storage. According to Lilliebjelke (2012) a spice mixture has no tendency of caking if
it has not started to agglomerate after storage in laminate bags after eight weeks at 40°C. The
storage tests performed in the present work did not show much caking after eight weeks,
neither the test mixture agglomerated. The reason for this is most likely that the test session
was performed during the winter and early spring, when the storage conditions are the best.
The problems of caking are greater during the summer, when the agglomeration may be
extensive. In February and March, the air humidity range between 10 % and 20 % relative
humidity (RH) outside, and during the summer it may be as high as 80-90 % RH. In the spice
plant the humidity in the air is controlled to make sure that there is maximum 40 % RH, in
order to reduce agglomeration and other problems during manufacturing (Rice, 2012).
The test method performed to investigate a possible correlation between caking and the
amount of spice mixture remaining in the bag after turning it upside down gave inconsistent
results. The amount of spice mixture left in the bag after holding it upside down had no
correlation to the extent of caking. Samples being free-flowing could stick in the bag, while
samples containing agglomerates could easily pour out of the bag, and vice versa. Therefore it
is not possible to make any conclusions about the extent of caking and how easily the content
pours out of the laminate bag.
Seven different spice mixtures produced at Santa Maria AB spice plant in Saue, Estonia, were
sensory evaluated. Newly produced samples were compared to products long passed the best-
before date. The old samples had lost some of the flavour and colour; especially herbaceous
flavours and green and red colours were faded. No rancid taste or aroma was detectable and
none of the samples were agglomerated. Santa Maria AB have not received any reclamations
or complaints from consumers about spice mixtures being rancid (Säfström, 2012; Tammel,
2012). To confirm that rancidity is not an issue in spice mixtures, samples of Taco Spice Mix
and Barbeque Honey Seasoning were mixed with rancid rapeseed oil stored twelve weeks at
60°C, and cooked with minced meat and fried chicken, respectively. Sensory evaluation with
comparison of freshly prepared samples showed that no rancid taste was detectable,
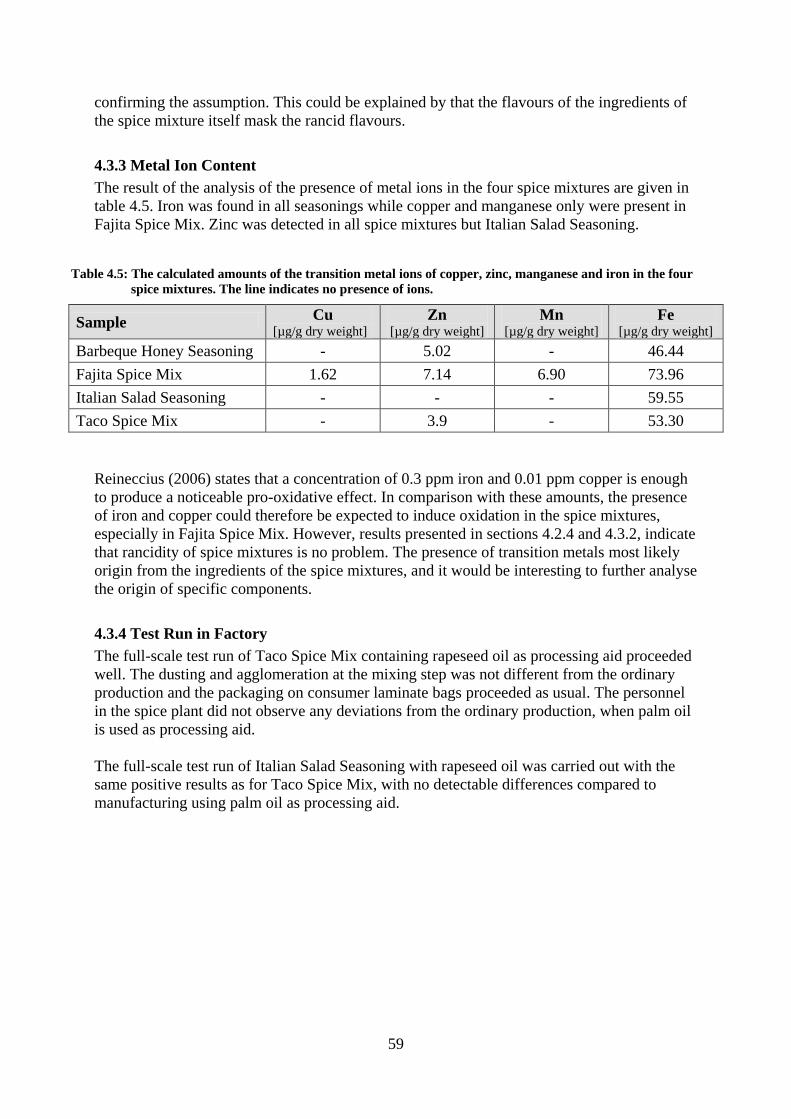
59
Table 4.5: The calculated amounts of the transition metal ions of copper, zinc, manganese and iron in the four
spice mixtures. The line indicates no presence of ions.
confirming the assumption. This could be explained by that the flavours of the ingredients of
the spice mixture itself mask the rancid flavours.
4.3.3 Metal Ion Content
The result of the analysis of the presence of metal ions in the four spice mixtures are given in
table 4.5. Iron was found in all seasonings while copper and manganese only were present in
Fajita Spice Mix. Zinc was detected in all spice mixtures but Italian Salad Seasoning.
Sample Cu
[µg/g dry weight] Zn
[µg/g dry weight] Mn
[µg/g dry weight] Fe
[µg/g dry weight]
Barbeque Honey Seasoning - 5.02 - 46.44
Fajita Spice Mix 1.62 7.14 6.90 73.96
Italian Salad Seasoning - - - 59.55
Taco Spice Mix - 3.9 - 53.30
Reineccius (2006) states that a concentration of 0.3 ppm iron and 0.01 ppm copper is enough
to produce a noticeable pro-oxidative effect. In comparison with these amounts, the presence
of iron and copper could therefore be expected to induce oxidation in the spice mixtures,
especially in Fajita Spice Mix. However, results presented in sections 4.2.4 and 4.3.2, indicate
that rancidity of spice mixtures is no problem. The presence of transition metals most likely
origin from the ingredients of the spice mixtures, and it would be interesting to further analyse
the origin of specific components.
4.3.4 Test Run in Factory
The full-scale test run of Taco Spice Mix containing rapeseed oil as processing aid proceeded
well. The dusting and agglomeration at the mixing step was not different from the ordinary
production and the packaging on consumer laminate bags proceeded as usual. The personnel
in the spice plant did not observe any deviations from the ordinary production, when palm oil
is used as processing aid.
The full-scale test run of Italian Salad Seasoning with rapeseed oil was carried out with the
same positive results as for Taco Spice Mix, with no detectable differences compared to
manufacturing using palm oil as processing aid.

60
5 Conclusions and Future Work
The accelerated shelf life tests clearly showed that the stability of vegetable oils corresponds
to the fatty acid composition and that oils composed of mainly saturated fatty acids were the
most stable ones. These results were obtained despite that only two temperatures, 40°C and
60°C, were used in the Arrhenius plots, due to that all oils stored at the lower temperatures,
22°C and 31°C, were shown to be stable enough not to deteriorate with the perception of
rancidity during twelve weeks storage. If performing similar stability tests again, the
recommendations would be to include additional storage temperatures with smaller intervals
between 40°C and 60°C, and to use room temperature as reference.
The method of evaluating the stability by sensory analysis was shown to be a good but
difficult technique. More training should have been made prior to evaluation in order to
coordinate the panel and increase the reproducibility of the outcome. It was shown to be
easier to decide the intensity of rancidity rather than the actual attribute, especially when the
intensity was low. Each oil was found to deteriorate with its own attributes, and an advice to
Santa Maria AB is to extend the library of rancid attributes. It would have been interesting to
analyse the deterioration of oils with TBARS that detect secondary oxidation products
responsible for off-flavours, or to evaluate which molecules that are formed and decomposed
during the lipid oxidation using gas chromatography coupled with mass spectroscopy, and to
compare the intensity of rancidity with the results from such analysis.
Rapeseed oil was chosen to be the best replacement for palm oil as processing aid in the
manufacturing process of dry spice mixtures. A good indication is that rapeseed oil is used in
the spice factory of Santa Maria AB in Saue, Estonia, without any problems. Both the sensory
evaluation and the analytical analysis of AV and PV performed, showed that rapeseed oil is
not very stable at storage in elevated temperatures. However, at room temperature the oil was
shown to be stable. In addition, the results evolved in this Master’s Thesis have shown that
rancidity in spice mixtures is no problem, and that rancid taste cannot be detected even in
samples produced with rancid oil. Hence, there is no need to use a high stability oil as
processing aid.
Analysis of angle of repose of four different spice mixtures produced with the addition of
palm oil, rapeseed oil and sunflower oil respectively, compared with seasoning without
addition of oil, showed no differences between spice mixtures containing different oils.
However, after visual evaluation, it became clear that the addition of oil is necessary to make
the spice mixture homogenous and to decrease the dust generation. The results also show that
there are no detectable differences in agglomeration and caking between samples containing
the three different oils.
The recommendation to Santa Maria AB is not to use the analysis of angle of repose to
evaluate the agglomeration and caking of samples of spice mixtures. However, the method
could be practical to use when deciding the amount of oil needed in a seasoning. Different
spice mixtures demand different amount of oil to reduce dusting and to avoid separation of
constituents of different density and size. To maintain the best properties of each spice
mixture, it could be beneficial to revise the amount of oil in seasonings with different types of
problems, such as dusting and caking, since it has been found that no addition of oil induce
caking for some spice mixtures, and that too much oil added may make the powder very
flocculent.

61
Another interesting investigation would be to compare the angles of repose of samples of
spice mixtures stored at elevated temperatures, with samples stored longer period of time at
room temperature. Hopefully this would give a correlation between the storage time in
elevated temperature and the corresponding shelf life in room temperature. It would also be
interesting to examine how other external factors affect the properties of spice mixtures, for
example by varying the relative humidity instead of temperature during storage.
When performing accelerated tests to evaluate differences between spice mixtures, it was
concluded that 40°C is a suitable storage temperature, as well as keeping samples at room
temperature for comparison. Storage at 60°C induce too much reactions not occurring at
ordinary storage during time, and therefore this temperature is not recommended when
evaluating spice mixtures. Perhaps a lower temperature of 30°C or 35°C should be used
instead.
In conclusion, the results of the present thesis work show that there was no difference
between the oils investigated as processing aid in the manufacturing process of spice
mixtures, but that the addition of oil is required to maintain products of high quality. It is of
high importance that the oil is easy to handle. The main advantages of replacing palm oil with
Swedish rapeseed oil are that rapeseed oil is better from a health perspective, as well as from
an environmental point of view. Other advantages are that rapeseed oil is available in smaller
quantities, it is cheaper and easy to handle. There is no need to heat the oil to make it liquid at
room temperature, which will reduce costs and simplify the handling by enable elimination of
heating equipment and electrical wires.
Before exchanging palm oil for rapeseed oil, Santa Maria AB is recommended to perform a
full-scale production test for a longer period of time, using rapeseed oil. The samples of
products of Italian Salad Seasoning and Taco Spice Mix, being manufactured with rapeseed
oil in the present work, should also be evaluated after storage in elevated temperature and
room temperature.

62

63
References
AAK AB (2007) Handbook: Vegetable oils and fat, 2nd
edition. AarhusKarlshamn AB. J-O.
Lidefelt (ed.).
AAK AB (2010) Rapeseed oil from AAK. AarhusKarlshamn AB. Available:
http://www.aak.se/Global/Brochures/Rapeseedoil_from_AAK.pdf (2012-05-21)
Aguilera J.M., del Valle J.M. and Karel M. (1995) ’Caking phenomena in amorphous food
powders’. Trends in Food Science & Technology. 6: 149-155.
Arvanitoyannis I. S., Varzakas T. H., Kiokias S., and Labropoulos A. E. (2010) ‘Lipids, Fats,
and Oils’. In: F. Yildiz (ed.) Advances in Food Biochemistry. pp 131-201. Boca Raton: CRC
Press, Taylor & Francis Group.
Blomdahl F. (2012) Area Sales Manager, AarhusKarlshamn AB. Conversation.
Blomstrand T. (2012) Material Flow Coordinator, Spice Plant, Santa Maria AB.
Conversation.
Bringsarve K. (2012) Application Manager, AarhusKarlshamn AB. Telephone interview.
Broadbent C. J. and Pike O.A. (2003) ‘Oil Stability Index Correlated with Sensory
Determination of Oxidative Stability in Canola Oil’. Journal of the American Oil Chemists’
Society. 80(1): 59-63.
Calligaris S. and Nicoli M.C. (2006) ‘Effect of selected ions from lyotropic series on lipid
oxidation rate’. Food Chemistry. 94: 130-134.
Corley R.H.V. and Tinker P.B. (2003) The Oil Palm, 4th
edition. Oxford: Blackwell
Publishing.
Coultate T. P. (2009) Food: the chemistry of its components, 5th
edition. Cambridge: RSC
Publishing.
Cuq B., Rondet E. and Abecassis J. (2011) ‘Food powders engineering, between knowhow
and science: Constraints, stakes and opportunities’. Powder Technology. 208: 244-251.
Emblem A. (2000) ‘Predicting Packaging Characteristics to Improve Shelf-Life’. In: D.
Kilcast and P. Subramaniam (eds.) The stability and shelf life of food. pp 145-169.
Cambridge: Woodhead Publishing Limited and Boca Raton: CRC Press LLC.
FAO (2010) Fats and fatty acids in human nutrition: Report of an expert consultation. Food
and Agriculture Organization of the United Nations. Rome. Available:
http://www.fao.org/docrep/013/i1953e/i1953e00.pdf (2012-02-28).
Fennema O.R., Damodaran S. and Parkin K.L. (2008) ’Introduction to Food Chemistry’. In:
O.R. Fennema, S. Damodaran and K.L. Parkin (eds.) Fennema's Food Chemistry, 4th
edition.
pp 1-13. Boca Raton: CRC Press, Taylor & Francis Group.
64
Fitzherbert E.B., Struebig M.J., Morel A., Danielsen F., Brühl C.A., Donald P.F. and Phalan
B. (2008) ‘How will oil palm expansion affect biodiversity?’ Trends in Ecology and
Evolution. 23(10).
Fitzpatrick J.J. and Ahrné L. (2005) ‘Food powder handling and processing: Industry
problems, knowledge barriers and research opportunities’. Chemical Engineering and
Processing. 44: 209-214.
Fredrikson M., Carlsson N-G., Almgren A. and Sandberg A-S. (2002). ’Simultaneous and
Sensitive Analysis of Cu, Ni, Zn, Co, Mn, and Fe in Food and Biological Samples by Ion
Chromatography’. Journal of Agricultural and Food Chemistry. 50: 59-65.
Ghazavi M., Hosseini M. and Mollanouri M. (2008) ‘A Comparison between Angle of
Repose and Friction Angle of Sand’. The 12th
International Conference of International
Association for Computer Methods and Advances in Geomechanics (IACMAG). 1-6 October
2008, Goa, India. 1272-1275.
Geldart D., Abdullah E.C., Hassanpour A., Nwoke L.C. and Wouters I. (2006)
‘Characterization of powder flowability using measurement of angle of repose’. China
Particuology. 4(3-4): 104-107.
Gordon M. (2001) ‘Measuring Antioxidant Activity’. In: J. Pokorny, N. Yanishlieva and M.
Gordon (eds.) Antioxidants in food, practical applications. pp 71-84. Cambridge: Woodhead
Publishing Limited and Boca Raton: CRC Press.
Gunstone F.D. (2008) ‘Food Applications of Lipids’. In: C.C. Akoh and D.B. Min (eds.) Food
Lipids: Chemistry, Nutrition & Biotechnology, 3rd
edition. pp 683-704. Boca Raton: CRC
Press, Taylor & Francis Group.
Hartmann M. and Palzer S. (2011) ‘Caking of amorphous powders – Material aspects,
modelling and applications’. Powder Technology. 206: 112-121.
Hough G. (2010) Sensory Shelf Life Estimation of Food Products. Boca Raton: CRC Press,
Taylor & Francis Group.
Igoe R.S. (2011) Dictionary of Food Ingredients. New York: Springer.
ISO 13299 (2010) Sensory analysis - Methodology - General guidance for establishing a
sensory profile. SIS Swedish Standards Institute. Stockholm: SIS Förlag AB.
ISO 4121 (2003) Sensory analysis - Guidelines for the use of quantitative response scales.
SIS Swedish Standards Institute. Stockholm: SIS Förlag AB.
ISO 5492 (2009) Sensory analysis - Vocabulary. SIS Swedish Standards Institute. Stockholm:
SIS Förlag AB.
Jacobsen C. (2010) ‘Understanding and reducing oxidative flavour deterioration in foods’. In:
E.A. Decker, R.J. Elias and D.J. McClements (eds.) Oxidation in Foods and Beverages and
Antioxidant Applications, Volume 1 - Understanding Mechanisms of Oxidation and
Antioxidant Activity. pp 122-142. Cambridge: Woodhead Publishing.

65
Janjatović D., Benković M., Srečec S., Ježek D., Špoljarić I. and Bauman I. (2011)
‘Assessment of powder flow characteristics in incoherent soup concentrates’. Advanced
Powder Technology.
Johansson G.M.R. (1976) ‘Finished oil handling and storage in Europe’. Journal of the
American Oil Chemists' Society. 53(6): 410-413.
Kalemba D. and Wajs A. ‘Essential Oils and Spices’. In: H. Jeleń (ed.) Food Flavors:
Chemical, Sensory and Technological Properties. pp 193-222. Boca Raton: CRC Press.
Kilcast D. and Subramaniam P. (2000) ‘Introduction’. In: D. Kilcast and P. Subramaniam
(eds.) The stability and shelf life of food. pp 1-22. Cambridge: Woodhead Publishing Limited
and Boca Raton: CRC Press LLC.
Kim H.J. and Min D.B. (2008) ‘Chemistry of Lipid Oxidation’. In: C.C. Akoh and D.B. Min
(eds.) Food Lipids: Chemistry, Nutrition & Biotechnology, 3rd
edition. pp 297-320. Boca
Raton: CRC Press, Taylor & Francis Group.
Kjellmer G. (2012) Team Manager Product Innovation, Santa Maria AB. Conversation.
Kristott J. (2000) ‘Fats and Oils’. In: D. Kilcast and P. Subramaniam (eds.) The stability and
shelf life of food. pp 279-309. Cambridge: Woodhead Publishing Limited and Boca Raton:
CRC Press LLC.
Lilliebjelke T. (2012) Product & Process Developer, Santa Maria AB. Conversation.
Liu F., Cao X., Wang H. and Liao X. (2010) ‘Changes of tomato powder qualities during
storage’. Powder Technology. 204: 159-166.
Livsmedelsföretagen Li (2006) Märkning av färdigförpackade livsmedel, 12th
edition.
Stockholm: Åsbrink Grafiska AB.
Lu M., Yuan B., Zeng M. and Chen J. (2011) ‘Antioxidant capacity and major phenolic
compounds of spices commonly consumed in China’. Food Research International. 44: 530-
536.
Lundgren B. (1981) Handbok i sensorisk analys. SIK-Rapport 1981 nr 470. Göteborg: SIK-
Svenska Livsmedelsinstitutet.
Malcolmson L.J., Vaisey-Genser M., Przybylski R. and Eskin N.A.M. (1994) ‘Sensory
Stability of Canola Oil: Present Status of Shelf Life Studies’. Journal of the American Oil
Chemists’ Society. 71(4): 435-440.
McClements D.J. and Decker E.A. (2008) ‘Lipids’. In: S. Damodaran, K.L. Parkin and O.R.
Fennema (eds.) Fennema’s Food Chemistry, 4th
edition. pp 155-216. Boca Raton: CRC Press,
Taylor & Francis Group.
Meilgaard M., Civille G.V. and Carr B.T. (1999) Sensory Evaluation Techniques, 3rd
edition.
Boca Raton: CRC Press.
66
Min D.B. (2000). ‘Fats and oils’. In: F.J. Francis (ed.) Wiley Encyclopedia of Food Science
and Technology, 2nd
edition. pp 731-736. New York: John Wiley & Sons Inc.
Mizrahi S. (2000) ‘Accelerated shelf-life tests’. In: D. Kilcast and P. Subramaniam (eds.) The
stability and shelf life of food. pp 107-128. Cambridge: Woodhead Publishing Limited and
Boca Raton: CRC Press LLC.
Nawar W.W. (1996) ‘Lipids’. In: O.R. Fennema (ed.) Food Chemistry, 3rd
edition. pp 225-
320. New York: Marcel Dekker Inc.
Product Specifications, AAK AB (2012). AarhusKarlshamn AB.
Raghavan S. (2000) Handbook of Spices, Seasonings and Flavorings. Boca Raton: CRC
Press.
Reineccius G. (2006) Flavor Chemistry and Technology, 2nd
edition. Boca Raton: CRC Press,
Taylor & Francis Group.
Reische D.W., Lillard D.A. and Eitenmiller R.R. (2008) ‘Antioxidants’. In: C.C. Akoh and
D.B. Min (eds.) Food Lipids: Chemistry, Nutrition and Biotechnology, 3rd
edition. pp 409-
434. Boca Raton: CRC Press, Taylor & Francis Group.
Rice D. (2012) Facilities & Risk Manager, Santa Maria AB. Conversation.
Ridgway K. and Lalljie S.P.D. (2011) ‘Food taints and off-flavors’. In: H. Jeleń (ed.) Food
Flavors: Chemical, Sensory and Technological Properties. pp 335-354. Boca Raton: CRC
Press.
Robertson A. (2008) Investigation of frying oil characteristics and measuring methods for
production of corn chips as well as product stability in respect of rancidity. (Final Thesis in
Food Science). Gothenburg: Chalmers University of Technology.
RSPO (2009) Roundtable of Sustainable Palm Oil. webpage. www.rspo.org (2012-01-31)
Santa Maria AB (2012) webpage. www.santamariaworld.com (2012-01-31)
Shahidi F. and Wanasundara U.N. (2008) ‘Methods for Measuring Oxidative Rancidity in
Fats and Oils’. In: C.C. Akoh and D.B. Min (eds.) Food Lipids: Chemistry, Nutrition and
Biotechnology, 3rd
edition. pp 387-408. Boca Raton: CRC Press, Taylor & Francis Group.
SLV (2011) Vad innehåller maten? Svenska Livsmedelsverket. Available:
http://www.slv.se/sv/grupp1/Mat-och-naring/Vad-innehaller-maten/Fett/ (2012-03-14)
Snickert G. (2012) Laboratory Manager, Quality Department, Santa Maria AB. Conversation.
SNR (2005) Svenska näringsrekommendationer: Rekommendationer om näring och fysisk
aktivitet, Fjärde upplagan. Svenska Livsmedelsverket. Available:
http://www.slv.se/upload/dokument/mat/rad_rek/SNR2005.pdf (2012-03-14)
Säfström A. (2012) Consumer Liaison, Quality Department, Santa Maria AB. Conversation.
67
Takemasa M. and Hirasa K. (1998) Spice Science and Technology. New York: CRC Press.
Tammel K. (2012) Product & Process Development Technologist, Santa Maria AS, Estonia.
Telephone interview.
Taoukis P. and Labuza T.P. (1996) ‘Summary: Integrative Concepts; Application of Kinetics
to Shelf-Life Modeling’. In: O.R. Fennema (ed.) Food Chemistry, 3rd
edition. pp 1013-1042.
New York: Marcel Dekker Inc.
Tortora G. and Derrickson B. (2010) Essentials of Anatomy and Physiology, 8th
edition.
Hoboken: John Wiley & Sons Inc.
Wells A.B. and Alexander D.J. (1978) ‘A Method for Estimating the Dust Yield of Powders’.
Powder Technology, 19: 271-277.
Wendin K. (2011) Associate Professor and Senior Scientist in Sensory and Food Science,
SIK. Lecture at Chalmers University of Technology. 2011-11-28.
WWF (2010) WWF Living Planet Report 2010: Biodiversity, biocapacity and development.
D. Pollard (ed.). WWF International.
WWF UK (2011) ‘Palm Oil: For the World Forum on Enterprise and the Environment’. WWF
Briefing June 2011. WWF UK. Available: www.wwf.org.uk
http://assets.wwf.org.uk/downloads/palm_oil_briefing_280611.pdf (2012-01-23)
Yhlen Å. (2012) Packaging Development Technologist, Santa Maria AB. Conversation.
Zetterquist A. (2012) Taste Innovation Specialist, Santa Maria AB. Conversation.
Zhou Y.C., Xu B.H., Yu A.B. and Zulli P. (2002) ‘An experimental and numerical study of
the angle of repose of coarse spheres’. Powder Technology. 125: 45-54.