use of the zebrafish developmental screen and estimation ... · use of the zebrafish developmental...
TRANSCRIPT

Hamm et al. Zebrafish Developmental Screen July 2, 2014 NICEATM WC9 Poster — DRAFT
Use of the Zebrafish Developmental Screen and Estimation of Internal Concentration to Assess Toxicity J Hamm1, N Kleinstreuer1, D Allen1, W Casey2, S Padilla3 1ILS/NICEATM, RTP, NC, USA; 2NIH/NIEHS/DNTP/NICEATM, RTP, NC, USA; 3EPA/ORD/NHEERL, RTP, NC, USA
Introduction
• Chemical lipophilicity contributes to bioconcentration in aquatic species. Lipophilicity correlates with developmental toxicity in various aquatic models.
• Zebrafish is being used as a model organism to screen thousands of chemicals in the ToxCast and Tox21 research programs for potential to induce developmental defects or overt toxicity.
• The partition coefficient (log P) is an indicator of lipophilicity. • We examined the relationship between log P, estimated body burden, and developmental
toxicity in zebrafish embryos for 309 environmental chemicals from the ToxCast Phase I library.
• We then used hepatic clearance, protein binding data, and reverse toxicokinetic models to compare zebrafish toxicity and ToxCast high-throughput screening (HTS) activity to in vivo rat data.
1

Hamm et al. Zebrafish Developmental Screen July 2, 2014 NICEATM WC9 Poster — DRAFT
Experimental Methods
• Chemicals were screened by immersing zebrafish embryos in media containing chemical concentrations from 0.001 to 80 μM and determining the half-maximal activity concentration (AC50) for toxicity (lethality, non-hatching, or dysmorphology) (Figure 1; Padilla et al. 2012).
Figure 1 Zebrafish Developmental Assay Exposure and Evaluation Schema
From Padilla et al, 2012.
2
Hamm et al. Zebrafish Developmental Screen July 2, 2014 NICEATM WC9 Poster — DRAFT
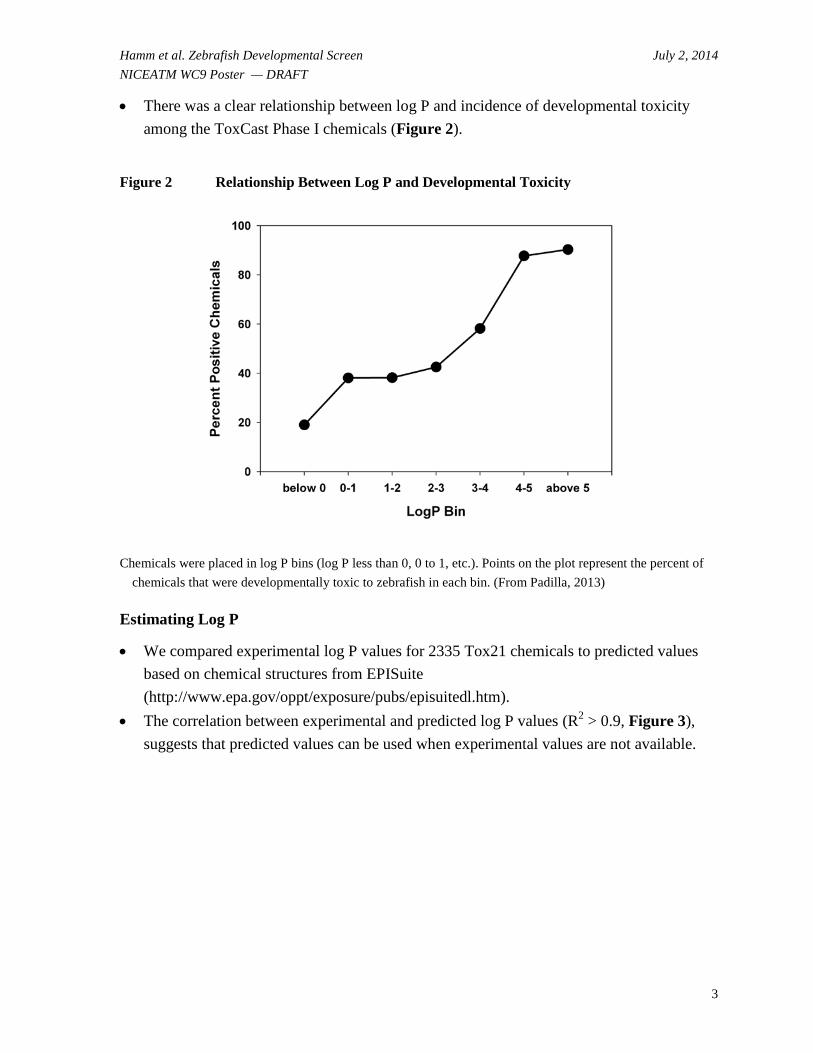
• There was a clear relationship between log P and incidence of developmental toxicity among the ToxCast Phase I chemicals (Figure 2).
Figure 2 Relationship Between Log P and Developmental Toxicity
Chemicals were placed in log P bins (log P less than 0, 0 to 1, etc.). Points on the plot represent the percent of
chemicals that were developmentally toxic to zebrafish in each bin. (From Padilla, 2013)
Estimating Log P
• We compared experimental log P values for 2335 Tox21 chemicals to predicted values based on chemical structures from EPISuite (http://www.epa.gov/oppt/exposure/pubs/episuitedl.htm).
• The correlation between experimental and predicted log P values (R2 > 0.9, Figure 3), suggests that predicted values can be used when experimental values are not available.
3

Hamm et al. Zebrafish Developmental Screen July 2, 2014 NICEATM WC9 Poster — DRAFT
Figure 3 Experimental vs. Predicted Partition Coefficient (Log P) Values for 2335 Tox21 Chemicals
R² = 0.9041
-10
-5
0
5
10
15
20
-10 -5 0 5 10 15 20 25
Expe
rim
enta
l Log
P
Predicted Log P
The log P values predicted by EpiSuite (x-axis) were plotted against experimentally derived log P values (y-axis). There was a high degree of correlation between predicted and experimental values (R2 = 0.90412)
Applying Bioconcentration Factor
• The linear relationship between log P and bioconcentration was derived from multiple studies. (Figure 4; adapted from Padilla 2013).
• The regression equation from these data was applied to the AC50 values from the ToxCast screen and used to estimate a body burden associated with developmental toxicity (EC50).
4

Hamm et al. Zebrafish Developmental Screen July 2, 2014 NICEATM WC9 Poster — DRAFT
Figure 4 Relationship Between Partition Coefficient (Log P) and Bioconcentration in the Fish Embryo
Literature values for embryo/larval chemical concentrations were plotted against log P to define the relationship
between log P and bioconcentration. Values represented by solid squares are from Berghmans et al (2008), open triangles from Gustafson et al (2012), and gray circle from Thomas et al. (2009). The solid line represents the relationship between log P of the chemical and concentration in the embryo.
5

Hamm et al. Zebrafish Developmental Screen July 2, 2014 NICEATM WC9 Poster — DRAFT
Chemical Potency Shifts
• Table 1 shows the ten most toxic ToxCast Phase I chemicals to developing zebrafish, based on either nominal half-maximal activity concentration (AC50), or estimated internal half-maximal activity concentration (EC50).
- Thiram, butafenicil, fluthiacet-methyl, rotenone, and fentin are toxic at submicromolar concentrations, regardless of whether external exposure or estimated internal body burden is considered.
- Tefluthrin was toxic at low concentrations and was predicted to have high bioconcentration in zebrafish. This observation was consistent among all pyrethroids tested (Table 2: 13 pyrethroids in ToxCast Phase I, log P range 3.31–8.15).
• For the five chemicals in Table 2 with lowest adverse effect levels (LOAELs) in rat prenatal studies, there appears to be a relationship between potency in the zebrafish embryo and developmental toxicity LOAEL in the rat.
6

Hamm et al. Zebrafish Developmental Screen July 2, 2014 NICEATM WC9 Poster — DRAFT
Table 1 Most Toxic Chemicals to Developing Zebrafish Embryos
Chemicala AC50 (µM)
AC50 Rank
Log P EC50 (µM)
EC50 Rank
Chemical Structural Category
Thiram ≤0.0014 1 1.73 0.0002 1 thiocarbamate
Rotenone ≤0.0014 2 4.1 0.0107 4 isoflavone
Tefluthrin 0.0046 3 6.5 1.9331 38 pyrethroid ester
Butafenacil 0.0069 4 3.05b 0.0091 3 uracil phanyl halide carboxylate
Pyridaben 0.0114 5 6.37 3.8562 48 diazine phenyl sulfide halide ketone
Flumetralin 0.0123 6 5.45 0.8957 25 aniline alkylate dinitro fluoro
Fluthiacet-methyl
0.0148 7 3.77 0.0652 7 conazole (imidazoles)
Abamectin 0.0173 8 NA NA NA mectin
Fentin 0.0763 9 3.53 0.2253 14 organometallic
Propargite 0.1279 10 5 4.3941 51 phenyl ether sulfate
Dazomet 0.2814 19 0.63 0.0066 2 thiocarbamate
Fluoxastrobin 0.1873 16 2b 0.0430 5 strobin
Daminozide 66.5075 183 -1.5 0.0443 6 carbamate carboxylic acid amine
Methylene bis(thiocyanate)
3.9125 76 0.62 b 0.0897 8 thiocyanate
Imazamox 3.5 71 0.73 0.0965 9 imidazolinone pyridine carboxylic
acid
Thiophanate-methyl
1.2252 47 1.4 0.1033 10 benzimidazole carbamate
Abbreviations: AC50 = nominal half-maximal activity concentration; EC50 = estimated internal half-maximal activity concentration; log P = partition coefficient; NA = no experimental or predicted log P value available in EpiSuite.
a Chemicals shown are the top ten most toxic, ranked first by AC50 and then by EC50. There was an overlap of four chemicals in the top ten by each measure.
b Log P values were predicted with EpiSuite.
7

Hamm et al. Zebrafish Developmental Screen July 2, 2014 NICEATM WC9 Poster — DRAFT
Table 2 Chemical Class Bioconcentration Example: Pyrethroids
Chemicala Log P AC50 (µM)
EC50 (µM)
Rat Prenatal LOAEL (mg/kg/day)
Cyfluthrin 5.95 0.33 55.32 0.14
Tefluthrin 6.5 0.01 1.93 5
S-Bioallethrin 4.78 1.05 25.08 50
Resmethrin 6.14 2.80 645.42 80
Permethrin 6.5 3.00 1261.86 150
Esfenvalerate 6.21 0.29 76.11 Null
Fenpropathrin 5.85 0.32 46.05 Null
Cypermethrin 6.24 0.33 88.08 Null
Bifenthrin 8.15 0.57 3730.77 Null
Prallethrin 4.49 1.57 23.00 Null
Cyhalofop-butyl 3.31 2.94 6.02 Null
d-cis,trans-Allethrin 4.78 6.57 156.43 Null
Tetramethrin 4.73 10.33 226.18 Null
Abbreviations: AC50 = nominal half-maximal activity concentration; EC50 = estimated internal half-maximal activity concentration; LOAEL = Lowest Adverse Effect Level from the EPA’s Toxicological Reference Database; log P = partition coefficient; NULL = Rat prenatal studies were performed but no developmental toxicity effects were seen.
aChemicals are ranked first by Rat Prenatal LOAEL, where applicable, then by AC50 in the zebrafish embryo
8

Hamm et al. Zebrafish Developmental Screen July 2, 2014 NICEATM WC9 Poster — DRAFT
Comparison to In Vivo and HTS Data
• ToxCast Phase I chemicals were also screened in >600 HTS assays (Kavlock et al. 2012) including:
- Human primary cell assays measuring protein signaling - Cell-free biochemical assays measuring enzymatic activation and receptor binding - Assays for nuclear receptor target activity - Transcription factor activation assays - Assays measuring cytochrome P450 induction
• Most of these chemicals have in vivo rodent toxicity data (prenatal, multigenerational, chronic/cancer, and/or subchronic studies) available in ToxRefDB (http://actor.epa.gov/toxrefdb/)
• A subset of 27 compounds active in the zebrafish and having in vivo prenatal ToxRefDB rat data also had hepatic clearance and protein binding data (Wetmore et al. 2013).
• We computed the rat oral equivalent values from the zebrafish data and the most sensitive ToxCast HTS assay target. We compared these values to the LOAELs from ToxRefDB (Table 3).
• Seven chemicals (highlighted in pink in Table 3) were developmentally toxic to zebrafish but not rats (i.e., these chemicals had rat prenatal studies in ToxRefDB but no recorded LOAEL).
• From the remaining 20 chemicals with rat prenatal LOAELs:
- Thirteen chemicals had rat oral equivalent values from the zebrafish data (AC50 or EC50) that were lower than the prenatal LOAEL in the rat.
- Three chemicals (fenuconazole, permethrin, and resmethrin highlighted in green in Table 3) had rat prenatal LOAELs that fell between the oral equivalents estimated from the zebrafish AC50 and EC50.
- Four conazoles (cyproconazole, flufenacet, flusilazole, and hexaconazole, highlighted in orange in Table 3) had rat oral equivalent values from the zebrafish data (AC50 or EC50) that were higher than the prenatal LOAEL in the rat.
9

Hamm et al. Zebrafish Developmental Screen July 2, 2014 NICEATM WC9 Poster — DRAFT
Table 3 Rat Oral Equivalent Values Across 27 Chemicals
Chemicala
ZF AC50 Rat Oral
Equivalent (mg/kg/day)b
ZF EC50 Rat Oral
Equivalent (mg/kg/day)b
Rat Prenatal LOAEL
(mg/kg/day)c
Chemical Category
ToxCast HTS AC50 Rat Oral
Equivalent (mg/kg/day)
Most Sensitive ToxCast HTS AC50 Assay Targetd
Flusilazole 7.69 30.16 0.4 conazole (triazoles) 0.018 NVS_ADME_hCYP2C19
Hexaconazole 77.79 426.01 2.5 conazole (triazoles) 0.057 NVS_ADME_rCYP2A2
Cyproconazole 53.73 55.43 12 conazole (triazoles) 0.026 NVS_ADME_rCYP2A2
Lindane 2.26 9.89 20 alkane cyclo chloro 0.503 ATG_VDRE_CIS
Fenarimol 1.02 3.38 35 phenyl-phenyl [C]
halide alcohol diazine
0.004 NVS_ADME_rCYP2A2
Triflumizole 0.76 0.06 35 conazole (imidazoles) 0.01 NVS_ADME_rCYP2A2
Oxadiazon 0.47 11.54 40 oxadiazolone 0.267 ATG_PXRE_CIS
S-Bioallethrin 1.37 32.53 50 pyrethroid ester 0.488 NVS_ADME_hCYP3A5
Fenbuconazole 72.83 130.34 75 conazole (triazoles) 0.038 NVS_ADME_rCYP2A2
Resmethrin 2.97 685.22 80 pyrethroid ester 4.969 BSK_4H_VCAM1_down
Triadimefon 3.05 2.53 90 conazole (triazoles) 0.002 NVS_ADME_rCYP2A2
10

Hamm et al. Zebrafish Developmental Screen July 2, 2014 NICEATM WC9 Poster — DRAFT
Tetraconazole 5.01 15.55 100 conazole (triazoles) 0.001 NVS_ADME_hCYP2C19
Flufenacet 146.08 248.66 125 conazole (imidazoles) 0.025 NVS_NR_hPXR
Permethrin 2.14 901.26 150 pyrethroid ester 2.571 BSK_LPS_PGE2_down
Cyprodinil 0.77 4.98 200 phenyl-diazine [N] 0.019 APR_CellCycleArrest_1hr_up
Acetochlor 240.09 307.7 600 phenyl acetanilide chloro 6.724 ATG_PXRE_CIS
Halosulfuron-methyl 1.08 0.01 750 sulfonylurea 12.2 ATG_PPARg_TRANS
Fludioxonil 0.59 4.64 1000 phenyl-pyrole ether nitrile
fluoride 0.001 NVS_NR_hPXR
Triticonazole 2.63 5.21 1000 conazole (triazoles) 0.002 NVS_ADME_rCYP3A1
Chlorpropham 40.76 116.41 1000 phenyl carbamate chloro 2.974 NVS_MP_rPBR
Cyclanilide 0.17 0.03 Null phenyl amide
chloro carboxylic acid
0.003 APR_CellLoss_72hr_dn
Bensulide 4.77 43.08 Null phenyl
sulfonamide thiophosphate
0.031 NVS_ADME_hCYP3A5
Dithiopyr 1.74 39.34 Null pyridine thio ketone fluoride 0.046 NVS_NR_hPXR
Triclosan 0.91 20.91 Null phenol-phenyl [O] halide 0.051 BSK_hDFCGF_CollagenIII_up
11

Hamm et al. Zebrafish Developmental Screen July 2, 2014 NICEATM WC9 Poster — DRAFT
Bisphenol A 160.98 334.79 Null phenol-phenol [C] 0.263 NVS_NR_hCAR_Antagonist
Diphenylamine 3.19 8.95 Null phenyl-phenyl [N] 0.814 NVS_TR_hNET
Alachlor 390.23 1133.24 Null phenyl acetanilide chloro 24.31 NVS_ADME_hCYP2B6
Abbreviations: AC50 = nominal half-maximal activity concentration; EC50 = estimated internal half-maximal activity concentration; HTS = high-throughput screen; LOAEL = lowest adverse effect level from the EPA’s Toxicological Reference Database; log P = partition coefficient; ZF = zebrafish
a Chemicals are sorted by rat prenatal LOAEL in ascending order, with chemicals with no rat prenatal LOAEL in ToxRefDB listed last. Chemicals highlighted in green had rat prenatal LOAELs that fell between the oral equivalents estimated from the zebrafish AC50 and EC50. Chemicals highlighted in orange had rat prenatal LOAELs that were lower than the oral equivalents estimated from the zebrafish data. Chemicals highlighted in pink were not toxic in rat prenatal studies.
b Calculated using the method of Wetmore et al. (2013).
c Values from ToxRefDB (http://actor.epa.gov/toxrefdb/)
d Assay target definitions can be found in ToxCastDB (http://actor.epa.gov/actor/faces/ToxCastDB/GenesAssocAssays.jsp)
12

Hamm et al. Zebrafish Developmental Screen July 2, 2014 NICEATM WC9 Poster — DRAFT
Conclusions
• Lipophilicity (log P) contributes substantially to bioavailability and bioaccumulation in the developing zebrafish embryo/larva and influences toxicity accordingly.
• Certain classes of chemicals, such as pyrethroids, are predicted to bioconcentrate significantly in zebrafish based on their Log P values.
• For most chemicals tested, zebrafish assays provide a conservative estimate of developmental toxicity lowest effect levels. However, the developmental toxicity of certain chemical classes, such as conazoles, may be underpredicted by zebrafish studies.
• For all chemicals tested, the ToxCast HTS assays were more sensitive than zebrafish or rat prenatal studies.
• ToxCast in vitro assay targets may provide insight into the biological relevance of zebrafish assays for predicting mammalian developmental toxicity.
References
• Berghmans, S., Butler, P., Goldsmith, P., Waldron, G., Gardner, I., Golder, Z., Richards, F.M., Kimber, G., Roach, A., Alderton, W., Fleming, A. (2008). Zebrafish based assays for the assessment of cardiac, visual and gut function - potential safety screens for early drug discovery. Journal of Pharmacological and Toxicological Methods, 58, 59–68.
• Gustafson, A.L., Stedman, D.B., Ball, J., Hillegass, J.M., Flood, A., Zhang, C.X., Panzica-Kelly, J., Cao, J., Coburn, A., Enright, B.P., Tornesi, M.B., Hetheridge, M., Augustine-Rauch, K.A. (2012). Inter-laboratory assessment of a harmonized zebrafish developmental toxicology assay - Progress report on phase I. Reproductive Toxicology, 33, 155–164.
• Padilla, S., Zebrafish development: High-throughput test systems to assess developmental toxicity in High-Throughput Screening Methods in Toxicity Testing, P. Steinberg, Ed. 2013 John Wiley & Sons, pp. 371-383.
• Padilla, S., Corum, D., Padnos, B., Hunter, D.L., Beam, A., Houck, K.A., Sipes, N., Kleinstreuer, N., Knudsen, T., Dix, D.J., and D.W. Reif. Zebrafish developmental screening of the ToxCast ™ Phase 1 chemical library. Reprod. Toxicol. (2012), Apr;33(2):174-187.
• Petersen, G.I., Kristensen, P. (1998). Bioaccumulation of lipophilic substances in fish early life stages. Environmental Toxicology and Chemistry, 17, 1385–1395.
• Thomas, L.T., Welsh, L., Galvez, F., Svoboda, K.R. (2009). Acute nicotine exposure and modulation of a spinal motor circuit in embryonic zebrafish. Toxicology and Applied Pharmacology, 239, 1–12.
13

Hamm et al. Zebrafish Developmental Screen July 2, 2014 NICEATM WC9 Poster — DRAFT
Acknowledgements
The Intramural Research Program of the National Institute of Environmental Health Sciences (NIEHS) supported this poster. Technical support was provided by ILS under NIEHS contracts N01-ES 35504 and HHSN27320140003C.
The views expressed above do not necessarily represent the official positions of any Federal agency. Since the poster was written as part of the official duties of the authors, it can be freely copied.
A summary of NICEATM activities at the Ninth World Congress is available on the National Toxicology Program website at http://ntp.niehs.nih.gov/go/41583.
14