use of synthetic aperture radar for recognition of coastal ... · use of synthetic aperture radar...
TRANSCRIPT

Anais da Academia Brasileira de Ciências (2003) 75(3): 341-356(Annals of the Brazilian Academy of Sciences)ISSN 0001-3765www.scielo.br/aabc
Use of synthetic aperture radar for recognition of CoastalGeomorphological Features, land-use assessment and shoreline
changes in Bragança coast, Pará, Northern Brazil
PEDRO W.M. SOUZA-FILHO1 and WALDIR R. PARADELLA2
1Laboratório de Análise de Imagens do Trópico Úmido, Centro de Geociências, UFPACx. Postal 1611, 66075-110 Belém, PA, Brasil
2Instituto Nacional de Pesquisas Espaciais, São José dos CamposCx. Postal 515, 12227-010 São Paulo, SP, Brasil
Manuscript received on September 9, 2002; accepted for publication on March 7, 2003;
presented by Roberto Dall’Agnol
ABSTRACT
Synthetic Aperture Radar (SAR) images are being used more extensively than ever before for geoscience
applications in the moist tropics. In this investigation, a RADARSAT1-1 C-HH SAR image acquired in 1998
was used for coastal mapping and land-cover assessment in the Bragança area, in the northern Brazil. The
airborne GEMS 1000 X-HH radar image acquired in 1972 during the RADAM Project was also used for
evaluating coastal changes occurring over the last three decades. The research has confirmed the usefulness of
RADARSAT-1 image for geomorphological mapping and land-cover assessment, particularly in macrotidal
mangrove coasts. It was possible to map mangroves, salt marshes, chenier sand ridges, dunes, barrier-beach
ridges, shallow water morphologies and different forms of land-use. Furthermore, a new method to estimate
shoreline changes based on the superimposition of vectors extracted from both sources of SAR data has
indicated that the shoreline has been subjected to severe coastal erosion responsible for retreat of 32 km2
and accretion of 20 km2, resulting in a mangrove land loss of almost 12 km2. In an application perspective,
orbital and airborne SAR data proved to be a fundamental source of information for both geomorphological
mapping and monitoring coastal changes in moist tropical environments.
Key words: geomorphology, coastal changes, remote sensing, mangrove, Amazon.
1 INTRODUCTION
The landforms along the Bragança macrotidal man-
grove coast of Pará State (northern Brazil) are com-
plex and dynamic in nature. Their developments
are largely controlled by the interplay of various
spatial and temporal factors including wind, waves,
tides and currents, coupled with geology, vegeta-
tion, climate and time. The coastal processes of
erosion, transport and deposition and their link to
Correspondence to: Pedro W.M. Souza FilhoE-mail: [email protected]
flooding and relative sea level changes have con-
tinuously modified the coastal environment. Thus,
the understanding of the landform developments and
an in-depth knowledge of the spatial and tempo-
ral changes are critical to characterize the coastal
zone, aiming at the protection of this sensitive tropi-
cal environment. Recent studies have addressed the
use of orbital Synthetic Aperture Radar (SAR) as an
ideal data source for flooding, wetland and hydro-
logical studies in the Amazon (Novo et al. 1998,
Forsberg et al. 2000, Proysi et al. 2000, Costa et
An Acad Bras Cienc (2003)75 (3)

342 PEDRO W.M. SOUZA-FILHO and WALDIR R. PARADELLA
al. 2002, Rosenqvist et al. 2002). The cloud pen-
etration ability and the day/night imaging capabili-
ties allow valuable information to be extracted when
data acquired by conventional optical remote sens-
ing imagery are restricted. The difference of SAR
return from land versus water is primarily a func-
tion of contrast of dielectric properties and surface
roughness, providing a striking interface which also
facilitates coastal delineation and related mapping
studies (MacDonald et al. 1971, Lee and Jurkevich
1990, Ellis and Richmond 1991).
Geomorphologically, the Amazon coastal zone
is poorly mapped. The Bragança coastal area, which
is located on the easternmost border of the Amazon
Region, is part of a muddy coast, which constitutes
one of the largest macrotidal mangrove coast of the
world, with almost 8,900 km2 (Kjerfve et al. 2002).
The RADAM Project, in the beginning of the 70’s,
carried out the first regional airborne SAR mapping
in the area. With the side viewing geometry and
using a high microwave frequency (X-HH), images
from the Goodyear Mapping System (GEMS 1000)
were extensively used as an operational tool for re-
gional mapping in the coastalAmazon environments
(Projeto RADAM 1973).
With the advent of SAR-satellite imageries,
several studies focussed on the use of orbital SAR
data for coastal applications in the moist tropics
(Singhroy 1996, Barbosa et al. 1999, Kushwaha
et al. 2000, Proysi et al. 2000). This paper ad-
dresses the importance of using old and new SAR
data acquired from GEMS 1000 and RADARSAT-
1, respectively, for tropical coastal studies in the
Amazon coastal zone focussing on geomorphologi-
cal mapping, erosional and land-cover assessments.
2 STUDY AREA
The study area is located on the northeast of Pará
State, approximately at 1oS and 46oW (Figure 1).
A continuous mangrove belt of around 20 km wide
fringes the shoreline with elevation from 1 up to 2
m above mean tide level (Cohen et al. 2000). A wet
season from December to May and a dry season from
June to November mark the climate (Martorano et al.
1993). Trade winds blow from northeast throughout
the year and strong winds characterize the dry season
(Silva 2001). The average annual rainfall reaches
2,500 mm and the mean tidal range is around 5 m
on a semi-diurnal cycle (DHN 2000). Thus, large
areas of the low lands are flooded during spring tides
due to both rainfalls with high runoff rates and tidal
effects. On one hand, strong tidal currents from east
to west and waves 1.5 m high are responsible for
the erosion of mangroves along the coast, estuaries
and bays, where lines of fallen mangrove trees mark
the eroded sites. On the other hand, new mangrove
fringes are prograding seaward in response to muddy
sedimentation (Souza Filho et al. 2003).
The Bragança area is inserted within the
Bragança-Viseu Coastal Basin, with Quaternary de-
posits controlled by the geometry and paleotopogra-
phy of the Basin (Souza Filho 2000a). The Holocene
sedimentary evolution of this coastal plain began at
5,100 years B.P, when the relative sea level reached
its maximum. From 5,100 years B.P on, the sed-
imentary evolution is a result of coastline progra-
dation with development of a mangrove system, in-
tercalated with short-term retrogradation events re-
sponsible for coastal erosion and deposition of old
and recent barrier dune-beach ridges (Souza Filho
and El-Robrini 1998, Behling et al. 2001).
The Bragança coastal plain is extremely irreg-
ular and jagged with a low gradient coast. Topo-
graphically, the study site is a low relief terrain. The
tidal flat, including a mangrove system, is character-
ized by local slopes varying around 1:3000 (0.033%)
with topographic breaks dissected by creeks. Salt
marshes constitute the highest areas of the coastal
plain with a topographic relief reaching 3 m above
the mean tidal level, while intertidal mangroves are
related to relief variations from 2 to 2.6 m. Suprati-
dal mangroves are associated with altitude variations
from 2.6 to 2.8 m above the mean tidal level. Conse-
quently, salt marshes are inundated only 28 days/yr.,
while mangroves remained flooded from 51 days/yr.
(supratidal mangrove) to 233 days/yr. (intertidal
mangrove) (Cohen et al. 2000).
The original vegetation of the coastal plateaus
An Acad Bras Cienc (2003)75 (3)

SYNTHETIC APERTURE RADAR FOR COASTAL APPLICATIONS 343
Fig. 1 – Location map and geomorphological compartments of the Bragança coastal plain.
is typical of the tropical rain forest. This vegetation
cover has been affected by anthropogenic activities,
such as agriculture and human settlements. Man-
grove forest is found on the tidal flat, grasses occur
along the marshes and arbustive vegetation occu-
pies the chenier sand ridges, dunes and backshore
An Acad Bras Cienc (2003)75 (3)

344 PEDRO W.M. SOUZA-FILHO and WALDIR R. PARADELLA
zone of the barrier-beach ridges (Souza Filho and
El-Robrini 1996).
3 DATA SET AND IMAGE PROCESSING
The investigation was based on airborne and or-
bital SAR data. The airborne imaging radar was
a SAR built by Goodyear Aerospace Corporation
(GEMS 1000), and operating in the X-HH band
(9,600 MHz), with nominal ground resolution
around 16 m. The north-south airborne flights, with
a westward looking direction, were carried out
along 1972 dry season as part of the RADAM
Project (Moreira 1973). The orbital SAR corre-
sponded to C-HH (5.3 GHz) band imagery related
to the RADARSAT-1 Fine Mode with a 10-meter
nominal ground resolution. Both SAR images were
acquired at high tide conditions.
The SAR’s ability to delineate the land/water
boundary and to map geomorphological features and
flooded vegetation is largely dependent on the inci-
dent angle (Leconte and Pultz 1991, Lewis et al.
1998). In low relief environments, small incidence
angles (10 to 25 degrees from vertical) will pro-
duce the maximum relief enhancement, but larger
incidence angles (25 to 59 degrees) will also re-
sult in acceptable terrain rendition by increasing
the terrain textural contrasts (Singhroy and Saint-
Jean 1999). Normally, the coastline delineation is
best achieved using large incidence angle (25-59 de-
grees) due to the high contrast in radar return from
land (surface and volume scattering mechanisms)
and water (specular reflection mechanism). How-
ever, surface variations and flooded vegetation are
best-characterized using small incidence angle (25-
40 degrees). In other to satisfy both requirements
the Fine Mode 1 of RADARSAT-1 data was selected
and the image was acquired in 1998 on a descending
pass (west-looking) during the dry season, as part of
the GLOBESAR-2 Program (Paradella et al. 1997).
Details of the SAR data used in the investigation are
presented in the Table I.
Digital image processing was carried out using
EASI-PACE software (PCI 1999). Previous stud-
ies in the Amazon have shown that some procedures
need to be applied to SAR due to the unique radar
viewing geometry, causing specific induced-relief
geometric distortions and the presence of speckle
(Paradella et al. 1998, 2000). Thus, the orbital data
was initially scaled from 16 to 8 bits. Due to the
fact that the area is related to an extremely low to-
pographic relief, the RADARSAT-1 image was ge-
ometrically corrected through an ortho-rectification
scheme assuming a flat terrain model. Fifty-six fea-
tures on the image were selected on the terrain and
the correspondent geographical information was ac-
quired during a GPS (Global Position System) field
campaign. The fifty-six GCP’s (Ground Control
Points) were used as input for the geometric mod-
eling. The statistics of the ortho-rectification in-
dicated a total accuracy error, as reflected by the
RMSE (Root Mean Square Error) residuals, around
12 meters and this value was used as the pixel size
for the geo-referenced scene.
In order to reduce speckle, one of the main
problems when dealing with SAR digital data
(Lopes et al. 1990), the adaptive enhanced-Frost
filter (3× 3 window) was used during the interpola-
tion phase of the ortho-rectification. The main steps
of the digital image processing are presented in the
flow chart of Figure 2. Finally, the image was lin-
early stretched in order to enhance contrasts between
the coastal features, and visually interpreted based
on conventional photointerpretation keys (tone, tex-
ture, pattern, form, size and context). Panchromatic
air-photos were also used as ancillary data during
the interpretation phase and ground truth data were
acquired during the field work.
The original GEMS 1000 strips were scanned,
mosaiced and digitally rectified to a common UTM
coordinates. Fifty-one GCPs input into a first order
polynomial transformation and the total accuracy in-
dicated by the RMSE for the geometric correction
was around 16 meters. The final airborne image was
generated based on a cubic convolution interpola-
tion and 12-meters pixel spacing to allow compar-
ison with the orbital SAR data. In order to extract
the shoreline position in 1972, the airborne image
was analyzed and the boundary between emerging
An Acad Bras Cienc (2003)75 (3)

SYNTHETIC APERTURE RADAR FOR COASTAL APPLICATIONS 345
TABLE I
Characteristics of the SAR data.
Platform Sensor Acquisition Angle of Spatial Image Azimuth
date incidence resolution (m) format direction
RADARSAT Fine Beam Mode 1 September, 37-40o 9, 1 × 8, 4 16-bits 282o
Aircraft GEMS 1000 1998, 1972 45-77o 16× 16 Analogic 270o
Scaling of
16 bits - 8 bits
Ground control point
selection
Mathematical model for
geometric correction
Geometric
ortho-correction
+
Speckle reduction
RADARSAT
16 bits
Reading of image orbit
Linear stretch
Input Data
Radiometri
c
Correction
Geometric
Correction
Enhancement
Pré-Processin
g
Phase:
and
Processin
g
Phase:
Assessment
of SAR ProductsRadargeologic
Interpretation
Pre-ProcessingPhase:
RadiometricCorrection
GeometricCorrection
and
ProcessingPhase:
Enhancement
Fig. 2 – Flow chart with the main steps of RADARSAT image
processing.
coastal areas and coastal water was automatically
extracted. The resulting land-water limit line was
converted from raster to vector and superimposed to
the RADARSAT-1 image allowing an effective mea-
surement of the spatial coastline changes during the
26-years period of the two SAR imageries.
4 RESULTS AND DISCUSSION
4.1 Coastal Geomorphological Mapping
Geoscientists make use of the same clues for radar
analysis that are applied for visual interpreta-
tion of aerial photographs and the identification of
forms and the interpretation of processes rely mainly
on image tonal and textural attributes. Texture de-
scribes the arrangement of spatial patterns or varia-
tion in tone within an area of the image. Based on vi-
sual interpretation of the RADARSAT-1 image, the
following six prominent geomorphological coastal
features were detected and examined in detail. In
addition, the orbital SAR data was also evaluated to
identify coastal environment features and shallow
water morphology (Figures 3 and 4).
Mangroves – The use of SAR imagery for the
delineation and mapping of mangrove forests along
tropical coasts is normally facilitate due to a high
contrast with water. A smooth body of water is
a specular reflector, reflecting most of the incident
microwave energy away from the sensor (very dark
grey tones). Areas not covered by water are diffuse
scatters, returning a larger proportion of incident mi-
crowave energy to the antenna (intermediate tones).
In the case of flooded vegetated areas, the radar sig-
nal, which reaches the water, is reflected away and
interacts with trunks and vice versa, forming corner
reflectors, thus resulting in a larger amount of the
signal being returned to the sensor (bright tones).
The mangrove ecosystem in the area has a width
of about 20 km and is densely covered by forests
located from the high spring tide to the mean tidal
level. The RADARSAT-1 image interpretation has
indicated that intertidal mangroves (trees∼ 20 m
An Acad Bras Cienc (2003)75 (3)

346 PEDRO W.M. SOUZA-FILHO and WALDIR R. PARADELLA
height) show microwave responses controlled by
the vegetation cover (volume scattering) and by wa-
ter/trunk interaction (double-bounce effects); this is
responsible for a very rough image texture and light-
gray tones allowing their discrimination (Figure 3).
The supratidal mangrove presents a similar behav-
ior, however mangrove trees are smaller and spaced,
presenting a reduced double-bounce effects. As ex-
pected, the image texture related to this target is finer
and dark-grayish (Figure 3).
Salt marshes – The inner (hinterland) and outer
(peninsula) marshes are situated in the supratidal
zone and are mainly flooded during equinoc-
tial tides, with sedimentation marked by mud depo-
sition carried from tidal fluxes along creeks (Souza
Filho and El-Robrini 1996). The RADARSAT-1 im-
age clearly outlines the marshes. The inner marsh,
completely flooded in the rainy season, is related
to a very dark tone in the SAR image due to a
quasi-specular response when the radar signal in-
teracts with water and aquatic vegetation (Figure 3).
The inner marsh also presents areas dominated by a
grass-coverage; hence the microwave responses in
the image are associated to a slightly rougher sur-
face with lighter gray tones (Figure 3). Finally, the
outer marsh presents the similar image pattern to the
inner one, indicating the same scattering mechanism
(Figure 3).
Chenier sand ridges – These landforms are
essentially old dune-beach ridges with associated
washover fans. They have a well-characterized to-
pographic geometry given by linear and curved
forms with boundaries marked by prograding tidal
mudflats (Souza Filho and El-Robrini 2000). The
chenier sand ridges are related to well-defined
RADARSAT-1 patterns expressed as striped smooth
surfaces with dark tones (Figure 3). These backscat-
tered responses seem to be related to a morpho-
sedimentary control given by the presence of dry
sandy sediments of old dune-beach ridges and
washover fans which are responsible for a low mois-
ture content and a lower microwave signal return.
Since the intertidal mangroves around the cheniers
are related to microwave responses controlled by
double-bounce mechanisms (light gray tone), the
image contrast favors the discrimination between
them (Souza Filho and Paradella 2002).
Barrier-dune beach ridges, tidal sandflats and
ebb-tidal deltas – These clastic sedimentary coastal
environments are the most dynamic of the study area
and deserve special attention because they repre-
sent one of the most sensitive indicators of coastal
changes and processes. Coastal sand dunes con-
sist of sandy sediments of tidal shoals and beaches
reworked by the wind and are currently migrating
landward over the mangrove deposits in the inter-
tidal mudflats. Transverse and pyramidal dunes are
composed of well-sorted and very fine quartz sands
and are partially or completely covered by vegeta-
tion. The beach ridges extend from the low spring
tidal levels to coastal dune-beach scarps that rep-
resent the higher spring tidal level in the intertidal
beach. The beaches have a linear and elongated form
along an east-west direction, with curved spits in
the longshore sediment transport direction (Souza
Filho et al. 2003). The beach ridges play a key role
in the protection of the backward areas, which are
characterized by the presence of slack water muddy
sediments, salt grasses, and mangrove trees. Tidal
sandflats occur along the coast between mean tidal
and low spring tidal levels. Sandy tidal shoals with
abundant ripples, megaripple marks, and sand waves
exposed at low tide are typical representatives of this
unit. Ebb deltas extend seaward from tidal creeks
in the form of large tidal deltas and are related to
shallow waters during high tides.
In the RADARSAT-1 scene, these coastal fea-
tures are shown as smooth and very dark image pat-
terns close to shoreline (Figure 3) due to specular
scattering mechanism of the microwave radiation by
the water. As a consequence, the landforms discrim-
ination are poor and it will be solely recognized at
low tide when they become exposed.
Shallow water morphology – Submerse sandy
banks and estuarine tidal channel have been previ-
ously mapped from the digital integration of orbital
optical and SAR data (Souza Filho and Paradella
2002). Very often, underwater morphology can be
An Acad Bras Cienc (2003)75 (3)

SYNTHETIC APERTURE RADAR FOR COASTAL APPLICATIONS 347
Fig. 3 – Detailed coastal geomorphology of Bragança plain from RADARSAT-1.
An Acad Bras Cienc (2003)75 (3)

348 PEDRO W.M. SOUZA-FILHO and WALDIR R. PARADELLA
Fig. 4 – Shallow water morphology from RADARSAT-1.
inferred from radar responses of ocean surficial cur-
rents and corresponding modulations of the shorter
gravity-capillary waves (Johannessen 2000). How-
ever, stronger winds tend to produce larger waves
and more rippling on the ocean surface with more
intense backscatter (lighter tones), which can cause
difficulties on the detection of the underwater mor-
phology. On the other hand, the detection of surf
zones is normally possible due to the typical surface
roughness of breaking surf and multiple reflections
from the bubbles (Lewis et al. 1998). These SAR
typical characteristics have allowed the mapping of
wave fronts in the surf zone, the analysis of the tidal
current interactions with bottom features and to lo-
cate submerse sandy banks (Figure 4).
Table II summarizes our assessment of the
RADARSAT-1 performance for coastal environ-
ment mapping for the Bragança area.
4.2 Mapping of Coastal Land Cover
The Bragança Coastal Plain has suffered fast and
dramatic changes in its landscape. The anthro-
pogenic impacts are basically related to the opening
of roads over the mangroves to access the beaches.
This process of unplanned coastal occupation has
brought damage to the environment, mainly related
the disposal of solid wastes along the beaches and
groundwater contamination (Souza Filho 2001).
An Acad Bras Cienc (2003)75 (3)

SYNTHETIC APERTURE RADAR FOR COASTAL APPLICATIONS 349
TABLE II
Interpretation of RADARSAT-1 image for coastal geomorphological mapping.
Coastal geological features and land-coverSAR image interpretation results
A. Coastal environments
Mangrove • Coastal areas dominated by forest with average
trees of 20 m high. Mangroves are associated
with rough surface and medium-light tones
(double-bounce).
Salt marsh • Coastal low-lying and water logged terrain
covered by grasses. Slightly rough surface and
dark tones on the SAR image.
Chenier sand ridge • Linear features with up to 4 m high covered by
arbustive vegetation. It is bounded by
mangrove forest and presents rough surface
and medium tones.
Coastal dunes • Linear features up to 6 m high covered by
arbustive vegetation. Slightly rough surface and
dark tones on the SAR image.
Barrier-beach ridge • Linear and flat features in the intertidal zone
without vegetation. Smooth surface and very
dark gray tones on the SAR texture.
Shallow water morphology • Smooth surface with very dark tones intercalated
with light tones defined by shorter gravity-
capillary waves.
B. Erosional settings
Coastal forms • From 500 to 1000 m of erosional forms mainly
identified in the open coast as curved shoreline.
Estuarine forms • From 30 to 400 m of straight erosional forms.
C. Depositional forms
Mangrove progradation • Coastal prograding areas covered by young
mangrove forest with until 1000 km of shoreline
accretion. Rough texture and light gray tones on
the SAR image.
D. Land cover
Regenerated mangrove • Coastal mangrove forest deforested and now
subject to regenerative process. Rough texture
and highlight tones due to corner reflection.
Deforested mangrove • Muddy soil exposed with smooth surface and
very dark gray tones.
Along the Bragança-Ajuruteua road, areas have been
detected where the mangrove ecosystems are com-
pletely deforested or under regeneration.
The interpretation of the RADARSAT-1 image
has allowed the mapping of land cover changes.
Roads are expressed as flat and linear features
bounded by mangrove forest. These areas are de-
picted as smooth surfaces with characteristic very
An Acad Bras Cienc (2003)75 (3)

350 PEDRO W.M. SOUZA-FILHO and WALDIR R. PARADELLA
dark striped patterns. Dark areas, resulting of spec-
ular scattering, are observed within the deforested
mangrove and indicate flooding of muddy sediments
by high spring tides (Figure 5). The natural re-
generated mangrove sites present sparse and short
vegetation distributed over the flat muddy morphol-
ogy. These factors cause radar/surface interaction
to be controlled by ‘‘corner reflector’’ mechanisms,
which are a result of high radar returns. Thus, the re-
generated mangrove site shows a rough texture with
high light gray tones (Figure 5). Note that the pres-
ence of an artificial lake, caused by a tidal creek
damping by the road, can also be seen in this figure.
4.3 Spatial and Temporal Analysis of
Shoreline Change
A number of potential shoreline datum or geomor-
phic features can be used to monitor historical shore-
line changes. However, in most situations, the high
water line, represented in the study site by the spring
high tide level (SHTL), has been demonstrated to
be the best indicator of the land-water interface for
historical shoreline comparison study (Crowell et
al. 1991). Hence, both airborne GEMS-1000 and
RADARSAT-1 images were acquired at same high
tide condition. The SHTL delineates the landward
extent of the last high tide, hence it is easily rec-
ognizable in the field and it can usually be detected
from airborne and spaceborne remotely sensed data.
The landward extent is represented by mangrove for-
est, which is easily discernible on SAR imageries,
and is one of the best geoindicators for evaluating
shoreline changes associated with erosional and de-
positional processes in muddy coasts (Souza Filho
2000b).
The changes in shoreline position for the
Bragança area were measured between 1972 and
1998 using information provided from the airborne
GEMS and the spaceborne RADARSAT-1 Fine im-
ages. The accuracy of the shoreline position for
the Bragança area was estimated from the RMSE
(root mean square error) of the geometric modeling
for both images, i. e., 16 m for the GEMS image
and 12 m for the RADARSAT-1 Fine image. When
considering the errors of both data altogether, the
maximum linear and quadratic error for the shore-
line position changes were estimated at± 28 meters
and 400 m2, respectively.
The impact of the natural dynamics at Bragança
Coastal Plain produced fast and dramatic changes in
the shoreline position during the last three decades.
Critical observations of large-scale coastal evolu-
tion from SAR imageries provided clues to the nat-
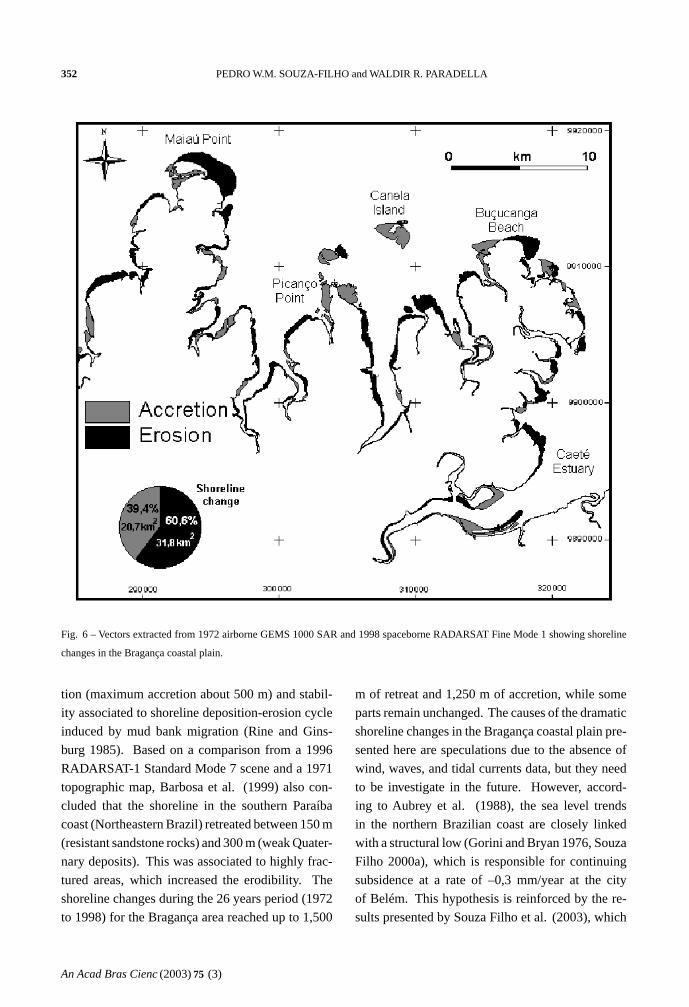
ural history. The comparison between 1972 and
1998 showed that the shoreline has been subjected
to severe erosion. Figure 6 shows the general re-
sults obtained from shoreline analysis from 1998
RADARSAT-1 and 1972 GEMS 1000 data. During
this period the shoreline was subjected to recession
of 31.78 km2 ± 0.4 km2 and accretion of 20.67
km2 ± 0.4 km2, which represent 60,6% of eroded
areas against 39.4% of added new areas. Therefore,
the local assessment of medium-term in shoreline
trends shows an erosional setting in the Bragança
coastal plain.
The decades shoreline recession during this
26 years period reached the maximum distances of
about 1, 500 m ± 28 m for the Maiaú Point, and
1, 250 m ± 28 m for the Buçucanga Beach, re-
spectively (Figure 7A and 7B). These erosional set-
tings represent the most seaward boundary of the
coastal plain, which receive little or no muddy sed-
iment. The main sedimentary process responsible
for the shoreline retreat is related to sandflats migra-
tion landward over the mangrove. Mangrove vege-
tation has been killed by rapid sand deposition over
it and mangrove terrace has been eroded. Hence,
a significant sector of the shoreline encompassing,
mainly, beaches, is characterized as transgressive
deposits (Souza Filho and El-Robrini 1998). The
shoreline accretion sectors are well represented by
the Picanço Point, where the shoreline position has
migrated around 1, 250 m ± 28 m seaward (Fig-
ure 7C). In this area, the continuous sediment sup-
ply and the geomorphological position, protected
from wave attacks, favor the accretion of sandbanks,
muddy deposition and mangrove vegetation estab-
lishment. Migration of islands is observed along
An Acad Bras Cienc (2003)75 (3)

SYNTHETIC APERTURE RADAR FOR COASTAL APPLICATIONS 351
Fig. 5 – Land cover mapping from RADARSAT-1.
the Maiaú Bay in response to oceanographic and
sedimentary processes. For example, the Maciel Is-
land migrated almost 1 km from 1972 to 1998 (Fig-
ure 7C).
Previous authors have also addressed the map-
ping of coastal erosion in SouthAmerica using SAR
data. Singhroy (1996) reported changes in the shore-
line along the Guyana coast, when comparing in-
formation extracted from 1992 airborne radar im-
ages and a 1972 topographic map. This comparison
showed that part of the coast was subjected to se-
vere erosion (maximum retreat about 500 m), accre-
An Acad Bras Cienc (2003)75 (3)
352 PEDRO W.M. SOUZA-FILHO and WALDIR R. PARADELLA
Fig. 6 – Vectors extracted from 1972 airborne GEMS 1000 SAR and 1998 spaceborne RADARSAT Fine Mode 1 showing shoreline
changes in the Bragança coastal plain.
tion (maximum accretion about 500 m) and stabil-
ity associated to shoreline deposition-erosion cycle
induced by mud bank migration (Rine and Gins-
burg 1985). Based on a comparison from a 1996
RADARSAT-1 Standard Mode 7 scene and a 1971
topographic map, Barbosa et al. (1999) also con-
cluded that the shoreline in the southern Paraíba
coast (Northeastern Brazil) retreated between 150 m
(resistant sandstone rocks) and 300 m (weak Quater-
nary deposits). This was associated to highly frac-
tured areas, which increased the erodibility. The
shoreline changes during the 26 years period (1972
to 1998) for the Bragança area reached up to 1,500
m of retreat and 1,250 m of accretion, while some
parts remain unchanged. The causes of the dramatic
shoreline changes in the Bragança coastal plain pre-
sented here are speculations due to the absence of
wind, waves, and tidal currents data, but they need
to be investigate in the future. However, accord-
ing to Aubrey et al. (1988), the sea level trends
in the northern Brazilian coast are closely linked
with a structural low (Gorini and Bryan 1976, Souza
Filho 2000a), which is responsible for continuing
subsidence at a rate of –0,3 mm/year at the city
of Belém. This hypothesis is reinforced by the re-
sults presented by Souza Filho et al. (2003), which
An Acad Bras Cienc (2003)75 (3)

SYNTHETIC APERTURE RADAR FOR COASTAL APPLICATIONS 353
Fig. 7 – 1998 RADARSAT image and superimposed vector showing shoreline changes since 1972, coastal erosion and accretion,
island migration and geomorphologic features. Maiaú Point (A) and Buçucanga Beach (B) erosional sector, and Picanço Point (C)
accretionary sector showing an island migration process.
An Acad Bras Cienc (2003)75 (3)

354 PEDRO W.M. SOUZA-FILHO and WALDIR R. PARADELLA
show the shoreline retreat due to landward migra-
tion of sandflats and dune-barrier-beach ridge over
mangrove deposits in response to tidal currents and
wave action. These processes are responsible for
development of transgressive sedimentary system,
where marine environments are overlying intertidal
deposits.
5 CONCLUSIONS
This paper has addressed the RADARSAT’s capa-
bility to provide unique geomorphological and land
cover mapping of the Bragança Coastal Plain. Fur-
thermore, the integration of information provided
by the orbital C-HH imagery with the airborne X-
HH SAR has allowed detecting and mapping coastal
changes related to the shoreline retreat and accre-
tion, during the 26 years period of both SAR acqui-
sitions. Sedimentary dynamic, tidal current, wave
action and estuarine and tidal channel displacements
have played an important role in controlling these
coastal changes.
Based on results obtained from SAR data anal-
ysis we can conclude that SAR imageries have pro-
vided valuable, rapid and accurate information on
coastal features recognition, coastal land-use assess-
ment, monitoring of shoreline changes and base
maps updating, which are basic components for an
integrated management program in this coastal zone.
SAR data provides greater details of the coastal en-
vironments and configuration of the shoreline and its
changes. The medium terms changes observed are
mainly related to the interaction between macrotidal
coastal processes and mangrove dynamics operating
in the surrounding area, as well as the variations in
estuaries discharges, sediment load and precipita-
tion.
The use of microwave remote sensing is par-
ticularly relevant when considering the tremendous
lack of information and the complexity of this fragile
and sensitive moist tropical environment. The na-
ture of the coastal dynamics related to winds, tides,
waves and currents must be investigated and com-
bined in the future to remote sensed data to explain
how multitemporal series of SAR images can be
used to generated a model of the spatial and tem-
poral variation of coastal changes on a macrotidal
mangrove coast in the Brazilian Amazon region.
ACKNOWLEGMENTS
The first author would like to thank the National In-
stitute for Space Research (INPE) for the structural
support for the digital image processing and the Fed-
eral University of Pará (UFPA) for the financial sup-
port for the fieldwork survey. Special thanks to Dr.
Robert Laundry (CCRS) and the Canadian Space
Agency for providing the RADARSAT-1 image un-
der the GlobeSAR-2 Program. Thanks are also ex-
tended to Dr. Maycira Costa (INPE) for helpful
comments on the manuscript. The first and second
authors would like to thank CNPq (Brazil) for re-
search grants received (CNPq # 303238/2002-0 and
# 300985/90-8, respectively).
RESUMO
Imagens de radar de abertura sintética (SAR) vem sendo
bem mais utilizadas do que antes nas aplicações de geo-
ciências em regiões tropicais úmidas. Nesta investigação,
uma imagem RADARSAT-1, na banda C, polarização
HH adquirida em 1998 foi usada para o mapeamento
costeiro e avaliação da cobertura da terra na área de Bra-
gança, norte do Brasil. Imagem do radar aerotransportado
GEMS-1000, na banda X, polarização HH, adquirida em
1972 durante o projeto RADAM foi também utilizada para
avaliar as variações costeiras ocorridas nas últimas três
décadas. A pesquisa tem confirmado a utilidade da im-
agem RADARSAT-1 para o mapeamento geomorfológico
e avaliação da cobertura da terra, particularmente em cos-
tas de manguezal de macromaré. Além disso, um novo
método para estimar as variações da linha de costa baseado
na superposição de vetores extraídos de diferentes ima-
gens SAR, com alta acurácia geométrica, tem mostrado
que a planície costeira de Bragança tem estado sujeita a
severa erosão responsável pelo recuo de aproximadamente
32 km2 e acreção de 20 km2, resultando em uma perda de
área de manguezal de aproximadamente 12 km2. Como
perspectiva de aplicação, dados SAR orbitais e aerotrans-
portados provaram ser uma importante fonte de infor-
An Acad Bras Cienc (2003)75 (3)

SYNTHETIC APERTURE RADAR FOR COASTAL APPLICATIONS 355
mação tanto para o mapeamento geomorfológico, quando
para o monitoramento de modificações costeiras em am-
bientes tropicais úmidos.
Palavras-chave: geomorfologia, mudanças costeiras,
sensoriamento remoto, manguezal, Amazonas.
REFERENCES
Aubrey DG, Emery KO and Uchupi E. 1988. Changing
coastal levels of South America and the Caribbean
region from tide-gauge records. Tectonophysics 154:
269-284.
Behling H, Cohen MCL and Lara RJ. 20001.
Studies on Holocene mangrove ecosystem dynam-
ics of the Bragança Peninsula in northeastern Pará,
Brazil. Palaeogeograph, -climatology, -ecology 167:
225-242.
Barbosa MP, Singhroy V and Saint-Jean R. 1999.
Mapping coastal erosion in Southern Paraíba,
Brazil from RADARSAT-1. Can J Remote Sens
25: 323-328.
Cohen MCL, Lara RJ, Szlafstein CF and Dittmar
T. 2000. Analysis of mangrove inundation by GIS
techniques. In:Barros H. (ed.), Sustainability of
estuaries and mangroves: challenges and prospects.
Recife: UFRPE/ISME, p. 1-10.
Costa MPF, Niemann O, Novo EMLM, Ahern F and
Mantovani JE. 2002. Biophysical properties and
mapping of aquatic vegetation during the hydrologi-
cal cycle of theAmazon floodplain using JERS-1 and
RADARSAT. Int J Remote Sens 23: 1401-1426.
Crowell M, Leatherman SP and Buckley MK. 1991.
Historical shoreline change: error analysis and map-
ping accuracy. J Coastal Res 7: 839-852.
DHN. 2000. Tábuas de Marés para 2000: Costa do Brasil
e alguns portos estrangeiros. Rio de Janeiro: DHN,
200, p. 9-11.
Ellis JM and Richmond DA. 1991. Mapping the
Coastal Plain of the Congo with Airborne Digital
Radar. Thematic Conf. on Geol. Remote Sensing,
8, 1991. Denver, USA. Proceedings... New York:
ISPRS, 1991, p. 87-100.
Forsberg BR, Hashimoto Y, Rosenqvist A and
Miranda FP. 2000. Tectonic fault control of wet-
land distributions in the Central Amazon revealed by
JERS-1 radar imagery. Quaternary Int 72: 61-66.
Gorini MA and Bryan GM. 1976. The tectonic fabric
of the Equatorial Atlantic and adjoining continental
margins: Gulf of Guinea to northeastern Brazil. An
Acad Bras Cienc 48 (supl.): 101-119.
Johannessen JA. 2000. Coastal observing systems: the
role of synthetic aperture radar. Johns Hopkins APL
Tech. Digest. 21: 7-14.
Kjerfve B, Perillo GME, Gardner LR, Rine JM, Dias
GTM and MocheL FR. 2002. Morphodynamics
of muddy environments along the Atlantic coasts of
North and South America. In:Healy TR et al.
(Ed), Healy Muddy Coasts of the World: Processes,
Deposits and Functions, Amserdam: Elsevier Sci-
ence, p. 479-532.
Kushwaha SPS, Dwivedi RS and Rao BRM. 2000.
Evaluating of various digital image processing tech-
niques for detection of coastal wetlands using ERS-1
SAR data. Int J Remote Sens 21: 565-579.
Leconte R and Pultz TJ. 1991. Evaluations of the
potential of RADARSAT for flood mapping using
simulated satellite imagery. Can J Remote Sens 17:
241-249.
Lee JS and Jurkevich B. 1990. Coastline Detection and
Tracing in SAR Images. IEEE Trans Geosci Remote
Sens 28: 662-668.
Lewis AJ, Henderson FM and Holcomb DW. 1998.
Radar fundamentals: the geoscience perspective. In:
Henderson FM and Lewis AJ. (Ed.), Principles &
Applications of Imaging Radar. Manual of Remote
Sensing, 3rd ed. NewYork: John Willey, p. 131-180.
Lopes A, Touzi R and Nezry E. 1990. Adaptive speckle
filters and scene heterogeneity. IEEE Trans Geosci
Remote Sens 28: 992-1000.
MacDonald HC, Lewis AJ and Wing RS. 1971. Map-
ping and LandformAnalysis of Coastal Regions with
Radar. Geol Soc Am Bull 82: 345-358.
Martorano LG, Perreira LC, Cézar EGM and Pe-
reira ICB. 1993. Estudos Climáticos do Estado do
Pará, Classificação Climática (Köppen) e Deficiência
Hídrica (Thornthwhite, Mather). Belém: SUDAM/
EMBRAPA, 59p.
Moreira HF. 1973. Controle de qualidade de imagens
de radar. Rio de Janeiro: Departamento Nacional de
Produção Mineral (DNPM), 1973, 64p. Technical
Report.
An Acad Bras Cienc (2003)75 (3)

356 PEDRO W.M. SOUZA-FILHO and WALDIR R. PARADELLA
Novo EMLM, Costa MPF and Mantovani JE. 1998.
RADARSAT exploratory survey on macrophyte bio-
physical parameters in tropical reservoirs. Can J Re-
mote Sens 24: 367-375.
Paradella WR, Krug T, Laundry R and Pietsch RW.
1997. GLOBESAR-2: O Programa de Avaliação de
Dados do RADARSAT-1 nas Geociências. Rev Bras
Geocienc 27: 403-406.
Paradella WR, Santos AR, Dall’Agnol R, Pietsch
RW and Sant’Anna MV. 1998. A Geological In-
vestigation Based on Airborne (SAREX) and Space-
borne (RADARSAT-1) SAR Integrated Products in
the Central Serra dos Carajás Granite Area, Brazil.
Can J Remote Sens 21: 376-392.
Paradella WR, Santos AR, Veneziani P and Morais
MC. 2000. Synthetic Aperture Radar for Geological
Applications in the Moist Tropics: Experiences from
the Brazilian Amazon Region. Rev Bras Geocienc
30: 538-542.
PCI. 1999. EASI-PACE User’s Manual, version 6.3. On-
tario: PCI Enterprises, 282p.
Proisy C, Mougin E, Fromard F, and Karam MA.
2000. Interpretation of polarimetric radar signa-
tures of mangrove forests. Remote Sens Environ 71:
56-66.
Projeto RADAM. 1973. Mapa Geomorfológico da Fo-
lha SA.23 São Luís e parte da Folha SA.24 Fortaleza.
Rio de Janeiro: DNPM.
Rine JM and Ginsburg RN. 1985. Depositional fa-
cies of a mud shoreface in Suriname, South America:
a mud analogue to sandy shallow-marine deposits.
Jour Sed Petrol 55: 633-652.
Rosenqvist Å, Forsberg BR, Pimentel T, Rauste YA
and Richey JE. 2002. The use of spaceborne radar
data to model inundation patterns and trace gas emis-
sions in the central Amazon floodplain. Int J Remote
Sens 23: 1303-1328.
Silva MGL. 2001. Avaliação multitemporal da dinâmica
costeira da praia do pescador, Bragança, Norte do
Brasil. Master Dissertation, Universidade Federal do
Pará (Centro de Geociências), Belém, Brazil. 113p.
Singhroy V. 1996. Interpretation of SAR images for
coastal zone mapping in Guyana. Can J Remote Sens
22: 317-328.
Singhroy V and Saint-Jean R. 1999. Effects of relief
on the selection of RADARSAT-1 incidence angle
for geological applications. Can J Remote Sens 25:
211-217.
Souza Filho PWM. 2000a. Tectonic control on the
coastal zone geomorphology of the northeastern Pará
State. Rev Bras Geocienc 30: 523-526.
Souza Filho PWM. 2000b. ‘‘Avaliação e aplicação
de dados de sensores remotos no estudo de ambi-
entes costeiros tropicais úmidos, Bragança, Norte do
Brasil’’. Ph.D. Thesis, Universidade Federal do Pará
(Centro de Geociências), Belém, Brazil. 219p.
Souza Filho PWM. 2001. Impactos naturais e antrópi-
cos na Planície Costeira de Bragança. In:Prost MT
and Mendes AC. (Ed.), Ecossitemas Costeiros:
Impactos e Gestão Ambiental. Belém: MPEG,
p.133-144.
Souza Filho PWM and El-Robrini M. 1996. Mor-
fologia, processos de sedimentação e litofácies dos
ambientes morfosedimentares da Planície Costeira
Bragantina – Nordeste do Pará (Brasil). Geonomos
4: 1-16.
Souza Filho PWM and El-Robrini M. 1998. As vari-
ações do nível do mar e a estratigrafia de seqüências
da Planície Costeira Bragantina - Nordeste do Pará,
Brasil. Bol Mus Par Emílio Goeldi, Série Ciênc Terra
10: 45-78.
Souza Filho PWM and El-Robrini M. 2000. Coastal
Zone Geomorphology of the Bragança Area, North-
east of Amazon Region, Brazil. Rev Bras Geocienc
30: 518-522.
Souza Filho PWM and Paradella WR. 2002. Recog-
nition of the main geobotanical features along the
Bragança mangrove coast (Brazilian Amazon Re-
gion) from Landsat TM and RADARSAT-1 data.
Wetl Ecol Manag 10: 123-132.
Souza Filho PWM, Tozzi HAM and El-Robrini M.
2003. Geomorphology, land-use and environmental
hazard in Ajuruteua macrotidal sandy beach, north-
eastern, Pará, Brazil. In:Klein et al. (Ed), Brazil-
ian Sandy Beaches: Morphodinamic, Ecology, Uses,
Hazards and Management. J Coastal Res, Special Is-
sue, 35 (in press).
An Acad Bras Cienc (2003)75 (3)