use of simulation modeling for predicting optimization of
TRANSCRIPT

107
___________________ Copyright © 2020 for this paper by its authors. Use permitted under Creative Commons License Attribution 4.0 International (CC BY 4.0).
Use of simulation modeling for predicting optimization of repair works at oil and gas production enterprises
Iryna Hobyr1[0000-0002-9322-8404], Vitalina Babenko2[0000-0002-4816-4579], Sofiia Kafka1[0000-0002-6031-383X], Yuliia Bui1[0000-0003-0096-2384],
Oksana Savko1[0000-0002-7282-7731] and Ekaterina Shmeltser3[0000-0001-6830-8747]
1 Ivano-Frankivsk National Technical University of Oil and Gas, 15 Karpatska Str., Ivano-Frankivsk, 76000, Ukraine
[email protected], [email protected], [email protected], [email protected]
2 V. N. Karazin Kharkiv National University, 4 Svobody Sq., Kharkiv, 61022, Ukraine [email protected]
3 State University of Economics and Technology, 5 Stepana Tilhy Str., Kryvyi Rih, 50006, Ukraine
Abstract. There is substantiated the expediency of using the methods of the queuing theory for supporting various business processes at enterprises. The task of mass service for the organization and management of repair services of oil and gas producing enterprises has been set. It is stated that the objective function of solving this task is the sum of costs for maintaining repair crews and the reduction of losses from well downtime. It is proved that to solve the problem of optimizing the process of repair work at the researched enterprises it is necessary to use modeling as one of the effective tools of prediction, which do not require to bring the researched models to a specific form and allows to predict systems in different states and industries. A simulation model of the organization of repair works in wells is given. Testing of simulation models is carried out on the example of the fields of the three largest oil and gas producing enterprises in the Western region of Ukraine, it allowed to establish the laws of distribution of failures of oilfield equipment on fields, the process of which includes operations related to the creation, transformation and implementation of random events, quantities and processes that cause random changes in the state of the system. And also, to make calculations of the optimal between-repairs periods, total costs of well servicing processes, losses from their downtimes and optimum quantity of crews at various options of intensity of failures.
Keywords: oil and gas companies, queuing theory, repair crews, repairs, simulation and prediction, wells.
108
1 Introduction
Rational organization of maintenance and repair is a determining factor in improving the use of equipment, improving the quality and reducing the cost of production, which generally contributes to the sustainability of the enterprise.
The need to increase the productivity of equipment while maintaining the maximum possible level of reliability in the enterprise and reducing the cost of oil and gas production requires improvement of the system of technical exploitation of equipment.
When assessing the various forms and methods of maintenance and repair, it is necessary to take into account technical and technological, organizational, economic and social factors. The technical and technological factors include the technological complexity of the assessed type of repair works and the technical characteristics of the machinery and equipment required for their performance, qualified personnel requirements. Analysis of the technical feasibility of options for the organization of repair and maintenance is to establish the possibility of work and operations in full compliance with the technical conditions, to identify the advantages and disadvantages of the options for the organization in terms of improving equipment and technology.
Maintenance could be preventive or predictive and it is aimed at applying knowledge of engineering and maintenance capabilities to ensure improved performance and reduction in their rate of failure. Furthermore, this maintenance could include periodic examination in terms of regular walk through to spot change in operating conditions, sounds or temperature. It also includes inspection programs, lubrications among others [13].
Organizational factors include the need for repair services, the estimated volume of specific services, the presence or absence of necessary to perform certain services production capacity, the degree of use of production capacity of repair services, the ability to perform certain services (works) in order to replenish existing production capacity and personnel.
Economic factors include: the level of costs for services and their payment by the consumer; volume of capital investments and sources and conditions of their financing; implementation of certain tax reliefs in relation to enterprises and entrepreneurs providing production and technical services.
To increase the efficiency of oil and gas production enterprises, it is necessary to ensure the continuity of the oil and gas production process, which directly depends on the level, maintenance and repair of wells. With aging equipment and facilities, enterprises face increasing challenges in maintaining equipment reliability and integrity as well as operational safety [8]. That why the organization of special maintenance and repair (current and capital) is associated with the wear of operating equipment and the need for a set of special measures for its restoration. At the same time, the development and operation of oil and gas fields in difficult conditions requires the development of advanced forms of service, which ultimately lead to increased efficiency of oil production, profit growth and cost reduction. That is why increasing the efficiency of repair work on deposits is an urgent problem that has both scientific and practical value.
For oil and gas production enterprises, the optimization and prediction of repair services in wells requires the use of scientific methods to model situations that arise in

109
oil and gas production close to reality. This will allow us to choose possible management strategies using different criteria because when optimizing the operation of the well fund it is important to take into account the economic feasibility of applying one or another strategy depending on the number of repair crews and the duration of the repair period.
2 Features of repair works at oil and gas production enterprises
Oil and gas production enterprises are an integral part of the oil and gas complex of Ukraine. They have a significant social and economic impact on the living standard of the country, providing the population, budgetary and communal institutions with natural gas. Their functioning is accompanied by a complex technological and production cycle and significant risks associated with their activities [9].
The continuity of the oil and gas production process largely depends on the operation, maintenance and repair of wells. The need to organize special maintenance and repair of production wells is associated with the wear and tear of operating equipment and the need to implement a set of special measures for the protection of subsoil. The main task of repair units of oil and gas production enterprises is to maintain in working order the operational fund of wells, to prevent wear and tear of equipment that can cause accidents and downtime of wells. Work on repair maintenance of wells involves current repairs and overhauls of wells and maintenance of operating equipment in the period between regular repairs.
The scientific literature identifies the following reasons that necessitate repair works in oil wells [2; 11; 17]:
the need to re-equip wells in accordance with the conditions of field development; the need for planned periodic stops during long-term operation to prevent equipment,
change the mode of operation, method of operation or purpose of the well, geological and technical measures to increase the productivity of the well;
the need to restore normal operation of wells in the presence of various complications (deposits: salts, paraffin, asphalting-resinous substances, water manifestations, formation of hydrates, corrosion, etc.);
requirements of technology of rational development of a deposit or formation; non-compliance of the construction of wells with the conditions of operation and
development of the field, requirements for subsoil and environmental protection; occurrence of emergencies or accidents related to well equipment, research
instruments, etc.
One of the ways to solve the problem of ensuring the effective organization of any work is to improve the system of their planning, accounting and monitoring. The most important tool of this system is the classifier, which is a systematic list of named objects, each of which is given a unique code. The classification of objects is carried out in accordance with the rules of distribution of a given set of objects into classification groups in accordance with the established signs of their differences or similarities.

110
Current (underground) repair of wells is called a set of works, which is associated with maintaining well equipment in working order and maintaining a given mode of operation of wells. The following works belong to the current repair [2]:
equipping the well with underground equipment during commissioning or changing the method of operation;
ensuring the optimization of operation of wells; restoration of serviceability of downhole and mouth equipment; cleaning and washing of the lifting column of pipes from paraffin and salt deposits,
hydrate and sand plugs.
Overhaul of wells is a set of complex and long-term works related to maintaining the well as a building in working order, i.e. it is a set of works designed to restore the serviceability of the bottomhole zone, the integrity of the cement ring and casing or the well in general for its use as existing or new purpose, elimination of accidents, conservation and liquidation of wells, lowering and raising of equipment for simultaneous and separate operation, as well as for actions on the productive layer and regulation of field development. The average duration of one overhaul is approximately 14 days. Overhaul of wells includes [2]:
repair and insulation works; elimination of leaks in the operating column; elimination of accidents; transition to other layers and joining layers; repair of wells equipped for simultaneous and separate operation; works related to drilling; processing of the bottomhole zone; research and inspection of wells during repairs; transfer of wells for use for other purposes; commissioning and repair of injection wells; work on injection of radioactive
isotopes into the formation; conservation and deconservation of wells; elimination of wells.
Repair works in wells also include well-repair operations to increase oil and gas extraction from layer. This is a set of works in the well for the injection into the layer of agents that stimulate the flow of physical, chemical or biochemical processes aimed at increasing the coefficient of final oil and gas layer in a given area of the deposit.
In addition, repair works are further subdivided depending on the category of repair complexity. Current repairs, depending on the depth to which the equipment is lowered into the well, and the types of work performed are divided into two categories of repair complexity. The first category, in contrast to the second, contains simpler types of repairs, as well as more complex works at small depths of equipment lowering (up to 700 – 1600 m, depending on the type of works).
Overhauls of wells depending on the volume, nature and complexity of work are also divided into two categories of complexity. Overhauls of wells of the first category of

111
complexity include repairs with a depth of wells up to 1500 m, as well as return to the upper and lower layers and hydrochloric acid treatments. Repairs of the second category of complexity include works with a depth of wells over 1500 m and all other more complex and time-consuming works. Specific categories of complexity are approved by the company.
Current repairs and overhauls of oil and gas production enterprises are carried out by economic and contractual methods. In the case of the economic method, the repair is carried out by oil and gas production enterprises by, respectively, maintenance and wells of specialized shops of current repair of wells or shops of current and overhaul of wells, as well as crews of overhaul of wells.
Current repairs and overhauls are necessary to ensure the continuity of oil and gas production, and they cannot be avoided, as there is a risk of accidents, the elimination of which requires much more time and money.
The reserve for reducing unproductive working time costs of well overhaul and current well repair crews is combining professions, which will allow them to perform part of non-repair work carried out during overhaul and underground well repairs. It will significantly reduce unproductive time due to the absence or malfunction of the lifting unit of the technological fleet of equipment for crews of current repairs and crews of overhaul of wells, as more than 75% of the equipment has already exhausted its service life.
In order to optimize the current repairs of wells and overhauls of wells, it is necessary to involve third-party organizations in their implementation, as the crews of enterprises can not perform all the necessary work on time according to the schedules of current repairs and overhauls of wells. The current trend of involving well overhaul crews in the implementation of current repairs has a negative impact on the volume of well overhauls.
The largest number of current repairs is accounted for oil wells. The main reasons for current repairs of wells are the operation of the pump valves, wear of the steam plunger-bushing, displacement of the bushing. In all methods of well operation, and most of all in the development using rod-deep pumps, in the extraction of oils with a high content of paraffin in the risers and discharge lines, paraffin accumulates, which disrupts the normal operation of wells. A study of the volume of underground repairs, depending on the method of operation, shows that the largest number of underground repairs are performed on wells equipped with rod-deep pumps. This is due to the fact that the rod-deep pumps operate in an aggressive environment with water content of the fields at 60% and above and a significant salt content. Most of the current repairs of wells with rod pumps are related to the need to eliminate breakage of the rods and various seizures of the tubing, because some of the rods work in a corrosive environment in which the metal is corroded.
Optimizing the organization of repair maintenance of wells requires the introduction of a system of planned and preventive repairs and distribution of work between structural units of enterprises and third-party organizations, which, ultimately, will minimize costs and quality work. The combination of repair work with intensification of oil and gas production should be continued, as it allows to achieve time savings through preparatory and final works, well silencing works, lowering and lifting

112
operations, which leads to an increase in total oil and gas production and savings on some types of ancillary work. A significant reserve for improving the organization of repair services is the specialization in the performance of preparatory and final works of one of the teams and the improvement of technical support by updating the fleet of repair equipment. This will minimize downtime of repair crews and increase the share and amount of time of direct repair work in the overall balance of the calendar time of crews of overhaul and current repair of wells.
3 The task of mass service for the organization and management of repair services of oil and gas production enterprises
Making complex managerial decisions involves predicting scenarios of events and consequences of taking certain decisions for the activities of enterprises [18]. Therefore, to ensure undisturbed operation of equipment at enterprises [14], support a variety of business processes [6] and different sectors of the economy [16] the theory of queuing is widely used.
Since an insufficient number of repair crews at oil and gas production enterprises or untimely maintenance can lead to well downtime and significant damage, therefore well repair by crews can be considered as a multi-channel queuing system with applications for repairs as a stream of service requirements. The maintenance procedure consists in the allocation of a repair crew according to the application. The application is considered to be satisfied after the completion of the work of the crew at the facility. There is a queue of applications to be satisfied in the order they are received. The application, which is received when all the repair crews are busy, remains in the system until it is satisfied.
When setting the queuing problem for the organization and management of repair services of oil and gas companies, it is assumed that the system has N repair teams (absolutely reliable service channels). Demand for repair crews is characterized by the flow of applications from individual wells requiring the jth type of work. The intensity of the flow of applications for the repair team from the ith well, requires the jth type of work (the average number of applications per unit time), is λij. The duration of the work by the repair team at the ith well, which requires the jth type of work, is tij days. It is assumed that tij is a random variable having one or another distribution law. It is also necessary to enter a value μ = 1/Tij – the intensity of servicing applications, where Tij is the average duration of the crew’s work at the facility.
The condition for the existence of a stationary mode of operation of the queuing system (when the queue of service applications is stabilized) is the inequality as follows
푁 > 휌 = 휆/휇 (1)
where λ = (b/a)(t/a)b–1 is the rate of unprocessed applications. The parameter ρ, which is called the loading of the service channel, plays a pivotal
role in any characteristics of the system: the greater is the load and the closer is the performance boundary, the longer is the average time of requirements in the system,
113
that is, there are more downtimes of wells. The objective function in solving the problem of substantiating the need for repair
crews is the average amount of expenses for their maintenance and losses from downtime of wells:
퐶 = (퐶 푁 + 퐶 푁 ) + ∑ 푄 푀 , 푖 = 1,푚, (2)
where 퐶 are fixed costs of an hour work of the ith crew; Ni is the number of i repair crews; 퐶 are semi-variable costs of an hour work of the ith crew; 푁 is the average number of working i teams, equal to ρ; 푄 are hourly average losses from downtime of the jth well; We assume that the sequence of moments of applications receipt for repair crews is
a Poisson stream, and the duration of their work during well repairs is distributed exponentially. If condition (2) is satisfied, then the average number of idle wells is as follows
푀 =( )!( )
푝 (3)
The value 푝 is the probability of simultaneous downtime of all wells, which is determined by the formula:
푝 =∑ ! !( / )
(4)
In fact, the flow of applications is not always subject to Poisson distribution law, or there are no assumptions regarding the law of distribution. In this case, simulation can be applied for the rational management.
4 Prediction of optimizing the repair works using simulation
Simulation is widely used to predict the activities of the enterprise and select an acceptable scenario, as well as to minimize possible risks. It is used to overcome stochasticity [10], to plan the operation of production systems [4; 5], allows you to model the operation of systems in different industries [15] and make optimal management decisions [12].
This approach has considerable flexibility, and the model obtained as a result of a simulation experiment can be brought into line with the system under study [1; 3].
The main reasons for the popularity of the simulation method in relation to queuing systems are:
high adequacy between the physical essence of the described process and its mathematical model;
the ability to model a much wider class of systems compared to analytical methods;

114
the ability to model the operation of systems with different laws of distribution of numerous random variables;
modeling the functioning of systems not only in steady but also in transient modes; the possibility of obtaining as a result of modeling more meaningful information,
including numerical characteristics of the laws of distribution of random variables that describe the operation of the system.
The simulation process includes a significant number of operations related to the formation, transformation and description of the occurrence of random events, random variables and random processes that accompany random changes in the states of the system. Therefore, the trajectories of the motion of a complex system in the set of its states, which are obtained by imitation, are random functions of time. The source material for making any random objects is the so-called random numbers specified by the random number sensor. Random numbers can be considered as possible values xi of a random variable ξ, approximately described by the normal distribution law in the interval (0; 1). The methods of constructing various complex random objects from random numbers have been sufficiently developed at present and are called the conversion of random numbers.
If there are no free repair crews in the system to meet the next application, a downtime of the ith well arises, and it requires the completion of the j type of work, the duration of which is τij in days and depends on the moment the repair crew is free having fulfilled a previous task (application).
The objective function of the mathematical model of the process of providing wells with repair crews is as follows
(5)
where Ca are average annual maintenance costs for crews; Cij are the average daily losses from the downtime of the ith well that requires the
completion of the jth type of work; Tc is the moment of the process stabilization. In case of simulation, the state of the system at the next moment in time depends on
its state at the previous moment. At the beginning of the simulation, it is necessary to set the initial state of the system, which is unknown. If we accept that all the repair crews are free at the initial moment, then it takes some time to get an objective picture of the use of the crews. We call it the duration of the process stabilization and assume that the process has reached stabilization if the relative downtimes of the crews have stabilized, that is, the following condition is fulfilled
(6)
where Δτ(Tc) is an accumulated relative duration of downtime by the crews at the moment Tc:
min,0 1 1
cT
t
n
j
m
iijija CNCC
10 cc TT

115
Δτ(Tc)=∑ ∑ ∑
(7)
where ε is the predetermined value. The value ε determines the accuracy of calculations in the simulation process. The
reduction in formula (6) is the relative downtime of the crews at the moment of the process stabilization, and the denominator is the same at the previous moment of time. The difference must be non-zero, otherwise, due to the fact that all crews are free and the downtimes are equal to zero level at the beginning of the simulation, it will end without starting.
Due to the fact that the cost of maintaining repair crews is calculated on an annual average, the simulation should last until the time equal to one year. An additional condition is therefore required
Tc < Tr (8)
where Tr is one year in units of measurement of time modeling. If condition (8) is not fulfilled, the simulation should be extended to two, three years
and, if necessary, further, which should be taken into account when determining the scale of maintenance costs for repair crews.
Expressions (1)-(8) constitute a mathematical model of the well service process, where expression (5) is a goal function and others are constraints.
To solve the problem, we need the following data:
a list of wells that should be serviced by repair crews; types and parameters of laws for the distribution of applications for crews and the
duration of repair works for each well; losses from well downtime per unit of time; average annual maintenance costs for one crew; the number of repair crews (the minimum number of crews is determined on the
basis of condition (1) and then increases by one at each calculation cycle until the value of the objective function (5) begins to decrease);
the value ε, the moment of completion of calculations.
5 Algorithm for modeling repair work in wells
In fig. 1 unit 1 simulates the time of the next application for the crew of the jth well. For this, the random number sensor provides a random number, which is uniformly distributed in the interval [0, 1]. Depending on the parameters of the selected law for the distribution of applications for repair crews according to a special program, this random number turns into a random number corresponding to a given distribution law.
Unit 2 chooses the moment of the earliest application. This moment is at the same time the next moment of modeling, that is, the program “goes” at this moment into the real timescale.
116
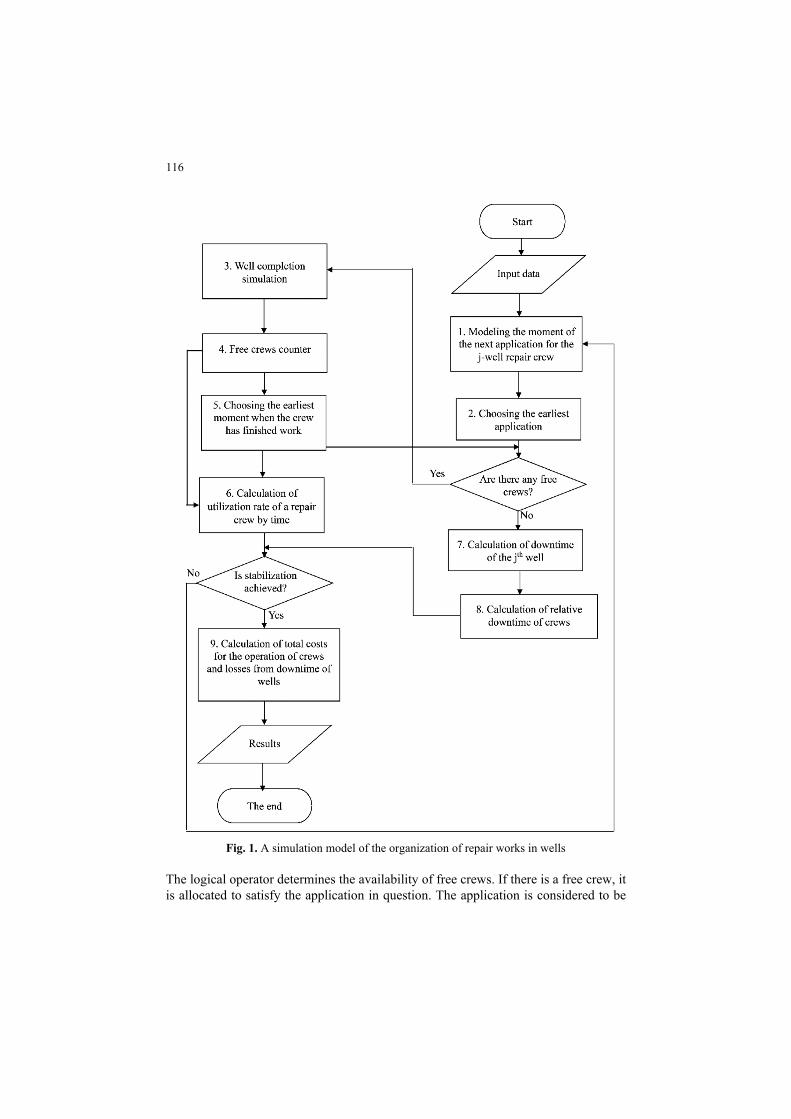
Fig. 1. A simulation model of the organization of repair works in wells
The logical operator determines the availability of free crews. If there is a free crew, it is allocated to satisfy the application in question. The application is considered to be

117
satisfied, and the repair team – busy with repair works until the end of work at the facility, which is modeled by unit 3.
Unit 3 functions similarly to unit 1, but converts a uniformly distributed random number in accordance with the distribution law of the duration of the repair crew work on the jth well. Information on the work of the repair crew is transmitted to unit 4, just like the information being produced by unit 5.
Unit 6 determines the utilization rate of the repair crew in time as the ratio of the number of busy crews to the total number of repair crews N to determine the moment of the process stabilization under the condition similar to condition (6).
When the logical unit determines the absence of crews during the next application for the repair work, the unit 7 comes into operation, which determines the downtime of the well as the difference between the earliest time the crew is free and the moment the application arrived.
Unit 8 calculates the relative duration of well downtime, and the logical unit determines whether stabilization of the process has been achieved under conditions (6) and (8). If the answer to this question is negative, the modeling procedure continues; if the answer is positive, block 9 calculates the total costs for maintaining the crews, losses from well downtime and determines the value of the objective function by summing the cost components (5).
The components of cost and the value of the objective function (5) are printed, after that adjustments are made to the initial data, and the specified number of crews is increased by one. This continues until the value of the objective function decreases. Its increase indicates that the optimal number of repair crews is obtained at the previous stage of modeling.
An exhaustive characteristic of the reliability of oilfield equipment is the law of distribution of time between failure. If the form of this law and its parameters are known, then it is relatively easy to determine any characteristic of the operational reliability of the system. A statistical definition of the law of uptime is associated with significant difficulties.
To set it, according to the statistical data, graphs of statistical functions of the reliability indicator are built. Since the density of distribution more clearly reflects the specific features of the distribution law, then, as a rule, this function is first built so that one could assume the form of the distribution law according to its form.
When constructing the statistical function of the distribution density along the abscissa, the intervals of the statistical series are laid aside. At each interval of the statistical series there is a rectangle, the height of which is equal to the ratio of the frequency to the width of the interval.
When processing statistical material, an important task is the selection of the theoretical distribution law, which expresses its essential properties without an element of randomness.
The theoretical law is chosen, taking also into account:
the physical nature of failures; the shape of the distribution density curve; the coefficient of variation.
118
The value of the coefficient of variation is determined by the formula
푉 = ̅ (9)
where 휎 is the standard deviation; 푡̅ is the average value of the system uptime, allowing to judge the operating conditions of oilfield equipment.
It is known that if a coefficient of variation is V < 0,3, a normal distribution takes place, and if V > 0,5, there is a Weibull distribution. The Weibull distribution function has the following form
(10)
where а і b are Weibull distribution parameters. The parameter b can be determined through the coefficient of variation. The
parameter a is calculated from the expression a = 푡̅ / Kb or a = 휎 / Cb, where Kb and Cb are the coefficients determined with the known coefficient of variation. When b = 1, the Weibull distribution transforms to the exponential, and when b = 2,5 – 3,5 it is close to the normal one. Therefore, the Weibull distribution is considered as a very flexible law and is widely used in reliability theory. Obviously, the Weibull distribution takes place for equipment failures resulting from its wear and aging, as well as for device failures consisting of series-connected elements.
Thus, the possibilities of using the methods of the theory of queuing in decision-making on the organization and management of repair services at oil and gas production enterprises are substantiated. The proposed simulation model makes it possible to optimize the organization of repair work at oil and gas production enterprises, and its implementation reduces the cost of maintenance of repair crews and reduces losses from well downtime.
6 Application of models of organization of repair work
Practical application of the proposed models of the organization of repair works has been carried out on the example of the fields of the largest oil and gas production enterprises (OGPE) of the public joint-stock company Ukrnafta - OGPE Boryslavnaftogaz, OGPE Dolynanaftogaz and OGPE Nadvirna Naftogaz. Based on the results of processing the field data, there were established the laws for the distribution of failures of oilfield equipment in the fields, described by the Weibull distribution.
So, breaks in tubing in oil and gas fields obey the law of probability of failure-free operation, which is described by the expression
(11)
Figure 2 shows the probability distribution functions of the failure-free operation and the failure rate of tubing (breaks) at the fields of OGPE Dolynanaftogaz.
The following parameter values are accepted for calculations:
])/(exp[1)( battF
8,1
496exp)( ttP

119
Tij = 24 days – the average duration of a repair crew use at the facility; 퐶 = 51,5 conventional units – fixed costs in the cost of an hour work by the
crew; 퐶 = 49,5 conventional units – conditionally variable costs in the cost of an hour
work by the crew; Qj = 620,3 conventional units – hourly average losses from idle jth well.
Fig. 2. The probability distribution functions of uptime and failure rate of tubing (breaks) in the
fields of OGPE Dolynanaftogaz.
Based on the distribution of the probability of failure-free operation established by law, there are calculated the optimal between-repairs period and failure rates. The calculation results are summarized in Table 1.
Table 1. Optimum between-repairs periods and failure rates.
Optimal between-repairs period, days Failure rates of the well, λ 226 0,001935 254 0,002125 308 0,002479
Table 2 presents the results of the calculation of costs depending on the number of crews at a failure rate λ = 0,001935.
With an increase in the number of crews from 7 to 11, a sharp (9 crews) decrease in total costs occurs first. The involvement of the 12th crew becomes impractical, since the total costs increase due to the additional costs of maintaining the crews. The total costs include the costs of maintaining crews and oil losses during wells downtime, that

120
is, they can be adjusted due to one or another component.
Table 2. Total costs for well maintenance processes at failure rate λ = 0,001935.
The number of repair crews 7 8 9 10 11 12 Losses from downtime, conv. units 8301,47 1481,36 506,09 197,19 79,65 32,06 The cost of maintaining repair crews, conv. units 675,11 725,63 777,11 827,62 878,13 929,62
Total cost, conv. units 9002,81 2233,22 1308,46 1051,04 984,01 987,90
Table 3 shows the results of cost calculation depending on the number of crews with the failure rate λ = 0,002125.
When analyzing the dependencies (table 3), a similar trend is observed for the dependencies presented in table 2. That is, the optimal number of repair crews is 12. The involvement of another crew is unprofitable. Although losses from downtime continue to decline, at the same time, costs for crews are growing, which, in turn, increases total costs by 2,8%.
Table 3. Total costs of well servicing processes at failure rate λ = 0,002125.
The number of repair crews 7 8 9 10 11 12 13 Losses from downtime, conv. units 13555,70 1804,84 597,40 233,13 94,22 38,86 15,54
The cost of maintaining repair crews, conv. units 701,34 751,85 803,34 853,85 904,36 955,84 1006,36
Total cost, conv. units 14256,07 2556,69 1399,77 1086,01 999,56 993,73 1021,90
Table 4 shows the results of cost calculation depending on the number of crews with the failure rate λ = 0,002479.
Table 4. Total costs of well servicing processes at failure rate λ = 0,002479.
The number of repair crews 8 9 10 11 12 13 14 Losses from downtime, conv. units
8351,01 1664,96 597,40 243,82 103,94 43,71 18,46
The cost of maintaining repair crews, conv. units
801,39 851,91 902,42 953,90 1004,41 1055,90 1106,41
Total cost, conv. units 9152,41 2516,86 1499,82 1197,72 1107,38 1098,64 1123,89
With the failure rate λ = 0,002479, the optimal number of crews is 13, so that total costs decrease by 0,8% due to a decrease in loss from downtime by 57,9%.
7 Determining the optimal number of crews for various failure rates
If the failure rate is λ = 0,001935, the optimal number of crews is 11, the total costs are 984,01 conventional units, if λ = 0,002125 – respectively 12 and 993,73 conventional
121
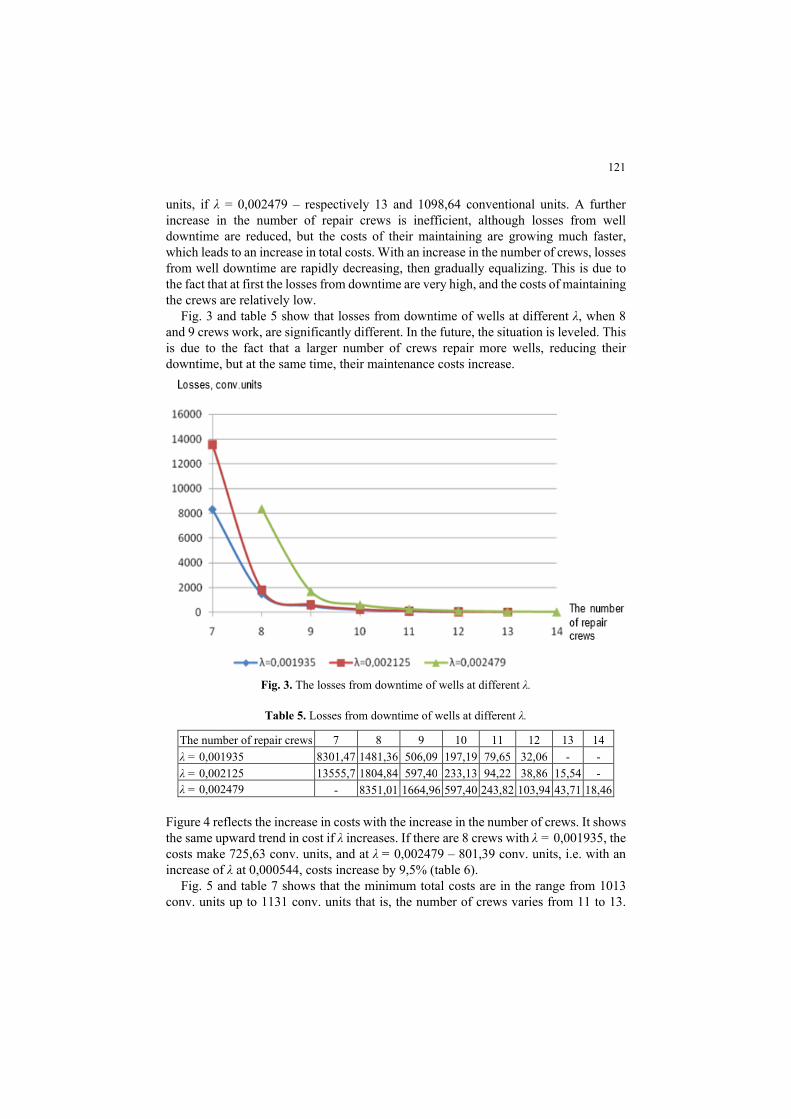
units, if λ = 0,002479 – respectively 13 and 1098,64 conventional units. A further increase in the number of repair crews is inefficient, although losses from well downtime are reduced, but the costs of their maintaining are growing much faster, which leads to an increase in total costs. With an increase in the number of crews, losses from well downtime are rapidly decreasing, then gradually equalizing. This is due to the fact that at first the losses from downtime are very high, and the costs of maintaining the crews are relatively low.
Fig. 3 and table 5 show that losses from downtime of wells at different λ, when 8 and 9 crews work, are significantly different. In the future, the situation is leveled. This is due to the fact that a larger number of crews repair more wells, reducing their downtime, but at the same time, their maintenance costs increase.
Fig. 3. The losses from downtime of wells at different λ.
Table 5. Losses from downtime of wells at different λ.
The number of repair crews 7 8 9 10 11 12 13 14 λ = 0,001935 8301,47 1481,36 506,09 197,19 79,65 32,06 - - λ = 0,002125 13555,7 1804,84 597,40 233,13 94,22 38,86 15,54 - λ = 0,002479 - 8351,01 1664,96 597,40 243,82 103,94 43,71 18,46
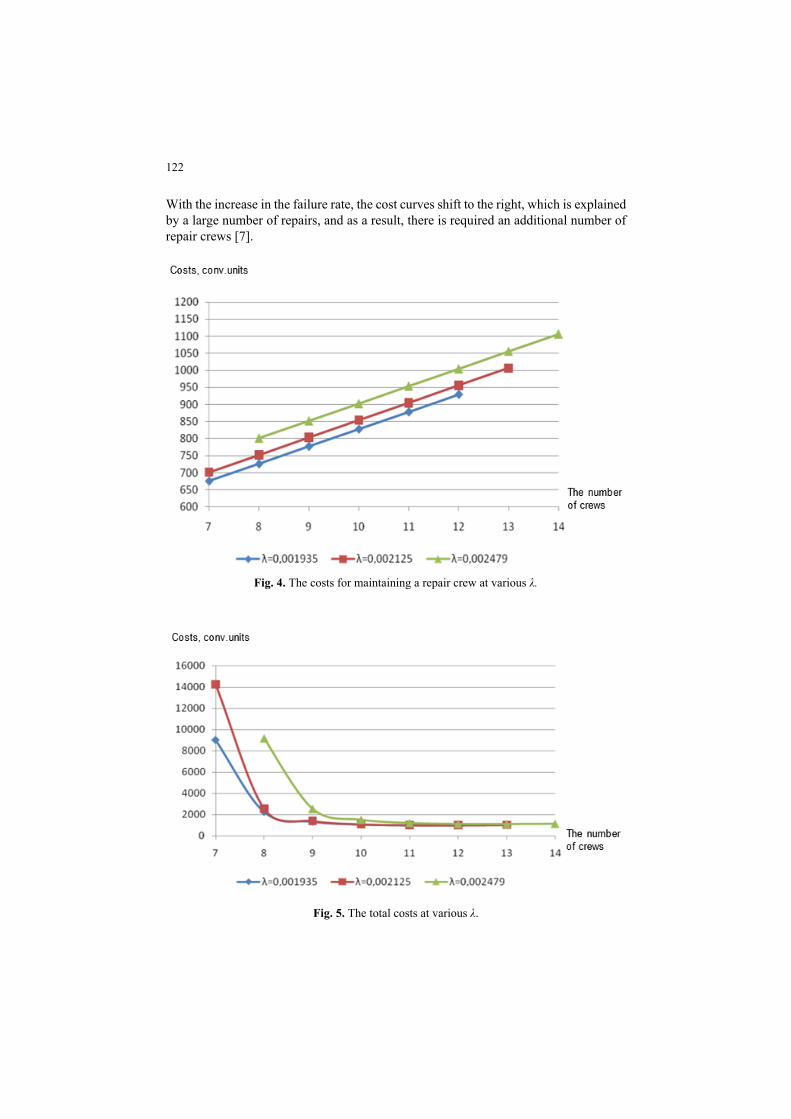
Figure 4 reflects the increase in costs with the increase in the number of crews. It shows the same upward trend in cost if λ increases. If there are 8 crews with λ = 0,001935, the costs make 725,63 conv. units, and at λ = 0,002479 – 801,39 conv. units, i.e. with an increase of λ at 0,000544, costs increase by 9,5% (table 6).
Fig. 5 and table 7 shows that the minimum total costs are in the range from 1013 conv. units up to 1131 conv. units that is, the number of crews varies from 11 to 13.
122
With the increase in the failure rate, the cost curves shift to the right, which is explained by a large number of repairs, and as a result, there is required an additional number of repair crews [7].
Fig. 4. The costs for maintaining a repair crew at various λ.
Fig. 5. The total costs at various λ.

123
Table 6. The total costs of well servicing processes for various λ.
The number of repair crews 7 8 9 10 11 12 13 14 λ = 0,001935 675,11 725,63 777,11 827,62 878,13 929,62 - - λ = 0,002125 701,34 751,85 803,34 853,85 904,36 955,84 1006,36 - λ = 0,002479 - 801,39 851,91 902,42 953,90 1004,41 1055,90 1106,41
Table 7. The total costs of well servicing processes for various λ.
The number of repair crews
7 8 9 10 11 12 13 14
λ = 0,001935 9002,81 2233,22 1308,46 1051,04 984,01 987,90 - - λ = 0,002125 14256,1 2556,69 1399,77 1086,01 999,56 993,73 1021,90 - λ = 0,002479 - 9152,41 2516,86 1499,82 1197,72 1107,38 1098,64 1123,89
8 Conclusion
It is established that the continuity of oil and gas production largely depends on the operation, maintenance and repair of wells, so there is a growing need for their special maintenance and repair, due to wear and tear of operating equipment and the need for special measures to protect the subsoil. Work on repair service of wells involves current repairs and overhauls of wells and care of the operational equipment in the period between the next repairs.
The model of organizing repair works at oil and gas companies has been developed, and its implementation ensures the optimization and prediction of the costs of maintaining repair crews and the reduction of losses from well downtime. Well repair by repair crews is considered as a multichannel queuing system in which the flow of service requests is the flow of repair applications. The maintenance procedure consists in the use of a repair crew according to the application, which is considered completed after the completion of the work of this crew at the facility, and the order of satisfying applications is carried out in the order they are received.
The practical implementation of the proposed models is carried out on the example of the organization of repair work for oil and gas companies OGPE “Dolynaftogaz”, OGPE “Borislavnaftogaz” and OGPE “Nadvirnaftogaz” and confirmed the feasibility of using the methods of queuing in decision-making on the organization and management of repairs. It is established that the increase in the number and intensity of equipment failures requires an increase in the number of repair crews. However, such an increase is not always advisable, since the costs of maintaining the crews begin to exceed the losses from the downtime of the wells.
References
1. Barkalova, T.G., Kokotkina, T.N., Tsaregorodtsev, E.I.: Challenges and Opportunities of Using Simulation Models in Forecasting Socio-economic. Development of the Region International journal of environmental & science education 11(17), 10661–10671 (2016)

124
2. Boiko, V.S.: Pidzemnyi remont sverdlovyn. Ivano-Frankivsk (2011) 3. Brumar, B.A.: Modeling and simulation of economic processes. Studies and Scientific
Researches - Economic Edition 15, 322–328 (2010). doi:10.29358/sceco.v0i15.135 4. Fabianova, J., Kacmary, P., Janekova, J.: Operative production planning utilising
quantitative forecasting and Monte Carlo simulations. Open Engineering. 9(1), 613-622 (2019). doi:10.1515/eng-2019-0071
5. Gansterer, M., Almeder, C., Hartl, R.F.: Simulation-based optimization methods for setting production planning parameters. International Journal of Production Economics 151, 206–213 (2014). doi:10.1016/j.ijpe.2013.10.016
6. Haugg, I.G., Frantz, R.Z., Roos-Frantz, F., Sawickie, S., Zucolotto, B.: Towards optimisation of the number of threads in the integration platform engines using simulation models based on queueing theory. Revista Brasileira de Computação Aplicada 11(1), 48–58 (2019). doi:10.5335/rbca.v11i1.8784
7. Hobyr, I., Babenko, V., Savko, O., Bui, Yu.: Optimization of arranging of repair works at oil and gas enterprises through use of simulation modeling tools. Advances in Economics, Business and Management Research 99, 183–188 (2019). doi:10.2991/mdsmes-19.2019.35
8. Khan, R., Mad, A.B., Osman, K. Aziz, M.A.A.: Maintenance Management of Aging Oil and Gas Facilities. In: Márquez, F.P.G. (ed.): Maintenance Management. InTechOpen, London (2019). doi:10.5772/intechopen.82841
9. Khvostina, I., Havadzyn, N., Horal, L., Yurchenko, N.: Emergent Properties Manifestation in the Risk Assessment of Oil and Gas Companies. CEUR Workshop Proceedings 2422,157–168 (2019)
10. Liu, R., Xie, X., Yu, K., Hu, Q.: A survey on simulation optimization for the manufacturing system operation. International Journal of Modelling and Simulation. 38(2), 116-127(2018). doi:10.1080/02286203.2017.1401418
11. Mazur, I.M.: Mekhanizm zabezpechennia ekonomichnoi efektyvnosti funktsionuvannia naftohazovydobuvnykh pidpryiemstv. Ivano-Frankivsk (2011)
12. Oliveira, J.B., Jin, M., Lima, R.S., Kobza, J.E., Montevechi, J.A.B.: The role of simulation and optimization methods in supply chain risk management: Performance and review standpoints. Simulation Modelling Practice and Theory 92, 17-44 (2019). doi:10.1016/j.simpat.2018.11.007
13. Olose, E.O.: Effective Maintenance and Reliability Program in the Production of Crude Oil and Natural Gas. International Journal of Scientific & Engineering Research 7(2), 1048–1056 (2016)
14. Pererva, P.G., Pogorelov, I.N.: Issledovanie sistem massovogo obsluzhivaniya dlya obespecheniya bezpereboynoy rabotyi oborudovaniya na predpriyatiyah. Visnyk Nacionalnogo texnichnogo universytetu “XPI” 8, 187–191 (2011)
15. Saad, S.M., Elsaghier, E.H., Ezaga, D.: Planning and optimising petroleum supply chain.Procedia Manufacturing 17, 803–810 (2018). doi:10.1016/j.promfg.2018.10.131
16. Shanmugasundaram, S., Umarani, P.: Queuing theory applied in our day to day life. International Journal of Scientific & Engineering Research 6(4), 533–541 (2015)
17. Standart orhanizatsii Ukrainy 11.2-30019775-168:2010. Sverdlovyny na naftu i haz. Potochnyi ta kapitalnyi remont sverdlovyn. Klasyfikator robit ta poriadok yikh provedennia (2010)
18. Winkowski, C.: Classification of forecasting methods in production engineering. Engineering Management in Production and Services 11(4), 23–33 (2019). doi:10.2478/emj-2019-0030