use of satellite sar data for seismic risk … et al x envisat...use of satellite sar data for...
TRANSCRIPT

USE OF SATELLITE SAR DATA FOR SEISMIC RISK MANAGEMENT: RESULTS
FROM THE PRE-OPERATIONAL ASI-SIGRIS PROJECT
Stefano Salvi
(1), Stefano Vignoli
(2), Simona Zoffoli
(3), Vittorio Bosi
(4)
(1)Istituto Nazionale di Geofisica e Vulcanologia, Roma, Italy - [email protected]
(2)Advanced Computer Systems srl, Roma, Italy - [email protected]
(3)Agenzia Spaziale Italiana, Roma, Italy - [email protected]
(4)Dipartimento della Protezione Civile, Roma, Italy - [email protected]
ABSTRACT
The scope of the SIGRIS pilot project is the
development of an infrastructure to provide value-added
information services for the seismic risk management,
assuring a close integration between ground-based and
satellite Earth Observation data. The project is presently
in the demonstration phase, and various information
products are constantly generated and disseminated to
the main user, the Italian Civil Protection Department.
We show some examples of the products generated
during the Crisis management of the 2009 L’Aquila
earthquake in Central Italy. We also show an example
of products generated for the Knowledge and
Prevention service in support of the seismic hazard
assessment in the area of the Straits of Messina.
1. THE SIGRIS SYSTEM
The SIGRIS (Italian acronym for Earth Observation
System for Seismic Risk Management) pilot project was
funded by ASI in 2007 to develop an infrastructure to
demonstrate pre-operative services for the Seismic Risk
management. The system was devised and developed by
INGV (scientific coordination) and ACS (industrial
partner with project responsibility), and is operated by
INGV. Its only final user is the Civil Protection
Department (DPC) which is the Italian government
authority devoted to the coordination of all public
activities in the management of the Seismic Risk.
The SIGRIS system was conceived to provide either
Knowledge and Prevention (K&P) services and Crisis
Management (CM) services, in support of the related
civil protection activities.
The K&P service products are used to support the
seismic hazard assessment. They are generated with
relaxed time constraints (yearly update) and strict
accuracy requirements. The products generated for the
CM service require tight time constraints, and are
released in rapidly updated versions, to improve their
effectiveness in the generation of Crisis scenarios.
The SIGRIS system architecture is shown in Figure 1.
Its main components are:
1. The ARC (Archival) component, responsible for
storing and keeping track of all the data and
processing results handled by the system. At
present there is a capacity for 12 TBytes of
data/product results.
Figure 1 – The main components of the SIGRIS system
architecture
2. The PROC (Processing) component contains all
the processing modules and many general
processing functionalities within an encapsulated
environment. This is a dynamic component, since
the continuous research and algorithm
development generates periodic updates of the
processing modules.
3. The MMI (SIGRIS MMI), component contains
the Man Machine Interfaces exported by the
SIGRIS system. The main interface for product
generation and management is based on a GIS
platform (ESRI products) from which the operator
can manage most of the system functionalities and
processing modules, most of which written in IDL,
Matlab, Fortran.
4. The GVT (GIS Validation Tool) component
provides the system with several specialized plug-
ins (user- defined validation tools) and
functionalities in order to validate the product
results.
5. The DIS (Dissemination) component is
responsible for providing validated output results
to the final user (DPC). The DIS component is
based on a Web GIS system, developed according
to the Open GIS communication protocols
(WMS/WFS OGC protocols).
At present the SIGRIS system is able to generate 10
value added products.
For the Knowledge & Prevention service some products
are, for example:
o Maps of low-rate ground deformation at the fault
scale, to evidence the state of stress of the crust in
a region. For this product we use time series
Differential SAR Interferometry techniques: PS-
InSAR [1], SBAS [2] and CGPS data.
o Regional crustal strain rate maps from CGPS
data.
o Based on the previous two products, we generate
a further, value-added product: models of strain
accumulation on large active faults, and their
parameterization for seismic hazard assessment.
Quasi real-time products to be generated for the Crisis
service are:
o Maps of the co-seismic ground displacement
field, generated using satellite SAR data in
different wavelengths, and ground surveys (GPS,
leveling, geological analysis).
o Parameterization of the seismic dislocations
through inversion modeling of DInSAR and
seismological data.
o Early assessment maps of the environmental
effects of large earthquakes, from high resolution
optical and SAR data.
o Early damage assessment maps for urban areas
struck by large earthquakes, from high resolution
optical and SAR data.
o Maps of post-seismic deformation and stress
transfer induced by large earthquakes, using
continuous and frequent monitoring based on
SAR and CGPS data.
SIGRIS is aimed at promoting a better integration of
remote sensing data into the decision chain of
operational Seismic Risk management. The partnership
ensures that such integration can be pursued efficiently:
INGV is already maintaining and managing on
assignment for DPC, a real time seismic surveillance
system based on seismic, geodetic, geochemical ground
networks. In fact the SIGRIS GIS interface provides a
common platform for the integration and cross-
comparison of satellite and ground data sets, which are
jointly analyzed using state-of-the-art signal processing
algorithms and geophysical modeling techniques.
Continuous research activities are also a fundamental
asset in SIGRIS, necessary to update and improve either
the algorithms for geophysical data extraction and those
for the numerical modeling.
2. SIGRIS EO data
The EO data used for the SIGRIS services are: high
resolution optical imagery from EROS B, QuickBird,
GeoEye, WorldView; SAR data from ERS, ENVISAT,
ALOS, COSMO-SkyMed. The latter are the preferred
data for the Crisis service, given the short revisiting and
delivering times. ERS/ENVISAT data are used also for
Crisis product, but, thanks to the long-dated archives,
they are more extensively employed for the analysis of
low rate deformations in the inter-seismic phase.
The COSMO-SkyMed constellation of 4 remote sensing
X-band SAR satellites (3 already in orbit) was devised
to provide near-real time, all-weather, accurate
information for both military and civilian use [3]. Its
main civilian applications concern the monitoring of
natural disasters and of their consequences on man
made structures and the environment. Interferometric
capabilities were not in the initial requirements of the
COSMO mission. Fortunately they were added later,
and now the COSMO short revisiting interval (down to
few hours), high spatial resolution (1-3 m) and extreme
manoeuvreing flexibility (left-right looking, 20°-59°
incidence angle), make for the best available InSAR
data set for disaster management applications.
3. SIGRIS DEMONSTRATION: EXAMPLES
The release of the first version of the SIGRIS system
was due for mid-July 2009, after which the
demonstration phase would commence.
So, when a magnitude Mw=6.3 earthquake hit Central
Italy and the L’Aquila province, the SIGRIS system was
not completely qualified and operational, yet a large
effort was carried out to generate the SIGRIS
information products within their temporal and accuracy
constraints.
Now the system is fully operational and demonstration
of its performances is ongoing. We present in the
following sections some examples of SIGRIS products
generated and released to the user (DPC).
3.1. The L’Aquila earthquake Crisis
The Mw=6.3 L’Aquila earthquake occurred on April 6,
2009, at 03:32 local time. At 05:00 SIGRIS issued
requests to ASI, ESA, and some commercial optical
data providers for image acquisition over the epicentral
area.
The first COSMO-SkyMed image was acquired on
April 6 at 17:30, but had no matching pre-seismic
image. The first interferogram could be generated with
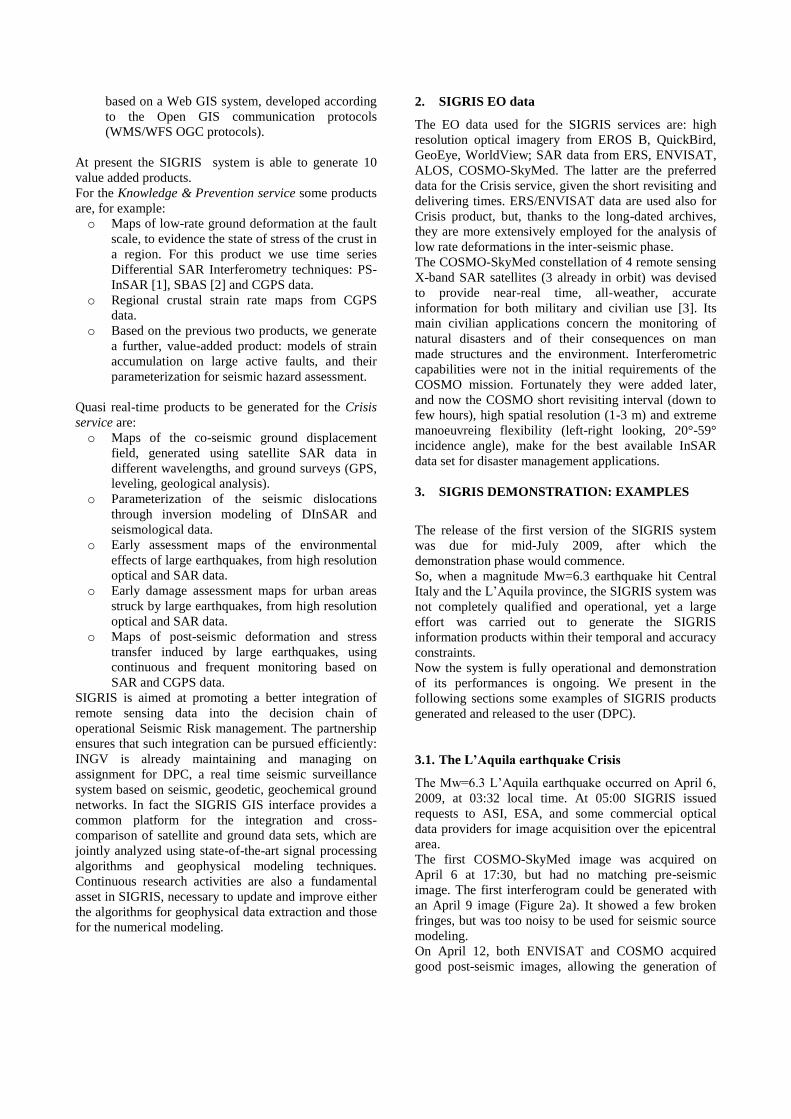
an April 9 image (Figure 2a). It showed a few broken
fringes, but was too noisy to be used for seismic source
modeling.
On April 12, both ENVISAT and COSMO acquired
good post-seismic images, allowing the generation of
very coherent interferograms, showing the full co-
seismic displacement field (Figure 2b,c). The data were
received with 1-day and 3-day delays, respectively, and
were disseminated shortly after to the Civil Protection.
Figure 2 – The first SIGRIS products generated for the
L’Aquila earthquake crisis: a) 19/2/2009-9/4/2009
COSMO interferogram, b) 27/04/2008-12/04/2009
ENVISAT interferogram, c) 4/04/2009-12/04/2009
COSMO interferogram.
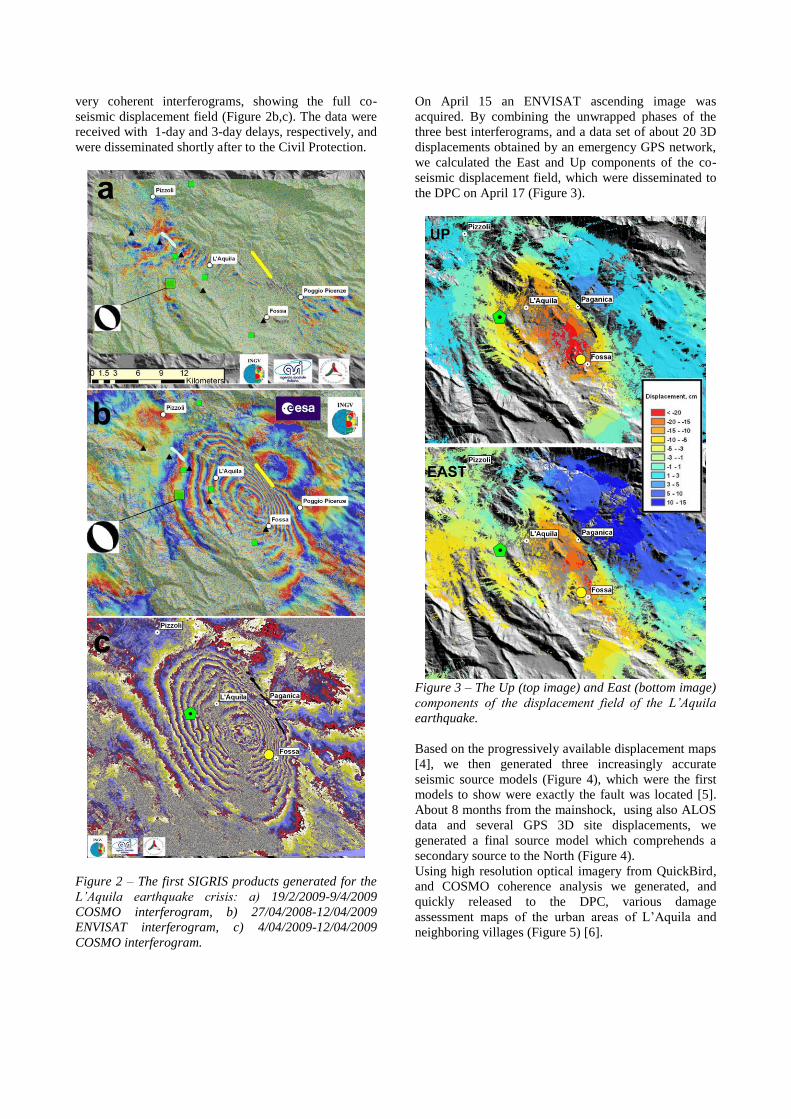
On April 15 an ENVISAT ascending image was
acquired. By combining the unwrapped phases of the
three best interferograms, and a data set of about 20 3D
displacements obtained by an emergency GPS network,
we calculated the East and Up components of the co-
seismic displacement field, which were disseminated to
the DPC on April 17 (Figure 3).
Figure 3 – The Up (top image) and East (bottom image)
components of the displacement field of the L’Aquila
earthquake.
Based on the progressively available displacement maps
[4], we then generated three increasingly accurate
seismic source models (Figure 4), which were the first
models to show were exactly the fault was located [5].
About 8 months from the mainshock, using also ALOS
data and several GPS 3D site displacements, we
generated a final source model which comprehends a
secondary source to the North (Figure 4).
Using high resolution optical imagery from QuickBird,
and COSMO coherence analysis we generated, and
quickly released to the DPC, various damage
assessment maps of the urban areas of L’Aquila and
neighboring villages (Figure 5) [6].
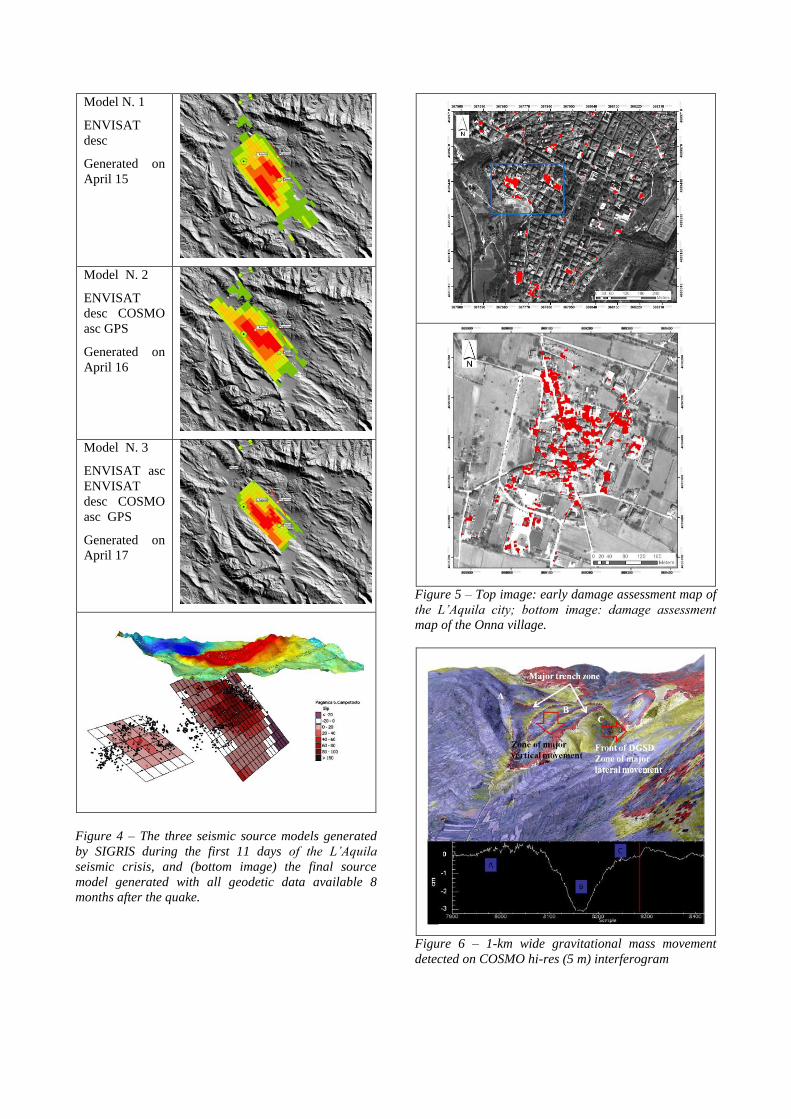
Model N. 1
ENVISAT
desc
Generated on
April 15
Model N. 2
ENVISAT
desc COSMO
asc GPS
Generated on
April 16
Model N. 3
ENVISAT asc
ENVISAT
desc COSMO
asc GPS
Generated on
April 17
Figure 4 – The three seismic source models generated
by SIGRIS during the first 11 days of the L’Aquila
seismic crisis, and (bottom image) the final source
model generated with all geodetic data available 8
months after the quake.
Figure 5 – Top image: early damage assessment map of
the L’Aquila city; bottom image: damage assessment
map of the Onna village.
Figure 6 – 1-km wide gravitational mass movement
detected on COSMO hi-res (5 m) interferogram
Finally, using the 5 m resolution COSMO
interferogram, EROS B stereo pairs, and field
geological analysis, we generated maps showing the
location and main descriptive parameters of large
gravitational mass movements triggered by the quake
(Figure 6).
3.2. Assessment of strain accumulation on active
faults
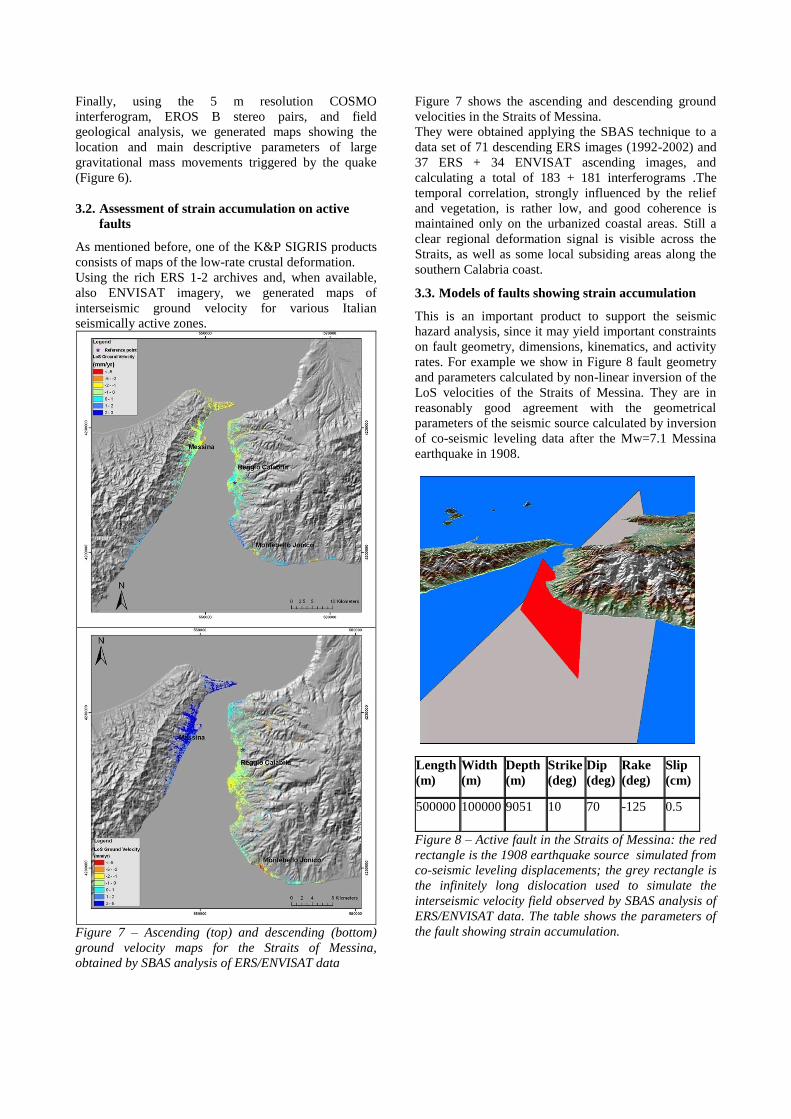
As mentioned before, one of the K&P SIGRIS products
consists of maps of the low-rate crustal deformation.
Using the rich ERS 1-2 archives and, when available,
also ENVISAT imagery, we generated maps of
interseismic ground velocity for various Italian
seismically active zones.
Figure 7 – Ascending (top) and descending (bottom)
ground velocity maps for the Straits of Messina,
obtained by SBAS analysis of ERS/ENVISAT data
Figure 7 shows the ascending and descending ground
velocities in the Straits of Messina.
They were obtained applying the SBAS technique to a
data set of 71 descending ERS images (1992-2002) and
37 ERS + 34 ENVISAT ascending images, and
calculating a total of 183 + 181 interferograms .The
temporal correlation, strongly influenced by the relief
and vegetation, is rather low, and good coherence is
maintained only on the urbanized coastal areas. Still a
clear regional deformation signal is visible across the
Straits, as well as some local subsiding areas along the
southern Calabria coast.
3.3. Models of faults showing strain accumulation
This is an important product to support the seismic
hazard analysis, since it may yield important constraints
on fault geometry, dimensions, kinematics, and activity
rates. For example we show in Figure 8 fault geometry
and parameters calculated by non-linear inversion of the
LoS velocities of the Straits of Messina. They are in
reasonably good agreement with the geometrical
parameters of the seismic source calculated by inversion
of co-seismic leveling data after the Mw=7.1 Messina
earthquake in 1908.
Length
(m)
Width
(m)
Depth
(m)
Strike
(deg)
Dip
(deg)
Rake
(deg)
Slip
(cm)
500000 100000 9051 10 70 -125 0.5
Figure 8 – Active fault in the Straits of Messina: the red
rectangle is the 1908 earthquake source simulated from
co-seismic leveling displacements; the grey rectangle is
the infinitely long dislocation used to simulate the
interseismic velocity field observed by SBAS analysis of
ERS/ENVISAT data. The table shows the parameters of
the fault showing strain accumulation.

Figure 9 – Top image: observed ascending velocities in
the Straits of Messina. Bottom image: interseismic
velocity field simulated by the model dislocation in
Figure 8.
Considering the uncertainties in the location of the
sources, we an attribute the observed DInSAR velocities
(see Figure 9) to stable slip occurring on the deeper part
(below 9-km depth) of the 1908 seismic dislocation.
4. CONCLUSIONS
During the L'Aquila seismic crisis the SIGRIS system,
although not yet qualified, responded rapidly and well,
and the main products for the seismic Crisis were
delivered within a 5-10 day timeframe.
The main delays in product generation were caused by
slow access to the EO data, due to either deferred
acquisition (for optical imagery) and the lack of an
urgent data production and delivery procedure.
The ongoing demonstration of the SIGRIS system is
showing that the effective operational use of satellite
data for the management of the seismic risk is feasible,
with some limitations mainly arising from the lack of
satellite systems specifically devised for this task.
The main issues in this respect concern the
compromises among frequency band, temporal
decorrelation, revisit time, spatial, and displacement
resolutions, which force the monitoring strategy to rely
on a multi-sensor approach. To be effective, this
strategy must be implemented in close coordination
between system operators (usually public scientific
community with a role in operational seismic risk
management), and the data providers (space agencies or
commercial providers).
5. ACKNOWLEDGEMENTS
This SIGRIS project is funded by the Italian Space
Agency (ASI). ERS/ENVISAT data are obtained
through the European Space Agency within the
Category 1 project 5605. COSMO-SkyMed data are
obtained through ASI and the Italian Department of
Civil Protection.
We are obliged to all the SIGRIS team, composed by:
A. Antonioli, S.Atzori, M. Chini, C. Brunori, S.
Stramondo, C. Tolomei, E. Trasatti, C. Kyriakopoulos,
G. Pezzo, J.P. Merryman, V. Santacesaria, S. Perelli, G.
Fornaro, P. Berardino.
6. REFERENCES
1. Ferretti A., C. Prati, F. Rocca, Permanent Scatterers
in SAR Interferometry, IEEE Transaction on
Geoscience and Remote Sensing, 39, 1, 8-20, 2001.
2. Berardino, P., G. Fornaro, R. Lanari, and E. Sansosti,
A new algorithm for surface deformation monitoring
based on small baseline differential SAR
interferograms, IEEE Trans. Geosci. Remote Sens.,
40 , 2375–2383, 2002
3. ASI, 2008, COSMO-SkyMed: Dual system for Earth
observation, http://www.cosmo-
skymed.it/en/index.htm
4. Stramondo S., M. Chini, C. Bignami, S. Salvi, S.
Atzori, X- C- L-Band DInSAR investigation of the
April 6th, 2009, Abruzzi earthquake. IEEE
Geoscience and Remote Sensing Letters,
doi:10.1109/LGRS.2010.2051015
5. Atzori, S., I. Hunstad, M. Chini, S. Salvi, C. Tolomei,
C. Bignami, S. Stramondo, E. Trasatti, A. Antonioli,
and E. Boschi (2009), Finite fault inversion of
DInSAR coseismic displacement of the 2009
L'Aquila earthquake (central Italy), Geophys. Res.
Lett., 36, L15305, doi:10.1029/2009GL039293.
6. Dell’Acqua F., C.Bignami, M. Chini, G. Lisini, D.
Polli, and S. Stramondo, Earthquake rapid mapping
by satellite remote sensing data: L’Aquila April 6th,
2009 event. Submitted to IEEE Journal of Selected
Topics in Applied Earth Observations and Remote
Sensing, 2010